
Abstract
Elevated brain water is a common finding in individuals with severe forms of altitude illness. However, the location, nature, and a causative link between brain edema and symptoms of acute mountain sickness such as headache remains unknown. We examined indices of brain white matter water mobility in 13 participants after 2 and 10 hours in normoxia (21% O2) and hypoxia (12% O2) using magnetic resonance imaging. Using a whole-brain analysis (tract-based spatial statistics (TBSS)), mean diffusivity was reduced in the left posterior hemisphere after 2 hours and globally reduced throughout cerebral white matter by 10 hours in hypoxia. However, no changes in T2 relaxation time (T2) or fractional anisotropy were observed. The TBSS identified an association between changes in mean diffusivity, fractional anisotropy, and T2 both supra and subtentorially after 2 and 10 hours, with headache score after 10 hours in hypoxia. Region of interest-based analyses generally confirmed these results. These data indicate that acute periods of hypoxemia cause a shift of water into the intracellular space within the cerebral white matter, whereas no evidence of brain edema (a volumetric enlargement) is identifiable. Furthermore, these changes in brain water mobility are related to the intensity of high-altitude headache.
INTRODUCTION
Prolonged hypoxia causes a number of pathologic symptoms including headache, nausea, fatigue, gastrointestinal discomfort, and sleep disturbances that are collectively known as acute mountain sickness. 1 In fact, some individuals have more serious neurologic symptoms including hallucinations, ataxia, and unconsciousness that in some cases can lead to death (high-altitude cerebral edema). 2 Both syndromes have been associated with alterations in brain water.2–4 However, although focal (splenium corpus callosum) vasogenic (extracellular) cerebral edema is commonly found in patients having high-altitude cerebral edema, 2 the location, nature, and causative link between brain edema and symptoms of acute mountain sickness are currently a subject of intense debate. 5
Early work examining the impact of hypoxia on brain edema and acute mountain sickness reported no change in brain water content on exposure to high altitude.6,7 However, recent magnetic resonance imaging studies using larger sample sizes or more sensitive techniques (using higher magnetic fields) have identified the presence of vasogenic (extracellular) edema and intracellular swelling after 6 hours 4 and 16 hours 3 of exposure to simulated high altitude (4,500 m). More specifically, these investigators report an inverse correlation between apparent diffusion coefficient (ADC, a marker of water mobility whereby a decrease would indicate intracellular swelling) and acute mountain sickness, which was interpreted as evidence for the involvement of intracellular swelling in the development of acute mountain sickness.
Despite advancing our understanding of cerebral edema during periods of hypoxemia and acute mountain sickness, critical analysis of both these studies is warranted. First, although Schoonman
In addition, all previous investigations examined indices of brain edema in established acute mountain sickness, which makes a causative link between brain edema and illness difficult to determine. Also, on a methodological note, previous studies have predominantly focused on manually drawn prespecified and prelocalized regions or features of interest to determine the location of brain edema and used the ADC in combination with T2-weighted images to indicate intracellular swelling. Manually drawn regions of interest are favorable for a hypothesis-driven analysis and increased statistical power but they are subject to human error and do not investigate the whole brain. Furthermore, the ADC represents a single average diffusion coefficient, which is overly simplistic when examining anisotropic diffusion as occurs within brain white matter. 9 A more detailed approach to examine brain tissue microstructure throughout the whole brain is therefore warranted.
Recent advances in neuroimaging techniques such as diffusion tensor imaging allow the investigation of brain water mobility within three-dimensional space. This concept is important, as water mobility within tissues is not necessarily the same in all directions. Diffusion tensor imaging data can be analyzed in a number of ways to reveal intricacies in brain water mobility. For example, the diffusion parameters calculated by tensor techniques can be used to describe ellipsoids, with the mean diffusivity characterizing the average ellipsoid size at each imaging voxel, which is independent of tissue directionality but dependent on cellular size and integrity and the location of water molecules being measured (analogous to the ADC), whereas fractional anisotropy describes the degree of diffusion anisotropy within space (the higher the anisotropy, the more eccentric the ellipsoid) and thus reflects tissue structural arrangement and integrity.
Movement of water from the extracellular space to the intracellular space would be expected to decrease mean diffusivity and increase fractional anisotropy, because of the more restricted and anisotropic diffusion environment found intracellularly. Vice versa, movement of water out of the cells would lead to a decrease in fractional anisotropy and an increase in mean diffusivity. However, only together with an increase in T2 relaxation time (T2) would changes in these indices indicate an increase in brain water (edema) rather than water redistribution within the brain. Importantly, each diffusion tensor imaging index can be analyzed using a region of interest analysis and whole-brain approach via tract-based spatial statistics (TBSS). Therefore, the characterization and severity of altered brain water mobility can be examined with exposure to hypoxia and in individuals who report symptoms of acute mountain sickness.
As such, this study aimed to examine brain water mobility and content after exposure to 2 and 10 hours of hypoxia (12% O2). Subsequently, we explored the relationship between the development of a specific acute mountain sickness symptom, headache, with changes in brain water mobility and content after 2 hours (presymptomatic) and 10 hours (symptomatic) in hypoxia. Given the lack of molecular evidence for breakdown of the blood–brain barrier in hypoxia,10,11 but evidence for the accumulation of both extracellular and intracellular water,3,4,8 we hypothesized that early hypoxia (2 hours) will be characterized by a reduction in mean diffusivity and increased fractional anisotropy but no change in T2 in line with a fluid shift into the intracellular space. In contrast, more prolonged hypoxia (10 hours) will be associated with reduced mean diffusivity but increased fractional anisotropy and T2, which would suggest an increase in brain edema. Finally, we hypothesized that the increase in intracellular swelling after 2 hours and the osmotically obligated development of brain edema after 10 hours will be related to headache intensity after 10 hours by its expected effect on increasing brain volume and likely intracranial pressure.
MATERIALS AND METHODS
Participants
A total of 13 males (age = 26 (s.d. 6) years; body mass = 77 (s.d. 12) kg; height = 182 (s.d. 9) cm) volunteered to take part in this study. Informed consent was obtained after each participant was given an explanation of the experimental protocol and fully understood the possible risks involved in taking part in the study. Exclusion criteria were any clinically diagnosed primary headache disorder and ascent to altitude above 1,500 m in the previous 6 months. This study was approved by the Institutional Ethics Committee and conformed to the Declaration of Helsinki (2008).
Experimental Design
Participants reported to the laboratory at 0700 hours on two separate occasions separated by at least 5 days. Participants were asked to refrain from alcohol consumption and exhaustive exercise for a period of 48 hours before each visit. Furthermore, in the 24 hours before and during each testing session, participants were instructed to drink 40 mL/kg of water to maintain an adequate hydration, and were instructed to consume an
Each trial consisted of a 10-hour exposure to normobaric normoxia (21% O2) or normobaric hypoxia (12% O2) in a temperature-(23°C) and humidity (40%)-controlled environmental chamber. Participants were assigned to each exposure in a randomized order (http://www.randomization.com) and were masked to the experimental conditions (hypoxia or normoxia). Participants underwent magnetic resonance imaging after 2 and 10 hours in both trials. Importantly, participants maintained breathing the appropriate experimental gas (21% O2 or 12% O2) during transportation to and throughout the magnetic resonance imaging. All magnetic resonance imaging sequences were obtained after a 5-minute period of supine rest.
Cardiorespiratory Variables
Oxygen saturation and heart rate were monitored continuously in the environmental chamber (TM-2564GP; A&D Medical, San Jose, CA, USA) and brachial systolic and diastolic blood pressure measures were obtained in duplicate by an automated inflating cuff after 2 and 10 hours in the environmental chamber (TM-2564GP; A&D Medical). End-tidal carbon dioxide was sampled from the facemask during each magnetic resonance imaging session and analyzed by fast responding gas analyzer (I.R. gas analyzer, PA404; Servomex, Sussex, UK). Cardiovascular variables were compared using a 2 (time, 2 versus 10 hours) × 2 (altitude, normoxia versus hypoxia) repeated measures analysis of variance. Follow-up comparisons were conducted using Tukey's test.
Altitude Illness
Acute mountain sickness was recorded using the Lake Louise Questionnaire 12 and headache intensity was scored on a horizontal 0-100 mm line (visual analogue scale) with verbal anchors at opposing ends (none and severe13,14) after 2 and 10 hours in both trials. Participants were asked to place a mark on the 100 mm line at the point that they perceived reflected their current headache intensity. Acute mountain sickness and high-altitude headache were compared using a 2 (time, 2 versus 10 hours) × 2 (altitude, normoxia versus hypoxia) repeated measures analysis of variance. Follow-up comparisons were conducted using Tukey's test.
Magnetic Resonance Imaging Acquisition and Postprocessing
All magnetic resonance imaging sequences were conducted on a 3 tesla magnetic resonance imaging scanner (Phillips Achieva, Philips Healthcare, Eindhoven, The Netherlands) using a 16-channel head and neck coil. All imaging sequences were acquired with sensitivity encoding for fast magnetic resonance imaging (SENSE).
Acquisitions
Postprocessing
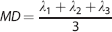
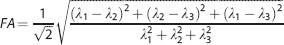
Initially, diffusion tensor imaging images were processed using TBSS, part of FSL 4.1.9 (FMRIB, Oxford, UK). 15 Using the Diffusion Toolbox (FDT v2.0, FMRIB), each diffusion-weighted volume was affine-aligned to its corresponding b0 image to correct possible motion artifacts and eddy current distortion. Subsequently, each eigenvector and eigenvalue (λ1, λ2, and λ3) was generated using the DTIfit algorithm (FMRIB). The separate eigenvalues were used to calculate mean diffusivity (MD; Equation (1)) and fractional anisotropy (FA; Equation (2)).
To create a fractional anisotropy skeleton for both region of interest and voxel-wise analysis, a study-specific target image was initially identified by nonlinearly registering all participants and time points to one another. Subsequently, this representative image was affine-aligned to the MNI152 standard space and every image transformed to the 1 × 1x 1 mm target MNI152 space. The mean fractional anisotropy skeleton was then thresholded to fractional anisotropy of ≥ 0.2 to include major white matter tracts but exclude peripheral and intersecting tracts and the possibility of partial volume effects. Finally, the mean diffusivity and T2 calculated images were nonlinearly registered to the original fractional anisotropy skeleton. It is noteworthy that one participant was removed from the investigation after the first 2 hours of magnetic resonance imaging scanning session because of severe altitude illness and one participant's T2 image was considered to contain too much movement artifact for voxel-wise analysis. Thus, a total of 12 participants were retained for analysis of mean diffusivity and fractional anisotropy and 11 participants for statistical analysis of T2 using TBSS.
Tract-Based Spatial Statistics Analysis: Whole Brain
To examine the effect of hypoxia on brain water content and mobility across the whole brain, cross-subject voxel-wise statistical analysis of T2, mean diffusivity, and fractional anisotropy were carried out using TBSS,
15
part of FSL 4.1.9.
16
Permutation-based nonparametric paired
Region of Interest-Based Analysis: Mean of All Regions of Interest
Although TBSS examines the whole brain, a limitation is its conservative statistical approach because of the correction for family-wise error across all voxels. Thus, after applying the TBSS preprocessing steps above, the complementary traditional approach of drawing predefined regions of interests was undertaken. Predefined skeleton-based regions of interest were drawn for mean diffusivity and fractional anisotropy at each time point within the white matter of the frontal lobe, posterior white matter, centrum semiovale, genu and splenium of the corpus callosum, anterior limb of the internal capsule, and posterior cerebellar peduncle (Analyze-Direct, Overland Park, KS, USA; see Figure 1). The T2 images were transferred onto an offline workstation whereby the regions of interests were manually drawn for each time point. An investigator masked to the experimental conditions and altitude illness score drew all regions of interest. To assess overall change in brain white matter water mobility, the mean of all regions of interest (mROIs) were compared using a 2 (time, 2 versus 10 hours) × 2 (altitude, normoxia versus hypoxia) repeated measures analysis of variance. Follow-up comparisons were conducted using Tukey's test. The relationship between overall brain water mobility and high-altitude headache was then assessed by correlating the change in T2, mean diffusivity, and fractional anisotropy (using mROI) after 2 and 10 hours with high-altitude headache intensity after 10 hours by Pearson's
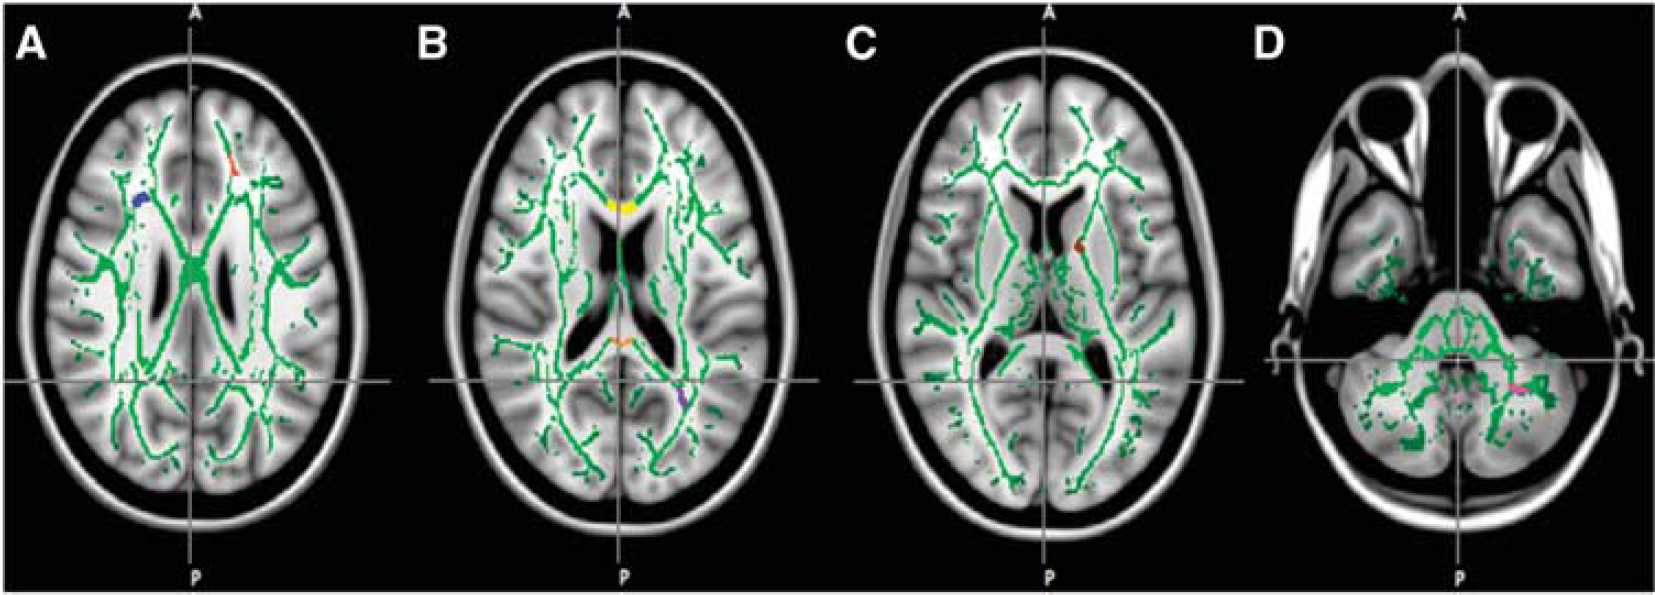
Representative masks for the skeletonized-based regions of interest overlaid on mean fractional anisotropy skeleton (green). Masks include frontal lobe white matter (red), centrum semiovale (blue, plate A), posterior white matter (purple), genu (yellow) and splenium of the corpus callosum (orange, plate B), anterior limb of the internal capsule (brown, plate C), and posterior cerebellar peduncle (magenta, plate D).
Region of Interest-Based Analysis: Specific Regions
To further aid in the interpretation of the above analyses, exploratory paired
Values are means and s.d. and all statistical procedures were carried out on SPSS version 19 for Macintosh (Statistical Package for Social Sciences, IBM, Chicago, IL, USA). Statistical significance was accepted when
RESULTS
Cardiorespiratory and Illness Responses to Altitude
As expected, exposure to hypoxia decreased oxygen saturation (main effect of altitude, F = 644.16,
Physiologic variables and altitude illness in normoxia and hypoxia
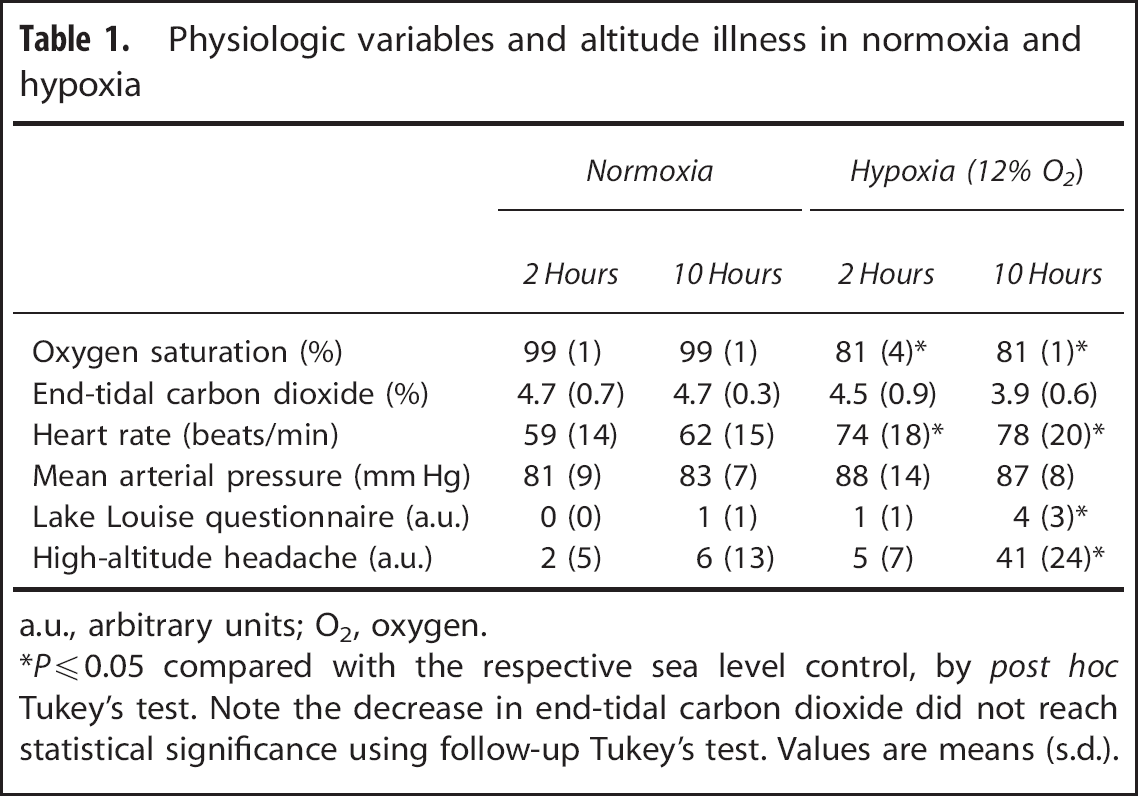
a.u., arbitrary units; O2, oxygen.
*
Tract-Based Spatial Statistics Analysis: Whole Brain
When examining the impact of hypoxia on brain water mobility across the whole brain, voxel-wise analysis using TBSS revealed a significant reduction in mean diffusivity throughout the left posterior hemisphere after 2 hours in hypoxia. Furthermore, after 10 hours in hypoxia, TBSS identified extensive reductions in mean diffusivity supratentorially throughout the cerebral white matter (see Figure 2). In contrast, no significant differences in T2 or fractional anisotropy were observed at either time point using this technique.
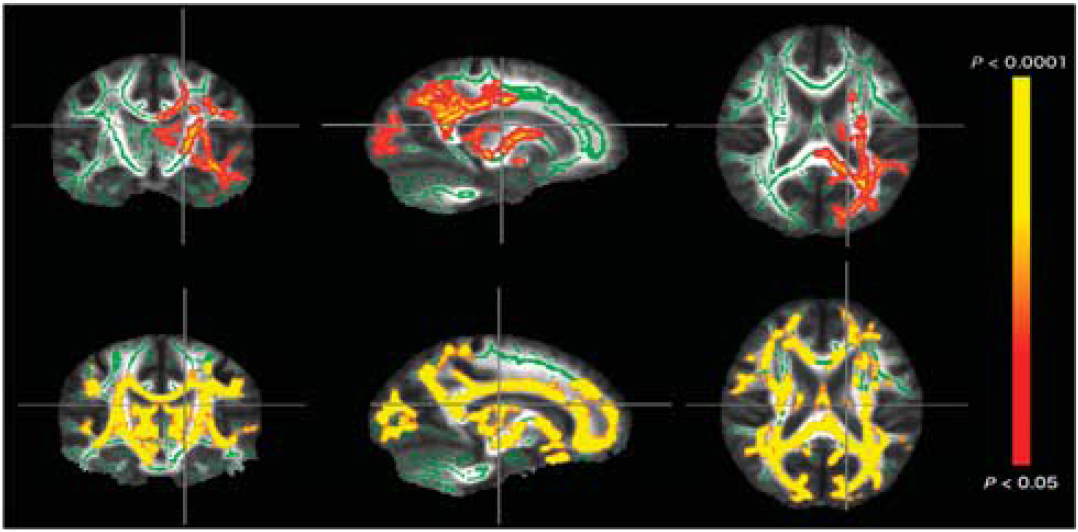
Voxel-wise, whole-brain analysis showing decreased mean diffusivity after 2 hours (upper panel) and 10 hours (lower panel) of exposure to 12% oxygen (O2). Significance maps (red-yellow, corrected
Region of Interest-Based Analysis: Mean of All Regions of Interest
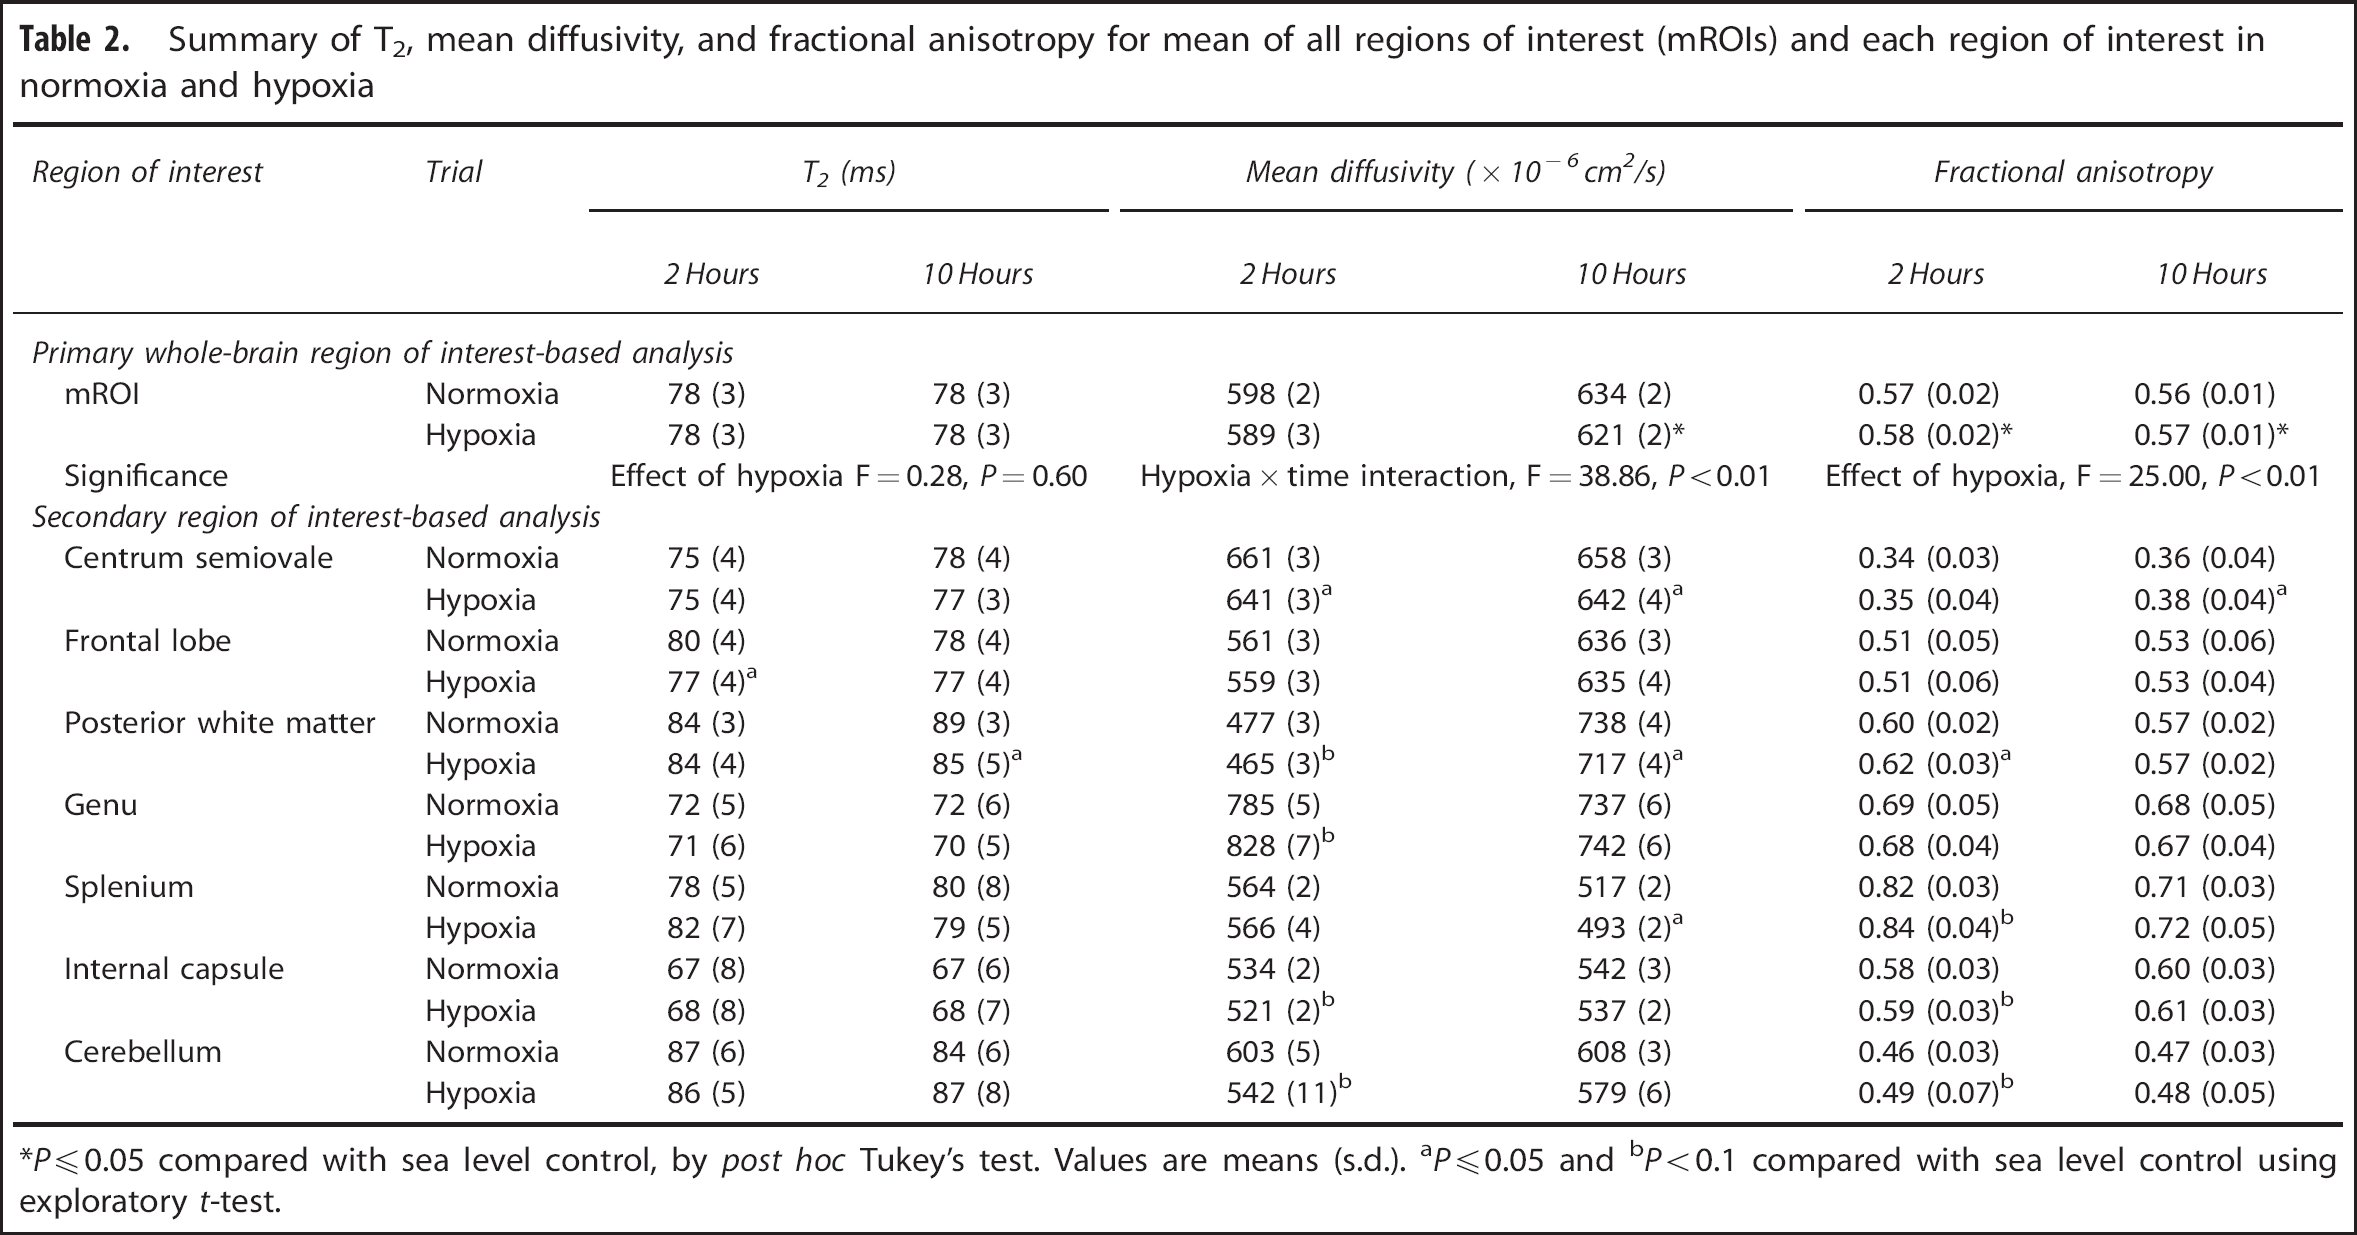
As shown in the upper panel of Table 2, using the mROI, hypoxia caused a global reduction in mean diffusivity after only 10 hours (altitude by time interaction, F = 38.86,
Summary of T2, mean diffusivity, and fractional anisotropy for mean of all regions of interest (mROIs) and each region of interest in normoxia and hypoxia
*
Region of Interest-Based Analysis: Specific Regions
As shown in Table 2, lower panel, of the regions of interest measured, exploratory
Relationship with High-Altitude Headache
Suggestive of intracellular involvement in altitude illness, voxel-wise statistical analysis of the whole brain revealed that T2, mean diffusivity, and fractional anisotropy after 2 hours (presymptomatic, see Figure 3) and 10 hours (symptomatic, see Figure 4) in hypoxia was correlated with the intensity of high-altitude headache experienced after 10 hours in hypoxia. Interestingly, altered areas of white matter water mobility were detected both supra- and subtentorially using this technique. Using the mROI identified a positive relationship between the change in T2 (r = 0.69,
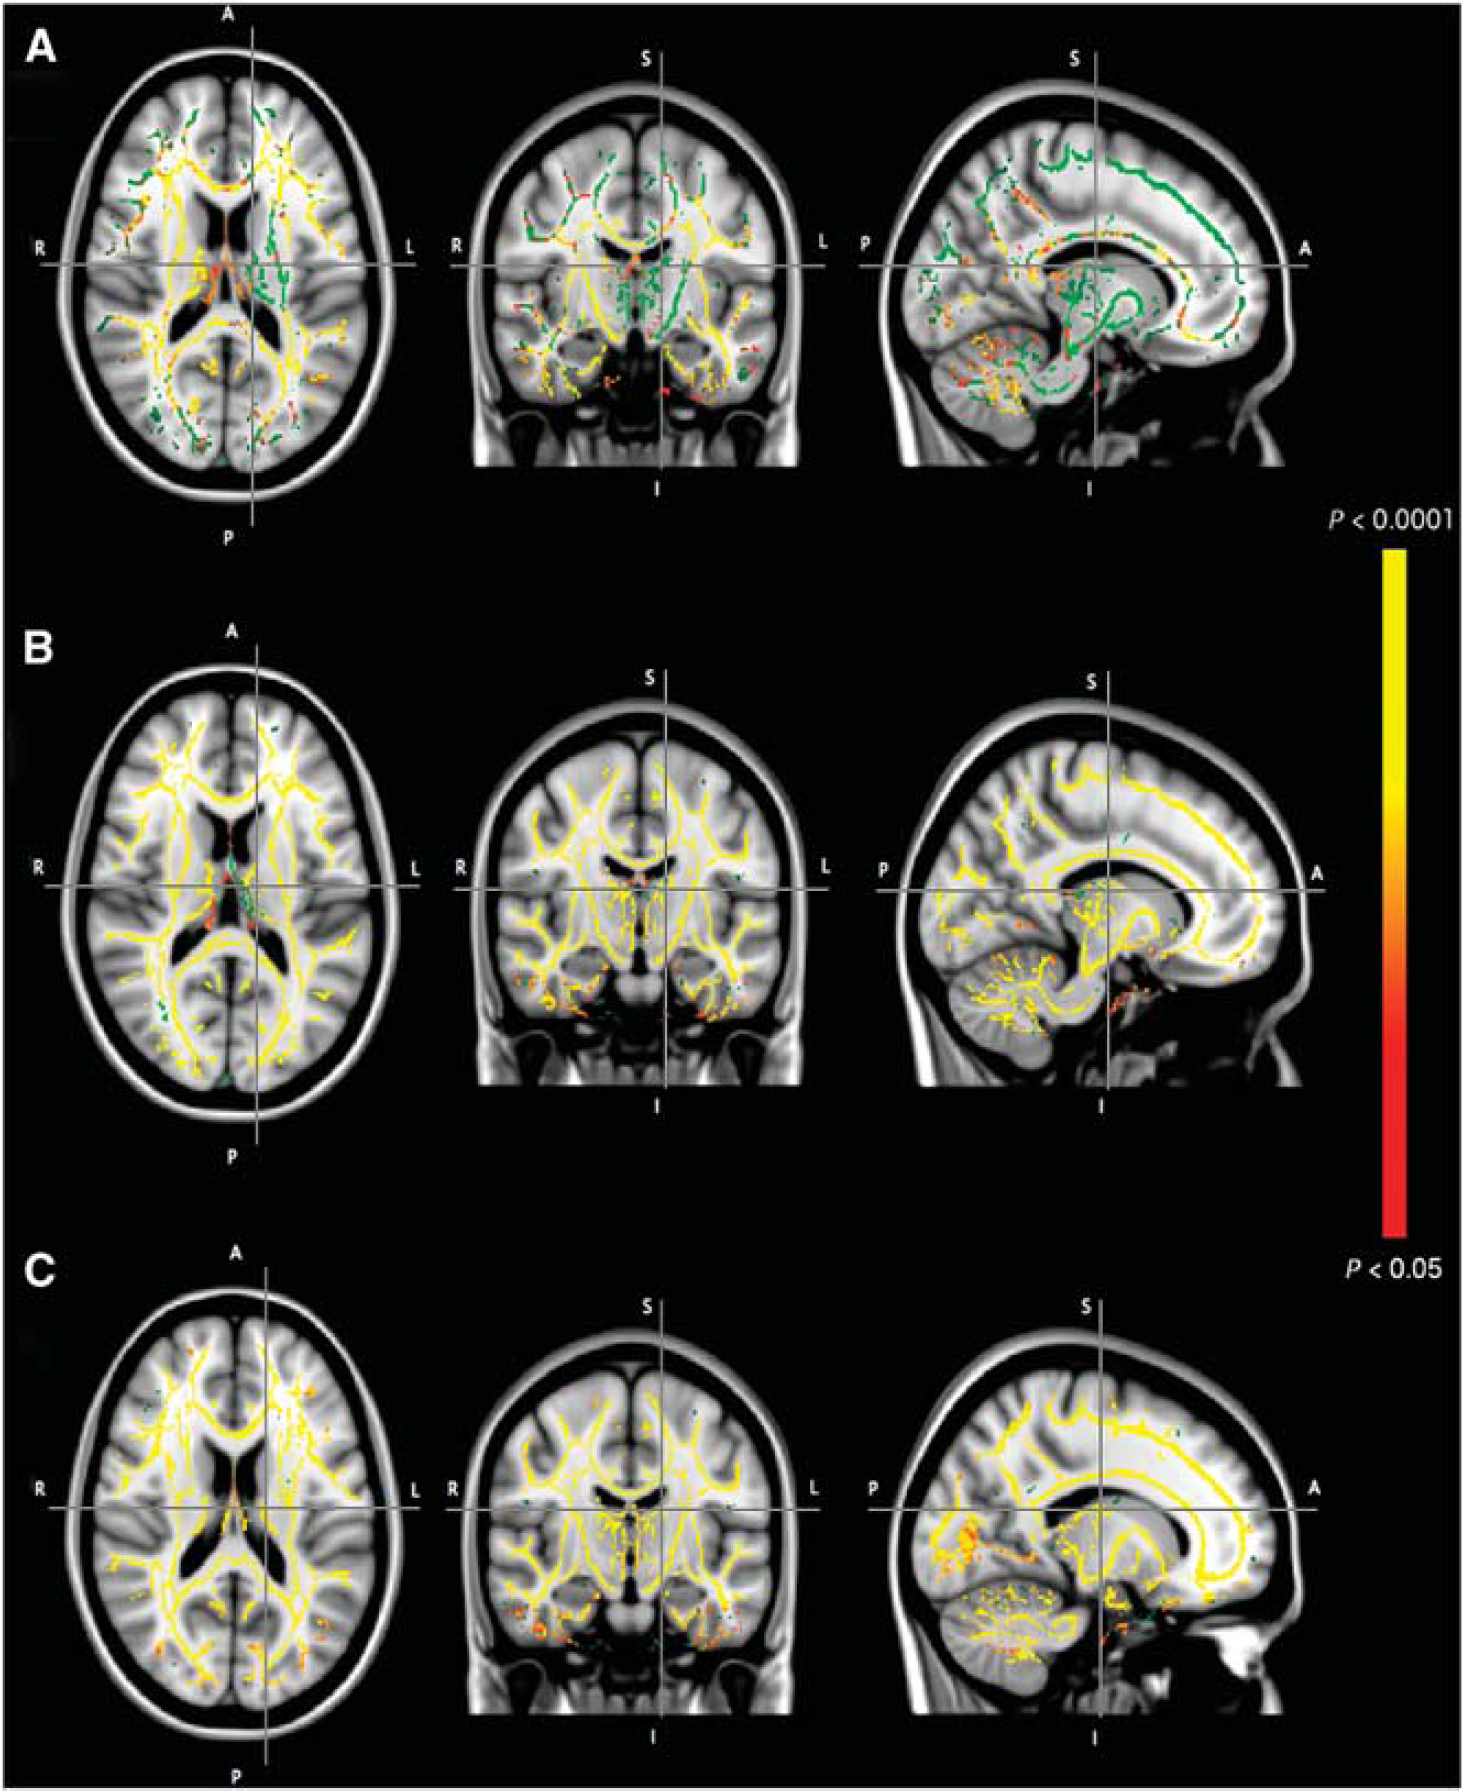
Voxel-wise statistical analysis of the relationship between T2 (top panel, A), mean diffusivity (middle panel, B), and fractional anisotropy (bottom panel, C) after 2 hours in hypoxia and headache score after 10 hours in hypoxia. Significance maps (red-yellow, corrected P≤0.05) are overlaid on the study-specific mean fractional anisotropy tract-based spatial statistics (TBSS) skeleton (green) and T1-weighted MNI152 standard image for identification of affected anatomy.
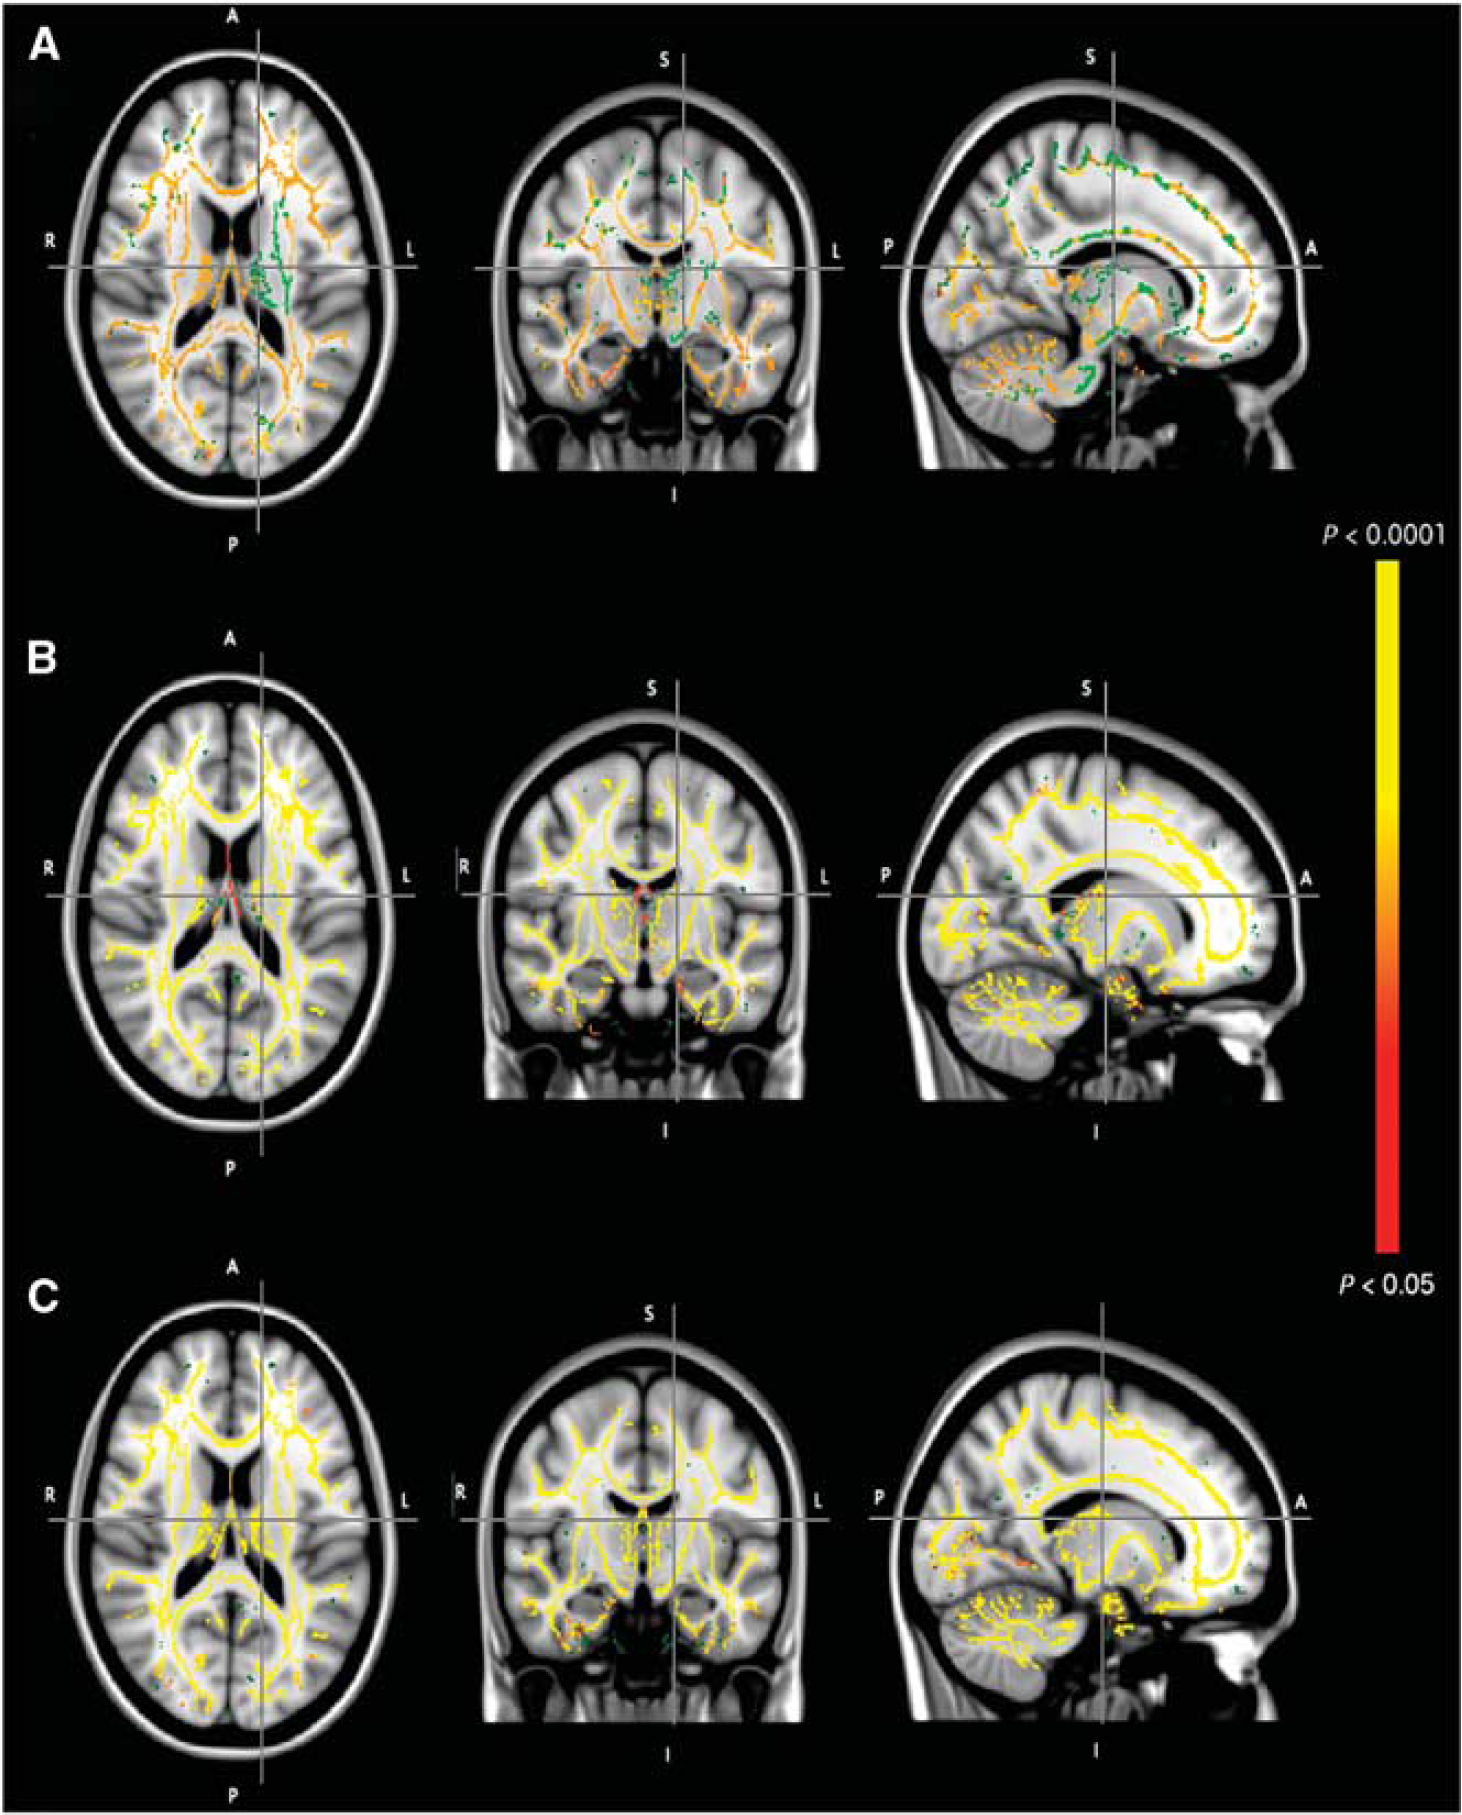
Voxel-wise statistical analysis of the relationship between T2 (top panel, A), mean diffusivity (middle panel, B) and fractional anisotropy (bottom panel, C) after 10 hours in hypoxia and headache score after 10 hours in hypoxia. Significance-maps (red-yellow, corrected P≤0.05) are overlaid on the study-specific mean fractional anisotropy tract-based spatial statistics (TBSS) skeleton (green) and T1-weighted MNI152 standard image for identification of affected anatomy.
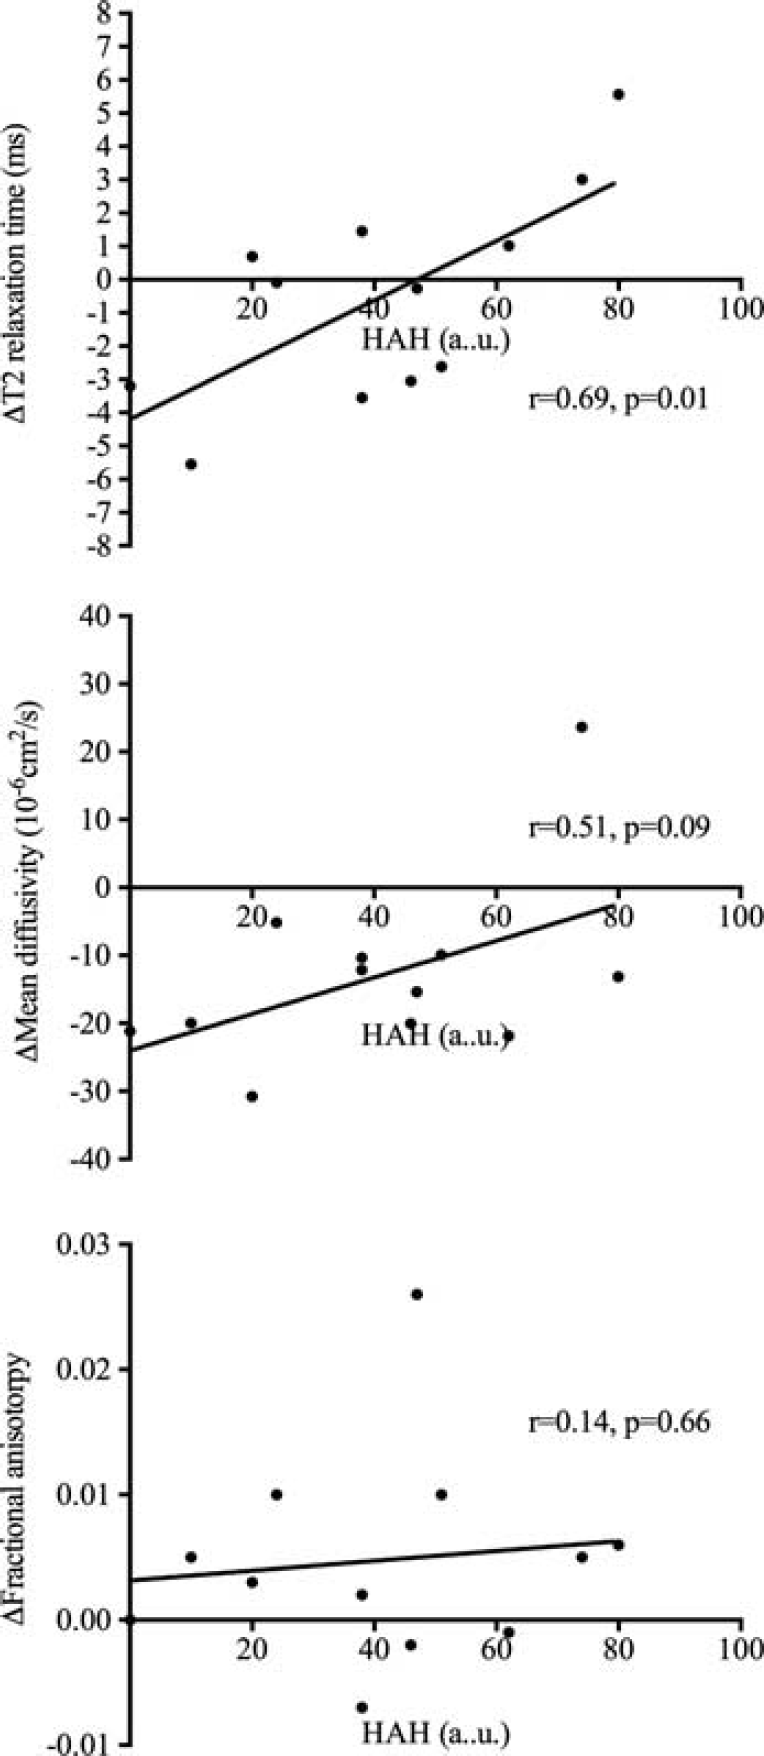
Relationship between the change in mROI of T2 (upper panel), mean diffusivity (middle panel), and fractional anisotropy (bottom panel) after 10 hours in hypoxia with headache intensity after 10 hours in hypoxia. a.u., arbitrary units; HAH, high-altitude headache; mROI, mean of all regions of interest.
Relationships with Oxygen Saturation and End-Tidal Carbon Dioxide
Tract-Based Spatial Statistics identified that the decrease in oxygen saturation after 2 hours in hypoxia was related to the level of intracellular swelling in some brain regions (mean diffusivity and fractional anisotropy) but not T2 after 2 hours in hypoxia (see Supplementary Figure S1). However, these relationships were not observed after 10 hours in hypoxia (see Supplementary Figure S2). Despite only a modest change in end-tidal carbon dioxide in some individuals, we did observe some brain regions where T2, mean diffusivity, and fractional anisotropy were related to end-tidal carbon dioxide tension after only 2 hours in hypoxia (see Supplementary Figure S3). Interestingly, despite the general decrease in end-tidal carbon dioxide in most subjects after 10 hours in hypoxia, these relationships were still apparent for mean diffusivity and fractional anisotropy, although not for T2 (see Supplementary Figure S4).
DISCUSSION
The present findings highlight for the first time that acute hypoxemia causes extensive alterations in cerebral white matter water mobility. Indeed, using a combination of whole brain and prospectively drawn region of interest analyses, these data identify that as early as 2 hours after the onset of arterial hypoxemia, intracellular white matter water mobility is reduced and is further compounded by a prolonged exposure to hypoxia.
The observed perturbations in brain water mobility are indicative of diffuse intracellular swelling and are related to the intensity of high-altitude headache experienced after 10 hours in a hypoxic environment.
Kallenberg
Despite using a similar sample size and high magnetic field (3 tesla), we were unable to detect a global increase in T2 using either TBSS or predefined regions of interest. Using exploratory
Using a combination of TBSS and ROI analyses, we identified that 2 hours in hypoxia caused a focal reduction in mean diffusivity within the posterior left hemisphere (TBSS) that propagated throughout cerebral white matter by 10 hours (using both TBSS and skeletonized regions of interest). After both 2 and 10 hours in hypoxia, concomitant increases in fractional anisotropy were also observed using a region of interest analysis. Thus, our data are the first to identify that acute hypoxia is actually associated with profound alterations in diffusion parameters that are suggestive of a redistribution of water to within the intracellular space of glia cells. Furthermore, these data identify similar locations of altered white matter water mobility as those observed previously in individuals after prolonged sojourns to high altitude8,17,18 and in individuals native to high altitude. 19 It should be mentioned that by directly calculating T2 and mean diffusivity, we avoided any potential confusion that ‘T2-shine through’ can cause on raw diffusion-weighted images. Our findings of no overt increases in T2 during hypoxia preclude the possibility of T2 shine through on the raw diffusion-weighted image, which normally occurs when there is an increase in T2 in the tissue.
As such, the contradictory observation in T2 between the current investigation and that of others
4
is likely attributable to other differences in measurement technique. For example, Schoonman
The lack of molecular evidence for breakdown of the blood–brain barrier in similar models to the current investigation10,11 and the accumulation of intracellular water identified herein, alongside extracellular edema identified previously,
4
hints toward the premorbid onset of regionally specific intracellular water. This may be followed by intracellular accumulation of osmotically active ions and a transcapillary flux of Na + in an attempt to rebalance extracellular ion homeostasis. Subsequently, an expansion of the extracellular space occurs (vasogenic edema), which is only observed with more prolonged or severe hypoxic exposure in conjunction with high-altitude cerebral edema. In opposition to this hypothesis, Hunt
Given that a central tenant of the intracellular swelling explanation is disruption of cellular membrane Na + /K + ATPase, it should be remembered that global increases in cerebral blood flow23,24 and maintained or increased global cerebral metabolic rate of oxygen11,25,26 have been observed. Thus, it is possible that the reduction in white matter water mobility as observed herein is the consequence of regionally reduced white matter blood flow and oxygen delivery because of transient or persistent elevations in intracranial pressure. A further alternative or complementary hypothesis is that white matter blood flow is reduced at the expense of increased gray matter perfusion, a so-called vascular steal phenomenon. Previous experiments have identified a paradoxical reduction in white matter blood flow during periods of hypercapnia in healthy individuals. 27 Whether such a mechanism exists to preserve gray matter blood flow and maintain neuronal activity during prolonged periods of hypoxemia and hypocapnia remains unknown. However, the observed relationships between oxygen saturation and more convincingly end-tidal carbon dioxide and indices of intracellular swelling do lend indirect support to this hypothesis. Nonetheless, future experiments directly evaluating white and gray matter perfusions over prolonged periods of hypoxia are required to substantiate this theory.
Using voxel-wise statistical analysis of the whole brain, we identified significant regional relationships between T2, mean diffusivity, and fractional anisotropy after 2 and 10 hours in hypoxia, and headache intensity after 10 hours in hypoxia. To the best of our knowledge, this is the first experiment showing that indices of brain water mobility during the hypoxic presymptomatic period are related to the subsequent development of headache after 10 hours in hypoxia. Indeed, this time series design provides convincing evidence of a relationship between early changes in white matter water mobility and acute altitude pathology.
However, close inspection of the data suggests that the relationship between white matter water mobility and high-altitude headache is complex. For example, when exploring the relationship between a global indicator of brain water mobility (mROI) and headache intensity, we were only able to identify a significant relationship between the change in T2 (alongside a similar trend for mean diffusivity) after 10 hours and headache score after 10 hours. This may, in part, be because of the mROI analysis using an average of all brain regions, even though some regions were unaffected by hypoxia. Furthermore, although the global increase in T2 and preservation of mean diffusivity were predominantly associated with severe cases of high-altitude headache (suggestive of brain edema), there were a number of individuals who had decreased T2 and mean diffusivity and yet they still reported headaches of a similar moderate intensity. This observation is strikingly similar to those obtained previously.3,4 Despite the complexity of these acute responses, prolonged exposures have also implicated intracellular swelling in the development of altitude illness. 8
A further major finding is that although hypoxia
Limitations of the current investigation include the examination of only white matter structures. Indeed, neurons exhibit a substantial energy turnover compared with glial and oligodendrocytes and thus may be more susceptible to periods of hypoxia.
2
Furthermore, the current investigation only identifies the short-term effects of hypoxia and predominantly comprises individuals having moderate to severe high-altitude headache. Future research should aim to explore the differences in brain water mobility between individuals with high-altitude headache and those entirely resistant. In addition, corticoidsteroids such as dexamethasone are an established prophylactic treatment for acute mountain sickness but predominantly affect vasogenic edema and not intracellular swelling.
30
Critical experimental investigations using corticoidsteroids are therefore required to further test the cause and effect relationship between intracellular swelling and altitude illness. A final limitation is the possibility of a type I error when using multiple exploratory
In conclusion, using a combination of whole-brain and region of interest-based analyses, this study is the first to report a significant widespread increase in white matter intracellular swelling without vasogenic edema during periods of acute hypoxia. Furthermore, these data suggest that changes in brain water mobility including areas such as the brain stem and cerebellum are related to the intensity of headache experienced in hypoxia.
DISCLOSURE/CONFLICT OF INTEREST
The authors declare no conflict of interest.
Footnotes
References
Supplementary Material
Please find the following supplemental material available below.
For Open Access articles published under a Creative Commons License, all supplemental material carries the same license as the article it is associated with.
For non-Open Access articles published, all supplemental material carries a non-exclusive license, and permission requests for re-use of supplemental material or any part of supplemental material shall be sent directly to the copyright owner as specified in the copyright notice associated with the article.