
Abstract
The partial pressure in oxygen remains challenging to map in the brain. Two main strategies exist to obtain surrogate measures of tissue oxygenation: the tissue saturation studied by magnetic resonance imaging (StO2-MRI) and the identification of hypoxia by a positron emission tomography (PET) biomarker with 3-[18F]fluoro-1-(2-nitro-1-imidazolyl)-2-propanol ([18F]-FMISO) as the leading radiopharmaceutical. Nonetheless, a formal validation of StO2-MRI against FMISO-PET has not been performed. The objective of our studies was to compare the two approaches in (a) the normal rat brain when the rats were submitted to hypoxemia; (b) animals implanted with four tumour types differentiated by their oxygenation. Rats were submitted to normoxic and hypoxemic conditions. For the brain tumour experiments, U87-MG, U251-MG, 9L and C6 glioma cells were orthotopically inoculated in rats. For both experiments, StO2-MRI and [18F]-FMISO PET were performed sequentially. Under hypoxemia conditions, StO2-MRI revealed a decrease in oxygen saturation in the brain. Nonetheless, [18F]-FMISO PET, pimonidazole immunohistochemistry and molecular biology were insensitive to hypoxia. Within the context of tumours, StO2-MRI was able to detect hypoxia in the hypoxic models, mimicking [18F]-FMISO PET with high sensitivity/specificity. Altogether, our data clearly support that, in brain pathologies, StO2-MRI could be a robust and specific imaging biomarker to assess hypoxia.
Introduction
Despite its relatively small weight (2% of total body weight), the brain uses about 20% of the oxygen consumed by the entire human body. 1 To function normally, the brain requires a constant supply of oxygen. Brain oxygenation is however compromised in a large variety of diseases, including stroke, 2 traumatic brain injury, 3 tumours, 4 arterial stenosis, 5 Alzheimer's disease 6 and Parkinson's disease. 7 The severity of the decreased oxygenation is singular in each disease and ranges from anoxia or severe hypoxia in an ischemic core, moderate or mild hypoxia in traumatic brain injury, to more subtle oxygenation changes such as those reported in Alzheimer's disease. Mapping brain oxygenation is of interest for both basic neuroscience – understanding the relation between a brain disease and the tissue oxygenation level – and clinical practice.
In a clinical environment, the tissue partial pressure in O2 (ptO2) cannot, however, be mapped. 8 Two types of strategies are available to obtain surrogate estimates of cerebral oxygenation. First, one can estimate the blood oxygenation level in tissue (StO2) or the oxygen extraction fraction (OEF) of the tissue. StO2, expressed as a percentage, is the ratio between the oxyhaemoglobin and the total haemoglobin content of blood in the tissue. The OEF can be mapped in vivo with positron emission tomography (PET) with radioactive oxygen (15O2) as a tracer. 9 StO2 can be mapped with near infrared spectroscopy (NIRS) on the basis of changes in haemoglobin colour as it binds to oxygen, 10 but this approach is limited to superficial structures or, alternatively, with magnetic resonance imaging (MRI) based on the change in magnetic susceptibility of haemoglobin as it binds to oxygen.11,12 The latter effect is the well-known blood oxygen level dependent (BOLD) effect. Second, one can estimate ptO2 by the mapping of tracers, which are trapped in areas that display low oxygen tensions. This approach is achieved with a variety of PET tracers, the uptake of which depends on a ptO2 threshold such as 3-[18F]fluoro-1-(2-nitro-1-imidazolyl)-2-propanol ([18F]-FMISO)13,14 and [18F]-fluoroazomycin arabinoside ([18F]-FAZA). 15 Of these radiopharmaceuticals, [18F]-FMISO is, to date, the most extensively employed PET radiotracer for the detection of brain hypoxia in both preclinical and clinical situations of neuropathology.
The two strategies have advantages and drawbacks.8,16 On the one hand, mapping StO2 or the OEF yields a continuous signal with high temporal and spatial resolutions, but the relationship to ptO2 is indirect and the vascular changes indirectly reflects tissue changes. Their relationship depends, among other parameters, on the dissociation curve of haemoglobin, which itself depends on pH, temperature, etc. (a lower blood pH or a higher blood temperature would lead to a higher blood pO2 for the same blood oxygen saturation). Accordingly, hypoxic areas may not be clearly delineated. Through the use of a modified quantitative BOLD (qBOLD) approach, we have recently reported that changes in StO2 can be readily assessed by MRI in conditions of mild and severe hypoxia induced by decreases in the fraction oxygen in inspired gases, in tumour and stroke situations and following diffuse brain traumatic injury.11,17 While tumour and stroke would produce severe hypoxia (ptO2 < 10 mmHg), StO2–MRI is sensitive to diffuse brain traumatic injury that induces brain hypoxia without evidence of brain ischemia (ptO2 ranging between 10 and 20 mmHg). 3 On the other hand, mapping hypoxia using PET defines only brain tissue areas in which ptO2 is less than approximately 10 mmHg. 18 However, the available PET tracers fail to reveal regions with moderate to mild hypoxia (30 > ptO2 > 10 mmHg). Moreover, the link between FMISO PET and the ptO2 is not linear. 18
Objectives
In the present study, we analyzed the potential of the StO2 MRI approach to map brain hypoxia in healthy rats under moderate hypoxemia as well as in four brain tumour models (U251, U87, 9L and C6), characterized by different levels of hypoxia. These analyses were based on the back-to-back comparison between StO2-MRI maps, [18F]-FMISO PET maps, molecular biology and pimonidazole histology. With the brain tumours, we also evaluated the StO2-MRI threshold below which brain tissue becomes hypoxic based on the pimonidazole staining. Furthermore, we examined the ability of StO2-MRI to delineate hypoxic areas when compared with [18F]-MISO PET and pimonidazole staining as reference techniques.
Material and methods
Ethics statement
The animal investigations were performed under the current European directive (2010/63/EU) in authorized laboratories (B14118001) and with the permission of the regional committee on animal ethics (CENOMEXA, N/01-01-12/01/01-15). Data are reported according to ARRIVE guidelines. 19
Study 1: Hypoxemia experiments in normal rats
The rats (n = 18) were of the Wistar strain (6–8 weeks old, males) and purchased from Janvier Laboratories, Le Genest St Isle, France.
Two experiments were performed: OxyLite/Oxyflow and MRI followed by PET
For all experiments, the animal preparation was as follows: under anaesthesia with isoflurane (2–3%), tracheal intubation was performed and the rats were mechanically ventilated with medical air enriched with an extra 10% O2 to reach a fraction of inspired oxygen (FiO2) of 30% via a rodent respirator (Model 683; Harvard Apparatus, Inc., South Natick, MA). Oxygen enrichment was necessary because of the constraints of the imaging devices, which resulted in a suboptimal respiratory state. Ventilation was adjusted to maintain partial arterial CO2 pressure (paCO2) at 35 ± 5 mmHg. The FiO2 was continuously monitored (GasBadge Plus, Industrial Scientific, France). A 0.7 mm indwelling catheter was inserted into the left femoral artery to monitor mean arterial pressure (Stoelting, USA). Arterial gas tensions (paO2 and paCO2), arterial oxygen saturation of haemoglobin (SaO2) and arterial pH (pHa) were quantified from 0.1 ml arterial samples (RapidLab 348, Siemens, Germany). Another 0.7-mm indwelling catheter was inserted into the left femoral vein to continuously infuse epinephrine (25 ng/min) and sodium bicarbonate (0.4 mol/min) in physiological saline at a rate of 2 ml/h throughout the study. Epinephrine was required to counteract the adverse effects of both anaesthesia and hypoxic hypoxia on the cardiovascular system. 20 Sodium bicarbonate was used to prevent metabolic acidosis. For all experiments, the rats were placed in pronation; the head was secured via ear and teeth bars. Rectal temperature was maintained at 37.5 ℃ ± 0.5 ℃ with a retrocontrolled heating pad.
OxyFlow/OxyLite experiments (Fig. S1b)
OxyLiteTm (Oxford Optronix) is a time-resolved luminescence based optical probe used to quantify the ptO2 21 and OxyFlow is used to measure blood flow. After implantation of the OxyLite probe into the striatum, there was a calibration of 30 min under FiO2 = 30% and measurements of ptO2 for another 30 min, the FiO2 was decreased to 17% (moderate hypoxemia). Control animals were maintained at a FiO2 = 30% throughout the experiment. A continuous measurement of ptO2 expressed in mmHg (corrected for the cerebral temperature) and cerebral blood flow expressed as arbitrary units (a.u.) were assessed throughout the experiment. Data are expressed as the mean taken over 30 min for FiO2 = 30% and 30 min for FiO2 = 17% (n = 3 rats/condition).
MRI (Figure 1(Aa))
Respiration was monitored by a pressure-sensitive balloon wrapped around the abdomen. MRI was performed on a 7 Tesla horizontal magnet (Pharmascan®, Bruker, Ettlingen, Germany; CYCERON biomedical imaging platform). A cross coil configuration was used (volume/surface coil, Bruker, Ettlingen, Germany).
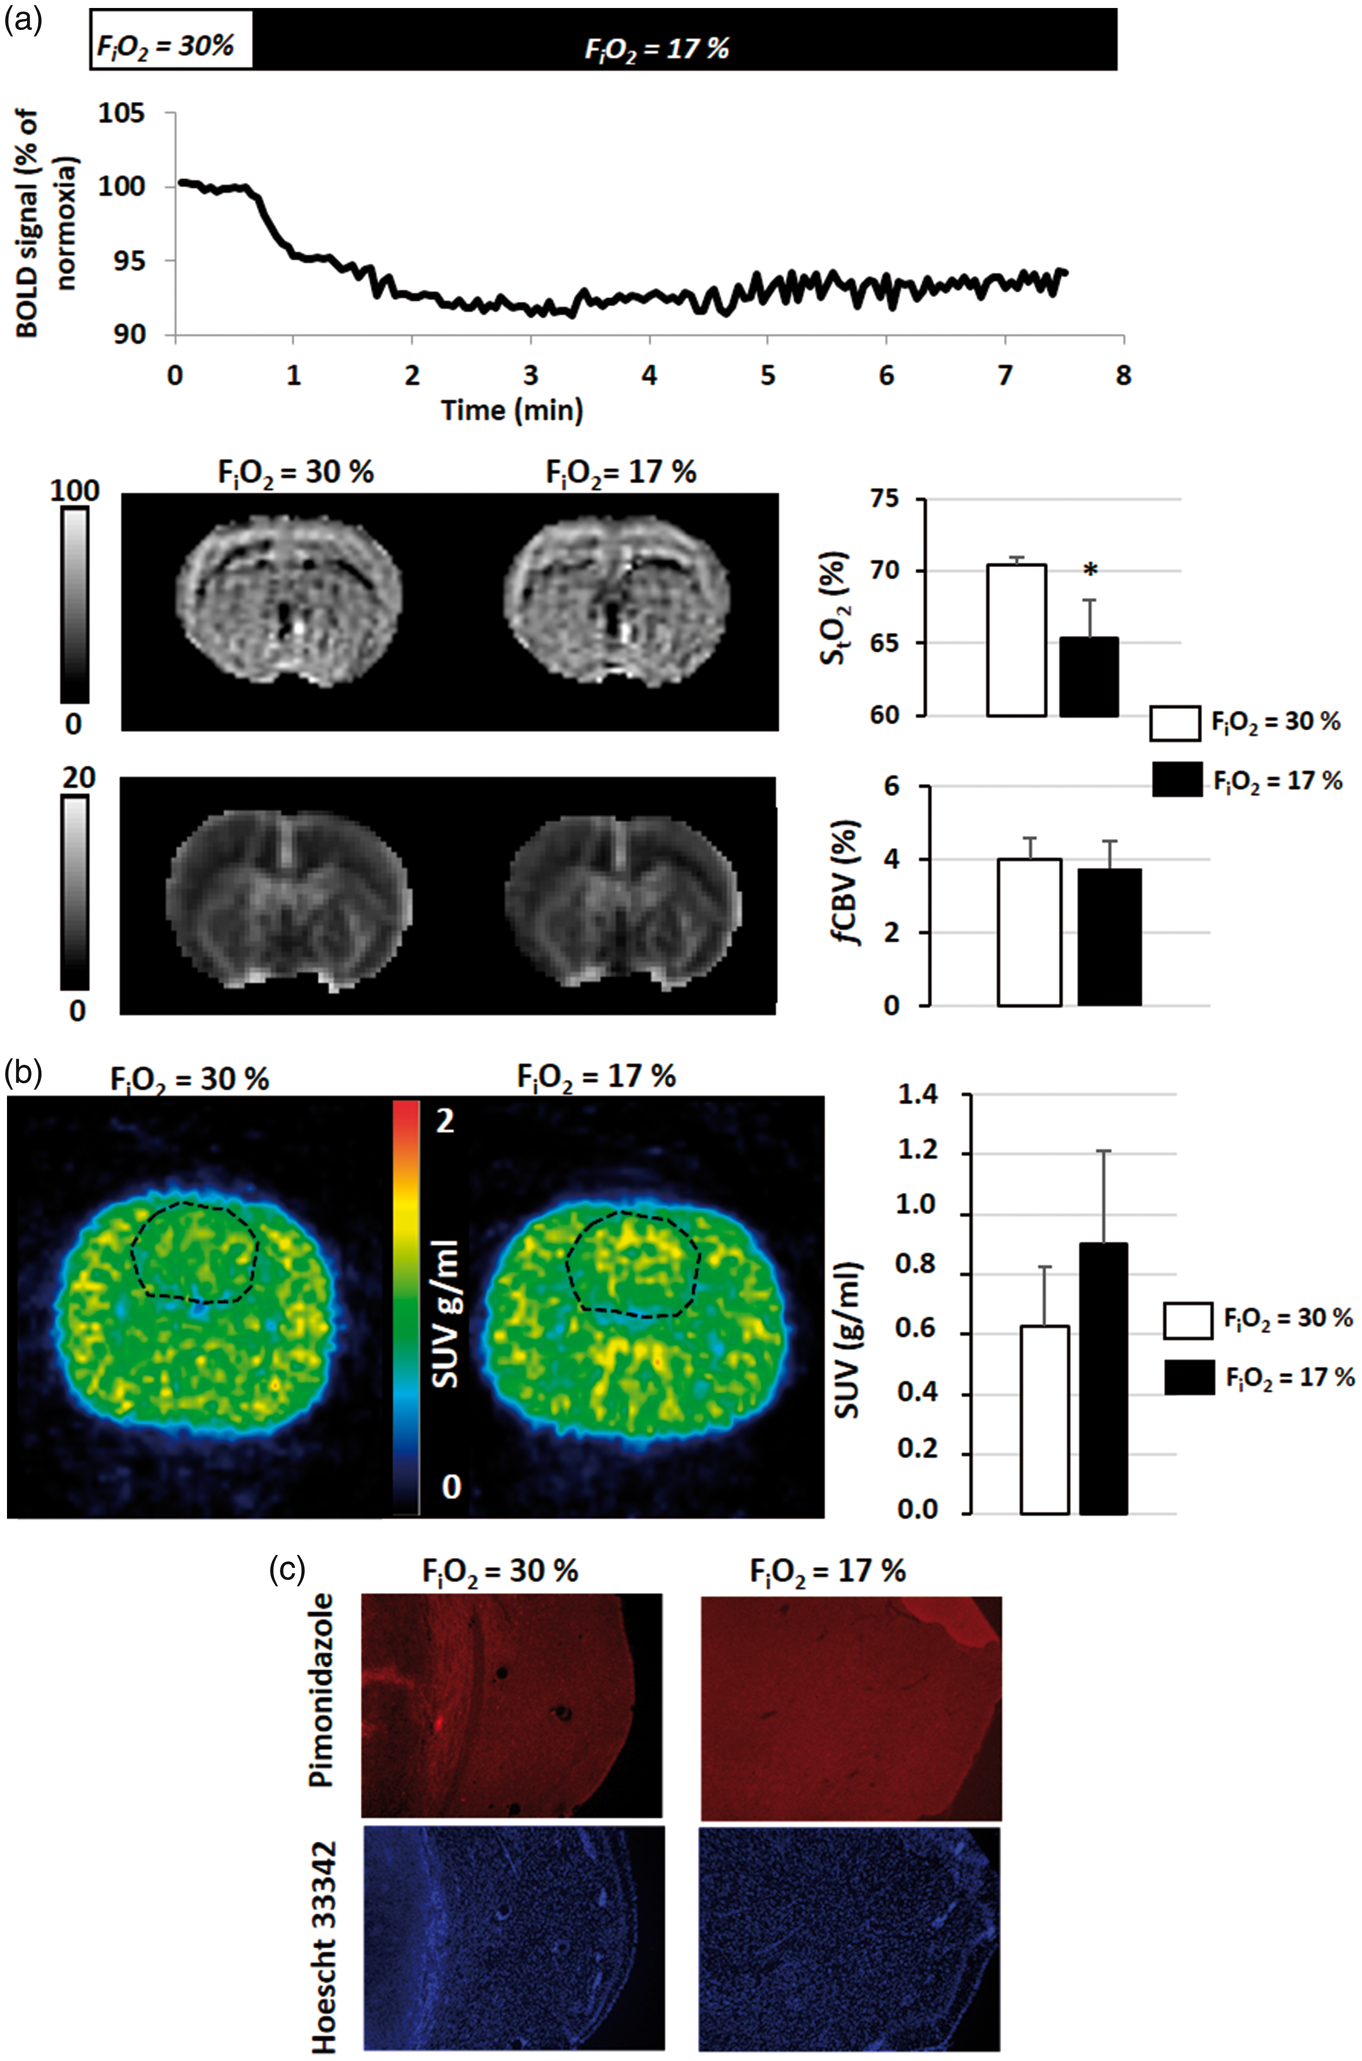
Protocols of the investigations. (A) Assessment of brain oxygenation with various approaches in the healthy brain in normoxic and hypoxemic conditions: (a) protocol with StO2-MRI (n = 6 per condition), (b) protocol with FMISO PET (n = 6 per condition); (B) Assessment of brain oxygenation with multimodal imaging in various tumour models. For each rat, MRI and PET were performed consecutively. Following the MRI examination, the rats were transferred to the PET facilities, intravenously injected with [18F]-FMISO and a PET examination was performed 2 h later. B.G. = blood (arterial) gases. Multiparametric assessment of oxygenation in hypoxemic experiments. (a) Assessment of hypoxia with StO2-MRI (n = 6). Representative T2*-BOLD weighted signal initiated under FiO2 = 30% conditions and continuously monitored when FiO2 was reduced to 17%. Images represent StO2-MRI and fCBV maps of a representative animal during each condition and the graph are the mean ± SD; *p < 0.05 vs FiO2 = 30% using a Student t test. (b) Assessment of hypoxia with [18F]-FMISO PET. Rats were submitted to FiO2 = 30% (n = 6) or FiO2 = 17% (n = 6), [18F]-FMISO was injected and PET images were acquired 2 h later. Results show a representative animal for each condition and the graph are the mean ± SD. (c) Assessment of hypoxia with pimonidazole staining. Representative photographs of pimonidazole staining and the corresponding Hoescht 33342 couterstaining for one animal in each degree of oxygenation.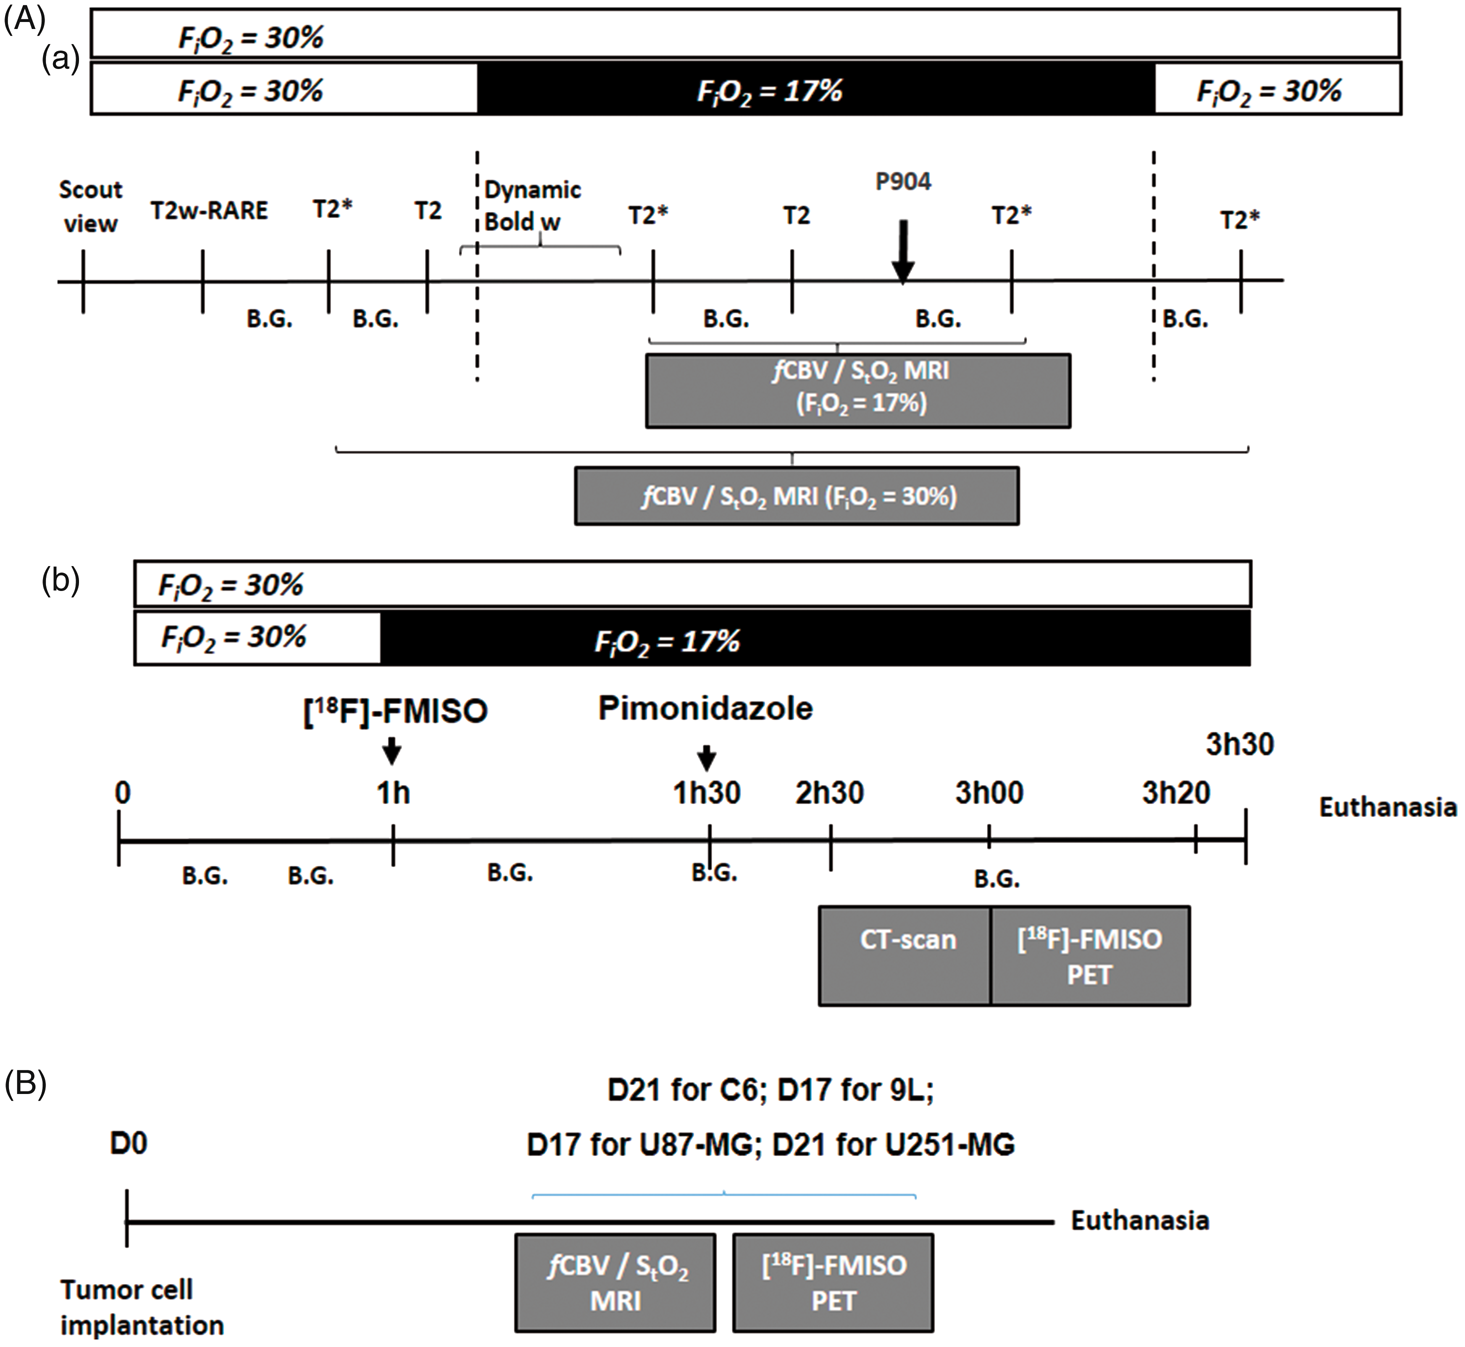
First, animals were ventilated with a FiO2 = 30%. After scout imaging, an anatomical exploration of the brain was performed using a T2w sequence (RARE, acceleration factor of 8; TR/TEeff = 5000/62.5 ms; Number of EXperiments (NEX) = 1; 20 contiguous slices; resolution = 0.15 × 0.15 × 0.75 mm3; acquisition time = 2 min). TR and TE are, respectively, repetition time and echo time.
All echo planar images (EPI) were acquired with a single shot, motion artefact and ghost free, double sampling k-space coverage with identical bandwidth and geometry (10 contiguous slices, resolution = 0.3 × 0.3 × 1.5 mm3) (except for T2*w) with saturation slices at the edges of the field of view.
Fractional cerebral blood volume (fCBV) and oxygen saturation (StO2-MRI) maps
Fractional cerebral blood volume was measured using a steady-state approach and StO2-MRI maps were measured using a multi-parametric quantitative BOLD approach, as previously described.11,22,23 Prior to the injection of contrast agents, five T2*w (TR/TE = 20,000/12 ms, NEX = 3, 50 contiguous slices, resolution = 0.3 × 0.3 × 0.3 mm3) and four T2w (TR/TE = 20,000/40 ms, NEX = 3) EPI images were acquired with various echo times (five gradient echoes for T2* = 12, 15, 18, 21 and 24 ms and four spin-echoes for T2 = 40, 60, 80 and 100 ms, respectively). Then FiO2 was then decreased to 17% and both acquisitions were repeated. An intravenous administration of iron oxide particles (P904; 200 µmol/kg, Guerbet, Aulnay-s-bois, France) was realized and T2*w EPI images (TE = 12 ms) were acquired at FiO2 = 17% first and then at FiO2 = 30%. Consequently, for each animal, fCBV and StO2-MRI maps were obtained under two conditions: FiO2 = 30%and FiO2 = 17%. Control rats were maintained at FiO2 = 30% through the whole imaging procedure.
Following the MRI examination, the rat was transferred to the PET facilities.
PET (Figure 1(Ab))
After animal preparation under FiO2 = 30%, the FiO2 was decreased to 17% and hypoxemia was attested by the arterial gas tensions. [18F]-FMISO (produced by the LDM-TEP group, UMR6301-ISTCT) was then intravenously injected in physiological saline (66 MBq.kg−1) at t = 1 h after the initiation of hypoxia. At t = 2.5 h, the rats were transferred into the PET camera (Inveon®, Siemens, Erlangen, Germany; CYCERON biomedical imaging platform). An X-ray scan was first performed to obtain attenuation maps just prior to an emission scan of 20 min initiated at t = 3 h. The rats were ventilated throughout the period of hypoxemia. Control animals were maintained at FiO2 = 30% for the whole imaging procedure. Six rats were used for FiO2 = 30% and six rats were used for FiO2 = 17%. All images were reconstructed by the iterative OSEM-2D algorithm. 24
Molecular biology
Immediately after the completion of PET examinations, the rats were euthanized under deep anaesthesia and the brains were removed and snap-frozen. Total RNAs were extracted from the brain tissue with the TRIzol® reagent (InVitrogen) according to the manufacturer's protocol. RT-PCR was performed as already described. 25 The amount of target genes (erythropoietin, carbonic anhydrase IX and adrenomedullin) was given by the formula: [2 − (Ct gene of interest − Ct housekeeping)], where Ct is the threshold cycle value. Results were expressed relative to the housekeeping gene cyclophilin. Experiments were repeated at least 3 times. These genes were chosen because of their dependency to hypoxia. 26
As a positive control for moderate to severe brain hypoxia, we also extracted mRNA from rat brains that were maintained in hypoxia chambers (InVIVO2 1000; Baker Ruskinn) for 3 h 30 min in 8%/92% oxygen/nitrogen mixture.
Immunohistochemistry
Pimonidazole was used as marker of hypoxia. Rats (3/condition) were injected with a pimonidazole solution (Hypoxyprobe®-1, Hypoxyprobe Incorporation, USA) of 80 mg/kg i.p., 120 min before the animals were euthanized under deep anaesthesia. Thereafter, rats were transcardially perfused with saline followed by 4% paraformaldehyde (PFA, Sigma, France) and brains were removed, placed in a 30% sucrose solution for 3 days and coronal sections (50 µm) were cut on a freezing microtome (Microm international GmbH, Germany). The slices were kept at −20 ℃ in a cryoprotectant mixture (30% glycerol, 20% ethylene glycol and 50% PBS). To visualize the pimonidazole staining, sections were immunostained with a Hypoxyprobe®-1 antibody following the manufacturer's instructions (Hypoxyprobe Inc, Burlington, Massachusetts, USA). Tissue sections were examined at 10 × objective with a Leica DM6000 microscope following Hoescht 33342 counterstaining.
Study 2: Brain tumour models
Tumour cells and cell culture
The C6 and the 9L glioma cell lines were purchased from ATCC (American Type Culture Collection). Cells were cultured in DMEM medium and RPMI, respectively, supplemented with 10% foetal calf serum and glutamine (2 mM) (Sigma-Aldrich, France) at 37 ℃ in 5% CO2, 95% air.
Human U87-MG (ATCC, HTB-14) and human U251-MG glioma (National Cancer Institute) cells were grown in DMEM 1 g/l of glucose supplemented with 2 mM glutamine (Sigma-Aldrich, France) and 10% foetal calf serum (InVitrogen, France).
Tumour models
Male Wistar rats (6–8 weeks old, used for C6, n = 7) were purchased from Janvier Labs (Le Genest-Saint-Isle, France), Fischer rats (6–8 weeks old, used for 9L cells, n = 7) and nude athymic rats (6–8 weeks old, for U87-MG, n = 6 and for U251-MG, n = 7) from Charles River laboratories (L'Arbresle, France). The number of animals was determined from previous experiments with these tumour models.13,27
Isoflurane anaesthesia was used for the rats (5% for induction and 2% for maintenance in 70% N2O/30% O2). Rectal temperature was monitored and maintained around 37.0 ℃ throughout the experiments as already described.
Tumour cell implantation
Rats were placed on a stereotactic head holder and a sagittal scalp incision was performed. A 1-mm diameter burr hole was drilled in the calvarium, 3 mm lateral to the bregma. C6 (1 × 10⁵), 9L, U87-MG and U251-MG cells (5 × 10⁴) cells in 3 μl PBS-glutamine 2 mM were injected over 6 min via a fine needle (30 G) connected to a Hamilton syringe (Corroyer-Dulmont et al., 2013). The injection site was the right caudate-putamen, at a depth of 6 mm beneath the calvarium. The needle was removed slowly 5 min after the end of the injection and the burr hole was sealed with dental cement.
Imaging protocol (Figure 1(B)): MRI and PET imaging to quantify hypoxia were sequentially performed on day 21 for C6 and U251-MG models, and on day 17 for 9L and U87-MG models. Experiments were performed before any pain or distress was observed.
MRI
The tumour-associated oedema was detected using a T2w sequence (RARE, acceleration factor of 8; TR/TEeff = 5000/62.5 ms; NEX = 1; 20 contiguous slices; resolution = 0.15 × 0.15 × 0.75 mm3; acquisition time = 2 min). fCBV, StO2-MRI were assessed as described above in study 1.
PET
[18F]-FMISO PET was performed under a similar protocol to that described above in study 1. Following the MRI examination, the rat was transferred to the PET facilities and was intravenously injected with [18F]-FMISO and then allowed to recover from anaesthesia.
One hour and 40 min later, the animal was re-anesthetized (isoflurane 2.5% in N2O/O2) and positioned in the preclinical PET machine (Siemens Inveon®, CYCERON Biomedical imaging Platform). Subsequently, a CT scan session was performed over 10 min to obtain attenuation correction and subsequent PET/MRI registration, followed by an emission scan session for 20 min, initiated 2 h after the injection of [18F]-FMISO.
Immunohistochemistry
Rats were injected with a pimonidazole solution (Hypoxyprobe®-1, Hypoxyprobe Incorporation, USA) of 80 mg/kg i.p., 120 min before the animals were euthanized under deep anaesthesia immediately after the completion of PET imaging examinations. The rats were transcardially perfused and brains were removed for histological analyses. Pimonidazole staining was performed as described in study 1.
Image processing and analysis
Image analysis was performed with in-house macros based on the ImageJ software (http://rsb.info.nih.gov/ij/, 1997–2012). PET analyses were performed with PMOD 3.1 software. 24
PET
To quantify [18F]-FMISO uptake, the measured concentration of tissue activity (counts, kBq/ml) were divided by the injected activity in KBq/g of body weight to give a standardized uptake value (SUV, g/ml). For tumour models, a relative SUV (rSUV) to contralateral was used for further comparison between tumour models.
Tumour delineation
The regions of interest corresponding to the tumour and the contralateral mirror tissue were manually delineated on all contiguous T2w slices. The ROI corresponding to the tumour or to the contralateral tissue was used thereafter for measurements of all other parameters. These ROIs defined on MRI were used (for both StO2-MRI, fCBV and [18F]-FMISO) for comparison between models (see Figures 3 and 5).
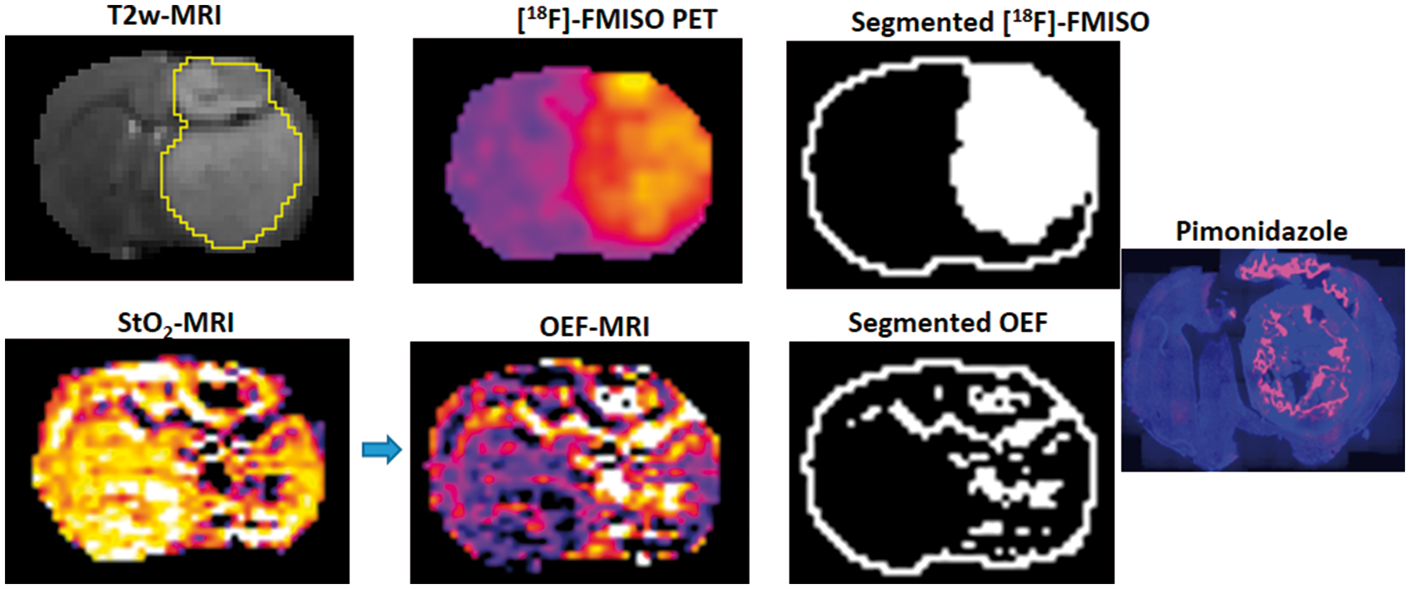
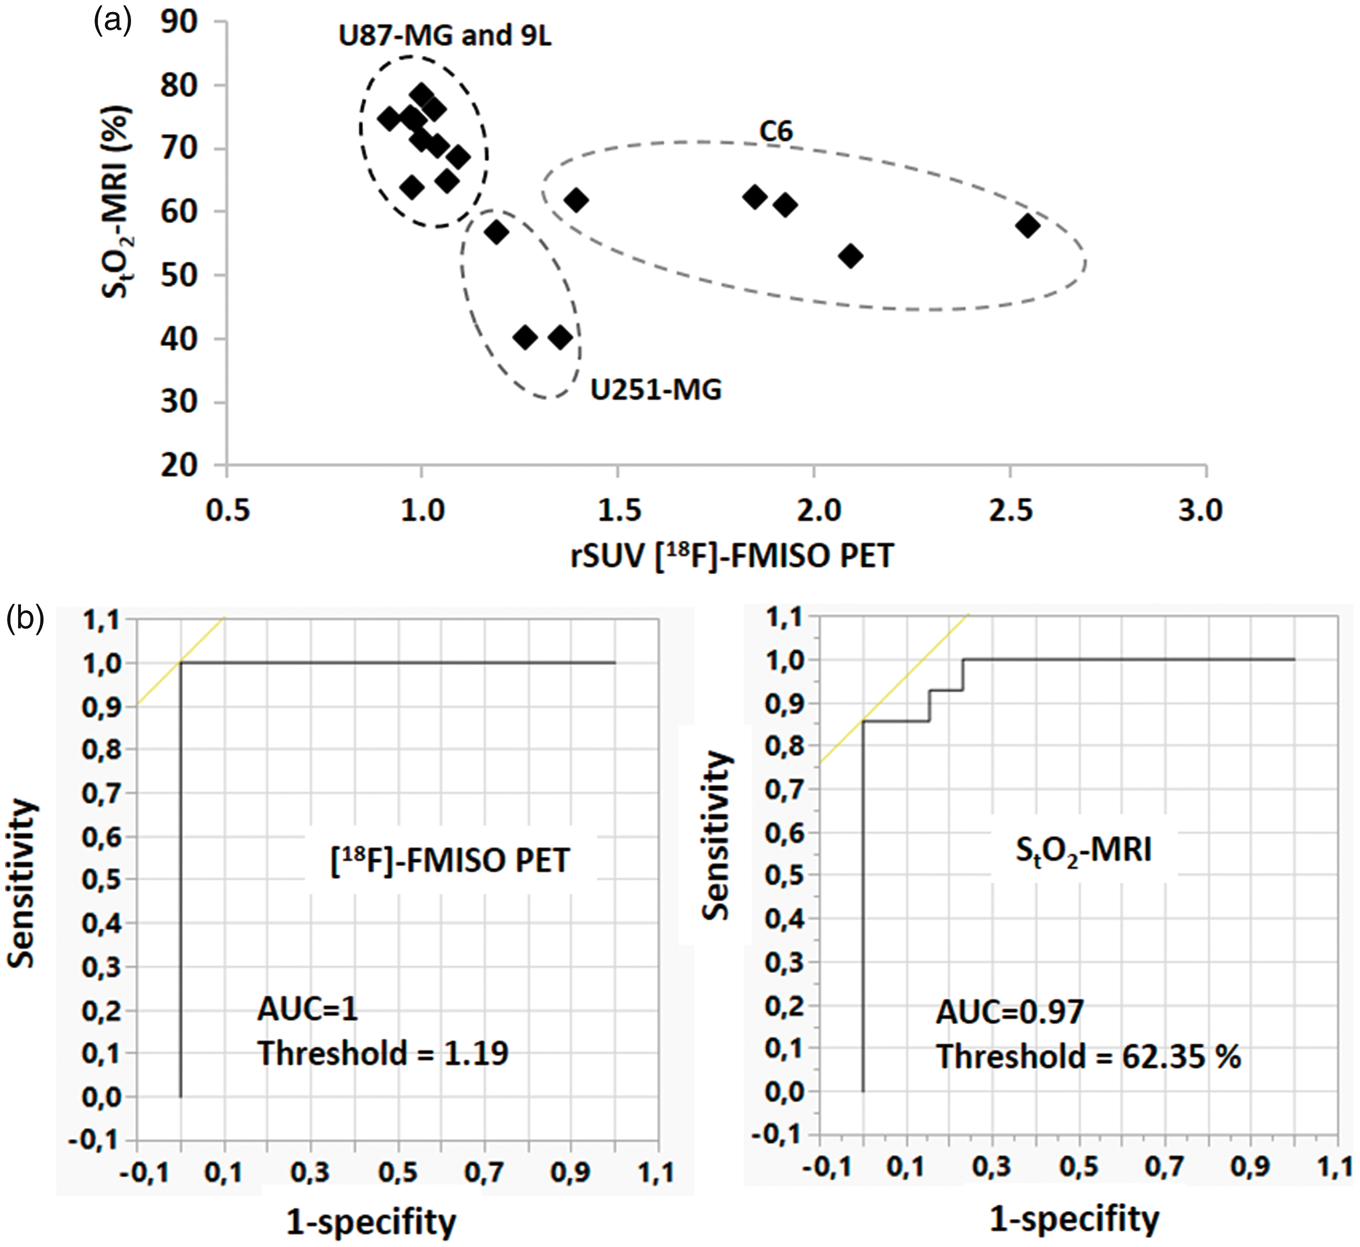
Multiparametric assessment of oxygenation in brain tumour models. (a) Representatives images of rats bearing brain tumours as shown on the T2w MRI (upper panel), and the corresponding assessments of hypoxia with sequential StO2-MRI (middle panel) and fCBV (lower panel) and (b) with [18F]-FMISO PET, or with pimonidazole immunostaining/Hoechst 33342 counterstaining (c). The graphs represent the mean ± SD (n = 6 for U87-MG; n = 7 for 9L; n = 7 for U251-MG and n = 7 for C6); *p < 0.05, **p < 0.01 and ***p < 0.001 vs respective contralateral tissue following a significant ANOVA and Tukey's post-hoc test. Spatial analyses of hypoxia estimates in the C6 glioma model. Spatial inspection of a representative rat for which [18F]-FMISO PET images was segmented so as to obtain a hypoxic volume (upper panel, right); OEF-MRI calculated with StO2-MRI was also segmented (lower panel, right). Pimonidazole mosaic was used as a reference for hypoxia. Comparison of [18F]-FMISO and StO2-MRI. (a) Scatterplot of StO2-MRI values in the tumour ROI of all tumour types as a function of [18F]-FMISO uptake (n = 18 rats who had sequential MRI and PET scans). (b) ROC analyses for both [18F]-FMISO and StO2-MRI using pimonidazole staining as the gold standard.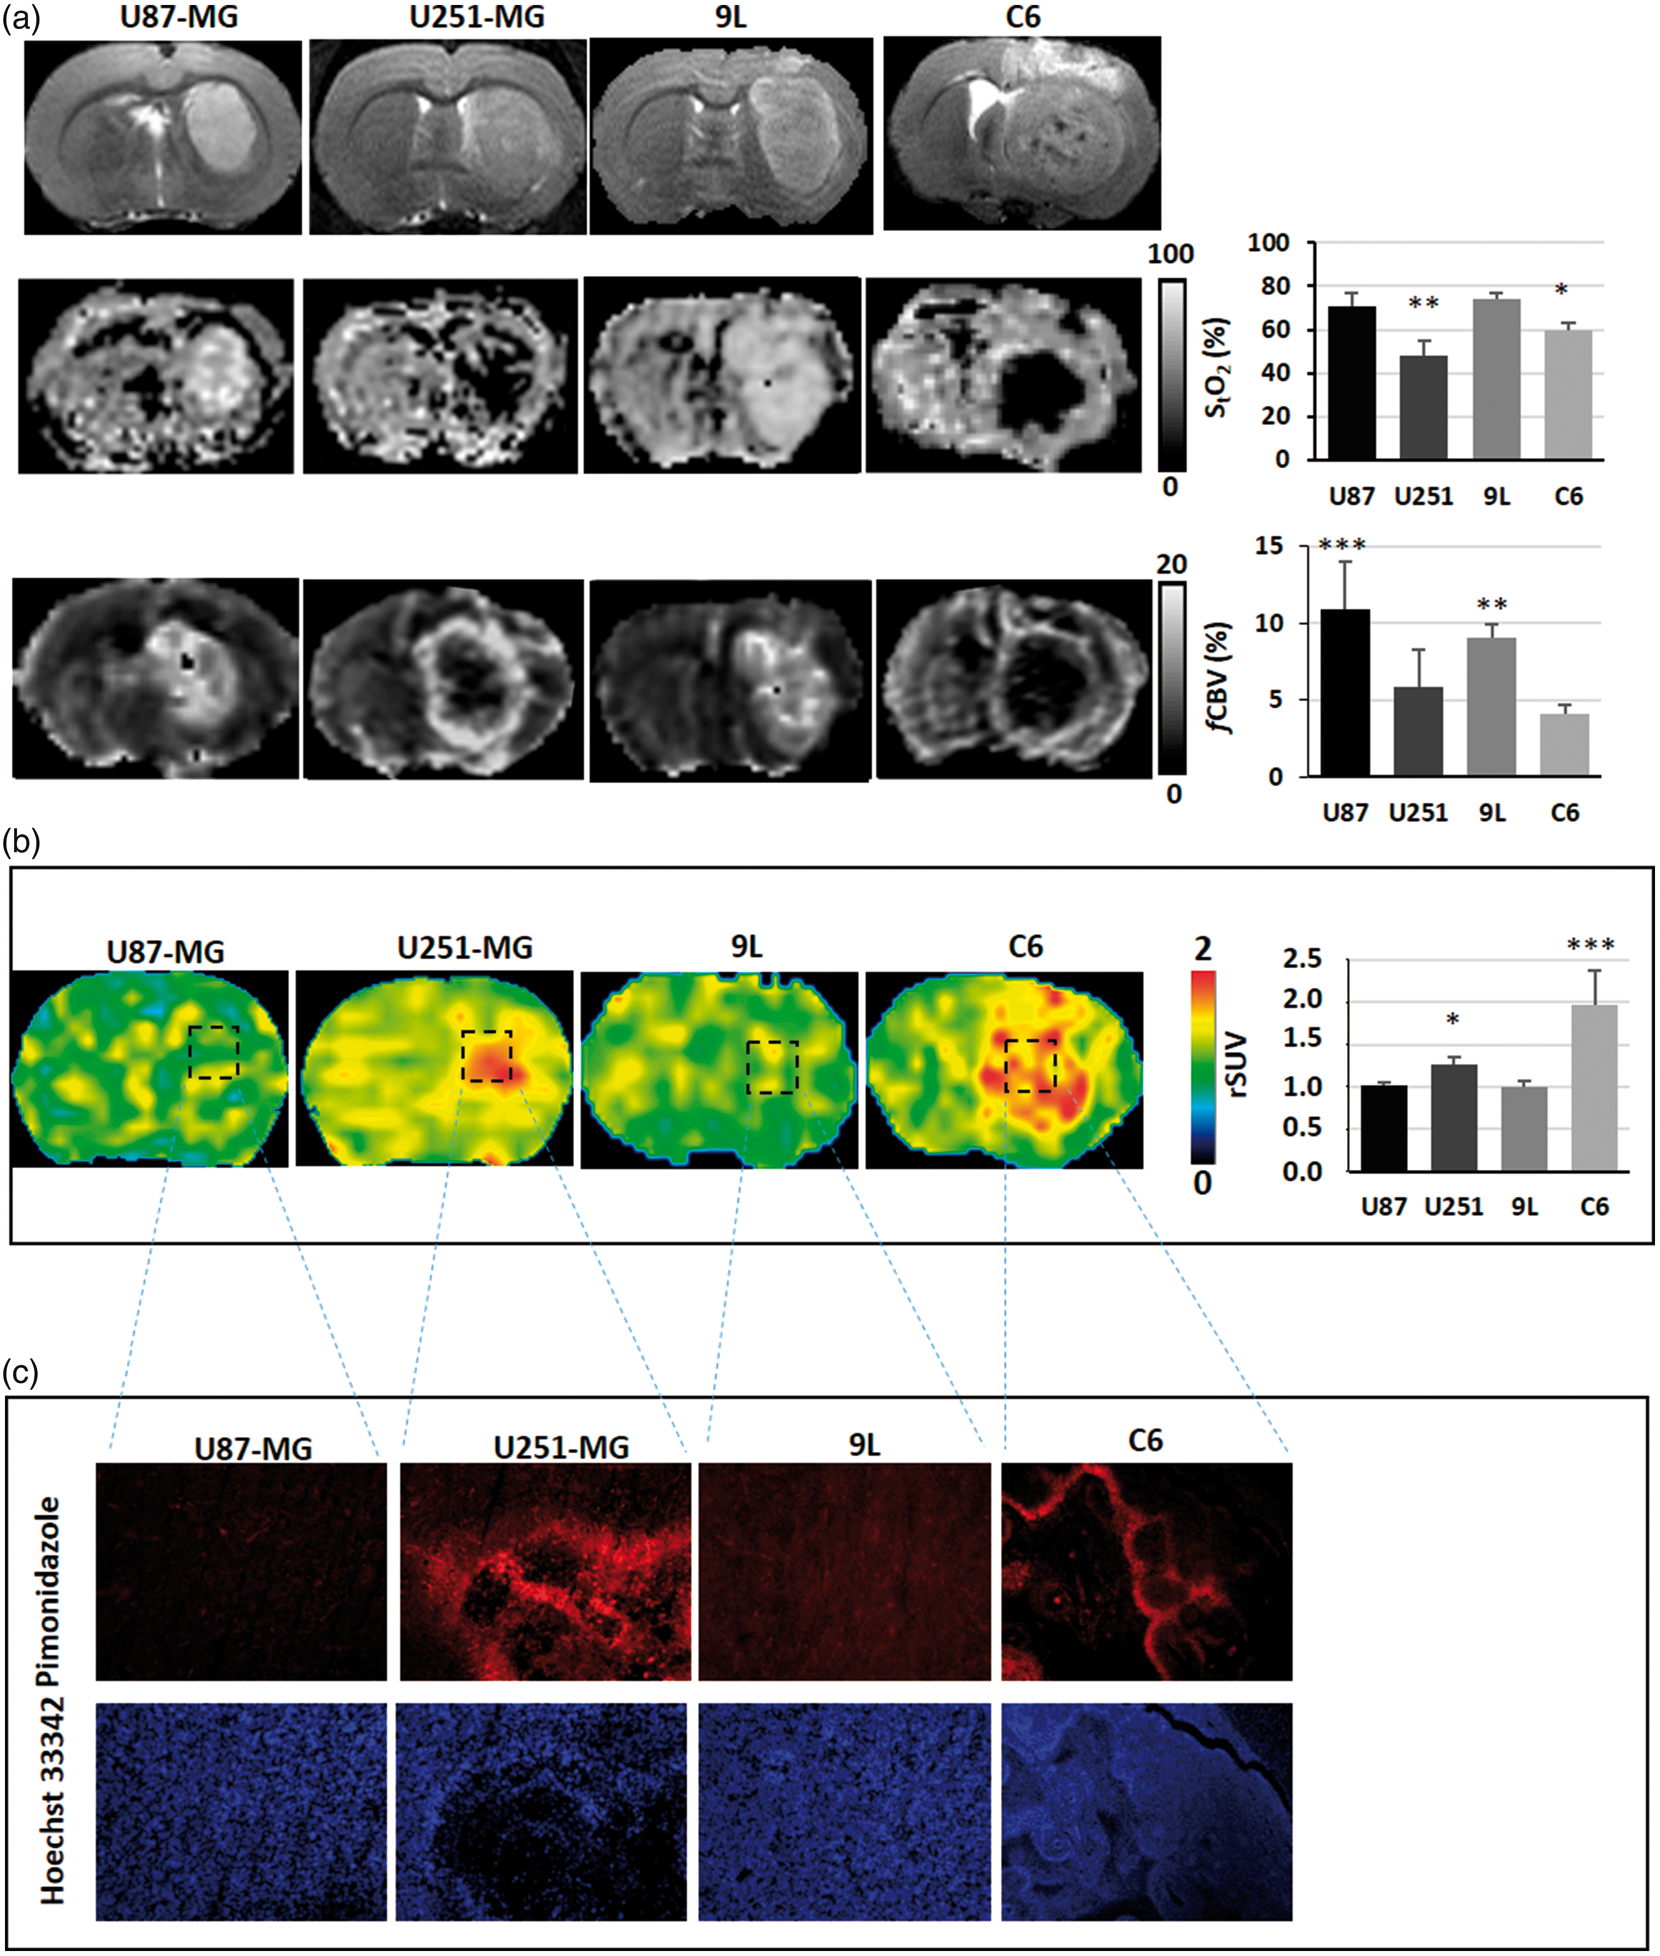
Vascular parameters
fCBV maps (expressed as a %) were computed from ΔR2* and Δχ (see equation (1)).

ΔR2* is the difference between relaxation rates before and after the administration of the MRI contrast agent P904, which belongs to the family of ultra-small superparamagnetic particle of iron oxide. Δχ is the increase in the blood magnetic susceptibility induced by the presence of the contrast agent in the vasculature, B0 is the main magnetic field (T) and γ is the gyromagnetic ratio of protons. Voxels for which no reliable analysis could be performed were omitted (e.g. fCBV values outside the range of validity of the method, i.e. fCBV > 20%; negative ΔR2*). 23
StO2-MRI
StO2-MRI were estimated using the multi-parametric qBOLD approach
11
based on equation (2):
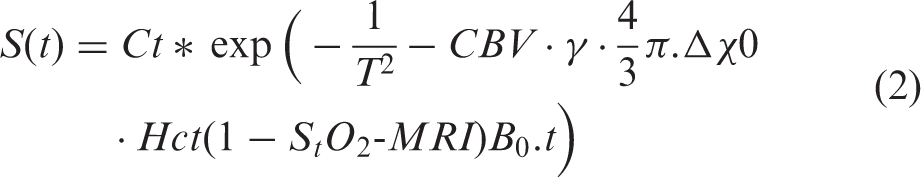
After spatial averaging of the T2*w EPI scans to achieve a final resolution of 0.3 × 0.3 × 1.5 mm3 to correct the macroscopic inhomogeneities, the T2*w EPI sequences were eventually fitted pixelwise to the MR signal decay S(t) as a function of TE.
In this equation, where Hct is the local hematocrit (set to 0.29 28 ) and Δχ0 is the difference between the magnetic susceptibilities of fully oxygenated and fully deoxygenated haemoglobin (set to 0.264 × 10⁶ (centimetre–gram–second) 29 ); Ct is the proportionality constant; T2 values were obtained from a pixelwise fit to the MR signal decay measured from the four T2w EPI images acquired at TE = 40, 60, 80 and 100 ms. fCBV values were derived from equation (1). Voxels for which no reliable analysis could be performed were omitted (e.g. StO2-MRI values outside the range of 0–100%).
Assuming fully oxygenated arterial blood, we also computed oxygen extraction fraction maps (OEF maps (100 − StO2-MRI). 30
MRI/PET co-registration
All MRI experiments were performed such that all MRI maps were anatomically colocalized. A first automatic registration (PMOD 3.1) was performed between T2w MRI (reference) and the X-ray scan (input) using a rigid registration algorithm based on mutual information. The transformation matrix so obtained was then applied to all PET emission scans. Registration was visually assessed and, when necessary, manually refined.
Image segmentation
A ROI in the contralateral tissue was manually delineated so as to obtain a mean ± SD value. Then, a mean ± 3.3 SD threshold was used for segmentation so as to obtain an hypoxic volume for both [18F]-FMISO and a mean ± 1.96 SD threshold for StO2-MRI. These segmented ROIs were used for spatial analyses between MRI and PET in relation to pimonidazole staining.
Statistical analyses
All data are presented as mean ± SD, unless otherwise stated. Statistical analyses were performed with JMP® program (SAS Institute Inc, USA). The different tests used are detailed in each figure legend.
The mean values in the tumour were reported for StO2-MRI and SUV [18F]-FMISO. Hypoxia was defined on pimonidazole staining to enable ROC curves analyses.
Results
Study 1: Multiparametric assessment of oxygenation in hypoxemia experiments
Physiological measurements
Arterial gas values (from the three experiments) testify significant differences between FiO2 = 30% and FiO2 = 17% conditions. paCO2 and pH were maintained at 37.0 ± 11.0 mmHg and 7.48 ± 0.17 FiO2 = 30% and 36 ± 11 mmHg and 7.43 ± 0.13 in FiO2 = 17% (Table S1). However, paO2 decreased from 143 ± 23 mmHg to 62 ± 11 mmHg between FiO2 = 30% and FiO2 = 17% (Table S1A); p < 0.0001). A significant desaturation of the arterial blood was also observed (SaO2 = 98.7 ± 0.6% to 90.4 ± 2.3%, p < 0.0001; Table S1A). Despite the increased FiO2 values, FiO2 = 30% corresponds to a relatively normoxia status and FiO2 = 17% to a hypoxemia status. The difference between the increased FiO2 and the oxygenation status of the arterial blood can be attributed to the anatomical dead space between the mechanical ventilator and the animal.
Oxylite experiments
At FiO2 = 30%, the brain oxygen pressure (ptO2), assessed by OxyLite probes, was 36 ± 16 mmHg with a blood flow equal to 532 ± 57 a.u. Under FiO2 = 17%, the ptO2 fell to 16 ± 9 mmHg (not statistically different from FiO2 = 30% conditions). As expected, blood flow markedly increased in the first minutes of hypoxemia and then reached 1129 ± 622 a.u. (Fig. S1B).
MRI experiments
PET and MRI assessment of brain oxygenation status for FiO2 = 30% and FiO2 = 17%.
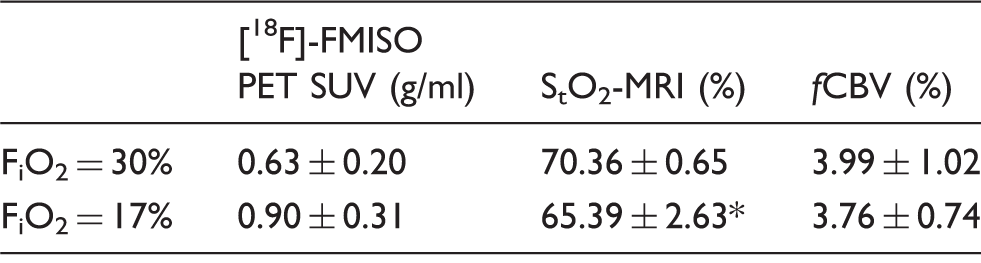
[18F]-FMISO uptake was measured in rats ventilated with FiO2 = 30% (n = 6) or FiO2 = 17% (n = 6); StO2-MRI and fCBV were measured in rats ventilated at FiO2 = 30% and then at 17% (n = 6 rats). Results correspond to the value in the whole brain and are expressed as a Mean ± SD. *p < 0.05 vs FiO2 = 30% following a Student t test.
During FiO2 = 30%, the mean StO2-MRI was 70.4 ± 0.7% in the brain. Changes in FiO2 to 17% resulted in a significant decrease in StO2-MRI (65.4 ± 2.6%) (p = 0.03). No changes were observed for fCBV between FiO2 = 30% and FiO2 = 17% (Figure 2(a), lower panel).
In these experiments, arterial gases were as follows: paO2 (FiO2 = 30%) = 140 ± 19 mmHg; paO2 (FiO2 = 17%) = 56 ± 6 mmHg; SaO2 (FiO2 = 30%) = 98.8 ± 0.4%; SaO2 (FiO2 = 17%) = 88.5 ± 3.8%.
[18F]-FMISO PET experiments
No changes in [18F]-FMISO uptake occurred between FiO2 = 30%and FiO2 = 17% in the brain despite a significant arterial hypoxemia as noted by the values of PaO2. The mean SUV in the whole brain was 0.63 ± 0.20 g/ml in FiO2 = 30%and 0.90 ± 0.31 g/ml in FiO2 = 17%. No significant differences were noticed for these parameters between the two conditions (Figure 2(b)). For these experiments, arterial gases were as follows: paO2 (FiO2 = 30%) = 130 ± 13 mmHg; PaO2 (FiO2 = 17%) = 64 ± 5 mmHg; SaO2 (FiO2 = 30%) = 98.3 ± 0.4%; SaO2 (FiO2 = 17%) = 91.2 ± 1.2%.
Hypoxia assessment by histology
As for [18F]-FMISO PET, no pimonidazole staining was observed in both FiO2 = 30% and hypoxemia conditions (Figure 2(c), upper panel).
Molecular biology
At the molecular level, no changes in the expression of the mRNA of erythropoietin (EPO), carbonic anhydrase IX (CAIX) or adrenomedullin (ADM) were observed between FiO2 = 30% and FiO2 = 17% (Fig. S1C, right panel). In contrast, a marked induction of EPO, CAIX and ADM mRNAs was observed for the rats maintained in the hypoxia chamber (FiO2: 8%), used here as a positive control (Fig. S1C, left panel).
Taken together, these data suggest that StO2-MRI is sensitive to blood desaturation while [18F]-FMISO PET, pimonidazole staining and molecular biology are not.
Study 2: Multiparametric assessment of oxygenation in brain tumour models
Multiparametric assessment of oxygenation in brain tumour models and its corresponding contralateral tissues.
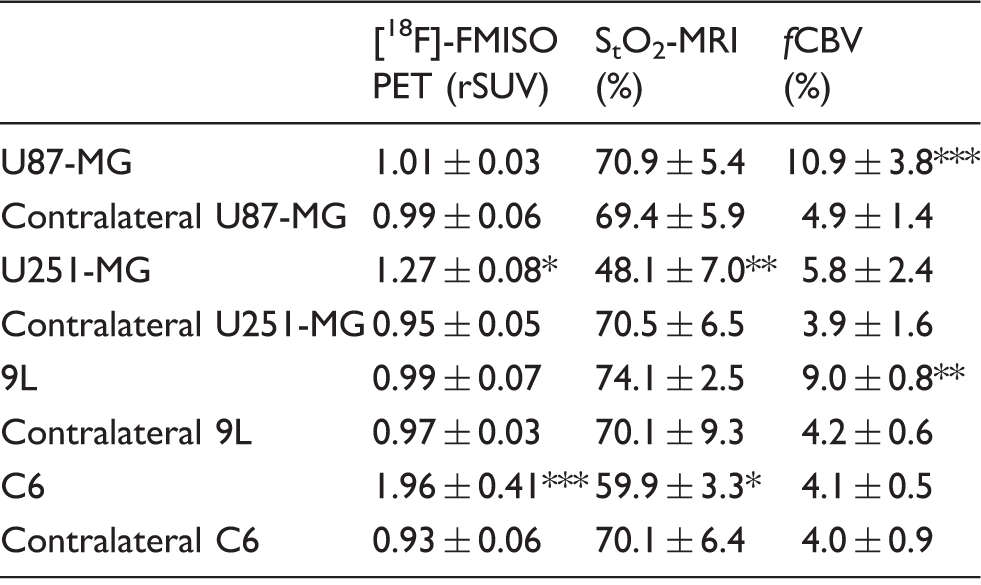
Mean ± SD of the imaging parameters in the four glioma models used in the rats (n = 6 for U87-MG; n = 7 for 9L; n = 7 for U87-MG and n = 7 for C6) and in their corresponding contralateral tissues; *p < 0.05, **p < 0.01 and ***p < 0.001 vs respective contralateral tissue following a significant ANOVA and Tukey's post-hoc test.
MRI oxygen saturation measurements
The U87-MG and the 9L-tumours were characterized by a slight increase in StO2-MRI values relative to their respective contralateral tissues (StO2-U87-MG = 70.9 ± 5.4%; StO2-9L = 74.1 ± 2.5%; contralateral-U87-MG = 69.4 ± 5.9%; contralateral-9L = 70.1 ± 9.3%). In contrast, a considerable desaturation was observed for both the U251-MG and the C6 tumours (StO2-U251-MG = 48.07 ± 7.01%; StO2-C6 = 59.96 ± 3.31% (contralateral U251-MG = 70.5 ± 6.5; contralateral C6 = 70.1 ± 6.4%; p < 0.01 and p < 0.05 as compared with their respective contralateral tissues); Figure 3(a)).
The frequency distribution revealed lower values in the tumour of the U251-MG and C6 glioma models and also a considerable heterogeneity in the distribution relative not only to U87-MG and 9L models but also to contralateral values (Fig. S2A).
fCBV measurements
We observed an elevated and homogeneous fCBV in both U87-MG and 9L tumours. In contrast, the fCBV was reduced in the tumour core of U251-MG and C6 models with a ring of enhanced fCBV at the periphery of the tumoural core. Quantitatively, it resulted in mean fCBV of U87-MG = 10.9 ± 3.8% (p < 0.001 as compared with contralateral tissue; fCBV = 4.9 ± 1.4%), 9L = 9.0 ± 0.8% (p < 0.01 as compared with contralateral tissue; fCBV = 4.2 ± 0.6%); U251-MG = 5.8 ± 2.4% and C6 = 4.1 ± 0.5% (contralateral-U251-MG fCBV = 3.9 ± 1.6; contralateral-C6 fCBV = 4.0 ± 0.9 (Figure 3(a)).
[18F]-FMISO PET experiments
An increased [18F]-FMISO uptake was detected in two of the four models, namely U251-MG and C6 tumours (Figure 3(b)). Quantitatively, the [18F]-FMISO rSUV were 1.27 ± 0.08 for the U251-MG model and 1.96 ± 0.41 for the C6 model (p < 0.05 as compared with contralateral tissue). In contrast, [18F]-FMISO rSUV were 1.01 ± 0.03 for the U87-MG model and 0.99 ± 0.07 for the 9L model (Figure 3(b)).
The frequency distribution showed that tumour and contralateral values for both U87-MG and 9L models were comparable while U251-MG and C6 models exhibited a greater and more heterogeneous [18F]-FMISO uptake in the tumour than in the contralateral tissue (Fig. S2B).
Hypoxia assessment by histology
In line with the [18F]-FMISO PET data, U251-MG and C6 models were positive for pimonidazole staining. However, U87-MG and 9L models failed to display any positive staining (Figure 3(c)).
These data show that StO2-MRI is able to detect hypoxia, yielding changes comparable with those noted with [18F]-FMISO PET, in two well described hypoxic GBM models.
Spatial correlation between StO2-MRI and [18F]-FMISO PET
To spatially compare StO2-MRI and [18F]-FMISO maps, we generated OEF-MRI maps which provide positive signals in hypoxic conditions and thereby comparable contrast. As depicted in Figure 4 (and Fig. S3), following segmentation of [18F]-FMISO and OEF-MRI images, the zone with [18F]-FMISO uptake identified and covered the entire tumour, while the segmented OEF-MRI region was more heterogeneous and was not homologous with the entire tumour. Pimonidazole staining was positive in this tumour and displayed some spatial heterogeneity.
Quantitative comparison between StO2-MRI and [18F]-FMISO PET
To confront both imaging modalities, StO2-MRI values, for each rat in all the four tumour models, were then plotted as a function of [18F]-FMISO uptake. As expected, an inverse correlation was observed: non-hypoxic tumours ([18F]-FMISO negative) had normal StO2-MRI while hypoxic tumours ([18F]-FMISO positive) had low StO2-MRI values (Figure 5(a)).
Predictive value of StO2-MRI and [18F]-FMISO PET
ROC analyses were performed using the pimonidazole as the absolute standard. [18F]-FMISO PET yielded a sensitivity/specificity of 100% with a threshold of 1.19 g/ml (Figure 5(b)). Interestingly, StO2-MRI also yielded a considerable sensitivity and specificity with a threshold of 62.3% (Figure 5(b)).
Discussion
Mapping tissue oxygenation remains challenging despite the development of numerous methods. Our objective was to address this issue in the healthy and diseased brain by the two principal and ever-emerging technological approaches that translate to the clinical setting, namely PET and MRI.
MRI and more specifically oxygen saturation mapping (StO2-MRI) has recently been promoted as a sensitive method to image changes in blood oxygenation under conditions of hyperoxia, hypoxia and diseased entities such as brain tumours, stroke and traumatic brain injury. In parallel, [18F]-FMISO PET has also been employed to assess hypoxia in various experimental and clinical situations.27,31 This latter approach is often considered as the gold standard to map hypoxia in vivo, although it is recognized that the relationship between [18F]-FMISO uptake and partial oxygen pressure is not linear: [18F]-FMISO uptake occurs when ptO2 is less than approximately 10 mmHg. 18
It has recently been published that, following a severe decrease in paO2 (less than 80 mmHg), a decrease in StO2-MRI values is observed and may reflect brain hypoxia. 11 In the context of our experimental hypoxemia (FiO2 = 17%), which resulted in a marked decrease in paO2 paralleled by an arterial desaturation, a decrease in both the BOLD signal and in the StO2-MRI was noted. These results are in line with previous MRI-based reports 17 as well as of those of the reflectance spectroscopy of visible light. 20
The decrease in paO2 was associated with a decrease in ptO2 in the brain parenchyma, which was, however, not significant when compared with normoxic conditions. Neither [18F]-FMISO PET nor molecular biology were able to detect signs of tissular or cellular hypoxia. These data concur with the recognized threshold of 10 mmHg for [18F]-FMISO uptake. Concomitantly, we observed a significant increase in blood flow as assessed by the OxyFlow/OxyLite probe, as described elsewhere during hypoxemic conditions. 20 From a physiological point of view, changes in CBF could occur so as to maintain the oxygen availability through either homogenization of the capillary transit or through vasodilation, 32 which ultimately maintains oxygen consumption. 33 Interestingly, and in line with previous data, no changes in blood volume, as measured by MRI, were observed between FiO2 = 30% and FiO2 = 17%, which suggests an homogenization of capillary transit. This hypothesis is supported by the increase in CBF measured with Oxylite probe (Fig. S1). This approach, which is based on the Doppler effect, may reflect an increase/homogenization of red blood cells in capillaries, which in turn underlie the observed increase in CBF. To conclude, in hypoxemic experiments, we postulate that MRI was sensitive to hypoxemia but that these changes failed to provoke a manifest hypoxia in the brain tissue, and thereby not detected by [18F]-FMISO PET.
Within the context of brain tumours, various GB models of both rodent and human origin have been used, so as to mimic various clinical situations. With both StO2-MRI and [18F]-FMISO PET, we observed that the C6 and the U251-MG glioma tumours were strongly hypoxic (StO2-MRI in the tumour was at maximum 60% of the contralateral tissue, [18F]-FMISO ≥ 1.2 g/ml) in association with a marked decrease in blood volume (CBV ≤ 1.5%). These results are in accordance with immunochemical markers. In contrast, both 9L and U87-MG models, which exhibited an elevated fCBV, were devoid of any sign of hypoxia. These results concur with published data. Indeed, based on EPR measurements, Khan et al. 34 already observed that the C6 glioma model exhibits severe degree of hypoxia as compared with the 9L model. These results were confirmed with [18F]-FMISO PET 27 for both tumour of rodent origin. Furthermore, our laboratory has already demonstrated that [18F]-FMISO PET markedly distinguishes the U251-MG model from the U87-MG model in term of oxygenation status. 13
When we performed spatial analyses, [18F]-FMISO and OEF (derived from StO2-MRI) were, as expected, increased within the tumour regions. StO2-MRI was however heterogeneous in line with previous results 35 when compared with [18F]-FMISO uptake. These data suggest that non-hypoxic regions may be present in tumours and that the poor spatial resolution of PET (characterized by an elevated FWHM of point spread-functions (PSF)) may smooth out these regions. Alternatively, the greater heterogeneity (derived from the inherent noise) of the StO2-MRI maps 36 could increase the difficulty to segment the different compartments. This noise becomes more pronounced with a decrease in fCBV and/or StO2-MRI. 11
It is also conceivable that the extent of low ptO2 is greater than those of low StO2-MRI areas. When compared with pimonidazole staining, one could argue that both effects could occur since the heterogeneous staining seen with pimonidazole indicates spatial heterogeneity within the tumour. However, StO2-MRI is not free of artefacts as it can be noted in Figure 4 where the corpus callosum of the contralateral hemisphere is located in the segmented signal. This problem could be partially corrected by the incorporation of a more accurate estimate of white matter magnetic susceptibility or by the use of MRI sequences less sensitive to shimming issues than those employed in EPI. In neuro-oncological situations, other artefacts may occur related to the presence of necrosis or bleeding as discussed in the literature with the BOLD effect. 30 A lower arterial pH or a higher blood temperature would lead to a greater arterial blood pO2 for the same blood oxygen saturation. During the experiments and the imaging session, systemic temperature was maintained at 37.5 ± 0.5 ℃. Even if the extracellular pH is thought more acidic than the intracellular pH, arterial pH remains in the normal range for animal bearing brain tumours (7.46 ± 0.08). One of the main advantages of the multiparametric quantitative BOLD (mqBOLD) paradigm used in the present study is that fCBV, T2 and T2′ are calculated independently so that objective thresholds can be used to exclude non-relevant voxels.
Another limitation to our study could be the use of SUV maps instead of a voxelwise calculation of kinetic parameters derived from compartmental models. This choice was based, first, on the literature and on our previous experiments with tumour models13,27 and for which we had already shown a tight spatial correlation between the late acquisition of SUV FMISO and pimonidazole staining. Second, to calculate kinetic parameters, blood sampling is mandatory. This sampling presents difficulties at the preclinical level and more importantly in pathological situations when animals are fragile.
In summary, our results support the hypothesis that, in the context of brain tumours, StO2-MRI could be a robust and specific imaging biomarker to assess severe hypoxia. Our conclusions are supported by the ROC analyses. While [18F]-FMISO yielded an AUC of 1, which was expected since the pimonidazole staining was used for the stratification ([18F]-FMISO and pimonidazole have similar pharmacophores), StO2-MRI yielded an AUC of 0.97.
It might be thought that fCBV is a reflection of hypoxia as an inverse relationship is found between StO2-MRI and fCBV. When comparing U251-MG and C6 glioma models, although the latter exhibited an elevated [18F]-FMISO uptake (FMISO PET C6 = 1.96 ± 0.41 g/ml, U251-MG = 1.27 ± 0.08 g/ml) and a fCBV less than that of the U251-MG model (fCBV C6 = 4.1 ± 0.5%, U251-MG = 3.9 ± 1.6%); the StO2-MRI values were greater in the C6 model than those of the U251-MG model (StO2-MRI C6 = 59.9 ± 3.3%; U251-MG = 48.1 ± 7.0%). Taken together, these results suggest that fCBV does not necessarily mirror StO2-MRI. A probable explanation for such a discrepancy between the vasculature and tissue hypoxia resides in the tumoural metabolism. Indeed, depending on the intrinsic oxygen consumption by tumour cells (oxidative phosphorylation or glycolysis), 37 tissue oxygenation might not be reflected by a measure of vasculature. Moreover, as discussed elsewhere, the microvascular environment (e.g. oedema, inflammation, microthrombosis, etc.) may also interfere with oxygen delivery to the cells. 3
As a conclusion, although several methodological issues may be improved (such as the accuracy of StO2 estimates with respect to confounding factors (e.g. the variable magnetic susceptibility between tissue types, the impact of change in haematocrit, bleeding, etc.); in the context of brain pathologies, StO2-MRI could be a valuable and specific imaging biomarker to assess hypoxia in vivo. These results argue for the strength of the StO2-MRI as an imaging modality to be implemented in clinical studies. This is particularly important in the field of neuro-oncology where GBM are known to be heterogeneous in terms of hypoxia and that the detection of hypoxia and its degree should guide patients selection and management as recently advocated. 38
Footnotes
Funding
The author(s) disclosed receipt of the following financial support for the research, authorship, and/or publication of this article: The Centre National de la Recherche Scientifique (CNRS), the Université de Caen-Normandie (UCN), the Conseil Regional de Basse-Normandie (CRBN), the Elen Fund, the European Union-Fonds de Développement Régional (FEDER), l'Europe s'engage en Basse-Normandie and the French National Agency for Research (ANR IMOXY ‘ANR- 11-BSV5-004' and the 'Investissements d'Avenir' ANR-11-LABEX-0018-01).
Declaration of conflicting interests
The author(s) declared no potential conflicts of interest with respect to the research, authorship, and/or publication of this article.
Authors' contributions
SV, ACD, AC, OT and ELB designed the study; ACD, AC, LD, JT and DD performed the data acquisition; SV, OT and ELB performed data analyses and were blinded of the groups; ETM, LB, EP and MB supervised and revised the manuscript. All the authors approved the final version of the manuscript.
References
Supplementary Material
Please find the following supplemental material available below.
For Open Access articles published under a Creative Commons License, all supplemental material carries the same license as the article it is associated with.
For non-Open Access articles published, all supplemental material carries a non-exclusive license, and permission requests for re-use of supplemental material or any part of supplemental material shall be sent directly to the copyright owner as specified in the copyright notice associated with the article.