
Abstract
Fluid transport in the perivascular space by the glia-lymphatic (glymphatic) system is important for the removal of solutes from the brain parenchyma, including peptides such as amyloid-beta which are implicated in the pathogenesis of Alzheimer’s disease. The glymphatic system is highly active in the sleep state and under the influence of certain of anaesthetics, while it is suppressed in the awake state and by other anaesthetics. Here we investigated whether light sheet fluorescence microscopy of whole optically cleared murine brains was capable of detecting glymphatic differences in sleep- and awake-mimicking anaesthesia, respectively. Using light-sheet imaging of whole brains, we found anaesthetic-dependent cerebrospinal fluid (CSF) influx differences, including reduced tracer influx along tertiary branches of the middle cerebral artery and reduced influx along dorsal and anterior penetrating arterioles, in the awake-mimicking anaesthesia. This study establishes that light sheet microscopy of optically cleared brains is feasible for quantitative analyses and can provide images of the entire glymphatic system in whole brains.
Keywords
Introduction
The molecular hallmark of the most common age-related neurodegenerative diseases, namely Alzheimer’s disease (AD) and Parkinson’s disease (PD), is accumulation of endogenously produced proteins, which are neurotoxic upon aggregation.1–4 These proteinopathies are caused, at least in part, by an imbalance between the production and clearance or degradation of protein waste, which appears to be the case for amyloid-beta (Aβ) in AD.5–9 It is estimated that 25% of Aβ of is removed by the cerebrospinal fluid (CSF), while 50% is degraded in the brain and 25% is transported across the blood–brain barrier. 10 Irrespective of the exact percentage of CSF-mediated removal, the fact that Aβ is found in the CSF indicates that CSF plays a role in Aβ clearance.11–13 The capacity by which CSF removes brain-derived solutes is dependent on the exchange of interstitial fluid and CSF, which is facilitated by the dispersion of CSF in the peri-vascular spaces, named glia-lymphatic (glymphatic) clearance.14–16 Only a few molecular drivers of the glymphatic system are known. The main molecular regulator of the glymphatic system is the aquaporin 4 water channel (AQP4), which in the CNS is expressed only in astrocytes and is predominantly localized to vascular-facing cellular processes, called vascular endfeet.15–19 Platelet-derived growth factor B (PDGF-B) also plays a role for development of the glymphatic system, presumably because it is necessary for pericyte development and anchorage of the AQP4 complex to the extracellular matrix molecules produced by pericytes.20–22 Known physiological drivers of the convective motion of CSF in periarterial spaces are voluntary exercise, the systolic phase of the heart beat and the delta wave activity during sleep, which explains why the glymphatic system does not function optimally in the awake state.23–28 The importance of delta-wave activity for glymphatic function is still not fully understood; however, it has been found that the effect of anaesthetics on glymphatic function is linearly correlated with the amount of delta waves produced by a given anaesthetic. 24 Interestingly, the ketamine-xylazine (KX) anaesthetic cocktail induces a brain state and glymphatic function which is comparable to the natural sleep state, 24 , 25 while isoflurane inhibits glymphatics 24 , 29 and leads to re-routing of CSF from the brain to the spinal cord as is observed in the awake state. 30 Prior studies of the glymphatic system have been limited by the low spatial resolution in magnetic resonance (MR) scans, while in vivo optical imaging only provides a small field of view or the dorsal surface of the brain.31–35 Brain slice analysis has been confined to five to six coronal slices as processing entire brains using this method would be extremely laborious and time consuming. 17 , 36 Our main aim with this study was to establish whether light sheet microscopy of optically cleared brains could be used to study glymphatic function and to test the hypothesis that light sheet microscopy data can be used for quantitative analyses. We performed light sheet fluorescence microscopy of optically cleared brains from mice that had received CSF tracer injections while under the influence of KX or isoflurane (ISO) anaesthesia, to mimic the sleep and awake state, respectively, in terms of glymphatic function. For method comparison, the brains were processed using either conventional physical slicing or by optical clearance and light-sheet imaging which provides whole-brain data with higher resolution than MR imaging. We detected an overall reduction in the CSF tracer intensity in the ISO-anaesthetised group compared to KX-anaesthetised mice using both methods; however, the light sheet-generated data were more informative. These experiments establish that light-sheet imaging of CSF tracers is feasible for optical sectioning of entire mouse brains for glymphatic studies and analysis thereof.
Materials and methods
Animals
Adult male C57BL/6 mice (Charles River Laboratories) were used for the experiments. Mice were housed in standard laboratory conditions with a 12-h dark-light cycle, ad libitum access to food and water. All experimental procedures were performed according to ethical approval by the Malmö-Lund ethical Committee on Animal Research (Dnr 5.8.18-08269/2019) and conducted according to the CODEX guidelines by the Swedish Research Council, Directive 2010/63/EU of the European Parliament on the protection of animals used for scientific purposes and Regulation (EU) 2019/1010 on the alignment of reporting obligations. This study complies with the ARRIVE (Animal Research: Reporting in Vivo Experiments) guidelines for reporting of animal experiments.
Anaesthesia
Mice received a single intraperitoneal injection of ketamine (100 mg/kg)/xylazine (20 mg/kg) (KX), or isoflurane (ISO) (induction at 3%, maintained at 2% for the duration of the experiment) in atmospheric air (70.9% N2, 20% O2, 0.1% CO2).
Intracisternal tracer infusion and in vivo imaging
After anaesthesia induction, an incision was made and muscles overlying the back of the skull were reflected laterally to reveal the cisterna magna (CM), as previously described. 37 The core temperature was kept at 37°C using a heat pad connected to a rectal feedback probe. For in vivo imaging, the skin was resected over the whole dorsal cranium. CM injection was carried out with a 30 G dental needle (Carpule, Sopira) connected to a 100 µL Hamilton syringe via PE10 tubing; 10 µL of 1% AlexaFluor647-conjugated bovine serum albumin (BSA-647, Invitrogen) tracer were injected into the CM at 1 µL/min using a KDS Legato 100 single infusion syringe pump. After injection, BSA-647 was allowed to circulate for 30 min. In vivo imaging was performed every minute from the beginning of the injection and for the duration of the 30-min circulation time using a Nikon SMZ25 microscope (see method section: imaging of whole brains and brain slices). Animals were sacrificed by transcardial perfusion or decapitation for the optical tissue clearing and conventional methodology group, respectively.
Optical tissue clearing
Transcardial perfusion with phosphate-buffered saline (PBS) and 4% paraformaldehyde (PFA) was carried out using a peristaltic pump connected to a 25 G needle at a flow rate of 5 mL/min (Watson-Marlow 120 s). Brains were then extracted and post-fixed in 4% PFA overnight. The iDISCO+ protocol was carried out as described by Renier et al.38–41 Briefly, tissue was dehydrated in increasing methanol/H2O series (20%, 40%, 60%, 80%, 100%, 100%, 1 h each), delipidated with methanol/dichloromethane (33%/66% for 3 h) and pure dichloromethane (2 × 15 min), and optically cleared with dibenzyl ether (DBE) for at least seven days prior to imaging.
Light-sheet imaging
Samples from the optically cleared group were imaged using an Ultramicroscope II light-sheet microscope (LaVision Biotech) with a 1.3× LaVision LVMI-Fluor lens (0.105 NA) equipped with a sCMOS camera (Andor Neo, model 5.5-CL3). The excitation wavelength was 640 nm and the emission filter used was 680/30 nm. Brains were imaged immersed in DBE in the transverse orientation at a z-step size of 5 µm with ImspectorPro64 (LaVision Biotec). Several stacks (mosaic acquisition) were taken with 10% overlap to image the entire brain. 3D renditions and movies were created with Arivis Vision 4 D 3.1 (Arivis AG).
Imaging of whole brains and brain slices
Brains from the conventional method group were first imaged whole using a Nikon SMZ25 stereomicroscope with a Plan Apo 0.5× objective (0.08 NA) equipped with an Andor Zyla 4.2 Plus sCMOS camera (Mag-0.75×, Zoom-1.5×). The excitation wavelength was 635 nm using a CoolLED pE4000 LED illumination and the emission filter used was a quadruple bandpass filter. Following slicing with a vibratome (Leica VT1200S) at 200 µm, five slices (−2, −1, 0, +1, +2 relative to bregma) per brain were mounted and imaged (Mag-5×, Zoom-10×) using the Nikon SMZ25.
Analysis of in vivo, whole brain and brain slice images
Tracer influx along pial vessels in dorsal cortex was analysed as the mean intensity images using an ROI of the dorsal cortex on the in vivo time-lapse images. For analysis of non-cleared whole-brain images, ROIs were defined as the cortex, olfactory bulbs and cerebellum/hindbrain and mean tracer intensities of JPEG images were analysed using Fiji. For intensity measurements of brain slices, outputs generated were mean pixel intensity, i.e. mean fluorescence tracer intensity in a manually segmented brain slice.
Analysis of light sheet images
Light sheet-acquired 16-bit TIFF images were analysed using Fiji. 42 Analysis of tracer distribution along the dorsoventral axis was performed by measuring the mean intensity in each of the transverse images in the z-stack in Fiji. To account for differences in total image numbers during statistical analysis, dorsal and ventral halves were defined as 500 most dorsal and ventral images in each stack. To analyse the data in the same orientation as the coronary brain slices, each original transverse image was segmented into 100 regions of interest (ROI) along the anteroposterior axis. Brains were also analysed in halves, and smaller sub-regions by dividing the images or ROIs into five groups of equal size along each respective axis.
For analysis of influx along MCA branches using Imaris, light sheet-generated TIFF images were first converted to Imaris files. The surpass dynamic range was set to 0–32,000. The MCA and its branches were traced using the Imaris filament AutoPath function. For analysis of tracer along penetrating arterioles, 3D renditions performed in Fiji and a 128 pixel piece around bregma were extracted and collapsed into a coronal image. Images were brightness/contrast enhanced (0–10,000 on the original 16-bit image) and using a fixed threshold (120 to 255 on the 8-bit 3D rendition) and the signal was converted to binary signal and analysed using Fiji particle analysis.
Statistics
All data were examined for normality. Student’s t-test was used for pair-wise comparisons of normally distributed data and Mann–Whitney U test for non-normally distributed data. For comparison of more than two groups, two-way ANOVA with Sidak’s or Tukey’s multiple comparison test was carried out. The specific tests used for each experiment are stated in the figure legends. Numbers within square brackets represent mean and 95% confidence intervals.
Results
Conventional methodology detects anaesthetic-induced differences in glymphatic function
Several reports have shown that glymphatic function is as effective in the brain state induced by KX anaesthesia as in the natural sleep state, while glymphatic function in the brain is impaired by ISO. 24 , 30 We first confirmed the effects of KX and ISO anaesthetics on glymphatic function in mice by injecting fluorescent tracer in the cisterna magna. In vivo imaging of CSF tracer influx in the dorsal cortex showed a robust perivascular influx during KX anaesthesia (12.5 [10.6:14.4], Figure 1(a), Suppl. Video 1) and severe suppression during ISO anaesthesia (7.5 [6.9:8.1], Figure 1(b) to (c), Suppl. Video 2). Whole-brain images after PFA fixation showed that CSF tracer intensity at the dorsal surface was approximately half the value in the ISO condition in both the olfactory bulbs (ISO, 8.5 [3.3:13,7]; KX, 16.2 [14.1:18.3]) and cortex (ISO, 9 [6.3:11,7]; KX, 18.2 [16.4:20]) as compared to the KX-anaesthetised group (Figure 1(d) to (g)), suggesting that both glymphatic delivery and efflux around the olfactory bulbs were impaired. A similar difference was observed at the ventral surface of the brain (Figure 1(h) to (k)). Taken together, these data indicate that anaesthetics differentially affect the distribution of CSF and that ISO impairs the anterior-dorsal flow of CSF. The distribution of CSF tracer intensity in the cerebellum and hindbrain did not differ statistically between the groups, likely due to the proximity to the tracer injection site (Figure 1(g) and (k)). To investigate tracer penetration into the parenchyma, brains were sliced in the coronal plane and analysis showed that overall CSF tracer influx into the brain was 30% greater in the KX group (10.9 [10.4:11.3]) compared to the ISO group (7.8 [7.2:8.4]) (Figure 2(a) to (e)). Correspondingly, the difference was statistically significant in each of the 5 distances from bregma analysed (Figure 2(f)).
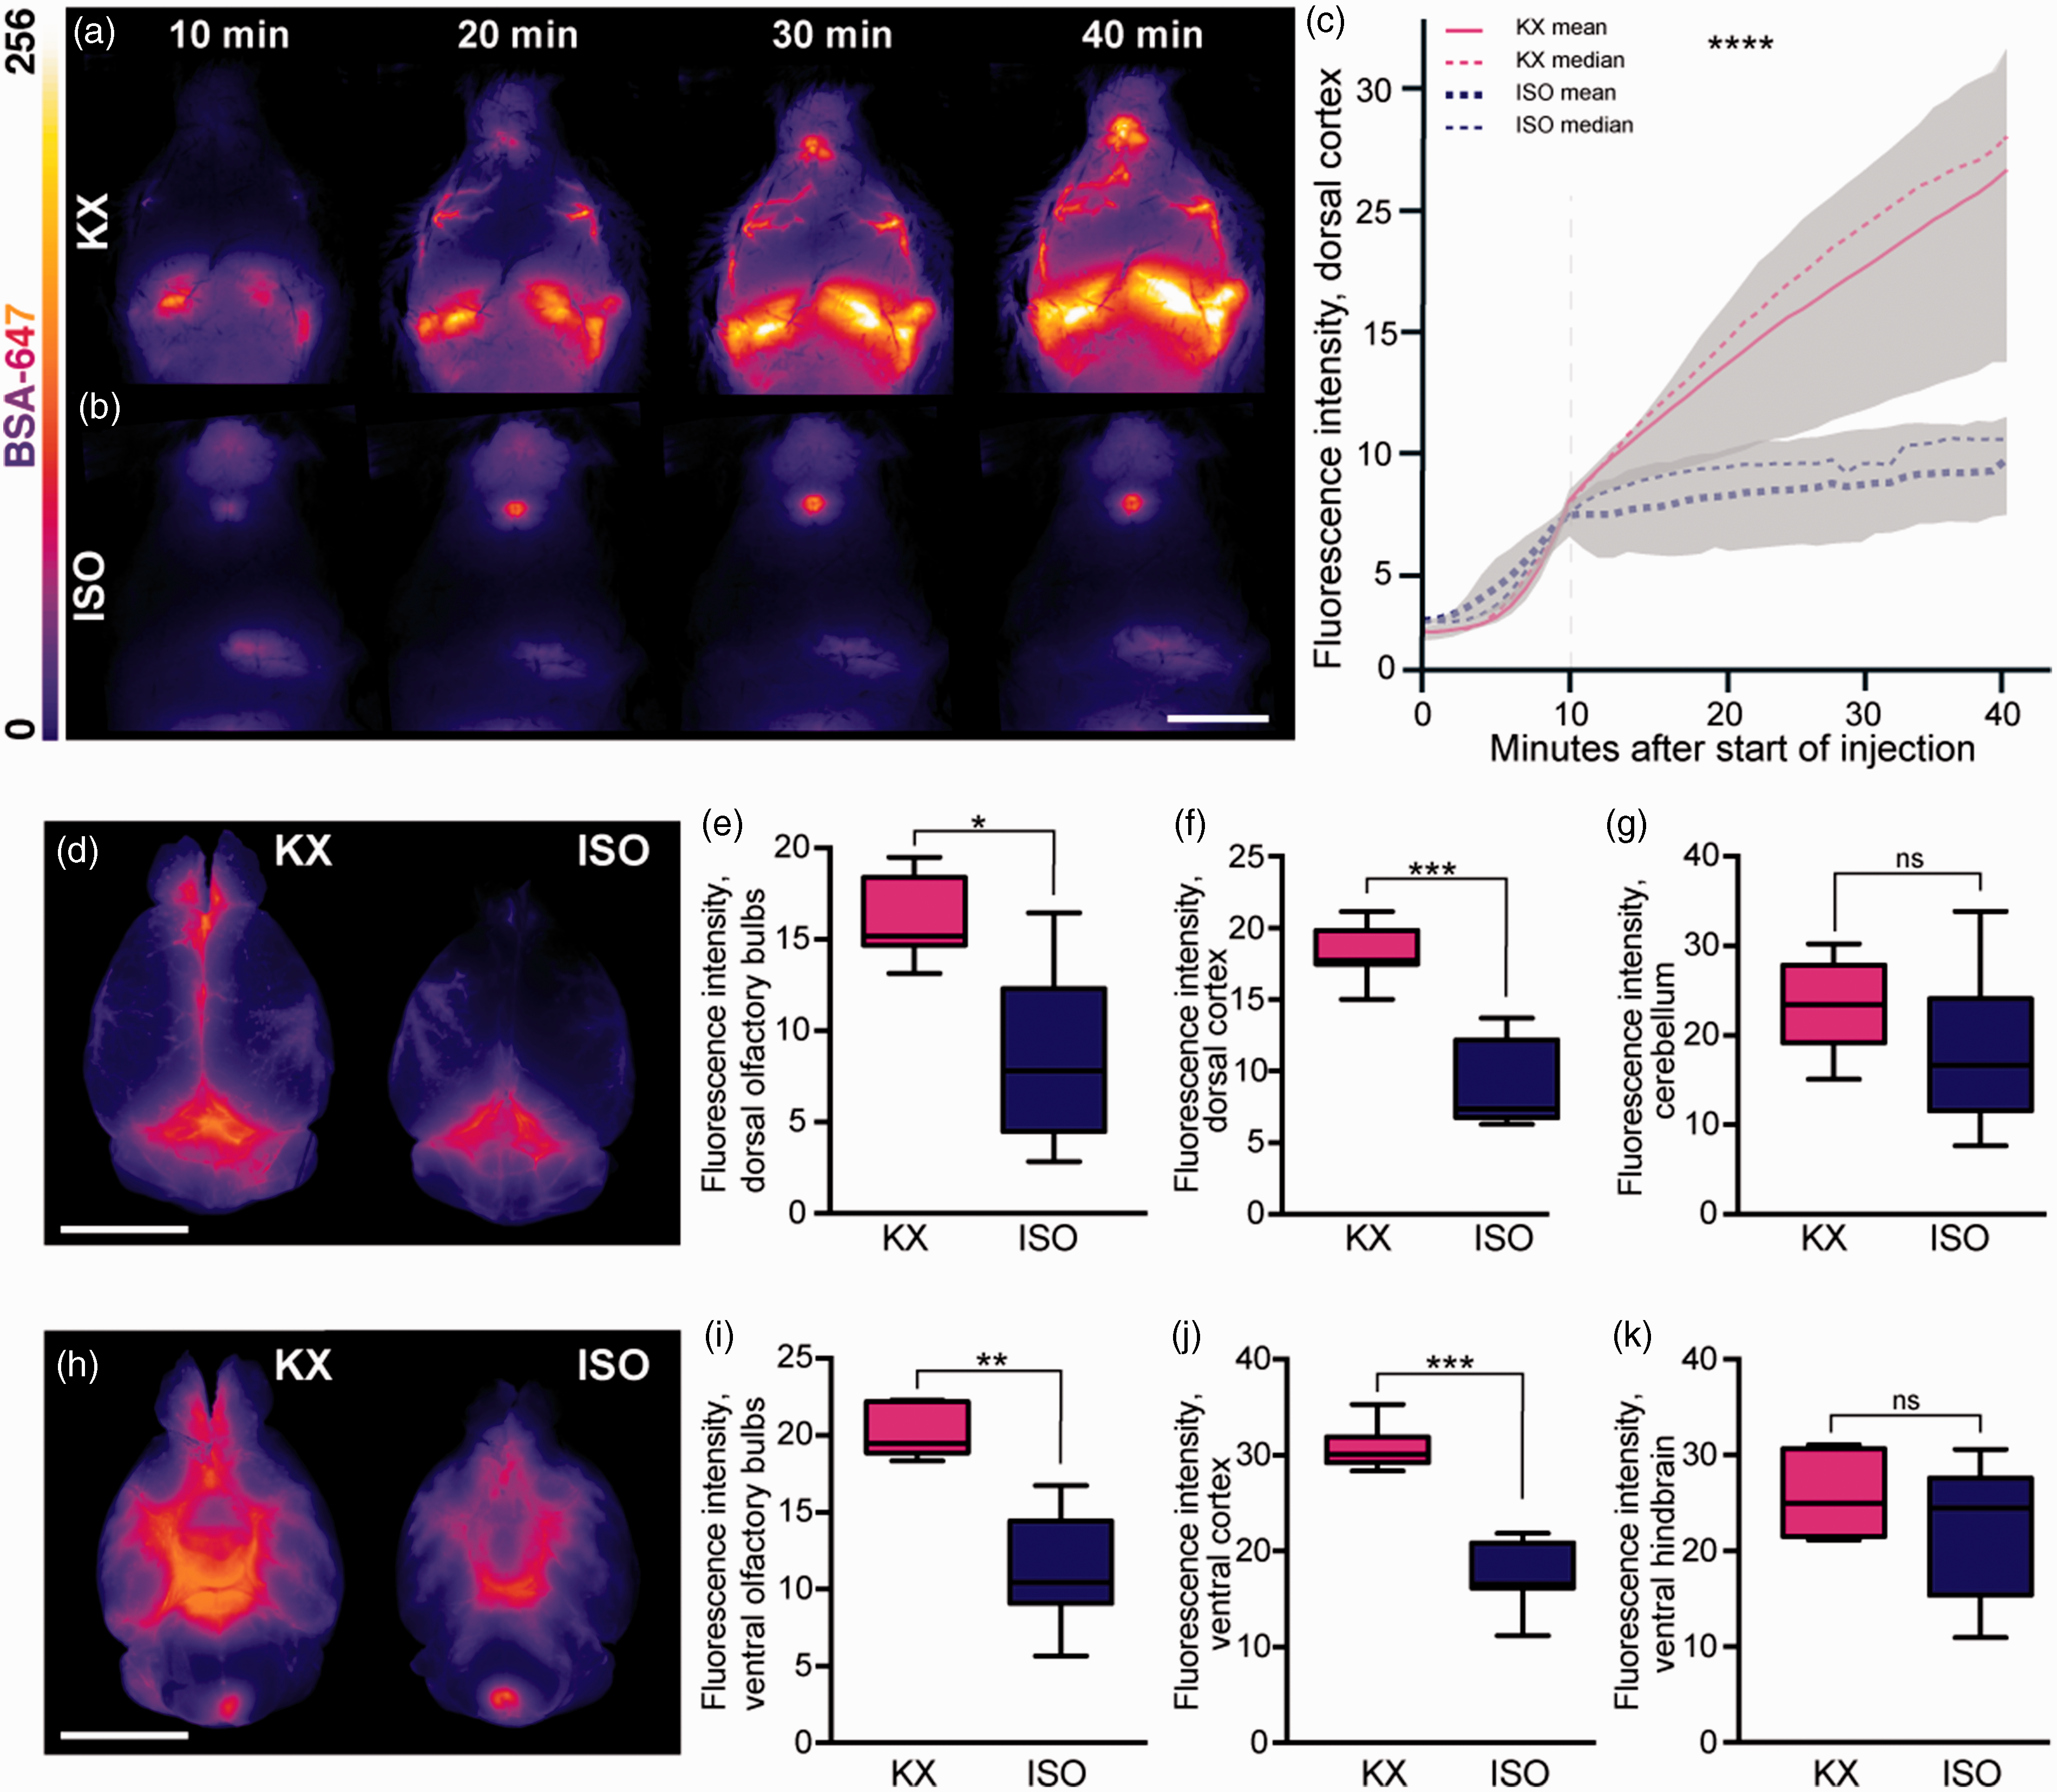
CSF tracer influx is robust both in vivo and ex vivo in KX anaesthesia. Representative images of whole-brain dorsal view in vivo 10, 20, 30 and 40 min after CM injection under (a) KX-anaesthesia and (b) ISO-anaesthesia. (c) Mean tracer intensity in vivo across dorsal cortical surface in KX- and ISO-anaesthesia groups from start of injection of AlexaFluor647-conjugated bovine serum albumin (BSA-647) in the cisterna magna. Plotted lines represent mean and median, greyed areas represent interquartile range (25–75%). Grey dashed vertical line represents when CM injection ended. N = 5 for both KX and ISO. (d) Representative images of whole-brain dorsal surface in KX- and ISO-anaesthetised mice. The intensity of the CSF tracer in (e) dorsal surface of olfactory bulbs, dorsal (f) cortex, and (g) cerebellum. (h) Representative images of the ventral surface of whole brain in KX- and ISO-anaesthetised mice. The intensity of tracer in ISO compared to KX-anaesthetised mice in (i) olfactory bulbs, (j) cortex, and (k) ventral hindbrain. N=7 for both KX and ISO. *p < 0.05, **p < 0.01, ***p < 0.001, ****p < 0.0001 with Mann–Whitney U Test for pair-wise comparisons and two-way ANOVA for time-lapse data. Scale bars = 6 mm. Box plots represent minimum, first quartile, median, third quartile, and max values.
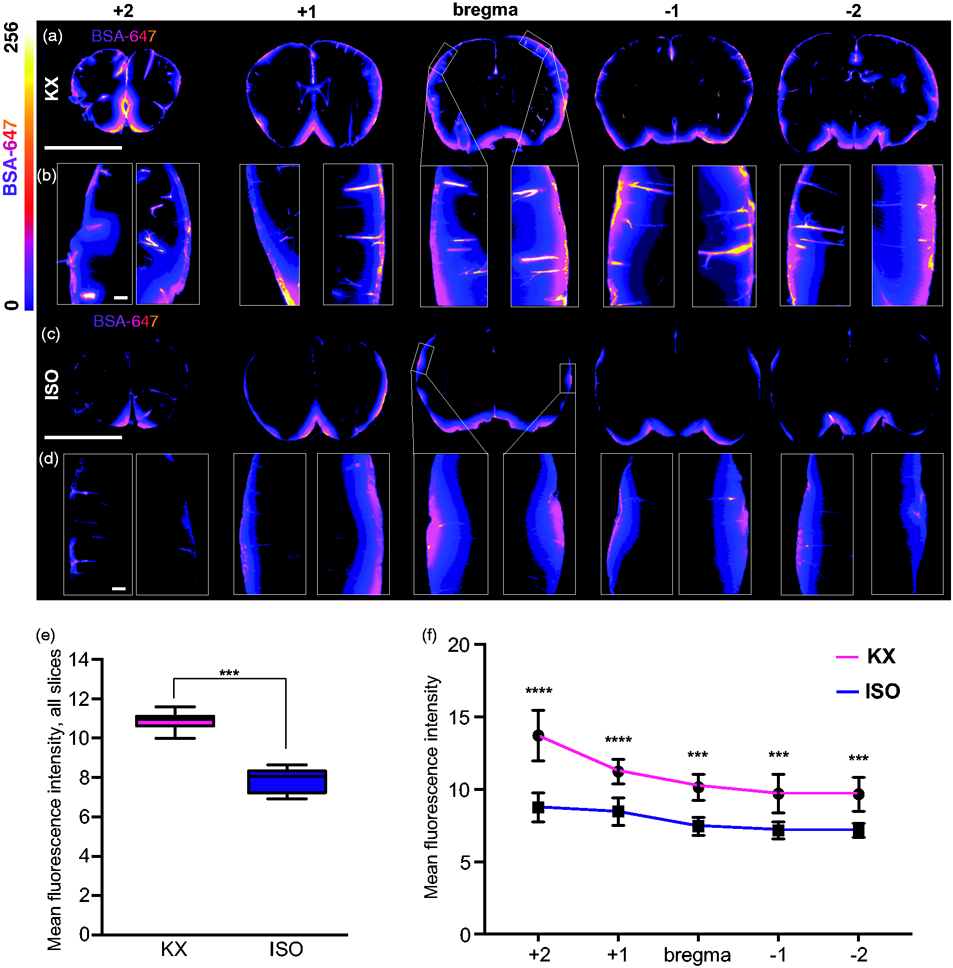
KX increases CSF tracer penetration. (a) Representative images of coronal brain slices KX-anaesthetised mice at 5 different locations (+2, +1, 0, −1, −2 mm from bregma) injected with AlexaFluor647-conjugated bovine serum albumin (BSA-647). (b) Magnified view of CSF tracer penetration into cortex at five locations (+2, +1, 0, −1, −2 mm from bregma) from each hemisphere. (c) Representation of coronal brain slices from ISO-anaesthetised mice at five different locations (+2, +1, 0, −1, −2 mm from bregma). (d) Magnified view of CSF tracer penetration into cortex at five locations (+2, +1, 0, −1, −2 mm from bregma) from each hemisphere. (e) Quantification of BSA-647 CSF tracer influx in KX- and ISO-anaesthetized brains, averaged across all five brain slices collected, showing less influx in ISO-anaesthetised mice. Mann–Whitney U Test. (f) Differences in slice tracer intensity by region (+2, +1, 0, −1, −2 mm from bregma). The fluorescence intensity of the CSF tracer was lower in ISO- mice compared to KX-anaesthetised mice across all positions relative to bregma. N = 7 for both KX and ISO. ***p < 0.001 with two-way ANOVA, Sidak’s multiple comparison test. Scale bars = 4 mm and 100 µm for whole-brain slices and insets, respectively. Box plots represent minimum, first quartile, median, third quartile, and max values. XY plot represents mean ± SD.
Light-sheet imaging of cleared brains yields additional glymphatic data
In order to generate CSF influx data from the entire brain, we then performed optical clearing followed by light sheet fluorescence microscopy. By dehydrating, delipidating and matching the refractive index with optical clearing agent as described in the iDISCO+ protocol, we obtained homogenously transparent brains (Figure 3(a) to (d)). Using a light sheet microscope with alternating bilateral illumination, approximately 1000 transverse z-planes were acquired for each brain with a 5 µm step size of the light plane. Tracer distribution and mean intensity were analysed along anteroposterior and dorsoventral axes (Figure 3(e)). Common for the KX- and the ISO-anaesthetised groups were higher tracer concentrations in ventral brain regions; however, that difference narrowed in more ventral regions (Figure 3(f) to (j)). When plotting the data at such a detailed spatial resolution, it was also possible to pinpoint where in the brain the difference between groups began to narrow, which was around slice number 560 (dorsal–>ventral) (Figure 3(g)). Interestingly, on the anteroposterior axis, the KX group tended to have higher tracer concentrations in more anterior brain regions, while in the ISO group the highest tracer intensities aggregated towards posterior brain regions, constituting an additional result showing that the CSF tracer moves further from the injection site in KX- compared to ISO-anaesthetised mice (Figure 3(i) to (j)).
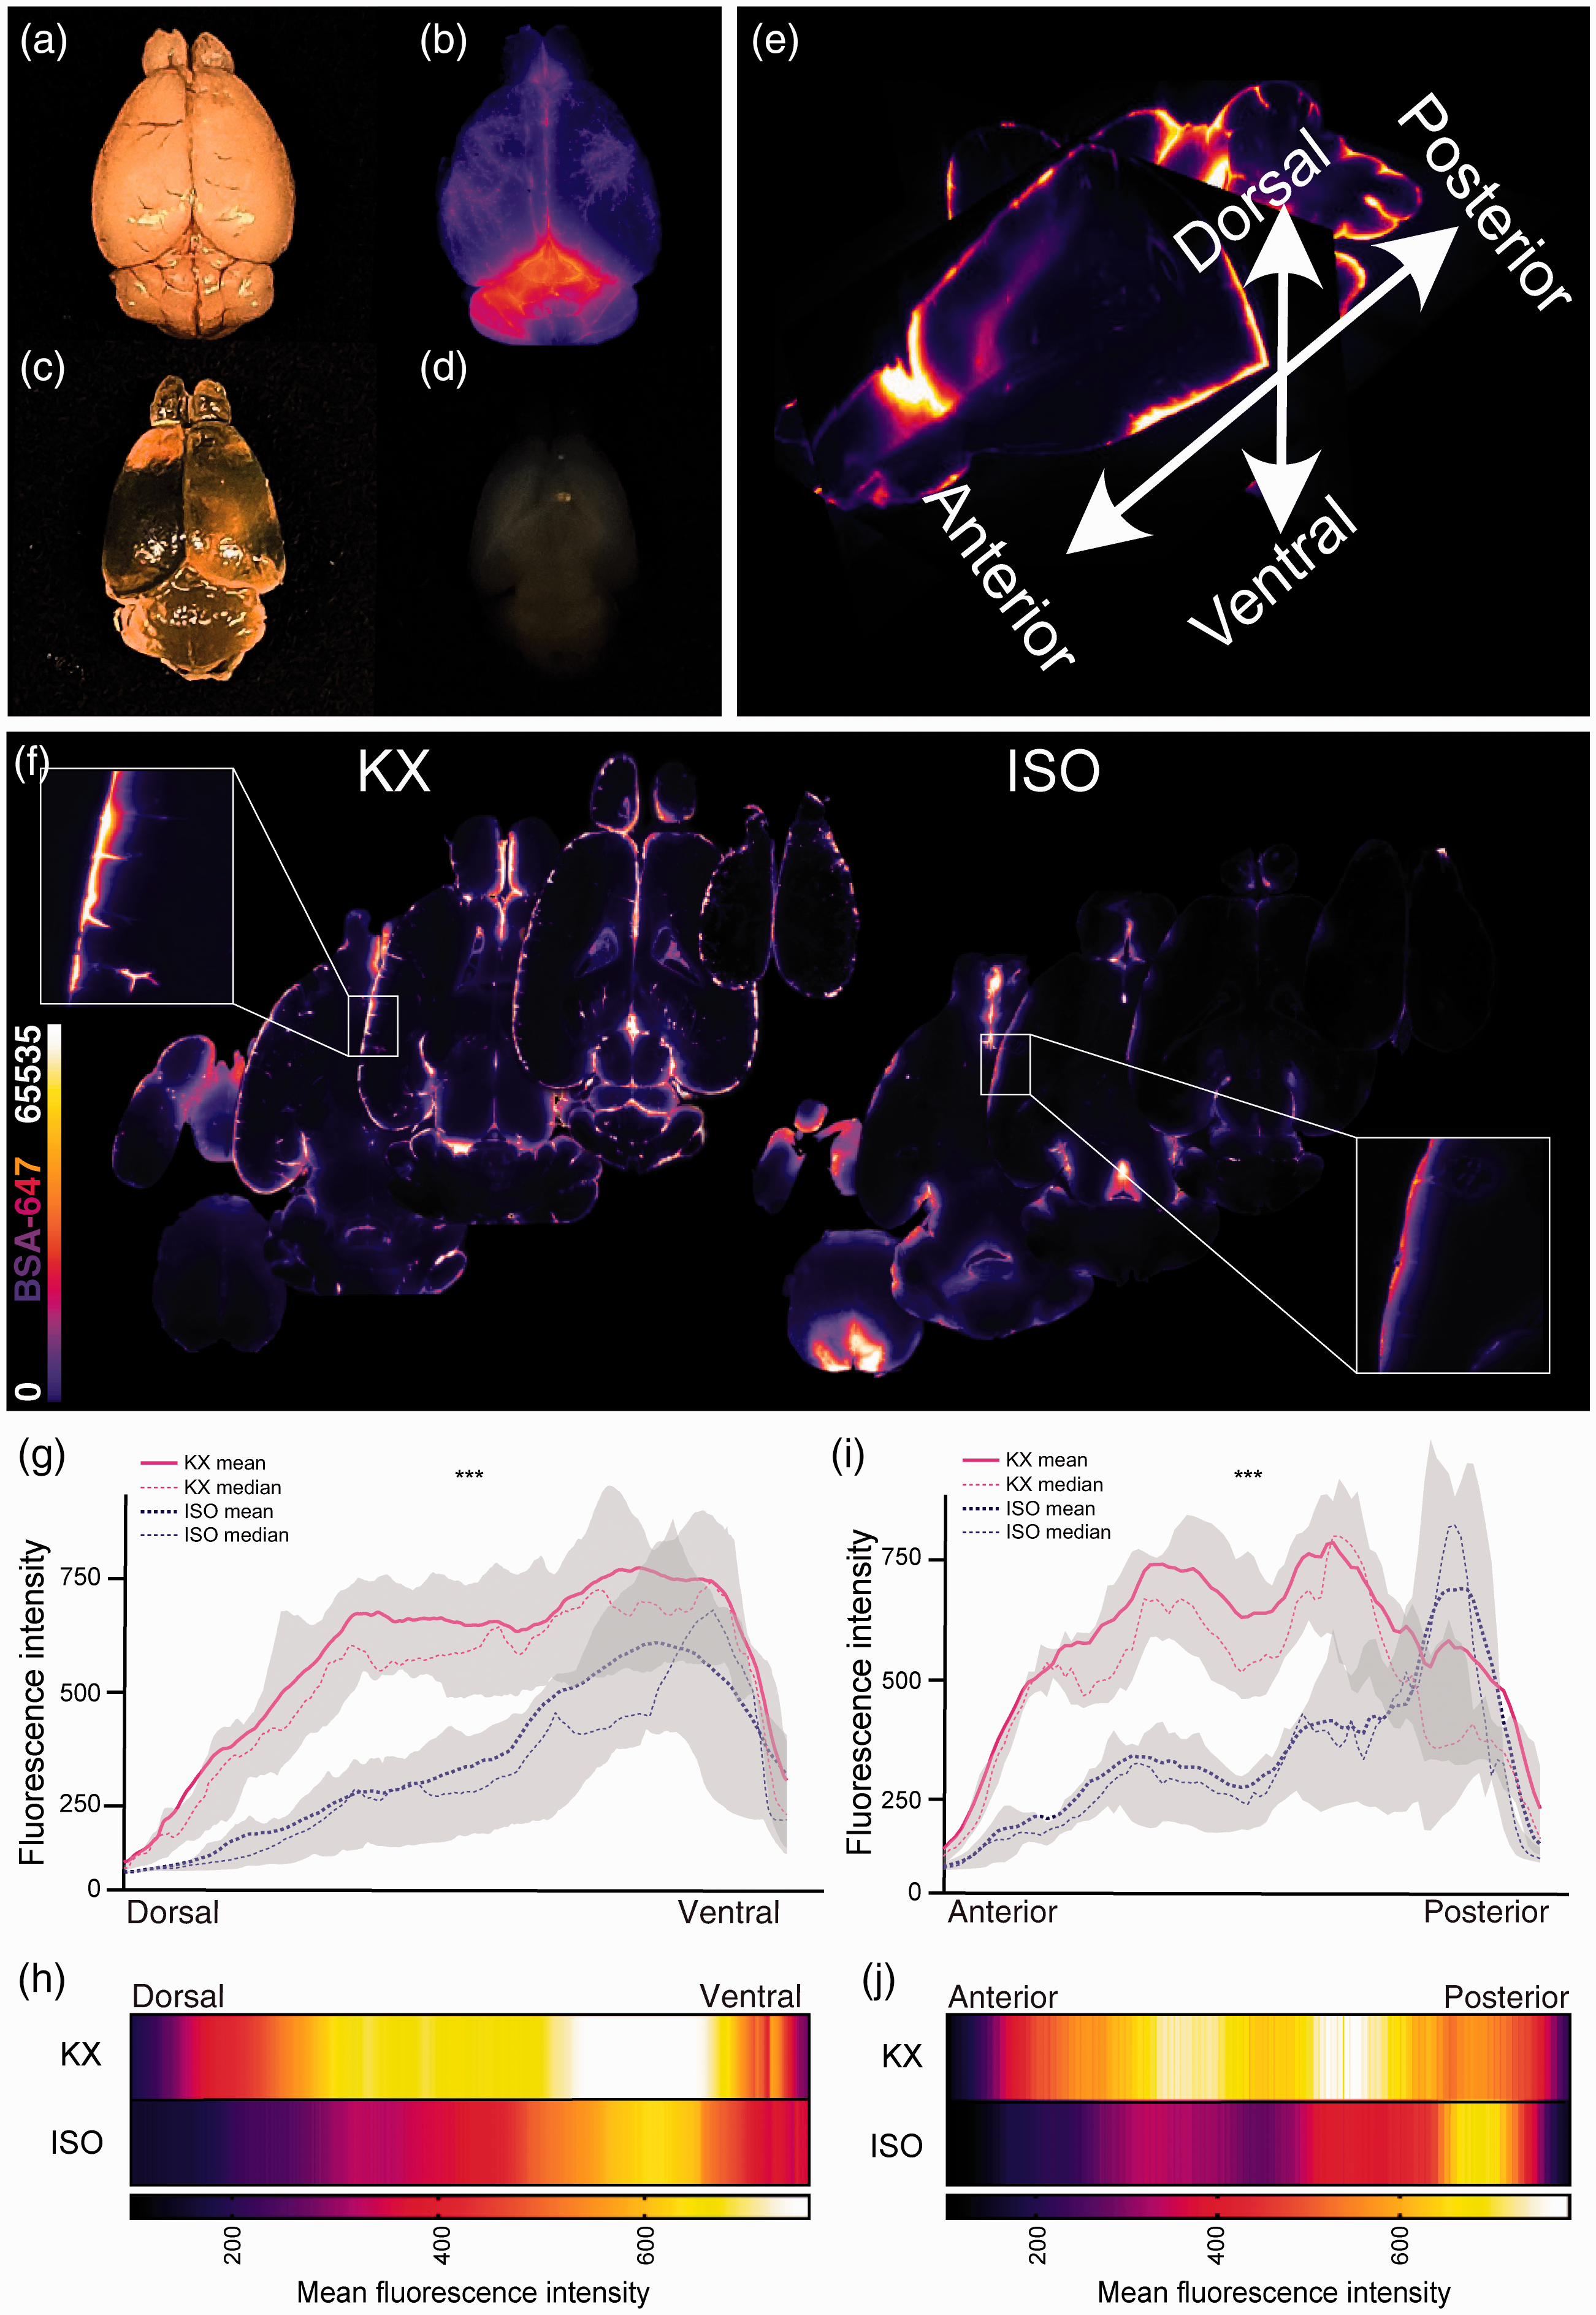
Light-sheet imaging yields high resolution data along multiple axes. Representative image of whole mouse brains (a) before clearing, (b) CSF tracer signal, AlexaFluor647-conjugated bovine serum albumin (BSA-647), (c) through air after optical clearing, and (d) in DBE after optical clearing. (e) Mouse brain reconstruction from light sheet microscopy showing axes of analysis. (f) Representative transverse optical slices from KX- and ISO-anaesthetised mice. (g) Mean CSF tracer intensity along dorsoventral axis of KX- and ISO-anaesthetised mice divided in 1000 ROIs along the axis showing higher tracer intensities in ventral regions of both groups. The tracer intensities were lower in ISO-anaesthetised mice across the dorsoventral axis. (h) Heatmap of mean fluorescent intensity along dorsoventral axis in KX- and ISO-anaesthetised mice. Mean intensities on the color scale were adjusted to the data range from (g). (i) Mean CSF tracer intensity along anteroposterior axis of KX and ISO cohorts divided in 100 ROIs along the axis. The mean tracer intensities were higher in anterior regions of the KX-anaesthetised mice, while the mean tracer intensities were higher in the posterior region of ISO-anaesthetised mice. The tracer intensities were lower in ISO-anaesthetised mice across the anteroposterior axis. (j) Heatmap of mean fluorescence intensity along anteroposterior axis in KX and ISO cohorts. Mean intensities on the color scale were adjusted to the data range from (i). N = 10 and 9 for KX and ISO, respectively. ***p < 0.001 with two-way ANOVA for both dorsoventral and anteroposterior axes. Plotted lines represent mean and median and greyed areas represent interquartile range (25–75%).
Optical slice images from the entire brain were used for qualitative investigations, both as three-dimensional reconstructions (Suppl. Videos 3 and 4) and two-dimensional animations of all the images along the dorsoventral axis (Suppl. Videos 5 and 6). This systems-level view potentiates insights as to where exactly more detailed regional analyses would be worth pursuing. To further exhibit this potential of light-sheet imaging, 3D reconstructions are displayed at three given views: lateral view, inferior view, and fronto-lateral view (Figure 4(a) to (i)). Perivascular influx to the dorsal brain half yielded tracer intensities more than twice as high in the KX cohort (435.0 [419.5:450.5]) versus the ISO cohort (194.2 [188.5:199.8]) (Figure 4(j)), while in ventral regions intensities in the KX group were approximately 20% higher (ISO, 506.7 [499.7:513.6]; KX, 678.7 [669.0:688.3]) (Figure 4(k)). Similar differences were observed along the anteroposterior axis with anterior KX intensities more than double those in the ISO cohort (ISO, 250.0 [228.6:271.4]; KX, 543.6 [491.6:595.5]) (Figure 4(l)), while in posterior brain regions, KX intensities were approximately 20% greater (ISO, 435.8 [395.0:476.6]; KX, 599.3 [561.1:637.6]) (Figure 4(m)).
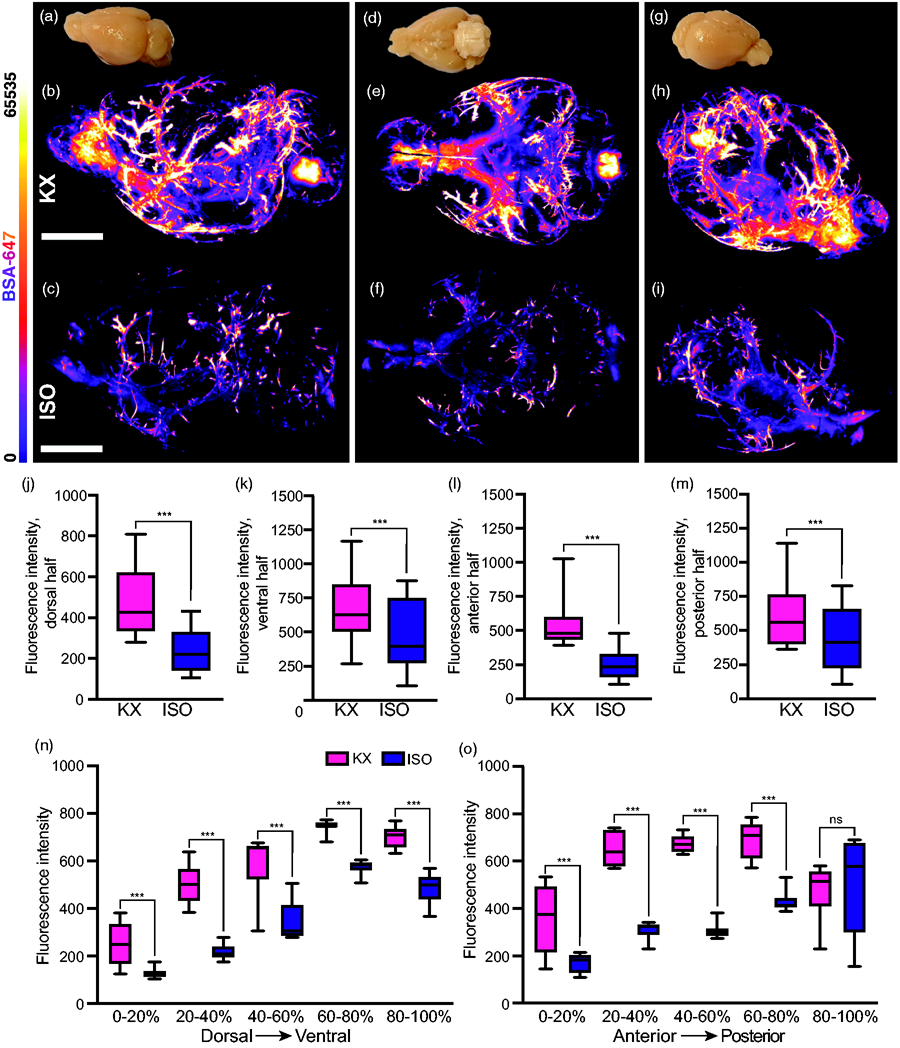
Detection of region-specific differences in glymphatic function using light-sheet imaging of optically cleared brains. Representative images of lateral view of (a) un-cleared mouse brain, 3D reconstruction of CSF tracer in an (b) KX-anaesthetised and (c) ISO-anaesthetised mouse brain. Representative images of inferior view of (d) un-cleared mouse brain, 3D reconstruction of CSF tracer in an (e) KX-anaesthetised and (f) ISO-anaesthetised mouse brain. Representative images of fronto-lateral view of (g) un-cleared mouse brain, 3D reconstruction of CSF tracer in an (h) KX-anaesthetised and (i) ISO-anaesthetised mouse brain. Quantifications of CSF tracer intensities in (j) dorsal, (k) ventral, (l) anterior, (m) and posterior halves of brain from KX- and ISO-anaesthetised mice. Two-way ANOVA, Tukey’s multiple comparison test. N = 10 and 9 for KX and ISO, respectively. n = 500 for both groups. (n) Quantifications of mean CSF tracer intensities in five 20 percentile regions across the dorsoventral axis. Two-way ANOVA, Tukey’s multiple comparison test, N = 10 and 9 for KX and ISO, respectively. n = 200 for both groups. (o) Quantifications of mean CSF tracer intensities in five 20 percentile regions across the anteroposterior axis. N = 10 and 9 for KX and ISO, respectively. n = 20 for both groups. ***p < 0.001 with two-way ANOVA, Tukey’s multiple comparison test. Scale bar = 6 mm. Box plots represent minimum, first quartile, median, third quartile, and max values.
Next, in order to derive more detailed changes, we divided the data into five regions along each axis, with each sequential segment representing 20% of the imaging data. This is similar to what can be obtained with slice analysis, although brains would have to be collected for either coronal or transverse slicing and light sheet data only require one brain to obtain analysis in multiple orientations. With respect to the dorsoventral axis, we found significantly higher tracer intensities in all five regions in the KX group with the biggest difference were found in the second-most dorsal region (Figure 4(n)). Along the anteroposterior axis regions, the four most anterior regions yielded statistically significant differences in tracer intensity between the groups, while the most posterior region of the brain encompassing the cerebellum, showed no difference (Figure 4(o)).
We then tracked perivascular tracer influx around the MCA using Imaris software (Figure 5(a)). There was no difference in the influx along secondary branches (ISO, 3.7 [3.4:5.8]; KX, 4.6 [3.4:5.8]; however, there was influx along 4-fold more tertiary branches of the MCA (ISO, 2.1 [0.6:3.6]; KX, 8.1 [6.9:9.3]) and also the length of influx along tertiary branches was greater in the KX-anaesthetised mice compared to ISO-anaesthetised mice (ISO, 2767 [342.1:5193]; KX, 11618 [9975:13261]) (Figure 5(b) to (d)). From 3D renditions, a segment surrounding bregma was extracted and collapsed into a coronal image (Figure 5(e) to (i)). Using a fixed threshold, the signal was converted to binary signal and analysed (Figure 5(g) and (j)). Analysis of CSF tracer influx along penetrating the pial surface showed no difference in the average size of vessels with perivascular influx (ISO, 172.3 [73.8:270.8]; KX, 126.9 [72.1:181.8] (Figure 5(k) to (m)); however, both the number of vessels with influx and the percentage of tracer coverage was dramatically lower in the dorsal half of the ISO-anaesthetised mice (ISO, 0.4 [0.1:0.7]; KX, 2.6 [1.6:3.5]) (Figure 5(n) to (s)).
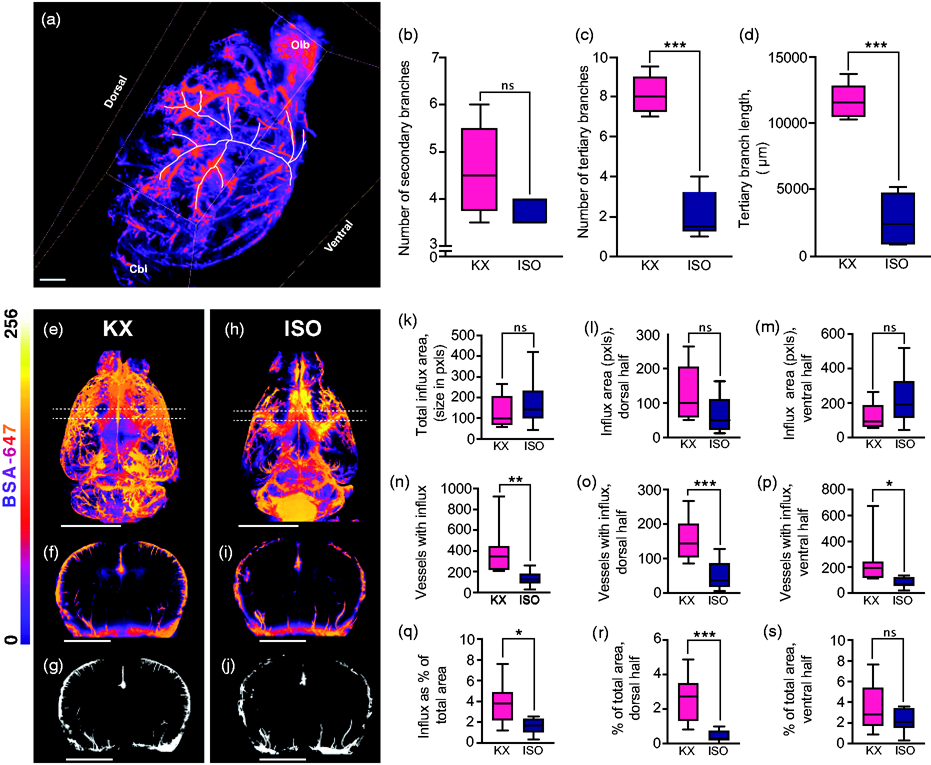
Light sheet microscopy data of influx along MCA and penetrating arterioles. (a) Representative image of right MCA tracing from Imaris. Scale bar = 1 mm. (b) Mean number of secondary MCA branches in KX- and ISO-anaesthetised mice brains. (c) Mean number of tertiary MCA branches in KX- and ISO-anaesthetised mice brains. (d) Mean total length of tertiary MCA branches in KX- and ISO-anaesthetised mice brains. N = 5 for both KX and ISO. ***p < 0.001 with Student’s t-test. Scale bar = 1000 µm. Box plots represent minimum, first quartile, median, third quartile, and max values. (e) Three-dimensional reconstruction of KX anaesthetised mouse. Dashed lines present the coronal section. Scale bar = 6 mm. (f) Three-dimensional reconstruction of 128px thick coronal section around bregma (5% of horizontal image height) of KX-anaesthetised mouse. Scale bar = 6 mm. (g) Thresholded, binary representation of the coronal segment of a KX-anaesthetised mouse. Scale bar = 6 mm. (h) Three-dimensional reconstruction of ISO-anaesthetised mouse. Scale bar = 6 mm. (i) Three-dimensional reconstruction of 128px thick coronal section coronal section around bregma (5% of horizontal image height) of ISO-anaesthetised mouse. Scale bar = 6 mm. (j) Thresholded, binary representation of the coronal segment of an ISO-anaesthetised mouse. Scale bar = 6 mm. Average size of the vessel segments with perivascular influx (k) in the whole brain, (l) in the dorsal half and (m) the ventral half. N = 10 for KX, N = 8 for ISO. Number of vessel segments with perivascular influx (n) in the whole brain, (o) in the dorsal half and (p) the ventral half. *p < 0.5, **p < 0.01, ***p < 0.001 with Student’s t-test. N = 10 for KX, N = 8 for ISO. Area covered by perivascular influx as a percentage of the total area for (q) the whole slice, (r) the dorsal half, (s) and ventral half. *p < 0.5, ***p < 0.001 with Student’s t-test. N = 10 for KX, N = 8 for ISO.
In summary, the data generated using light sheet microscopy revealed that glymphatic influx was affected mostly in the dorsal and anterior parts of the brain by ISO-anaesthesia, as opposed to a general impairment of glymphatic function which has been described in other studies.
Discussion
Opportunities and advantages with optical clearing and light sheet microscopy to study glymphatic function
Since its discovery in 2012, the methods employed in the field of glymphatics have expanded, from the initial 2-photon in vivo and brain slice imaging to include MR imaging, and epifluorescence imaging of the dorsal cerebrum through an intact skull. 15 , 16 , 20 , 25 ,33–36, 43 Hitherto, a major limitation in investigating the glymphatic system has lied in the low resolution of the data that was generated with whole-brain scans such as MRI or the lack of whole-brain data generated with higher resolution optical imaging modalities such as 2-photon microscopy. Previous studies using light microscopy have relied on a half-dozen 100 µm slices of the brain to assess differences in glymphatic function which is a system presumed to be active on a global brain level, thus representing significant under-sampling. 16 , 20 , 24 , 25 , 36 Light-sheet imaging is advantageous as it facilitates a sufficiently high-resolution imaging of the entire brain in a single imaging session. Having a dataset that amounts to the whole brain when reconstructed allows for detailed investigations of glymphatic function both along anteroposterior and dorsoventral planes, giving insight into subtle regional differences. Analyses of light sheet images can be expanded further by generating even smaller regions of interest. Development of algorithm-based analysis could significantly expand the scope of analysis in many different directions. This study also highlights the need for development of segmentation software to further delineate more specific differences in perivascular CSF distribution. Another important aspect of this finding is that it enables the global extent of the glymphatic system to be accounted for when modelling CSF dynamics. Optical clearing can be challenging to master, especially when antibody labelling is required. However, the advantage of glymphatic studies is that the signal comes from tracer in the CSF and therefore the challenging antibody labelling step can be avoided. 37 , 38 , 40 , 41 In this way, the combination of CM injection with brain clearing and light-sheet imaging is a feasible alternative to the conventional ex vivo slice imaging method at a similar time cost. In fact, the cost of materials for clearing a single brain is approximately 4€, involved little manual work and it took 25 min to image the entire brain using the light sheet microscope. In comparison, manual brain slicing and microscopy of slices takes approximately 2 h of per brain in order to obtain five to six different brain slices. Due to the incubation times in different solutions, the optical clearing protocol is 48 h long, however, with about ¼ hands-on processing time. Variability in light-sheet acquired images was higher when considering single images compared to brain slices, possibly due to slight difference in shrinking, or handling aspects such as slight variation in positioning the brain or defining the first and last image slice. However, after segmentation into, e.g., five regions, the variability of light sheet data was similar to that of physical brain slices, indicating a similar sensitivity. It would also be of great benefit to explore how the newly described whole body clearing protocol could be utilised to understand how and where CSF escapes the cranial vault. 41
Drawbacks of light sheet microscopy
One drawback is the increased demands for storage, and computational power for data handling and analysis. To mitigate this challenge, larger light sheet step sizes can be applied but at the cost of resolution. A potential caveat is that optimal optical clearance requires transcardial perfusion with PFA, which has shown to collapse the perivascular space and momentarily reverse the tracer flow. 23 However, in this study, we found similar differences between the KX and the ISO anaesthesia using the decapitated conventional slice method versus the transcardially perfused light sheet method. 24
Conclusion
Herein we have demonstrated that the glymphatic system is active on a global brain level and additionally validated the use of optical clearing coupled to light-sheet microscopy as a new viable tool for studying the glymphatic system. This represents the first study to show the brain-wide extent of the glymphatic system, defined by the entrance of CSF tracers into the perivascular space throughout the brain using light sheet microscopy. This solidifies the new field of glymphatic research, by showing that perivascular CSF transport is pervasive and not a sporadic phenomenon.
Supplemental material for this article is available online.
Footnotes
Acknowledgements
We thank Dr. Malin Parmar, Dr. Anders Björklund and MULTIPARK for the Light Sheet Microscopy facility at Lund University Medical Faculty. We thank Jonas Ahlstadt from Lund University Bioimaging Center (LBIC) for access to and support regarding Imaris.
Authors’ contributions
NBB, TMK, and IL designed the experiments, NBB, TMK, BM, and MP performed the experiments, NBB, TMK, and IL analysed the data and made the figures, NBB, TMK, NS and IL wrote the manuscript, IL contributed with reagents.
Funding
The author(s) disclosed receipt of the following financial support for the research, authorship, and/or publication of this article: This work was funded by the Knut and Alice Wallenberg Foundation, Torsten Söderberg Foundation, the Crafoord Foundation, and the Swedish Research Council.
Declaration of conflicting interests
The author(s) declared no potential conflicts of interest with respect to the research, authorship, and/or publication of this article.
Supplemental material
Supplemental material for this article is available online.
References
Supplementary Material
Please find the following supplemental material available below.
For Open Access articles published under a Creative Commons License, all supplemental material carries the same license as the article it is associated with.
For non-Open Access articles published, all supplemental material carries a non-exclusive license, and permission requests for re-use of supplemental material or any part of supplemental material shall be sent directly to the copyright owner as specified in the copyright notice associated with the article.