
Abstract
PET hypoxia imaging can assess tissue viability in acute ischemic stroke (AIS). [18F]FMISO is an established tracer but requires substantial accumulation time, limiting its use in hyperacute AIS. [64Cu]CuATSM requires less accumulation time and has shown promise as a hypoxia tracer. We compared these tracers in a M2-occlusion model (M2CAO) with preserved collateral blood flow. Rats underwent M2CAO and [18F]FMISO (n = 12) or [64Cu]CuATSM (n = 6) examinations. [64Cu]CuATSM animals were also examined with MRI. Pimonidazole was used as a surrogate for [18F]FMISO in an immunofluorescence analysis employed to profile levels of hypoxia in neurons (NeuN) and astrocytes (GFAP). There was increased [18F]FMISO uptake in the M2CAO cortex. No increase in [64Cu]CuATSM activity was found. The pimonidazole intensity of neurons and astrocytes was increased in hypoxic regions. The pimonidazole intensity ratio was higher in neurons than in astrocytes. In the majority of animals, immunofluorescence revealed a loss of astrocytes within the core of regions with increased pimonidazole uptake. We conclude that [18F]FMISO is superior to [64Cu]CuATSM in detecting hypoxia in AIS, consistent with an earlier study. [18F]FMISO may provide efficient diagnostic imaging beyond the hyperacute phase. Results do not provide encouragement for the use of [64Cu]CuATSM in experimental AIS.
Keywords
Introduction
Acute ischemic stroke (AIS) causes cellular hypoxia due to a decrease in the oxygen supplied to affected tissue regions.1,2 Hypoxia may ultimately lead to cell swelling and necrosis if oxygen levels are inadequate to sustain cellular adenosine triphosphate (ATP) production. 2 The revascularization of viable tissue regions suffering from perfusion deficit, i.e. the ischemic core-perfusion mismatch, is now an established treatment of AIS when supported by diagnostic imaging such as computerized tomography (CT) or magnetic resonance imaging (MRI). 3 However, criticism has been directed at perfusion imaging, with reports of a tendency to underestimate the fraction of the perfusion deficit made up by benign oligemia rather than ischemic penumbra.4,5 This is even more relevant in patients with suspected chronic cerebral hypoperfusion. Moreover, perfusion imaging does not provide a direct visualization of the penumbra considering that the accumulation of tissue injury is dependent both on the severity and on the duration of the perfusion deficit. 6
There is currently no method for measuring the partial pressure of oxygen in brain tissue in clinical settings. 7 Oxygen-15 (15O) positron emission tomography (PET) provides a gold standard with which to measure oxygen extraction fraction but is cumbersome and clinically unavailable, at least in the hyperacute setting. 8 Polargraphic electrodes detect oxygen concentrations electrochemically but are highly invasive and limited to superficial structures. 9 Surrogate measures such as blood oxygen level dependent MRI and near infra-red spectroscopy are limited respectively by the need for several examinations 10 and a restriction to superficial structures.7,11 In comparison, PET performed with hypoxia tracers such as [18F]fluoromisonidazole ([18F]FMISO) may identify ischemic yet viable tissue and has the advantage of requiring only a single examination. 12 [18F]FMISO diffuses freely across cell membranes and undergoes bioreduction in the intracellular environment. In normoxic conditions [18F]FMISO is immediately reoxidized, but in cells suffering hypoxia it undergoes further bioreduction that leaves it irreversibly trapped in the intracellular compartment.12–14 [18F]FMISO is currently the most investigated hypoxia tracer and has been employed to identify hypoxic yet viable tissue in experimental 15 as well as in human AIS. 16 However, [18F]FMISO requires a considerable time of cellular accumulation between administration and the subsequent examination. This significant drawback limits the use of [18F]FMISO in the hyperacute phase of AIS when rapid diagnosis and intervention are crucial to preserve tissue-at-risk. 15 In contrast, Cu-diacetyl-bis(N4- methylthiosemicarbazone) ([64Cu]CuATSM) 17 requires less accumulation time and has shown promise in cardiac hypoxia,18,19 AIS, 20 oncological imaging21–23 and stroke-like episodes caused by mitochondrial disease. 24 [Cu]CuATSM diffuses freely across the cell membrane and is reduced to Cu(I)-ATSM. In normoxic cells, the Cu(I)-ATSM compound is rapidly re-oxidized into Cu(II)-ATSM and washes out from the cell, whereas in cellular hypoxia it becomes irreversibly trapped.18,25 In 2013, a study by Williamson et al. 26 examined [64Cu]CuATSM in a stroke model with negative results in a small number of animals. However, the potential benefits of [64Cu]CuATSM make it worthwhile to re-examine the tracer in a larger number of animals in order to further elucidate if the tracer may provide added diagnostic value in the context of AIS. Accordingly, the objective of this study was to compare PET tracers [18F]FMISO and [64Cu]CuATSM in a middle cerebral artery M2-segment occlusion model (M2CAO). The M2CAO model has been developed to simulate the pathophysiological conditions, including preserved flow in convexity collaterals, seen in AIS patients suitable for acute intervention. 27 , 28 Furthermore, we aimed to profile the cellular processes that provide the basis for increased PET hypoxia tracer uptake. We utilized pimonidazole, a hypoxic probe belonging to the same nitroimidazole group of compounds as FMISO, to examine the magnitude and spatial distribution of hypoxia in neurons and astrocytes through histological immunofluorescence (IF) analysis.
Materials and methods
The data that support the findings of this study are available from the corresponding author on reasonable request.
Study design
Please see Figure 1 for an illustrated description of the experimental protocol used in the study. Sprague Dawley (SD) rats were subjected to M2CAO and examined with either [18F]FMISO (n = 12) or [64Cu]CuATSM (n = 6). All animals except one (n = 17) were injected with pimonidazole hydrochloride (Hypoxyprobe-1™, Hypoxyprobe Inc., Burlington, MA, USA) at a dose of 60 mg/kg body weight approximately 30 min before undergoing M2CAO. One animal was not examined with pimonidazole in order to obtain a negative control.
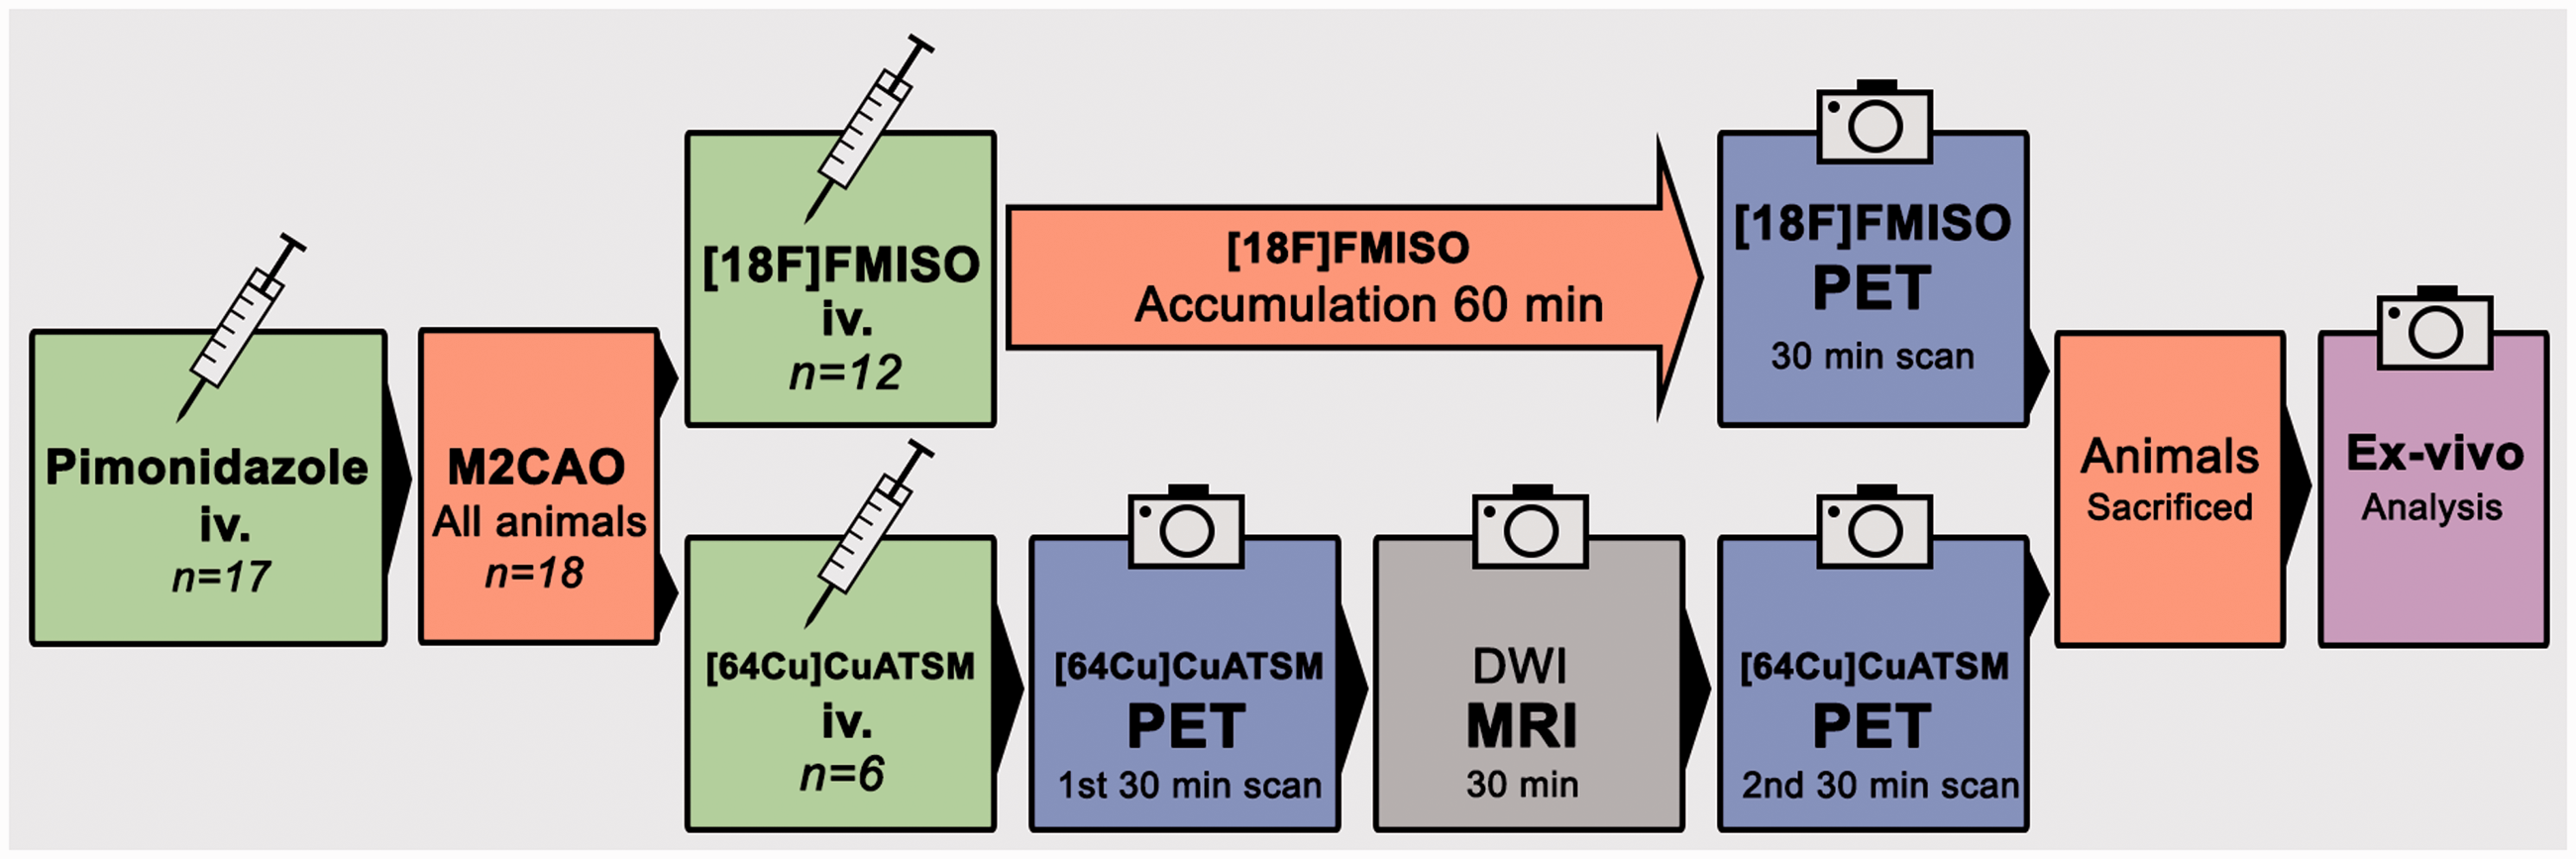
The experimental protocol used in the study. All but one animal (n = 17) were injected with Pimonidazole a short while before the start of the surgical/endovascular procedure that produces M2CAO. Upon M2CAO, the animals were injected with [18F]FMISO (n = 12) or [64Cu]CuATSM (n = 6). [18F]FMISO was allowed to accumulate for 60 min before animals underwent a 30-min PET examination. [64Cu]CuATSM animals underwent a 30-min PET examination immediately, and were then examined with MRI before another and final PET examination was performed. At the conclusion of examinations, animals were sacrificed and brains were harvested. The tissue was used for ex vivo immunofluorescence analysis.
[18F]FMISO group
Animals were injected with [18F]FMISO within 30 min of M2CAO. The average injected dose was 38.0 MBq. The tracer was allowed to accumulate for 60 min. Animals subsequently underwent a single PET examination with images collected every third minute for a total scan time of 30 min. At the conclusion of the PET examination, animals were sacrificed and brains were harvested. Autoradiography was performed on tissue from three animals: BAS Cassette 2325 plates (Fujifilm, Tokyo, Japan) were exposed to 25 µm tissue sections for approximately 3 h. A Typhoon™ FLA 7000 (GE Healthcare, Chicago, IL, USA) was used to scan plates.
[64Cu]CuATSM group
The animals were injected with [64CU]CuATSM approximately 15 min after the start of M2CAO. The average injected dose was 20.4 MBq. Animals were examined with PET in two 30-min scanning sessions, the first beginning immediately after the administration of [64Cu]CuATSM. At the conclusion of the first scanning session, animals were moved to the MRI scanner. The total duration of the MRI scanning session, including the time needed to move the animals, was 30 min. Subsequent to MRI examinations, animals were transferred back to the PET-scanner and the second 30-min examination was performed. At the conclusion of the second PET examination, animals were sacrificed and brains were harvested.
Animal care and use
Eighteen male SD rats (392 ± 35 g) were used. Animal handling as well as experimental procedures were conducted according to the guidelines of the Animal Welfare Board at Karolinska Institutet, and were approved by the Stockholm Northern Regional Ethical Committee (N4/15). Experiments were conducted and reported in compliance with the Animal Research: Reporting in-Vivo Experiments (ARRIVE) guidelines.
Animals were kept in groups in cages in a humidity controlled, thermoregulated facility with a 12-h/12-h light/dark cycle and access to food and water ad libitum. Animals were euthanized through decapitation while in deep anesthesia.
M2CAO ischemic stroke model
The M2CAO method was performed using a previously described procedure. 28 Vital signs were monitored throughout the surgical procedure. Anesthesia was induced at a 4%, and sustained at a 1.5–2%, Isoflurane (Virbac, Carros Cedex, France) concentration in an air:oxygen mixture (7:3). Animals were administered a 0.4 mL/kg dose of a local analgesic (Lidocaine, 1%, Astra Zeneca, London, UK). A rectal thermistor-equipped heating pad maintained animal body temperature.
X-ray fluoroscopy guidance (Philips Allura Xper XD20 Interventional X-ray system, Philips Medical Systems) was used for endovascular navigation. A 0.007-inch microwire (Hybrid; Balt Extrusion, Montmorency, France), sheathed inside a 0.020-inch microcatheter (Ultraflow; Covidien, Mansfield, MA, USA), was introduced through the ventral tail artery. The microcatheter was placed in the proximal descending aorta. The tip of the microwire was advanced until positioned in the M2 segment of the MCA, thereby achieving M2CAO.
Synthesis of [18F]FMISO
[18F]Fluoride ([18F]F−) was produced by the 18O(p,n) 18F reaction using 16.5 MeV protons on a PETtrace cyclotron (GE Healthcare). Precursor (1-(2′-Nitro-1′-imidazolyl)-2-O-tetrahydropyranyl-3-O-toluenesulfonyl-propanediol, NITTP) was purchased from Advanced Biochemical Compounds (ABX) and the synthesis of [18F]FMISO was performed on a FASTlab synthesis module (GE Healthcare) according to the manufactures' instructions. The product was then sterilized by filtration through a Millex-GV 0.22 µm sterile filter (Merck Millipore).
Synthesis of [64Cu]CuATSM
ATSM was purchased from ABX GmbH (Radeberg, Germany). D-Mannitol was purchased from VWR (Radnor, USA). All other chemicals, including ultra-trace-select water, were purchased from Sigma Aldrich (St. Louis, USA). Ultrapure water from a Milli-Q system (Millipore, Billerica, USA) was used in all cases, unless otherwise stated.
[64Cu]CuCl2 was produced at the Hevesy Laboratory (DTU Nutech) on a GE PETtrace cyclotron by irradiation of stable 64Ni with protons. After irradiation, the 64Ni metal-target was dissolved in aq. hydrochloric acid and no-carrier-added 64Cu was separated from the 64Ni and other impurities by anion exchange chromatography. [64Cu]CuATSM was prepared immediately after [64Cu]CuCl2 production at DTU Nutech.
A reconstitution liquid (RL) was prepared by dissolving ammonium acetate trihydrate (1.80 g, 13.2 mmol) and propylene glycol (3.00 mL) in ultrapure water (30.0 mL). Freeze-dried ATSM kits were prepared by dissolving sucrose (4.5 g, 13.1 mmol) and mannitol (7.5 g, 41.2 mmol) in ultrapure water to a final volume of 150 mL. From this solution, 2.00 mL was placed in separate 10 mL glass vials and to each was added a solution of ATSM in DMSO (1.0 mg/mL, 80 µL). The vials were frozen in liquid nitrogen and lyophilized.
[64Cu]CuATSM was prepared by first adding aq. HCl (30 µL, 0.1 M) and ultra-trace-select water (70 µL) to a vial containing dry [64Cu]CuCl2 (363–370 MBq, reaction vial). Concurrently, to a freeze-dried ATSM kit was added RL (3.00 mL), followed by vortexing. From the resulting ATSM kit mixture, 444 µL was added to the reaction vial, which was heated to 70°C for 6 min. After heating, a further 556 µL RL was added to the reaction vial. The resulting mixture was analyzed by Radio-TLC and HPLC before diluting to 2.00 mL with RL. Contents in final product vial; ATSM: 11.8–11.9 µg, [64Cu]CuATSM: 308–323 MBq. Radiochemical purity (RCP) after preparation was 99% in all cases by both radio-HPLC and radio-TLC.
PET acquisition
PET examinations were performed in a Focus 120 small animal PET scanner (CTI Concorde Microsystems, Knoxville, TN). Animals were positioned in a supine position with heads inside the camera field of view (FOV). Anesthesia was maintained with 2% isoflurane and air mixture. Radiotracers were administered through the tail vein. Images were reconstructed by standard 2D filtered back projection using a ramp filter. The matrix size of the reconstructed images was 128 × 128 × 95 with a pixel resolution of 0.9 × 0.9 × 0.8 mm.
MRI acquisition
MRI was performed in a horizontal 9.4 T magnet (Varian, Yarnton, United Kingdom) with a maximum gradient strength of 600 mT/m. An actively tuned birdcage resonator (Rapid Biomedical GmbH, Würzburg-Rimpar, Germany) and an actively detuned 4-channel phased array surface coil Rapid Biomedical GmbH, Würzburg-Rimpar, Germany) were employed for excitation and as receiving coil. The head of the animal was placed in a stereotactic frame during the examination. Animal vital signs were monitored.
Diffusion-weighted imaging (DWI) was acquired by multi-slice three-shot spin-echo echo-planar imaging with 15 slices of 1 mm thickness. Repetition time (TR): 3 s. Echo time (TE): 25 ms. FOV was 32 × 32 mm with the matrix size of 96 × 96 zero filled to 128 × 128, resulting in an in-plane resolution of 256 µm. Diffusion gradient duration (Δ): 2.3 ms, diffusion gradient separation (δ): 6.5 ms. Diffusion sensitizing gradients were applied along 12 directions with a b value =1000 s/mm2. A control image was collected twice with the diffusion sensitizing factor b = 0. Apparent diffusion coefficient (ADC) maps (mm2/s) were calculated from the collected data.
Immunofluorescence
Animals from the [18F]FMISO (n = 12) and [64Cu]CuATSM (n = 6) groups were sacrificed with brains harvested immediately after the conclusion of PET examinations. The brains were fresh frozen and kept at −80°C until cryo-sectioned at 12 µm thickness. Sections from the center of the ischemic lesion were selected for IF staining. Stainings were performed on sections from 10 animals from the [18F]FMISO group and on all 6 animals in the [64Cu]CuATSM group. One animal from the [18F]FMISO group was not included due to a lack of any apparent increase in [18F]FMISO activity in the cortex subjected to M2CAO (M2CAO cortex). Another animal belonging to the [18F]FMISO group was not included due to not having been injected with pimonidazole.
Sections were triple stained according to an IF protocol including Tyramide signal amplification (TSA) technique. 29 Sections were thawed, air-dried and rehydrated in standard PBS before being fixated in 4% paraformaldehyde. Normal goat serum was used to block unspecific reactivity. Primary antibodies were subsequently applied and sections were incubated at 4°C for 24 h; pimonidazole immunodetection was achieved with anti-pimonidazole mouse IgG1 monoclonal antibody (MAb1, Hypoxyprobe Inc., Burlington, MA, USA) in a 1:250 dilution. Immunodetection of neurons was performed with neuronal nuclei (NeuN) antibody, rabbit polyclonal (ABN78, Millipore, Bedford, MA, USA) in a 1:250 dilution. Astrocytes were detected by the use of GFAP, chicken polyclonal (ab4674, Abcam, Cambridge, UK) in a 1:2000 dilution. Following primary antibody incubation, TNB was used to block unspecific reactivity and secondary antibodies were applied for 90 min; Cy-5 conjugated donkey-anti-rabbit (Jackson Immunoresearch, West Grove, PA, USA), dilution 1:200; Alexa-Flour 488 conjugated donkey-anti-mouse (Jackson Immunoresearch), dilution 1:200 and Horseradish peroxidase donkey-anti-chicken diluted 1:2 in Glycerol (Dako, Glostrup, Denmark), dilution 1:100. Subsequently, Cy3.5-conjugated TSA (Perkin Elmer, Waltham, MA, USA), dilution 1:100, was applied for 15 min after washing. Prolong GOLD medium with DAPI was used as nuclear counterstain (Invitrogen, Eugene, OR, USA).
Sections were scanned with primary objective initial image capture on a Vslide slide scanning microscope (Metasystems, Altlußheim, Germany) with filter sets for DAPI (EX350/50–EM470/40), FITC (EX493/16–EM527/30), Cy3 (EX546/10–EM580/30), Cy3.5 (EX581/10–EM617/40), and Cy5 (EX630/20–647/long pass). Initial captures were stitched in Vslide (Metasystems) software to create sectional images with microscopic resolution.
Analysis and regions of interest
PET data analysis was performed in Inveon Research Workplace (Siemens Healthcare, Erlangen, Germany) software PET imaging; Standardized uptake value (SUV%) images were produced by normalizing tissue activity to the total dose of injected dose and to animal body weight (% injected dose/g).
[18F]FMISO PET analysis
We performed voxel-based analysis 30 according to the following description: [18F]FMISO PET images were coregistered with an anatomical T2-weighted MRI template from an unrelated animal not included in the study. Coregistration was performed manually in the Inveon Research Workplace (Siemens Healthcare, Erlangen, Germany) software. Subsequently, in each animal, a control region encompassing the MCA M2-segment supply region were manually outlined in the contralateral cortex. The control ROI extended from the posterior section of the frontal lobe and throughout the parietal lobe in an anterior-posterior direction. A SUV% threshold for the delineation of increased activity [18F]FMISO hypoxia ROIs was determined in each animal. The threshold was defined as the control ROI mean SUV% + 3 × standard deviations. Voxels within the ipsilateral anatomical region corresponding to the M2-segment supply region, i.e. the M2CAO cortex, were included in the hypoxia ROI if having a SUV% value higher than the determined threshold. Diminutive as well as fragmented regions of increased uptake measuring <1 mm3 in volume were not included in the hypoxia ROIs. Once all animals had been analyzed, a statistical comparison was performed between the SUV% of hypoxia ROIs compared to control ROIs on a group level.
[64CU]CuATSM PET analysis
PET [64Cu]CuATSM images were coregistered with ADC maps calculated from the DWI MRI collected in-between the first and second [64Cu]CuATSM examinations. The coregistration was performed manually in the Inveon research workplace software. Following coregistration, hypoxia ROIs were delineated based on regions with restricted diffusion in ADC maps. Both the first and the second [64Cu]CuATSM PET examinations were analyzed. SUV% (mean ± SD) was calculated for hypoxia ROIs as well as for control regions encompassing the cortical MCA M2-segment supply region in the contralateral hemisphere.
IF cellular analysis
Animals from both [18F]FMISO and [64Cu]CuATSM groups were included in the IF analysis. A single section was analyzed for each included animal. An in-house macro scripted in Fiji software was used to delineate hypoxic and peri-hypoxic ROIs and to perform the analysis. The hypoxic ROI consisted of regions with increased pimonidazole intensity. The peri-hypoxic ROI consisted of the remaining tissue within the M2CAO cortex when tissue constituting the hypoxia ROI had been excluded. The analysis measured the pimonidazole intensity within neurons and astrocytes located within these ROIs, as well as in the contralateral control region. A detailed description of the Fiji software macro is provided below.
Background intensities were subtracted from each channel based on the median intensity of that channel in an area manually delineated in the healthy cortex. The M2CAO cortex was manually delineated in the NeuN channel (Cy5), reaching from the edge of the cortex to the corpus callosum in the lateral-medial direction, and terminated at the border of the anterior cerebral artery supply region in the supero-medial cortex. Tissue regions with an increased pimonidazole signal (Cy2) located inside the M2CAO cortex were automatically segmented into a hypoxia mask after applying unbiased thresholding based on an iterative selection method in Fiji. Segmented tissue regions included in the hypoxia mask were required to have a minimum area of 25,000 pixels. The peri-hypoxic mask consisted of the remaining tissue of the M2CAO cortex when excluding the tissue contained in the hypoxia mask. A control region located in the contralateral cortex was manually delineated in the NeuN channel.
Hypoxic and peri-hypoxic masks were applied to NeuN and GFAP (Cy3.5) channels, identifying neurons and astrocytes based on NeuN and GFAP pixel intensity after applying unbiased thresholding based on an iterative selection method in Fiji. Subsequently, pimonidazole intensity was measured in the selected cells. The same criteria of cell identification and pimonidazole intensity examination were applied to the contralateral control region. Within identified cells, the mean intensity of pimonidazole was measured and summarized to provide means ± SD for each ROI.
Statistics
Paired students t-test was used for to test for statistical significance. P-values <0.05 were considered significant.
Results
Animals and exclusions
All 18 animals survived the experiments. The mean duration from the start of M2CAO to the completion of the experimental protocol and sacrificing the animals was 110 ± 10 min in both the [18F]FMISO and the [64Cu]CuATSM group.
In the [18F]FMISO group, two animals did not have any voxels with SUV% above the hypoxia ROI threshold determined in those animals. The animals were not included in the [18F]FMISO analysis. However, a control analysis was performed where in these two animals a ROI encompassing the entirety of the M2CAO cortex was used as a substitute for the hypoxia ROI. The control analysis showed that the inclusion of these two animals in the [18F]FMISO analysis would not have changed the result.
[18F]FMISO PET images were macroscopically evaluated ahead of tissue selection for IF analysis. One animal was excluded from the IF analysis because no focal increase of [18F]FMISO could be observed in the M2CAO cortex. On evaluation of IF stainings, one animal was excluded from IF analysis due to poor tissue quality. Three further animals were excluded from IF analysis due to not having a distinct hypoxic region of increased pimonidazole intensity. Of these three animals, one belonged to the [18F]FMISO group and two to the [64Cu]CuATSM group. The animal from the [18F]FMISO group had only a small region of increased [18F]FMISO uptake within the M2CAO cortex. Out of the two animals from the [64Cu]CuATSM group, one had only a small area of ADC-restriction, whereas in the other animal the region of ADC restriction was very large. Please see Figure 2 for an example of PET-imaging, autoradiography and IF used in the study.
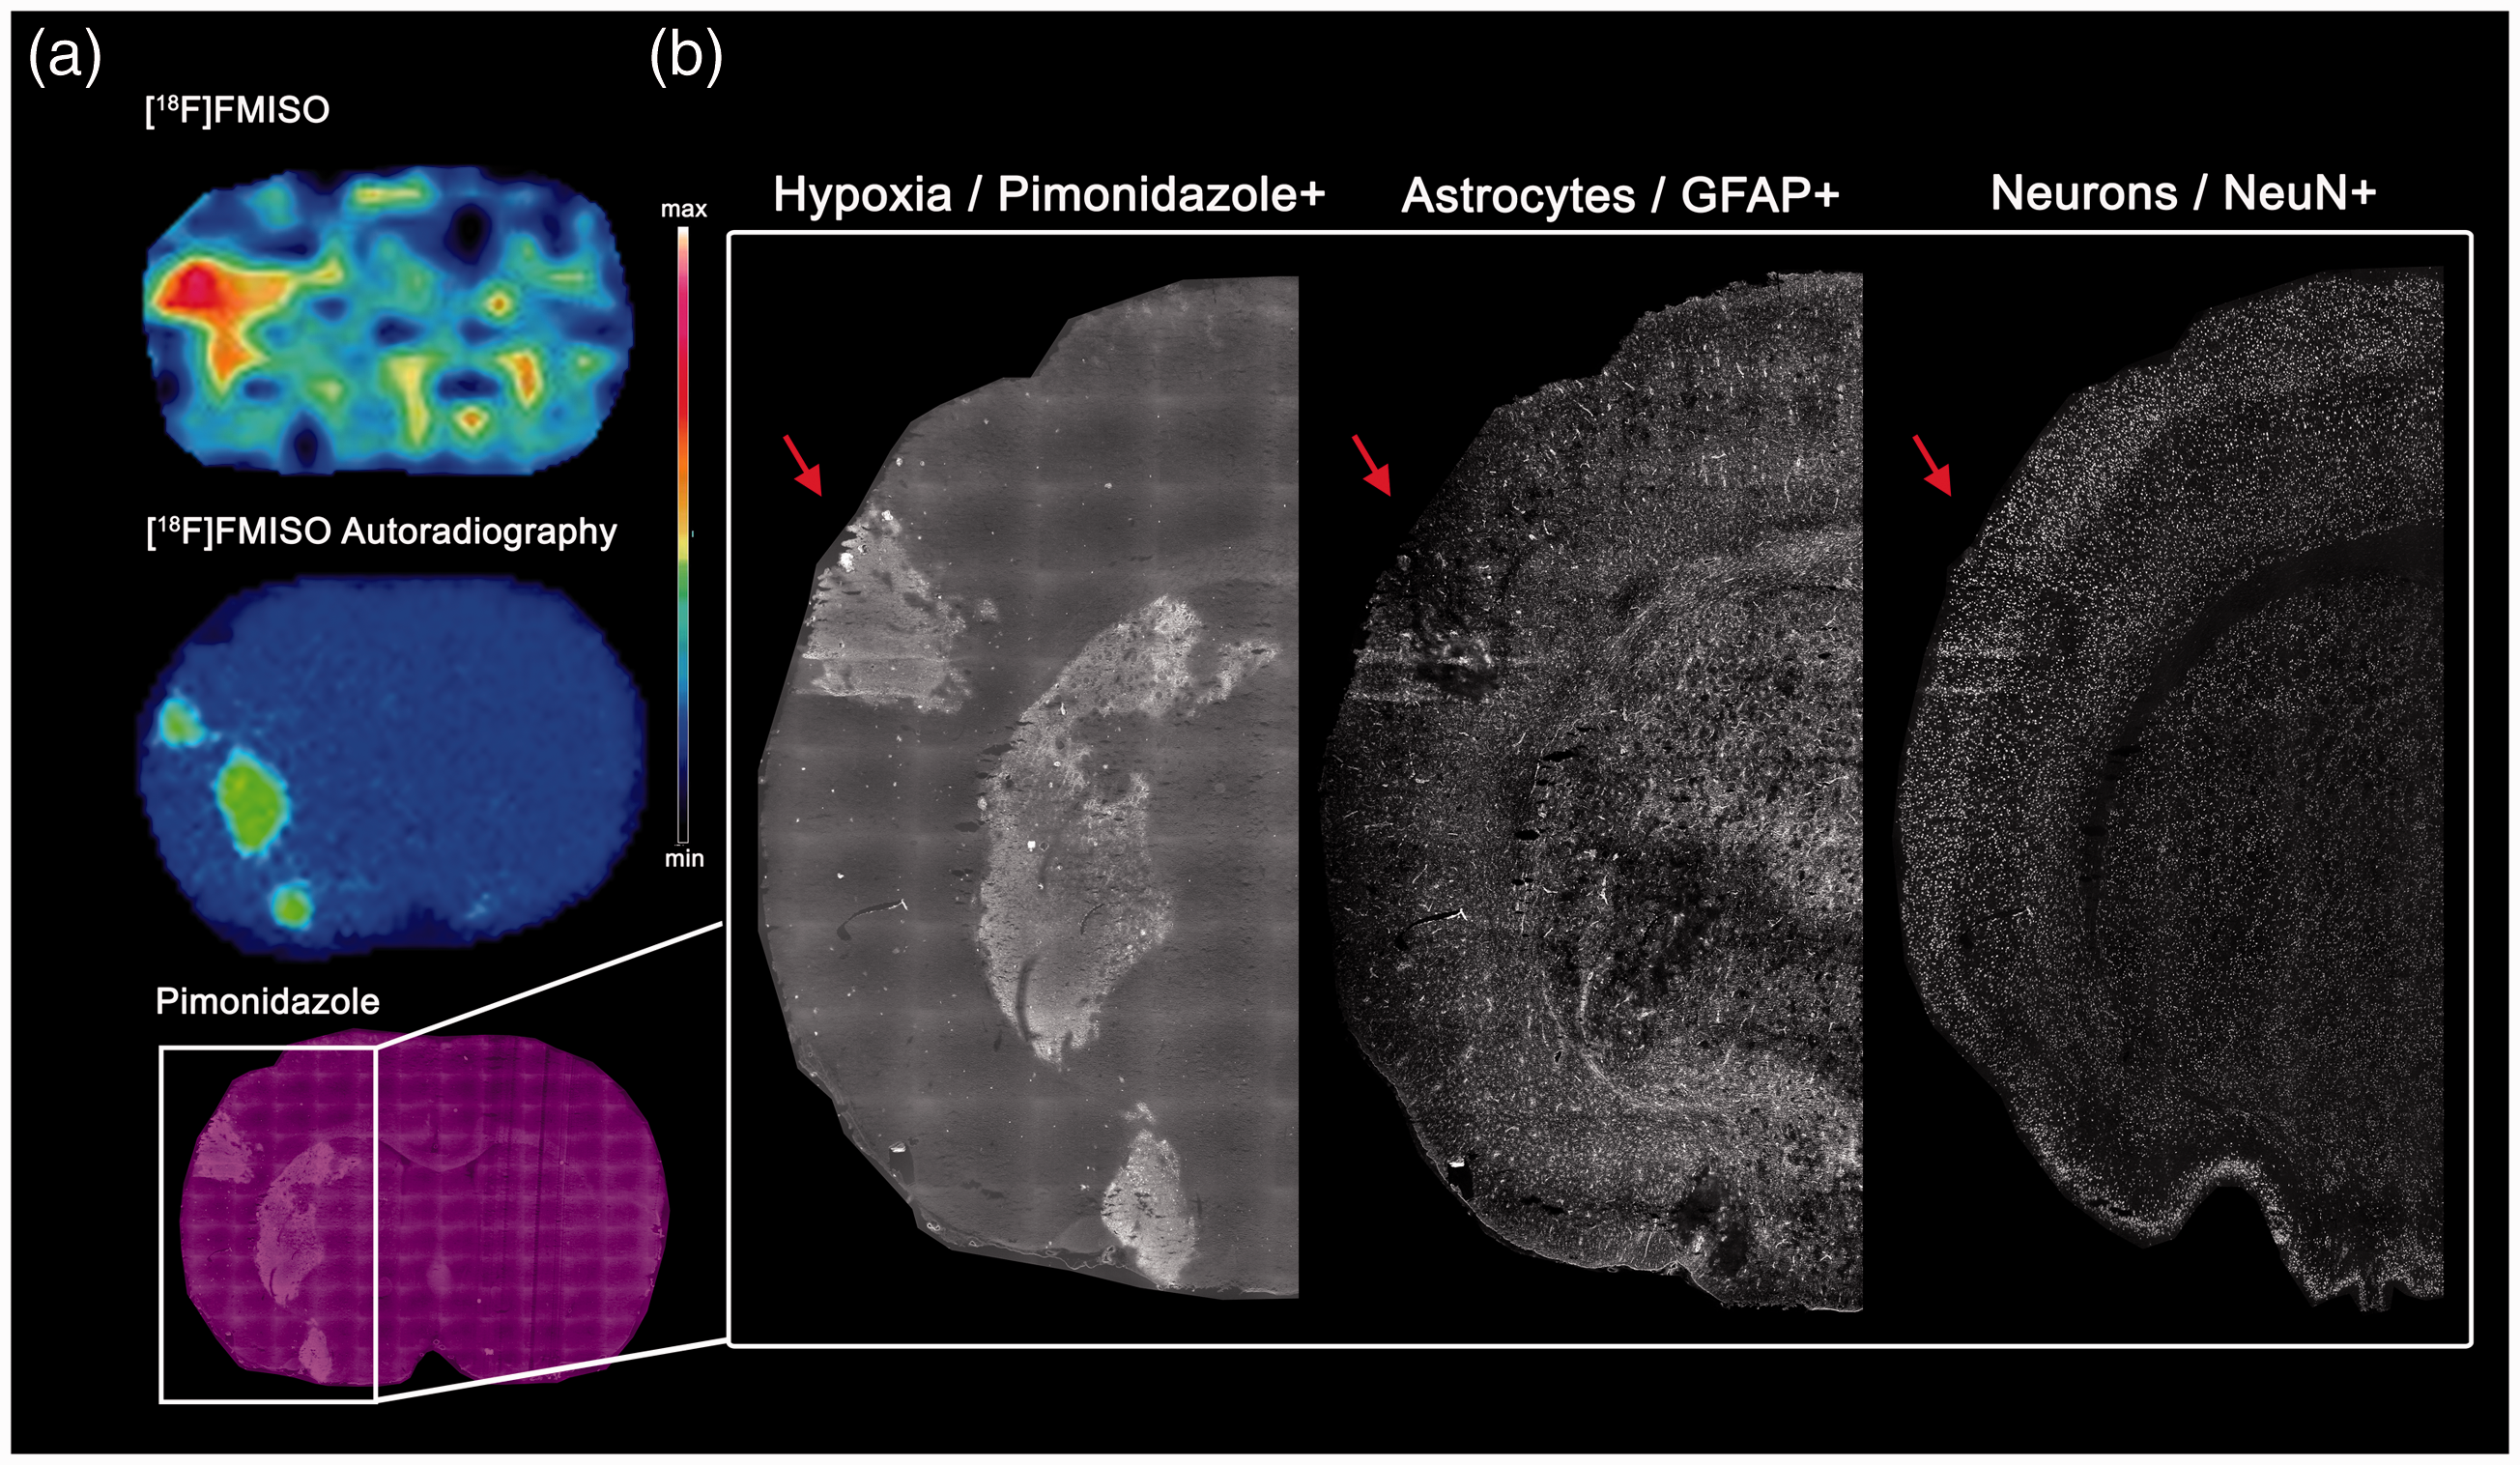
(a)Illustrative positron emission tomography (PET), as well as autoradiography and immunofluorescence (IF), performed on the same animal belonging to the [18F]FMISO group and subjected to middle cerebral artery M2-segment occlusion (M2CAO). Top: [18F]FMISO PET image with a focal increase in tracer activity within the brain region affected by M2CAO. Middle: [18F]FMISO autoradiography image of a section in close anatomical proximity to the above PET image. Bottom: Pimonidazole IF corresponding to focal [18F]FMISO autoradiography seen above. (b) IF stainings performed on tissue; all images are from the same section: Left: hypoxic region of interest (red arrow), defined by an increased uptake of pimonidazole, can be seen in the cortex and in the striatum. Middle: glial fibrillary acidic protein+ (GFAP) astrocytes. Right: neuronal nuclei+ (NeuN) neurons.
Increased [18F]FMISO uptake in M2CAO Cortex
Please see Figure 3 for an example of focally increased [18F]FMISO uptake in the M2CAO cortex. Hypoxia ROIs were delineated based on individual thresholds for [18F]FMISO SUV% determined in each animal (see Methods section). The hypoxia ROI had a mean SUV% of 0.179 ± 0.016 (% injected dose/g), which was found to be significantly higher than the SUV% of the control region (0.145 ± 0.015) located in the contralateral hemisphere (Figure 4(a)). The mean volume of the hypoxia ROI was 38.6 ± 48 mm3.
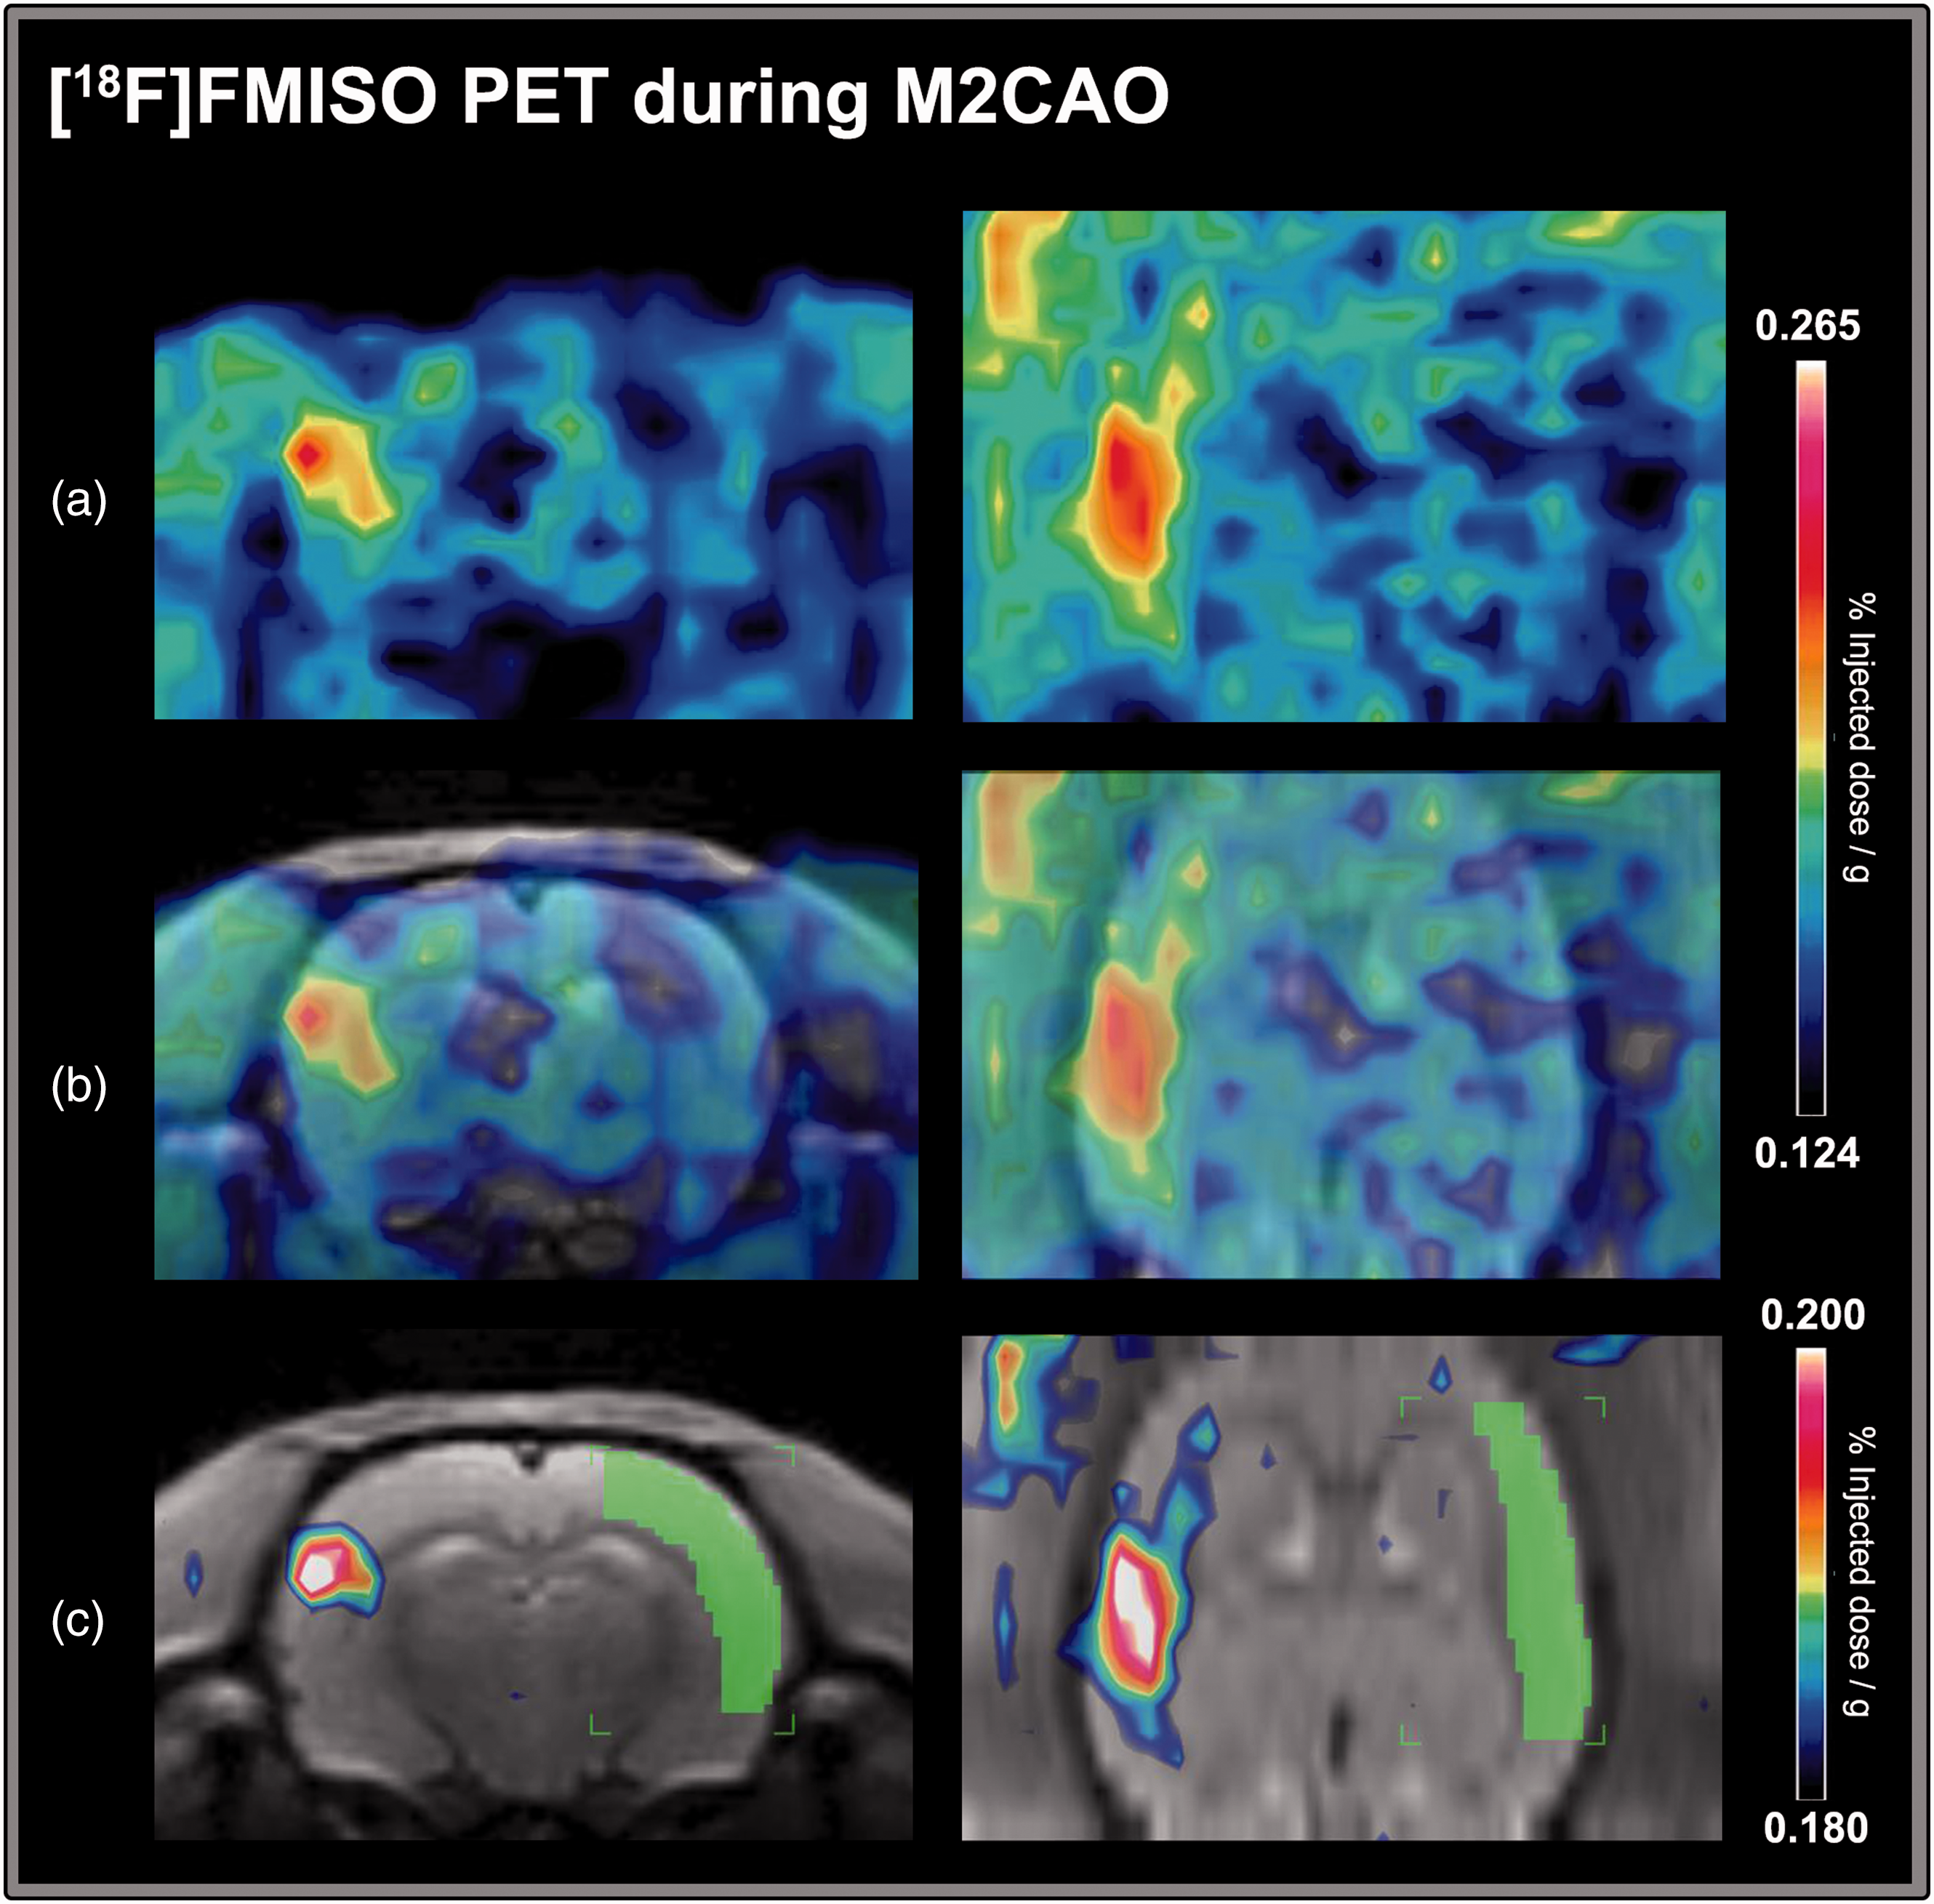
An example of increased [18F]FMISO uptake during middle cerebral artery M2-segment occlusion (M2CAO). The [18F]FMISO images are from a single animal. (a) Increased [18F]FMISO uptake is visible on the left side of the image in coronal (left column) and axial (right column) projections. (b) [18F]FMISO images have been coregistered to a T2-weighted anatomical template from an unrelated animal not included in the study. (c) The template was used to apply a control region of interest (ROI) encompassing the M2 supply region in the contralateral cortex (green). The level of [18F]FMISO uptake in the control region was used to determine a threshold for the delineation of a hypoxic ROI within the region of the brain affected by M2CAO. In this animal, the threshold was 0.180% injected dose/g (SUV%). Voxels included in the hypoxia ROI are visible on the left side of the image.
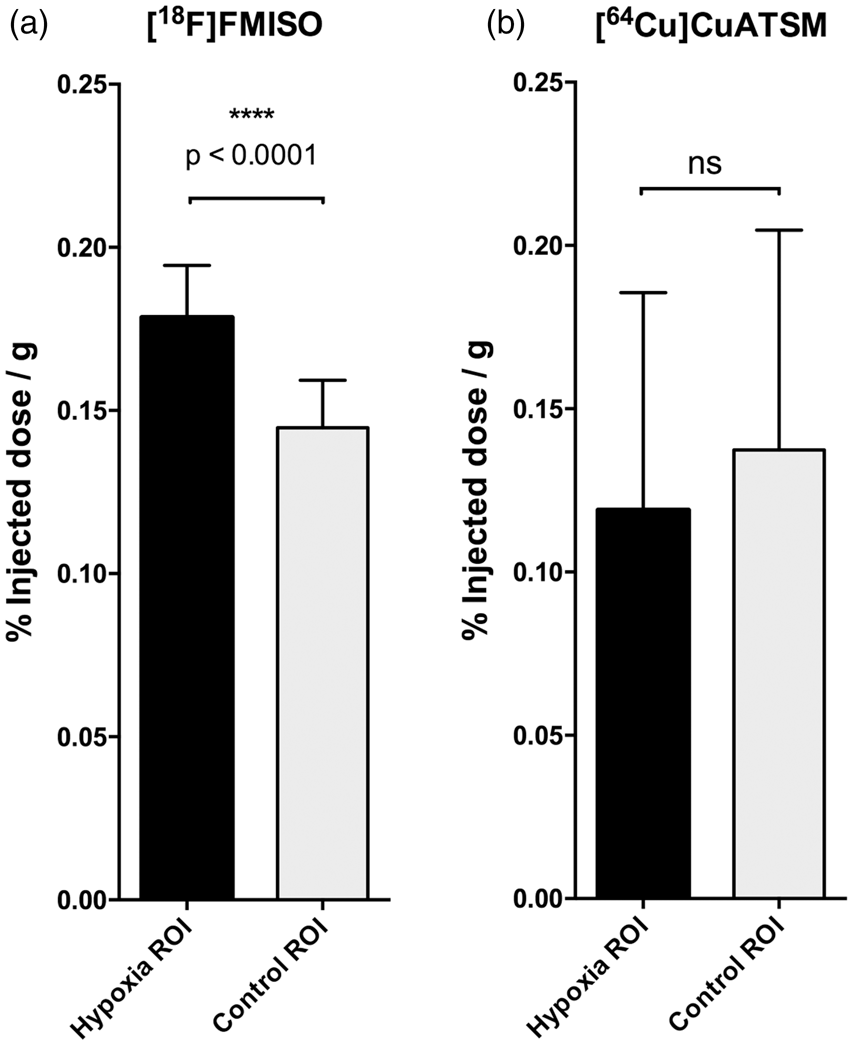
SUV% in animals examined with [18F]FMISO and [64Cu]CuATSM. (a) There was increased [18F]FMISO activity within regions located in the cortex subjected to middle cerebral artery M2-segment occlusion (M2CAO). The analysis revealed a significant SUV% difference when the [18F]FMISO activity of these regions was compared with the contralateral control region (p < 0.0001). (b) Results from the second [64Cu]CuATSM examination. No focal increase in [64Cu]CuATSM activity was found in regions affected by M2CAO in any of the examined animals (n = 6), and no significant SUV% difference to the contralateral control region could be found on a group level.
No focal uptake of [64Cu]CuATSM in M2CAO cortex
DWI MRI examinations were used to delineate hypoxia ROIs (see methods section). The difference in [64Cu]CuATSM SUV% uptake between hypoxia ROIs and control was non-significant in both the first (p = 0.075) and second (p = 0.130) PET-examinations. In fact, hypoxia ROI SUV% levels of [64Cu]CuATSM were lower than in the control region in both examinations (SUV%: 0.136 ± 0.10 vs. 0.153 ± 0.11 (first examination), 0.119 ± 0.067 vs. 0.137 ± 0.067) (second examination). Results from the second examination are presented in Figure 4(b)). The mean volume of restricted diffusion regions in ADC-maps used to determine hypoxia ROIs was 75.4 ± 72 mm3. For an example of [64Cu]CuATSM uptake correlated to regions of restricted diffusion, please see Figure 5.
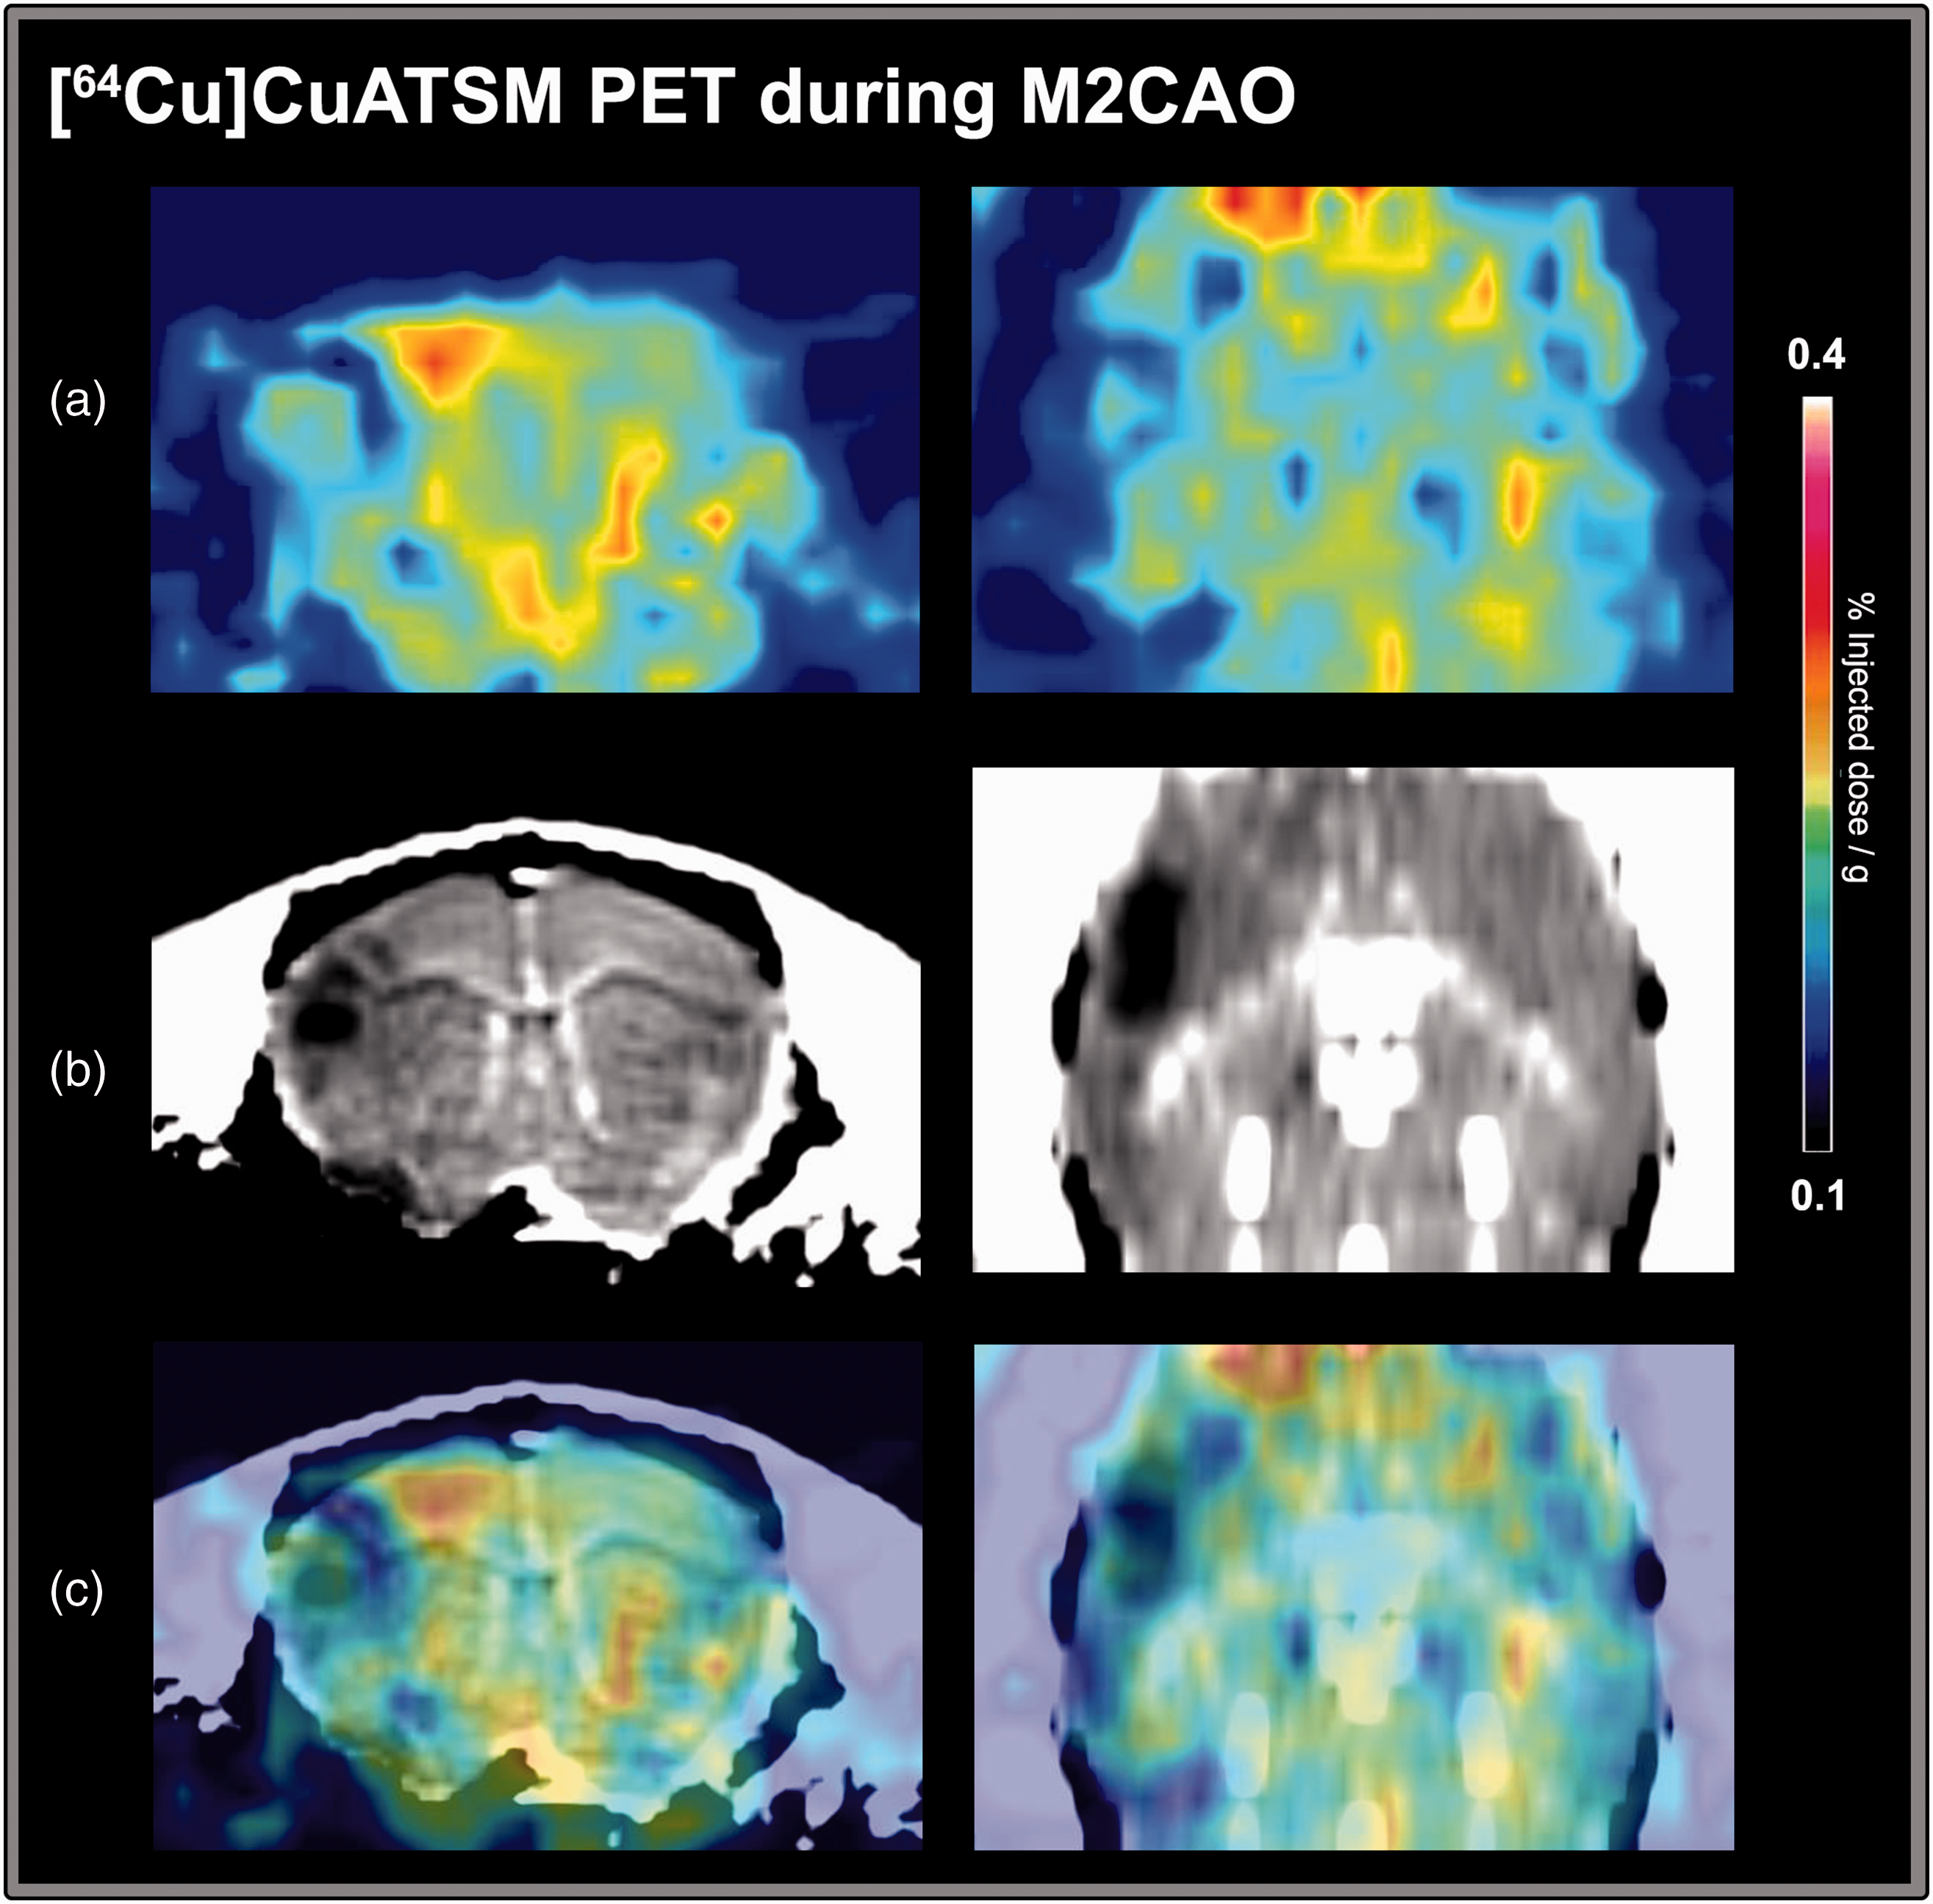
An example of [64Cu]CuATSM uptake in an animal during middle cerebral artery M2-segment occlusion (M2CAO). (a) Images from the second [64Cu]CuATSM PET examination. (b) Apparent diffusion coefficient (ADC) images calculated from diffusion-weighted magnetic resonance imaging (MRI) performed in the same animal immediately prior to the PET examination seen in (a). A region of restricted diffusion, signifying the emergence of ischemic injury, is visible in the cortex on the left side of the image. (c) Coregistration of [64Cu]CuATSM PET and ADC images. No apparent increase in [64Cu]CuATSM uptake is detectable matching the region of restricted diffusion. On the contrary, the uptake [64Cu]CuATSM in the region of restricted diffusion appears to be decreased.
Pimonidazole intensity in neurons and astrocytes
In the majority of animals, there were areas of diminished GFAP+ astrocyte presence contained inside, but smaller, than the hypoxic region defined by increased pimonidazole intensity (Figure 6). No comparable lack of NeuN+ neurons was seen in hypoxic regions.
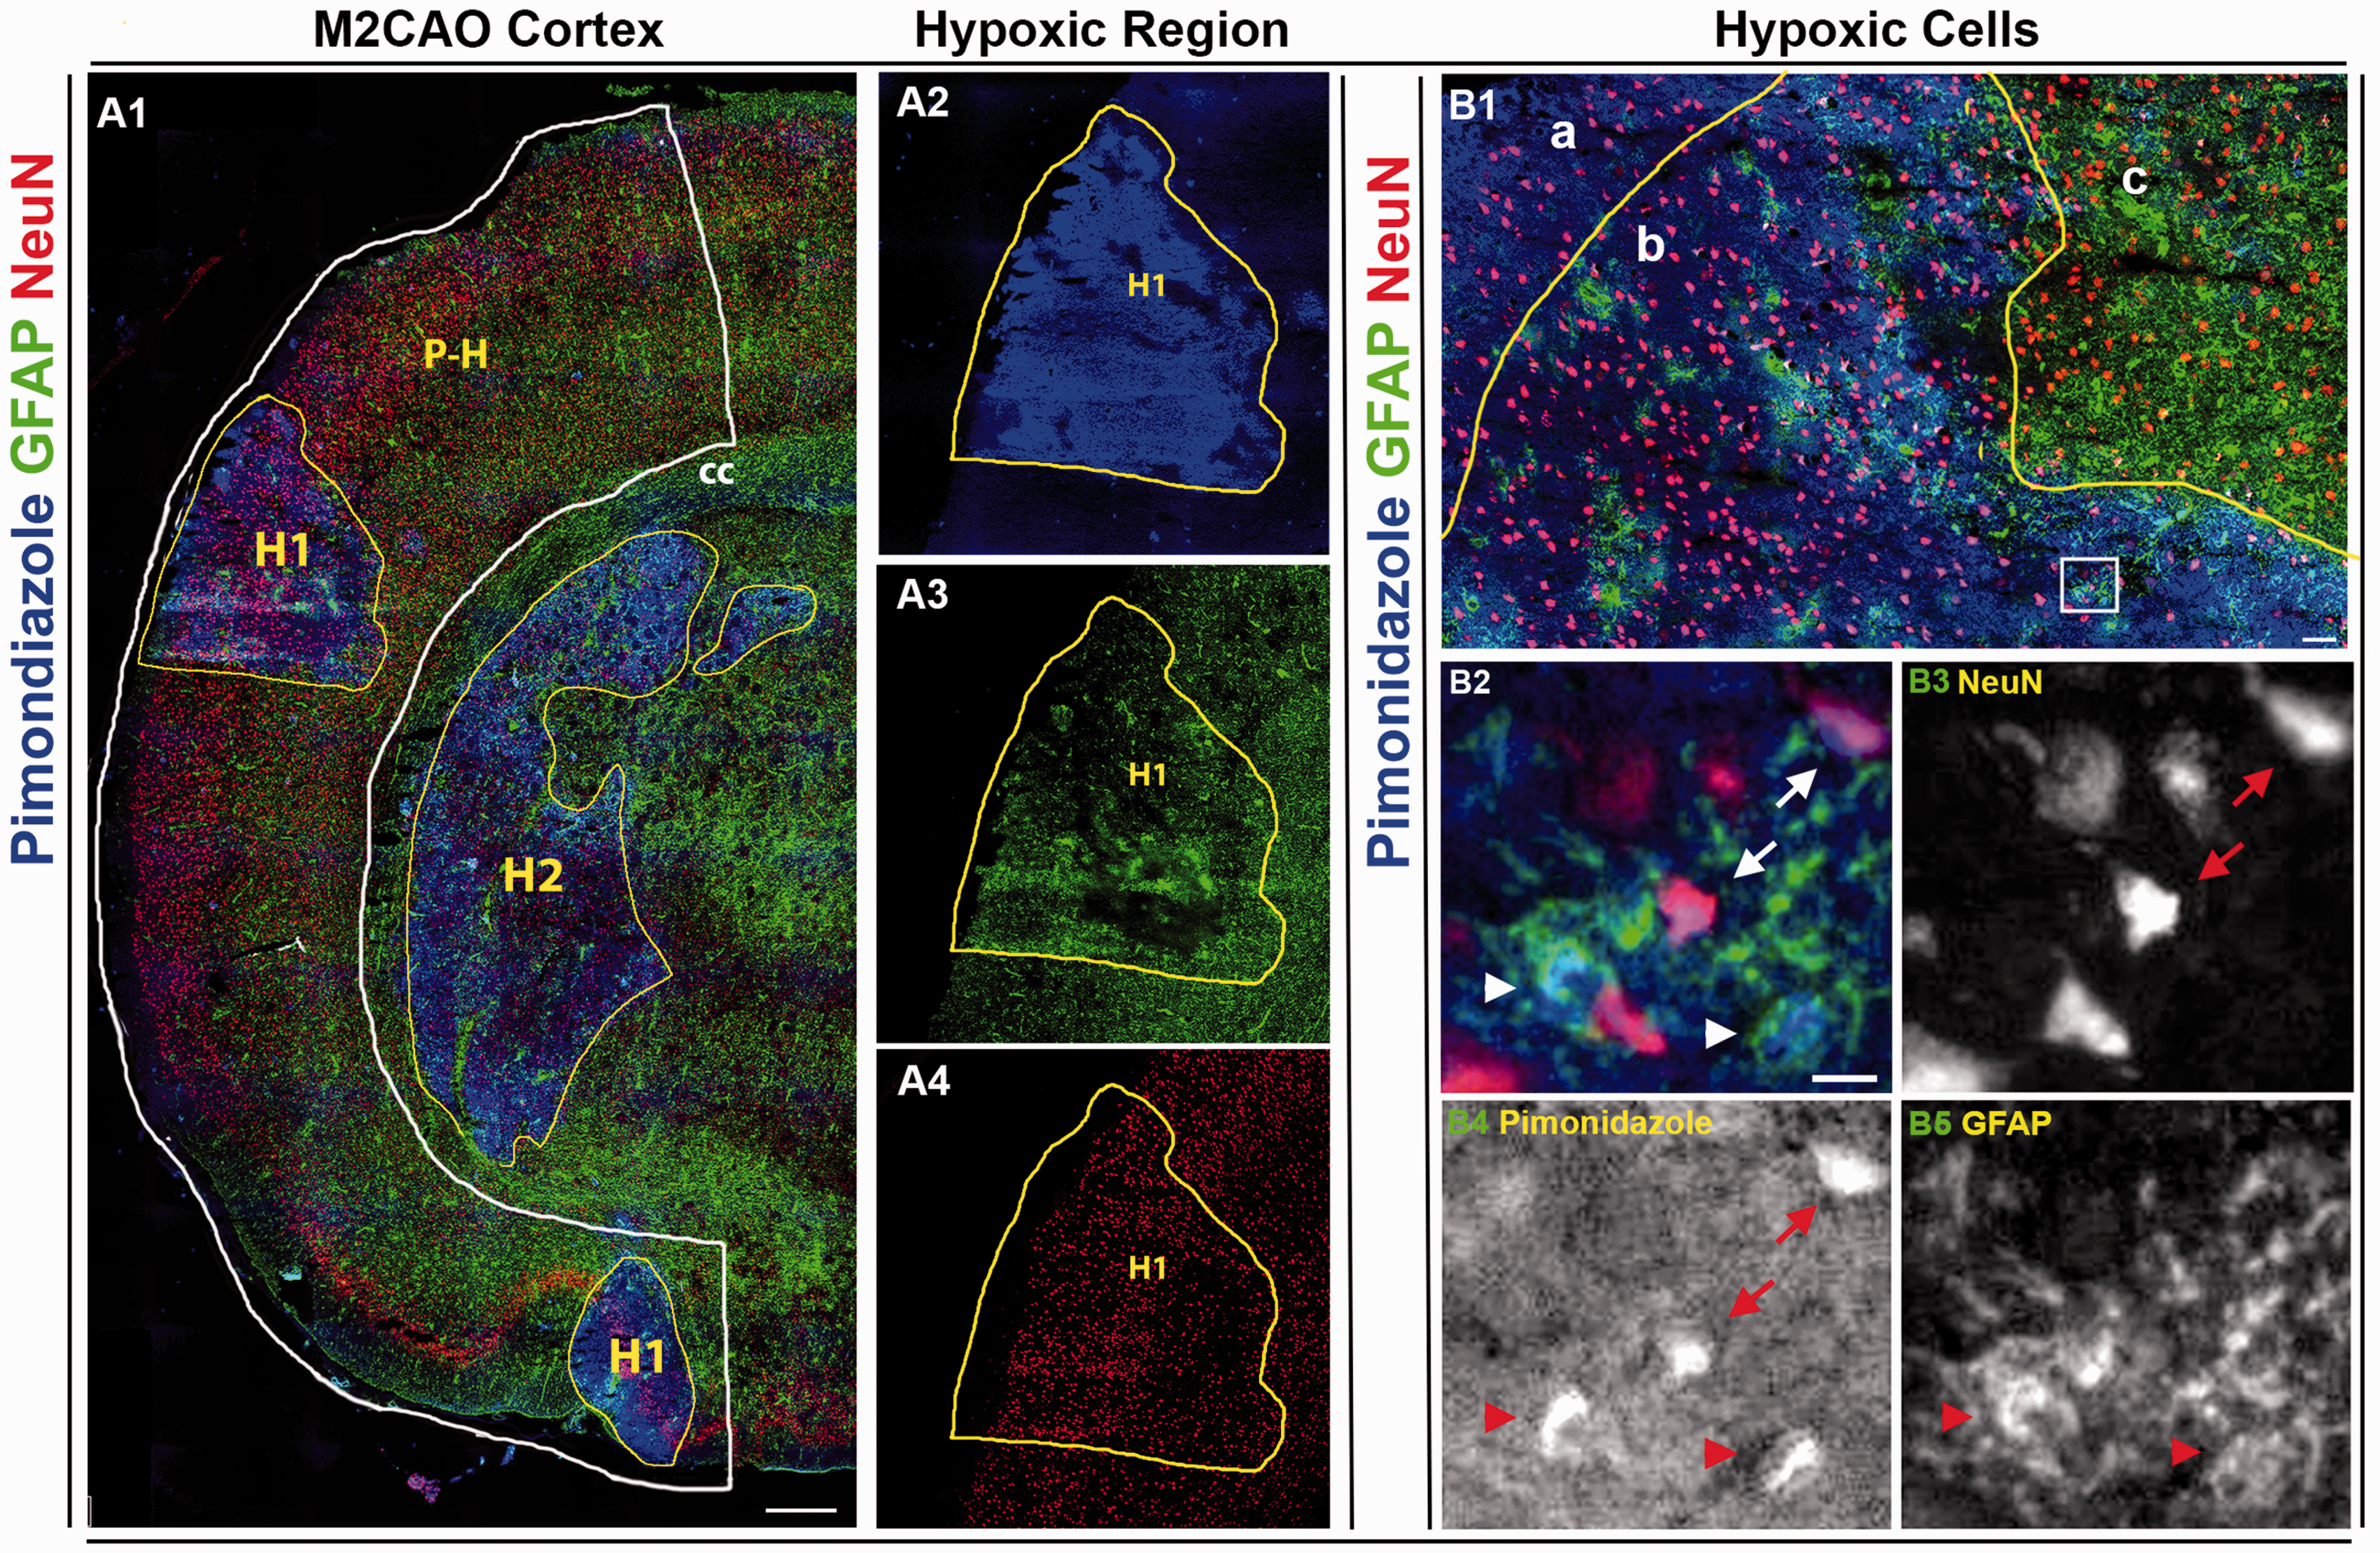
(A1) Cortical hemisphere subjected to middle cerebral artery M2-segment occlusion (M2CAO cortex, white line), stained for pimonidazole (blue, A2), GFAP+ astrocytes (green, A3) and NeuN+ neurons (red, A4). There is an obvious loss of GFAP+ astrocytes in the core of the hypoxic region (H1). P-H: peri-hypoxic region. H2: Subcortical hypoxic region. (B1) An apparent lack of astrocytes is visible in the core area of a hypoxic region (a). In the border area of the hypoxic region (b), there is a diminished presence of astrocytes, as well as an increased concentration of pimonidazole+ astrocytes and neurons, compared to cells outside the hypoxic region (c). B2–B5 (area corresponding to white square in B1): Hypoxic astrocytes (arrowheads) and neurons (arrows) in border area of hypoxic region. Scale bars: A1: 500 µm, B1: 50 µm, B2–B5: 10 µm.
Neurons as well as astrocytes located within the hypoxic region contained significantly more pimonidazole when compared to cells of corresponding cell types located in the contralateral control region (p < 0.0001). Overall the pimonidazole intensity of the hypoxic and peri-hypoxic regions was increased when compared to contralateral control regions (p < 0.0001, p = 0.013). Neurons located in the peri-hypoxic region contained significantly increased pimonidazole intensity when compared to neurons in the contralateral control region (p = 0.017). No significant difference in astrocyte pimonidazole intensity was found between the peri-hypoxic region and the control region. Results are summarized in Figure 7(a).
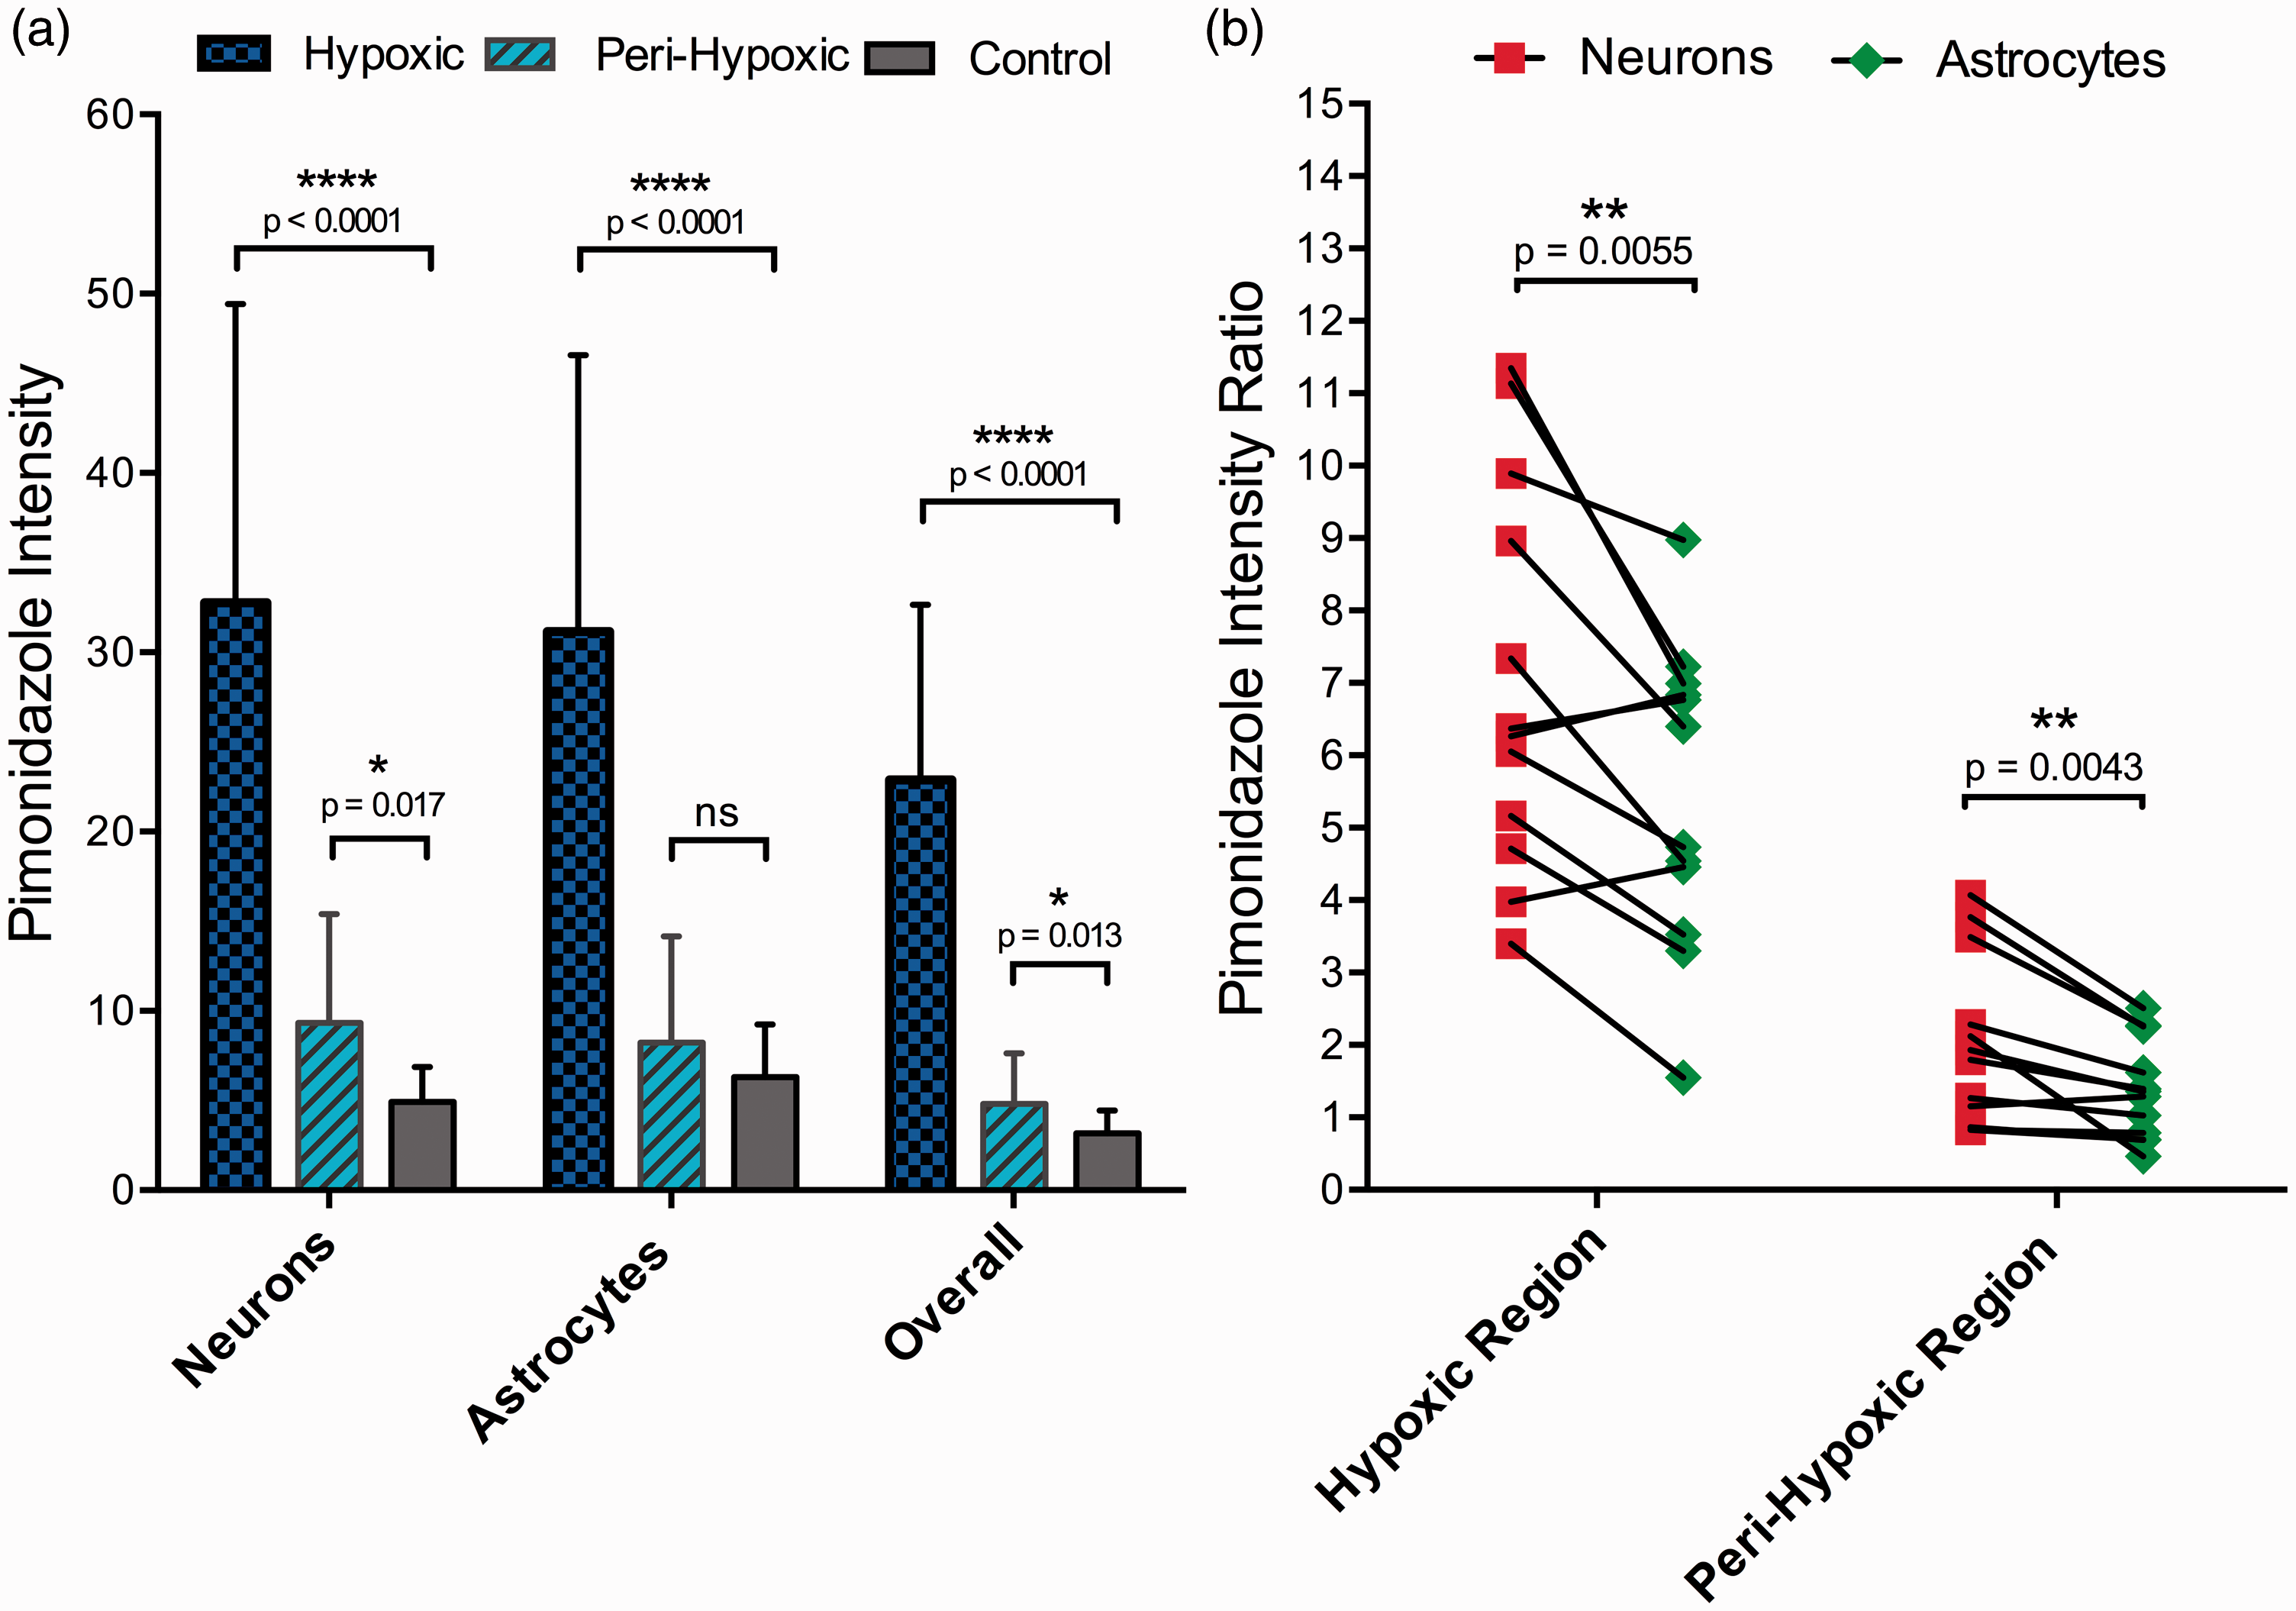
(a) There was a significantly increased pimonidazole mean intensity in neurons (NeuN+) and astrocytes (GFAP+) in the hypoxic region (blue), as well as in neurons in the peri-hypoxic (cyan) region, compared to corresponding cell types in the control region (grey). The overall pimonidazole intensity was also examined in hypoxic and peri-hypoxic regions and was found to be significantly increased when compared to the pimonidazole intensity of the control region (rightmost columns). (b) Comparison between pimonidazole intensity ratios (ROI/Control) of neurons and astrocytes in hypoxic and peri-hypoxic regions. Black lines connect ratios of individual animals. The pimonidazole intensity ratios were significantly higher in neurons than in astrocytes in both the hypoxic and the peri-hypoxic regions.
We further examined ratios of the pimonidazole intensity in neurons and astrocytes when compared to healthy cells of these cell types. The pimonidazole intensity levels of neurons and astrocytes located in the hypoxic and peri-hypoxic regions were normalized against levels in cells of corresponding cells types located in the contralateral control region. Neurons located in the hypoxic as well as the peri-hypoxic regions had significantly higher pimonidazole intensity ratios than astrocytes located in these regions (p = 0.0055 and p = 0.0043, respectively) (Figure 7(b)).
Macroscopic evaluation revealed increased and apparent pimonidazole uptake in regions of ADC deficit in MRI images collected in the [64Cu]CuATSM animals. The increased pimonidazole was located within, as well as in the immediate vicinity, of regions with restricted diffusion in three of the four animals included in the IF analysis. The fourth animal exhibited no apparent increase in pimonidazole intensity although the animal had a large ADC restriction.
Discussion
We have compared hypoxia tracers [18F]FMISO and [64Cu]CuATSM and performed IF analysis to profile the cellular distribution of hypoxia in the M2CAO stroke model. The M2CAO model is characterized by substantial regions of perfusion deficit sustained in the short term by collateral flow through leptomeningeal anastomoses.27,31,32 We found distinct and focal increases of [18F]FMISO uptake in the M2CAO cortex, as well as hypoxic areas of increased pimonidazole intensity in which there was a central loss of GFAP+ astrocytes . The loss of astrocytes in severely ischemic regions has been observed previously in Tóth and Little et al. 33
We used healthy SD rats. The difference between the [18F]FMISO SUV% of the hypoxic region and the control region was approximately +25%. The difference is substantially lower than what has been observed in spontaneously hypertensive rats 34 , 35 but comparable to what has previously been recorded in healthy animals of the Wistar strain. 26 In animals examined with [64Cu]CuATSM, as well as DWI MRI, we could not find any increase in tracer uptake, even though regions of restricted diffusion were found in DWI and IF analysis revealed areas of pimonidazole increase in the M2CAO cortex of these animals. In fact, as has been illustrated in Figure 5, there was a trend towards lower [64Cu]CuATSM uptake in regions of restricted diffusion. Such a pattern is expected for a tracer lacking specific binding in regions subject to hypoperfusion as caused by M2CAO. We conclude that our results do not support [64Cu]CuATSM as an effective hypoxia tracer in the context of experimental AIS, although it may have potential in oncological imaging 21 where the degree of hypoxia within the tumor core is higher than what is seen in tissue-at-risk in cerebral and cardiac ischemia18,19,25. Results are in agreement with those reported by Williamson et al. 26 in their study using a another rat model of stroke.
[18F]FMISO is currently the most investigated PET hypoxia tracer used in animal research and has been applied clinically to identify hypoxic tissue in AIS, as well as tumor hypoxia in oncological patients.25,36 Read et al. observed [18F]FMISO uptake surrounding and in the periphery of infarcted areas within 48 h of ictus in stroke patients. The hypoxic regions were no longer present in follow-up examinations performed on days 6–1116. Markus et al. 37 used [18F]FMISO to show how infarct expansion moves from the center into the periphery of ischemic regions, and in a subsequent study how substantial volumes of hypoxic yet viable tissue remained as late as 12–48 h after ictus in stroke patients. 38 Similar results have been reported in animal studies.35,39 There is now a general consensus that [18F]FMISO uptake in ischemic regions declines with time, though a precise understanding of [18F]FMISO penumbra specificity is still lacking. 15 A study performed in a small number of stroke patients found that [18F]FMISO activity did increase as perfusion declined to levels corresponding to those associated with the ischemic penumbra. However, increased tracer activity was found to overlap also with tissue CBF levels in the oligemic rather than the penumbra range, as well as with irreversibly damaged tissue identified with CT or DWI MRI. 40 Our results showed a variation in the size of increased [18F]FMISO uptake, with some animals exhibiting only limited hypoxic regions. In part, this will be a consequence of the inherent variation of the M2CAO model; some injuries are smaller and it stands to reason that there will be variation also in the volume of hypoxic regions. We interpret the variation in the volume of hypoxic regions as consequence also of the sustained function of leptomeningeal anastomoses in the M2CAO model; animals with good collateral status are likely to suffer less from tissue hypoxia. Determining the correlation between collateral status and the volume of hypoxic regions was however beyond the scope of this study. Another potential explanation for the variation in size of regions of increased [18F]FMISO uptake may be that part of the ischemic tissue had already lost its ability to bind [18F]FMISO by the time of PET acquisition, as has been described previously both in animal30,35 and human studies.16,38
We found that there was a loss of astrocytes in the core of hypoxic regions with increased pimonidazole uptake in the majority of animals (Figure 6). A loss of GFAP+ cells in the core of ischemic lesions has been reported previously,33,41,42 and has been correlated to astrocyte cell death.42,43 Considering that neurons cannot survive without close proximity to astrocytes, these regions may safely be considered to be destined for infarction. 44 Hypoxic astrocytes along the rim of the core lesion (Figure 6(B1, b)) would be expected to participate in reactive astrogliosis and glial scar formation. 33 Our results also showed how NeuN+ neurons were significantly more hypoxic than astrocytes when standardized against cells of corresponding cell types in control regions. Accordingly, our findings would support the proposition that astrocytes are more sensitive to hypoxia than neurons, i.e. astrocytes would seem to undergo destruction before reaching the relative levels of hypoxia seen in neurons.42,43 However, previous studies have demonstrated how, due to the aggregate and cumulative processes of necrosis and apoptosis, NeuN immunoreactivity within ischemic lesions decreases progressively up to 24 h of reperfusion after 90-min MCAO. 45 , 46 This means that the NeuN+ neurons located in hypoxia regions most likely consist of a mixture of manifestly necrotic cells, cells in the process of undergoing apoptosis, and cells that have incurred ischemic injury which will ultimately culminate in the initiation of apoptosis. Accordingly, while we are able to determine the relative level of hypoxia in NeuN+ cells contained in ischemic regions, we cannot conclusively identify the viability status of these cells when the tissue was harvested. For this reason, it is not possible to conclude that astrocytes are more sensitive to hypoxia than neurons from results presented in this study alone. It should be stated, also, that while we used pimonidazole as a surrogate for [18F]FMISO in the IF analysis, no direct comparison was performed between the [18F]FMISO and the pimonidazole datasets.
A further noteworthy observation is that there was one animal where no hypoxic region with increased pimonidazole intensity could be observed although the animal had a large ADC restriction which encompassed close to the entirety of the M2-supply region. A potential explanation for the lack of pimonidazole uptake in this animal could be that the rate of infarction proceeded at such a speed that the time needed for the pimonidazole accumulation within the hypoxic cells was not provided.
AIS causes low-blood flow ischemia which in turn results in cellular hypoxia.2,25 Hypoxia in itself is not rigidly defined but described as a deficiency in the amount of oxygen available to cells 2 in pathological conditions. Time is brain is an appropriate guiding principle for patient triage in the hyperacute phase of AIS, when mechanical thrombectomy assisted by diagnostic imaging has been proven beneficial. 3 Nonetheless, in the proportion of patients (≤30%) who suffer from slow-progressing infarcts, as well as in those who experience wake-up stroke or arrive in hospital beyond the first few hours after ictus, determining tissue status may be more appropriate than counting the hours since the last-known-well. 47 This is emphasized by recent reports on the potential of prolonged penumbra viability in stroke patients. The DAWN trial showed benefits of delayed thrombectomy in patients with limited ischemic lesions in combination with a clinical presentation consistent with the presence of functionally impaired tissue as long as 24 h after ictus. 48 Similar results were presented in DEFUSE 3 trial but with a time period of up to 16 h after ictus in patients with regions of ischemic yet viable tissue. 49 Imaging protocols capable of providing a direct assessment of hypoxic stress have the potential to improve the process of patient selection in the sub-acute phase of AIS, as well as in chronic atherosclerotic patients without a complete circle of Willis and with suspected neurological hypoperfusion symptoms such as cognitive deficits. 50 A key question in this context is thus to what extent [18F]FMISO is specific for the ischemic penumbra. An absolute validation using gold standard 15-O PET was beyond the scope of this study. Nevertheless, it is pertinent that, as revealed by IF analysis, there was a dramatic loss of GFAP+ astrocytes in core areas of regions with increased pimonidazole uptake. Meanwhile GFAP+ astrocytes remained in the periphery of those regions in the majority of animals. Since the uptake of pimonidazole is highly similar to that of [18F]FMISO, this implies that while [18F]FMISO uptake does identify severely hypoxic yet viable tissue, it also encompasses irreversibly damaged tissue. This conclusion is consistent with earlier work. 40 To increase the diagnostic value of [18F]FMISO, it should be combined with techniques adequate in identifying the ischemic core, such as CT or DWI MRI, and used in patients with slow-progressing AIS where the necessary accumulation time of [18F]FMISO may be less debilitating. Such examinations are potentially in reach with new hybrid systems such as MRI/PET and CT/PET. 51
Conclusion
While unsuited to the hyperacute phase due to its accumulation time, [18F]FMISO PET may hold high diagnostic value in cases of chronic hypoperfusion patients and in certain patient subgroups with slow-progressing infarct if combined with a technique such as DWI MRI to identify irreversibly damaged tissue. Results do not provide encouragement for the use of [64Cu]CuATSM in experimental stroke research.
Footnotes
Funding
The author(s) disclosed receipt of the following financial support for the research, authorship, and/or publication of this article: The study was funded and supported by The Söderberg foundation, Karolinska Institutet, Uppdrag Besegra Stroke, Stockholm County Council and MedTechLabs
Acknowledgments
We are grateful to the staff at Karolinska Experimental Research and Imaging Centre (KERIC) for their assistance.
Declaration of conflicting interests
The author(s) declared no potential conflicts of interest with respect to the research, authorship, and/or publication of this article.
Authors’ contributions
PL, FA, TT and SH designed the study. PL, FA, EJ, LL, AIJ and TT performed experiments. PL, LL, NM and JM performed the processing of raw data. PL and JM performed the analysis. PL, JM and SH interpreted results of the analysis. PL, FA, EJ, AIJ and SH contributed to the writing of the manuscript.