
Abstract
Diagnosis of post-stroke epilepsy is often challenging because of a low incidence of epileptiform abnormalities on electroencephalography (EEG). Hence, this study evaluated whether postictal subtraction single-photon emission computed tomography (SPECT) could visualize epileptic activity and act as a diagnostic modality in post-stroke epilepsy. Fifty post-stroke epilepsy patients, who had undergone Tc-99m-ECD SPECT twice (postictal and interictal), were enrolled. The postictal hyperperfusion area was identified by subtraction (postictal–interictal) SPECT and classified into two distribution types: superficial or deep-seated. Laterality and distribution of postictal hyperperfusion on subtraction SPECT were compared with stroke lesions, seizure symptoms, and epileptiform EEG findings. Forty-three of the 50 patients (86%) had hyperperfusion on subtraction SPECT and 26 (52%) had epileptiform EEG findings. Subtraction SPECT showed prolonged postictal hyperperfusion despite the relatively long interval between seizure end and postictal SPECT (median: 19.1 h, range: 2.2–112.5 h). The laterality of the hyperperfusion area had a high concordance rate with the laterality of stroke lesions (97.7%), seizure symptoms (91.9%), and epileptiform EEG findings (100%). Scalp EEG identified epileptiform activity more frequently in superficial type of SPECT, but less frequently in deep-seated type (both, P = 0.03). Postictal SPECT can be complementary to scalp EEG in endorsing the diagnosis and location of post-stroke epilepsy.
Keywords
Introduction
Post-stroke epilepsy (PSE) is related to poor prognosis and quality-of-life in post-stroke patients1–3 and is the major cause of acquired epilepsy in adults, most notably in the elderly.4,5 Multiple epidemiological studies have reported that the incidence of PSE is 3–5% in 1 year and 10–12% in 5–10 years after stroke.6,7
Diagnosis of PSE is often challenging; one reason being that it can manifest as a non-convulsive seizure, which often shares similar symptoms with neuropsychiatric disturbances such as post-stroke confusion. In addition, epileptiform discharges detected by scalp electroencephalogram (EEG) are scant and obscured by frequent focal slow in stroke8,9 and elderly patients. 10 Although long-term continuous EEG is desirable for correct diagnosis, it is usually unavailable in general hospitals or stroke centers, where most patients with PSE are admitted. Thus, alternative diagnostic procedures are warranted.
Ictal single-photon emission computed tomography (SPECT) can detect hyperperfusion at the epileptic focus during the ictal period and has long been used for pre-surgical evaluation in patients with intractable partial epilepsy.11–13 Ictal subtraction SPECT (subtraction images of interictal SPECT from ictal SPECT coregistered onto magnetic resonance imaging (MRI)) can objectively localize an epileptic focus more precisely than a single SPECT scan. 14 In addition, perfusion changes around the stroke lesion are difficult to detect by ictal SPECT without subtraction images in chronic stroke patients as a result of diaschisis and hypometabolism due to neuronal injury and subsequent neuronal cell loss, gliotic scarring, or functional inactivation. 15 However, subtraction SPECT has not been commonly used in the management of patients with PSE.
Our stroke center has clinically performed postictal SPECT, with additional postictal subtraction SPECT (subtraction images of interictal SPECT from postictal SPECT coregistered to MRI) to identify postictal hyperperfusion. The aim of the current study was to evaluate whether postictal subtraction SPECT can visualize epileptic activity and thus serve as a diagnostic modality in patients with PSE.
Materials and methods
Study protocol
This study was conducted as a single-center subanalysis of the multicenter prospective cohort PROgnosis of POst Stroke Epilepsy (PROPOSE) study (UMIN000019940). We retrospectively recruited 186 consecutive patients admitted to the Department of Stroke and Cerebrovascular Diseases in the National Cerebral and Cardiovascular Center (NCVC) and clinically diagnosed with PSE between April 2014 and January 2018 (Figure 1). All patients had a routine-length (∼20 min) scalp EEG. The final diagnosis of PSE for enrollment in PROPOSE study was verified at the consensus conference attended by two or more neurologists and one or two epileptologists (KKo and AS) with reference to seizure history, semiology, EEG findings, therapeutic response, and clinical course. The diagnostic inclusion criteria consisted of (1) recurrent (two or more) unprovoked seizures occurring >24 h apart, meeting the traditional definition proposed by the ILAE 16 or (2) one unprovoked seizure that met the practical clinical definition proposed by the ILAE 17 with epileptiform EEG findings or therapeutic response to antiepileptic drugs. One hundred and eighty-four patients were diagnosed and enrolled in the PROPOSE study through a consensus conference. Among them, 134 patients had cerebral blood flow-SPECT with 99mTc-ethyl cysteinate dimer (ECD-SPECT) early after admission (as postictal SPECT). Only patients having a follow-up SPECT scan with an interval of 4 days or more after an initial SPECT scan (as interictal SPECT; n = 55) were selected. Patients who did not undergo MRI scans (n = 5), which were used for making the subtraction images of interictal SPECT from postictal SPECT coregistered to MRI, were excluded. Finally, 50 patients with cerebral infarction (n = 24), intracerebral hemorrhage (n = 23), and subarachnoid hemorrhage (n = 3) were examined; (n = 3) had multiple stroke subtypes.
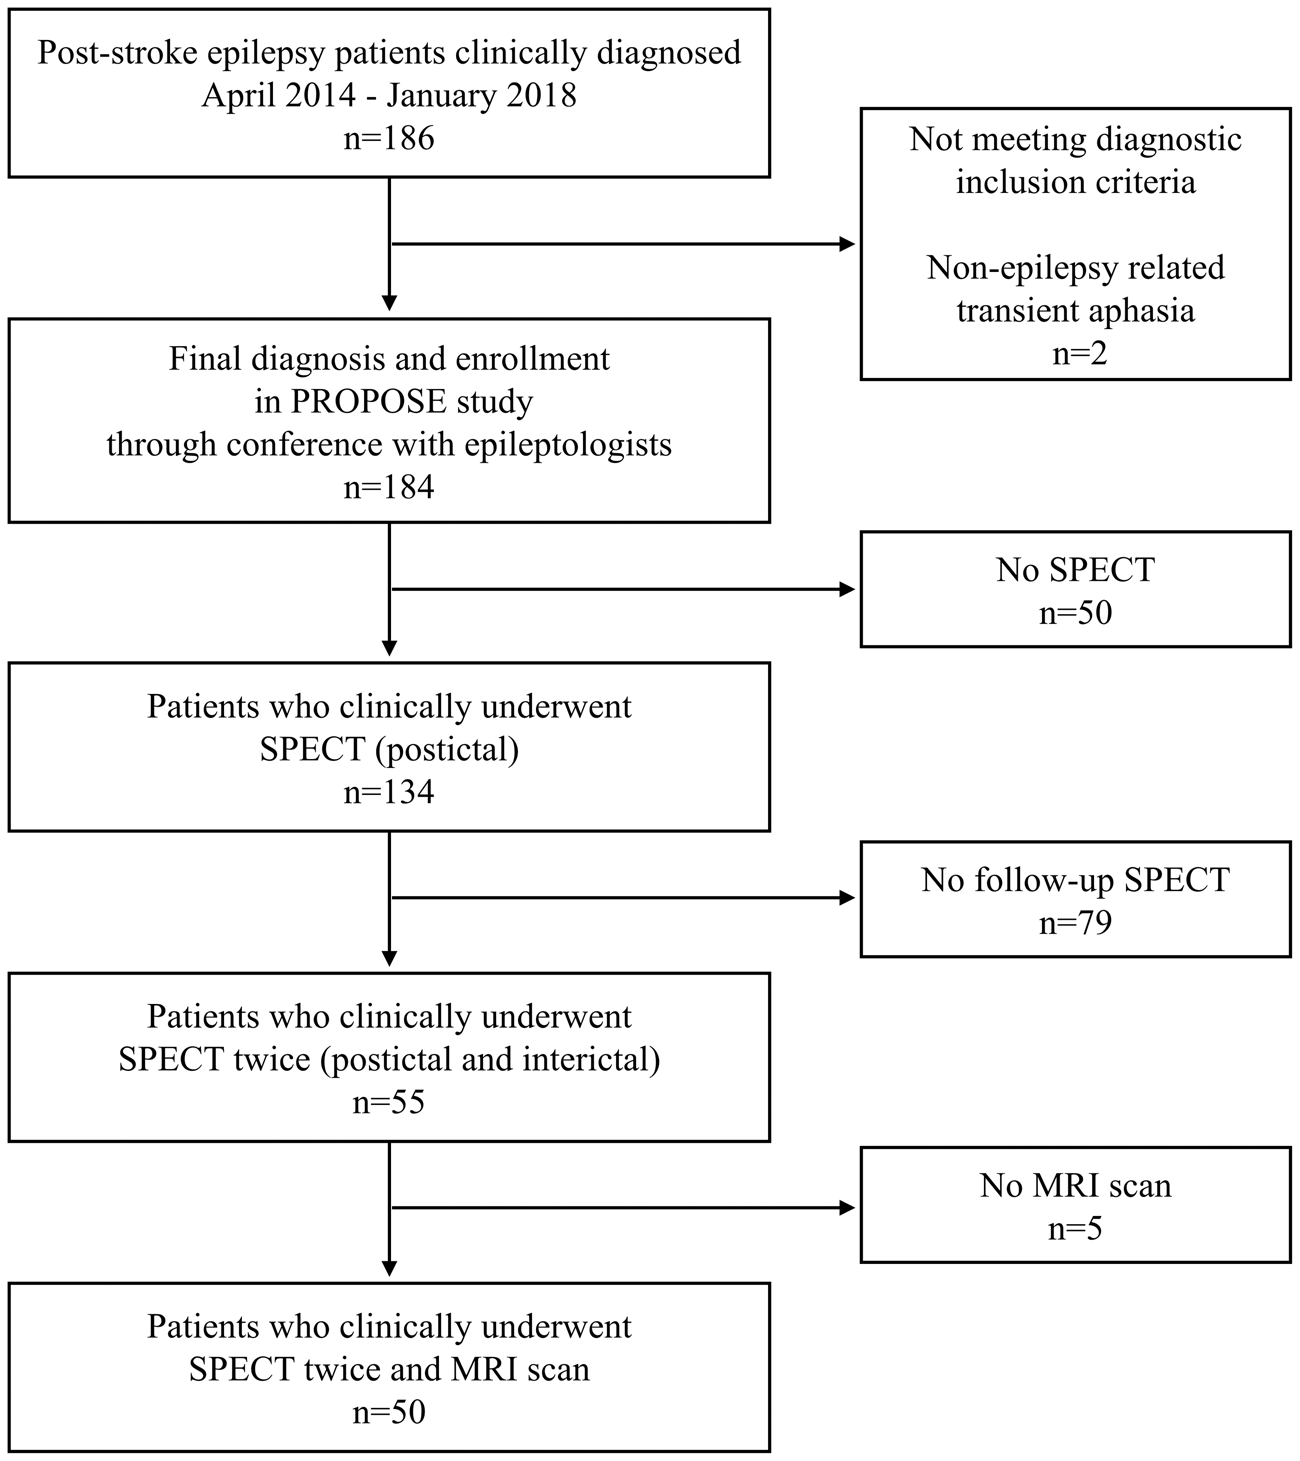
Study protocol. We enrolled 50 patients who were diagnosed with post-stroke epilepsy and clinically underwent Tc-99m-ECD SPECT twice (postictal and interictal) and MRI scan.
The present study was approved by the ethics Committee of the National Cerebral and Cardiovascular Center. We assert that all procedures contributing to this work complied with the ethical standards of the relevant national guidelines on human experimentation and with the Helsinki Declaration of 1975, as revised in 2008. Written informed consent for the research, including initial and follow-up SPECT, was provided by patients. If written informed consent was not available before SPECT imaging (e.g., as a result of patient’s disability or impaired consciousness) oral informed consent, through an opt-out process, preceded written consent. Since we intended to use the data in a multicenter study for our single-center subanalysis, the present study was disclosed with an opt-out choice on the center website. No patients refused to participate in the study subsequently.
Evaluation of EEG and seizure semiology
The localization of epileptiform abnormalities in all scalp EEGs was evaluated by two board-certified epileptologists (KKo and AS), who were blind to clinical details. Epileptiform EEG findings were defined as interictal epileptiform (spike and sharp waves), periodic, or ictal epileptiform, discharges based on the International Federation of Clinical Neurophysiology (http://www.ifcn.info/showcontent.aspx?MenuID=1169) and American Clinical Neurophysiology Society (https://www.acns.org/practice/guidelines) guidelines and consensus statements. The laterality of the symptomatogenic zone, the cortex that produces ictal symptoms, was determined in reference to semiology, lateralizing signs, such as unilateral tonic/clonic seizure, eye and head version, and aphasia. 18
SPECT data acquisition and analysis
Patients were placed in a supine position with their eyes closed in a quiet and dimly lit environment for 5 min and 16.2 mCi (600 MBq) of 99mTc-ECD was injected intravenously. During the scan, no abnormal behaviors were observed, and patients did not report any subjective manifestations of seizures. Imaging data were acquired using a dual-headed gamma camera (ECAM, Siemens) 15 min after the injection of the tracer, with a scan duration of 20 min. The image field-of-view contained the entire brain and cerebellum. The projection data were processed with a filtered back projection, and the Chang attenuation correction applied.
Postictal subtraction SPECT
The perfusion changes between the initial (postictal) and follow-up (interictal) SPECT were identified using subtraction ictal SPECT coregistered to MRI (SISCOM) method, as described previously. 14 Briefly, each patient’s postictal and interictal SPECT scans were coregistered to the MRI scan of each patient, using an automated image registration program. 19 The count of each voxel in the postictal and interictal perfusion SPECT images was normalized according to global mean voxel counts. Normalized postictal and interictal SPECT images were subtracted to obtain postictal–interictal difference. The mean and standard deviations of global change in perfusion were calculated in the subtraction image of each patient. The voxels with the count beyond two standard deviations (z-score = ±2) were regarded as a significant change. The cluster extent threshold was set to 125, which was equivalent to the spatial resolution of SPECT in tissue. 20 The brain regions with a significant increase in perfusion were superimposed on the tomographic and surface rendering images of MRI.
Time intervals from seizure end-to-initial SPECT
Time intervals from seizure end-to-initial SPECT were calculated. Wilcoxon signed-rank test was performed to analyze the relationship between time interval and incidence of perfusion changes on subtraction SPECT.
Localization of perfusion changes in SPECT and structural lesions in MRI
We visually localized perfusion changes on subtraction SPECT and structural lesions in MRI. In order to ensure the consistency between imaging and EEG data, brain regions were classified into five areas: frontal (superior, middle, inferior, and orbital gyrus), central (precentral and postcentral gyrus), parietal (superior and inferior parietal lobules, and precuneus), occipital (cuneus, lingual gyrus and superior, middle, and inferior occipital gyrus), and temporal (superior, middle, and inferior temporal gyrus, Heschl’s gyrus, and temporal pole) areas. If two or more regions were involved, the localization was classified into multiple areas. The laterality of the perfusion changes on subtraction SPECT was compared with that of the structural lesions, symptomatogenic zone, and epileptiform EEG findings. Furthermore, the localization of perfusion changes was also compared with that of the epileptiform EEG findings. A representative concordant case is presented in Figure 2.
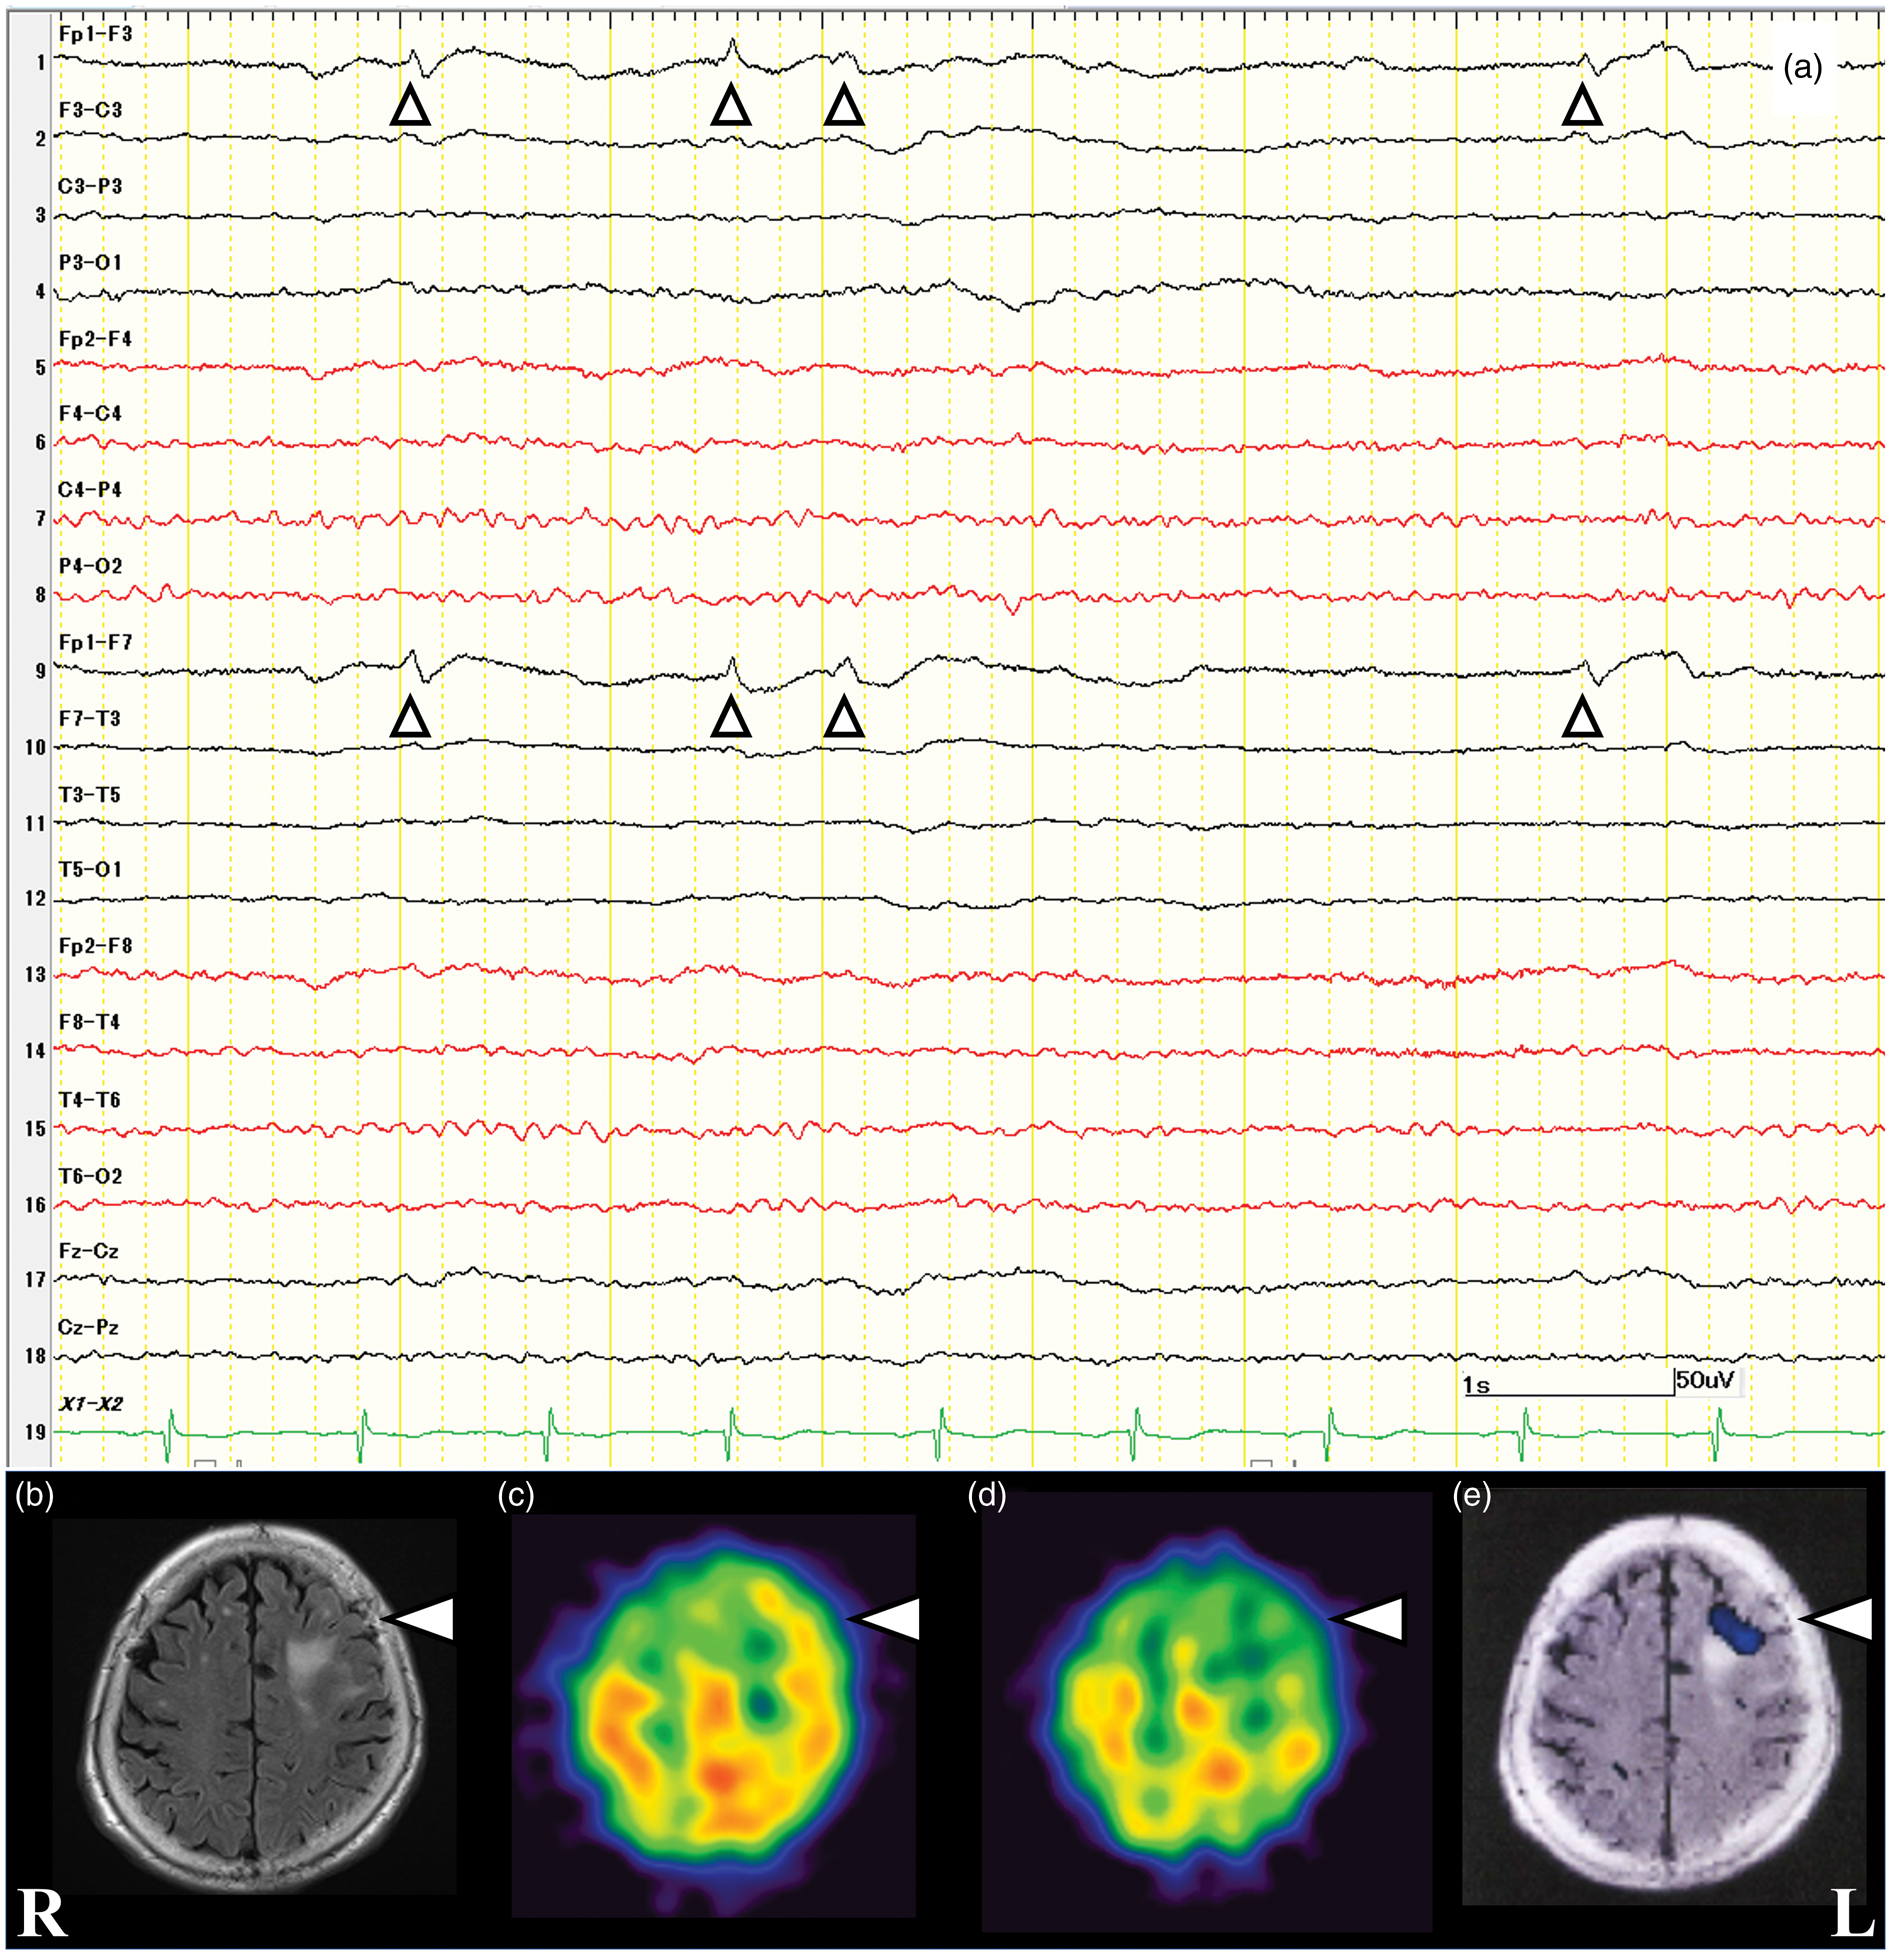
Imaging and electroencephalography findings in a representative concordant case. (a) A woman aged 85 years presented with seizure in the form of eye version to the right side and clonic seizure of the right hemibody with subsequent secondary generalized convulsion; semiology suggested a symptomatogenic zone in the left hemisphere. Seizure end came after intravenously administered benzodiazepines, and initial electroencephalography (EEG), recorded on admission, showed sharp waves and periodic discharges in the left frontopolar regions. EEG was recorded with a bipolar montage with the high-frequency filter set at 50 Hz. The vertical marker represents 50 μV, and the horizontal marker, 1 s. (b) MRI fluid-attenuated inversion images on admission showing chronic infarction (arrowhead) in the left frontal lobe (structural lesions). (c) Initial SPECT performed 3 days after seizure end. (d) Follow-up SPECT performed 7 days after the initial SPECT. (e) Subtraction SPECT coregistered to MRI showing prolonged postictal hyperperfusion adjacent to the old infarct in the left frontal lobe. The laterality of hyperperfusion was concordant with MRI, clinical, and EEG findings. The localization of hyperperfusion also corresponded to that of epileptiform EEG findings. R: right; L: left.
Distribution type classification of subtraction SPECT compared with EEG findings
We classified the distribution of perfusion changes in SPECT into two types: (1) superficial type (outer side or convexity of cerebral hemisphere) and (2) deep-seated type (medial side or deep area of cerebral hemisphere, such as interhemispheric fissure or deep area close to lateral and third cerebral ventricles, except the thalamus, and basal ganglia; Figure 3). Distribution types of perfusion changes were independently assessed by a stroke neurologist (KF) and a neuronuclear medicine specialist (KKa) blinded to clinical information and EEG findings. Interobserver inconsistencies were resolved through consensus meetings. To evaluate intraobserver reliability, the assessment was performed twice, with an interval, by one of the observers (KF). Distribution types of perfusion changes were compared using Pearson chi-square test or Fisher exact test between the patients with and without epileptiform EEG findings.
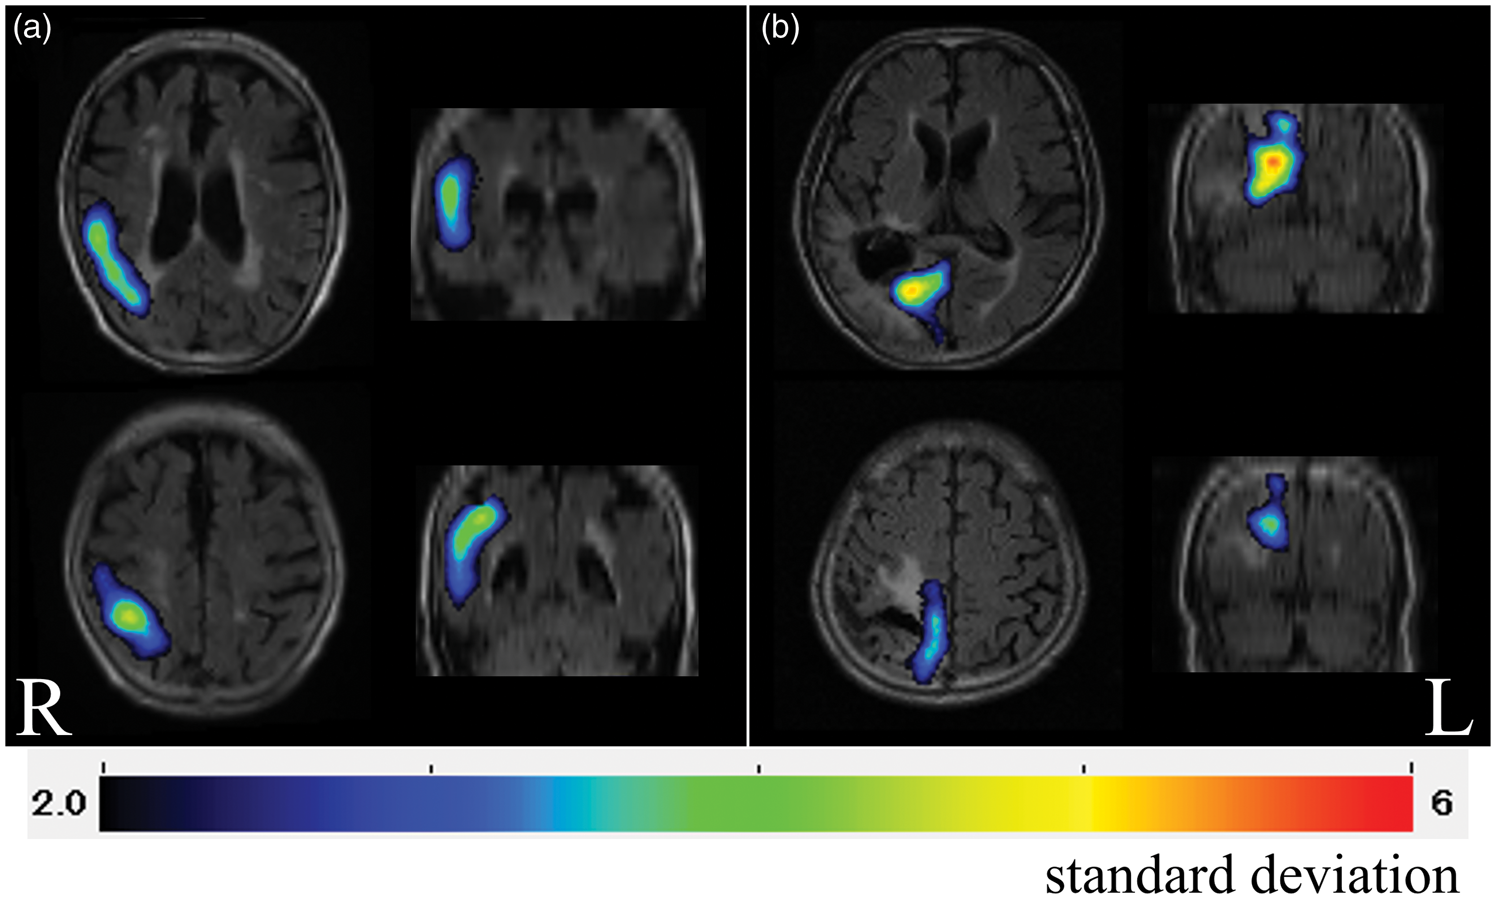
Distribution type classification of hyperperfusion on subtraction SPECT. (a) Superficial type; subtraction SPECT images showing hyperperfusion located on the outer side or convexity of the cerebral hemisphere. (b) Deep-seated type; subtraction SPECT images showing hyperperfusion located on the medial side or deep area of the cerebral hemisphere, such as interhemispheric fissure or deep area close to the lateral and third ventricles, except the thalamus and basal ganglia. R: right; L: left.
Results
Patient characteristics
Patient characteristics are shown in Table 1. Forty-three of the 50 patients (86%) presented lateralizing signs and 26 (52%) had epileptiform EEG findings.
Patient characteristics.
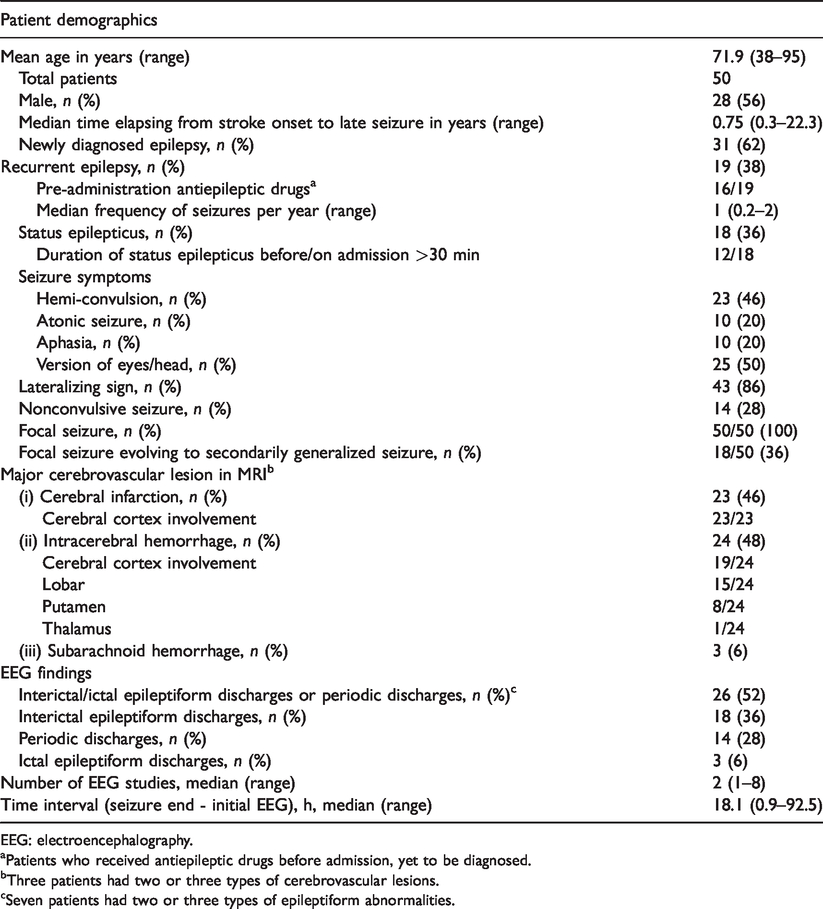
EEG: electroencephalography.
aPatients who received antiepileptic drugs before admission, yet to be diagnosed.
bThree patients had two or three types of cerebrovascular lesions.
cSeven patients had two or three types of epileptiform abnormalities.
Time intervals from seizure end-to-initial SPECT and EEG
Subtraction SPECT detected hyperperfusion in 43 of 50 patients (86%), which was restricted in the frontal region in four patients and spread to two or more regions in the remaining 39 patients. Interobserver agreement for the region with hyperperfusion was 96%, with a Kappa statistic of 0.85. Intraobserver reliability for hyperperfusion was 98%, with a Kappa statistic of 0.92. The median time interval from seizure end to initial SPECT was 19.1 h (range: 2.2–112.5 h), indicating that hyperperfusion prolonged hours after seizure end in PSE. A major reason for the difference in time interval was the timing of admission: the time intervals in 10 patients admitted during weekday daytime hours were significant shorter than 40 patients admitted during evening or the weekend hours (median 8.0 vs. 20.6 h, P = 0.01, Wilcoxon signed-rank test). Moreover, there was no difference in the incidence of hyperperfusion between the two timings of admission (9 of 10 patients (90%) vs. 34 of 40 patients (85%), P = 1.0, Fisher exact test). Table 2 shows the time intervals from seizure end-to-initial SPECT in patients with and without hyperperfusion. There was no difference in the interval between patients with, and those without, hyperperfusion (P = 0.62). The median time interval from seizure end-to-initial EEG was 18.1 h (range: 0.9–92.5 h). Wilcoxon signed-rank test showed time intervals from seizure end to initial SPECT were significantly longer than from seizure end to initial EEG (P = 0.008). The incidence of hyperperfusion on subtraction SPECT was higher, though not significant (86% vs. 52%; Pearson chi-square test, P = 0.77), than that of epileptiform findings on EEG.
Time intervals from seizure end to initial SPECT in patients with and without hyperperfusion.
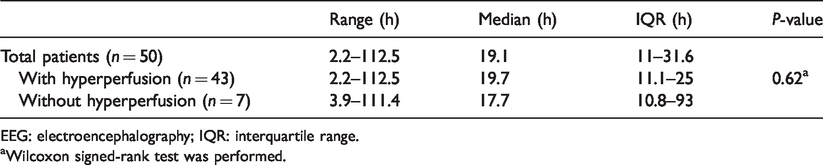
EEG: electroencephalography; IQR: interquartile range.
aWilcoxon signed-rank test was performed.
Concordance of subtraction SPECT with MRI lesions, seizure semiology, and EEG findings
Epileptiform EEG findings were observed in 26 patients. Hyperperfusion was observed in 22 of 26 patients with epileptiform EEG findings (84.6%) and 21 of 24 patients without epileptiform EEG findings (87.5%). There was no difference in the incidence of hyperperfusion between the two groups (P = 0.77, Pearson chi-squared test).
Regarding lateralization concordance, the laterality of hyperperfusion area on the postictal subtraction SPECT had a high concordance rate with that of structural lesions (97.7%), symptomatogenic zone (91.9%), and epileptiform EEG findings (100%). Regarding localization concordance, the brain area with hyperperfusion on the postictal subtraction SPECT images corresponded to that with epileptiform discharges on EEG in 16 of 21 patients, who had both hyperperfusion and epileptiform EEG findings (76.2%; Figure 4).
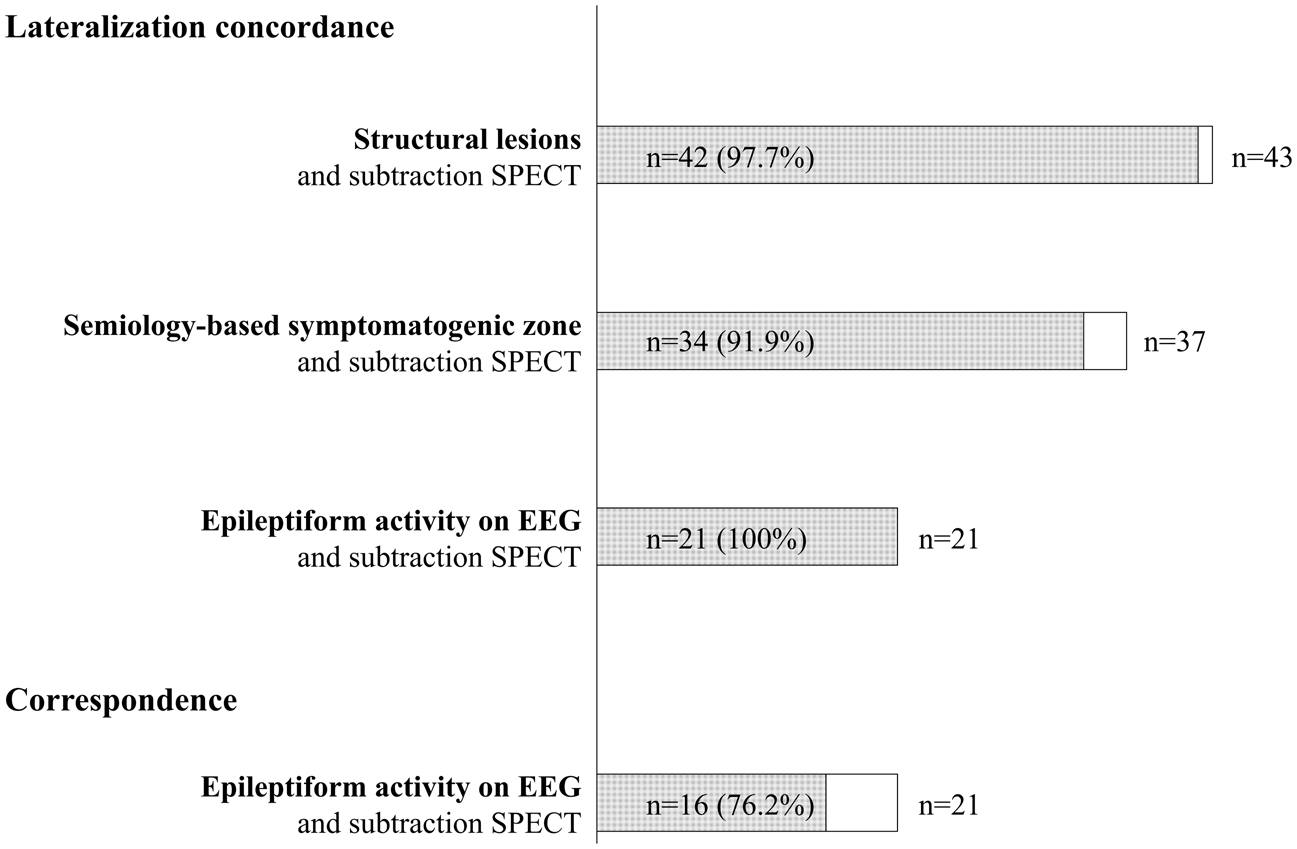
Lateralization concordance of subtraction SPECT with MRI lesions, seizure semiology, and EEG findings. Hyperperfusion area and structural lesions on MRI were observed in the same hemisphere in 42 patients of 43 patients with hyperperfusion on the subtraction SPECT (97.7%). Hyperperfusion area and semiology-based symptomatogenic zone were identified in the same hemisphere in 34 of 37 patients who had both hyperperfusion and lateralizing sign (91.9%). Hyperperfusion area and epileptiform activity on EEG were observed in the same hemisphere in 21 of 21 patients who had both hyperperfusion and epileptiform EEG findings (100%).
Supplemental Table 1 shows a comparison of EEG and SPECT findings with seizure symptoms. Supplemental Table 2 summarizes seizure symptoms and EEG findings in patients without hyperperfusion. Supplemental Table 3 summarizes clinical characteristics in patients with or without hyperperfusion. There was no difference in characteristic patterns of seizure symptoms or EEG findings between the patients with and without hyperperfusion.
Distribution types of hyperperfusion and epileptiform EEG findings
Hyperperfusion was observed in the superficial area in 36 patients, the deep-seated area in 30, and both of them in 23 (Figure 5(a)). Interobserver agreement for distribution type classification was 88%, with a Kappa statistic of 0.82. Intraobserver agreement for distribution type classification was 96%, with a Kappa statistic of 0.94. EEG identified epileptiform activity more frequently in superficial type, but less frequently in deep-seated type of hyperperfusion (both, P = 0.03; Figure 5(b) and (c), respectively).
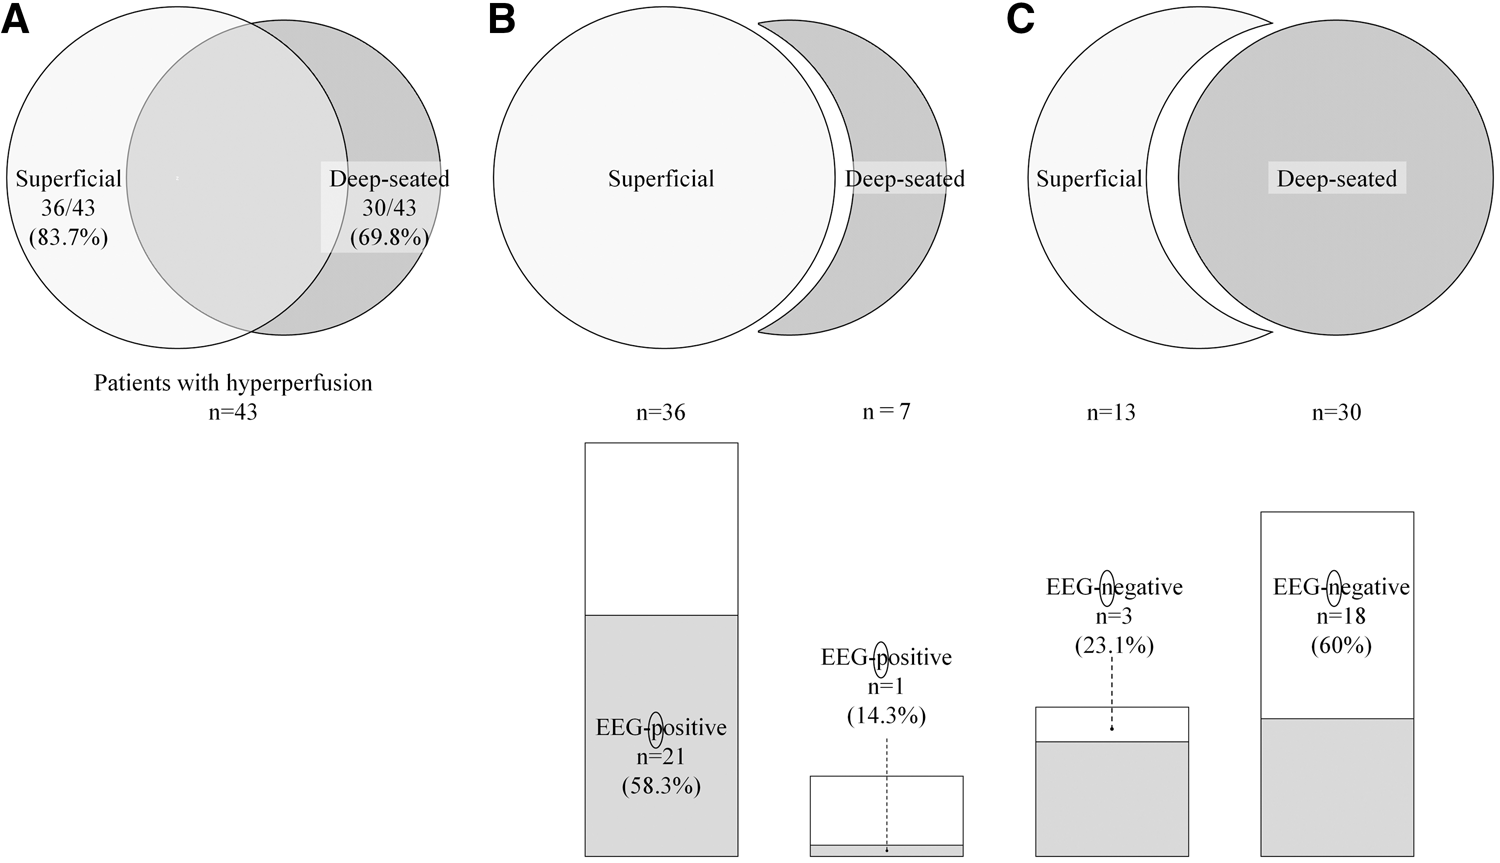
Distribution types of hyperperfusion and epileptiform EEG findings. (a) Among 43 patients with hyperperfusion on the subtraction SPECT, hyperperfusion was observed in the superficial area in 36 patients (83.7%), the deep-seated area in 30 (69.8%), and both areas in 23 (53.5%). (b) Scalp electroencephalography (EEG) was positive for epileptiform activity more frequently in the superficial, than strict deep-seated, type (not including superficial type) of SPECT (21 of 36 vs. 1 of 7; 58.3% vs. 14.3%, P = 0.03). (c) Scalp EEG was negative for epileptiform activity more frequently in deep-seated, than strict superficial, type (not including deep-seated type) of SPECT (18 of 30 vs. 3 of 13; 60% vs. 23.1%, P = 0.03).
Discussion
This study yielded three main results in patients with PSE. First, postictal hyperperfusion, detected by the subtraction SPECT, prolonged for many hours or even days. Second, the hyperperfusion area on the postictal subtraction SPECT was concordant with seizure semiology, MRI, and EEG findings in terms of laterality and distribution. Third, the postictal subtraction SPECT detected hyperperfusion even in patients without epileptiform discharges in a scalp EEG.
Our study demonstrated that postictal hyperperfusion prolonged for hours, even days, in patients with PSE. In intractable focal epilepsy other than PSE, regional perfusion increases during seizure and decreases soon after the seizure ends. The perfusion change occurs within minutes in temporal lobe epilepsy12,21 and an even shorter duration (approximately 10–15 s) in extratemporal lobe epilepsy. 22 Unlike the typical perfusion changes, our results demonstrate the novel finding that postictal hyperperfusion prolongs in PSE. The reason for the prolonged hyperperfusion in PSE remains unclear. Our study found no apparent clinical, EEG, or imaging determinants in the SPECT findings. Recent studies have shown a decrease in regional perfusion after ictal hyperperfusion is mediated by vasoconstriction in the arteriole.23,24 Therefore, one possible reason for the prolonged hyperperfusion in PSE is impaired vasoreactivity caused by stroke. 25 In other words, presence of stroke lesions could be the cause of the postictal hyperperfusion per se. Aging, 26 hypertension, 27 and diabetes, 28 all of which are often accompanied by stroke, also change vasoreactivity and may have additional effects. Another possible reason is an increase in the excitability and synchrony of neuronal networks due to deafferentation, selective neuronal loss, neurodegeneration, collateral synaptic sprouting, and altered synaptic plasticity after stroke.3,29,30
The incidence of hyperperfusion was significantly higher in poststroke epilepsy than elderly epilepsy without stroke (43 of 50 vs. 2 of 18 patients; 86% vs. 11%, P < 0.001; unpublished data), further supporting the notion that stroke lesions themselves underlie the postictal hyperperfusion. Further basic and clinical research is, thus, warranted to clarify the exact mechanisms behind the stroke-related factors underlying postictal hyperperfusion. In clinical practice, ictal SPECT with radiotracer injection immediately after seizure onset is difficult to perform in patients with PSE as a result of the lower frequency of seizures, clinically unapparent seizure manifestations (e.g., coma, severe neurological sequel, or nonconvulsive seizure), or instability in the patient’s condition. It is noteworthy, therefore, that postictal SPECT can provide a wide range of diagnostic time window for PSE, even hours or days after seizure end.
Another interesting point in the current study was the hyperperfusion area on postictal subtraction SPECT remaining concordant with seizure semiology, MRI, and EEG findings in terms of laterality or distribution. In the presurgical evaluation of epilepsy, the epileptogenic zone 31 is determined based on concordance of clinical data including EEG, MRI, ictal SPECT, positron emission tomography, and seizure semiology. In particular, hyperperfusion on ictal SPECT is known to reflect seizure origin before propagation of epileptiform activity. 19 Additionally, a previous study reported that epileptogenic focus localized by seizure semiology and EEG is coherent with the stroke lesions in PSE. 32 In light of this, the current study suggests prolonged postictal hyperperfusion, concordant with seizure semiology, MRI, and EEG findings, can reflect the propagating and remaining epileptiform activity after PSE, which may have a diagnostic value for PSE.
Notably, hyperperfusion was detected with sufficient sensitivity, even in patients without epileptiform discharges in scalp EEG. Scalp EEG often fails to detect epileptic activity when the epileptic focus is located in deep-seated areas.31,33,34 In addition, epileptiform discharges may be small in patients with PSE as neural damage caused by stroke decreases the epileptic potential. 35 In contrast, previous studies have shown ictal subtraction SPECT has a high potential to detect epileptic activity in deep-seated areas, such as the mid-cingulate gyrus or hypothalamus, in patients with cortical dysplasia 33 and hamartomas. 34 Similarly, the current study showed postictal subtraction SPECT was sensitive enough (86%) to identify hyperperfusion in deep-seated areas, even in PSE patients without epileptiform EEG findings. Therefore, postictal subtraction SPECT could be advantageous to detect epileptic activity arising from or propagating to the deep-seated area, in comparison to scalp EEG. Thus, postictal subtraction SPECT may be used to complement scalp EEG.
This study has several limitations. First, we assessed only patients who underwent SPECT twice clinically. This introduced the potential for selection bias as patients with nonconvulsive status epilepticus, or those difficult to diagnose, tend to undergo repeated SPECT scans. Second, there was a time lag between evaluation of ictal semiology, EEG, and initial SPECT, which may have affected the concordance rates between the lateralized and localized areas. Third, the diagnosis of PSE was not always EEG-based because of the lower incidence of epileptiform EEG abnormalities in PSE. 36 Moreover, past studies showed 99mTc-ECD SPECT imaging may fail to show hyperperfusion in patients with strokes as compared with 99mTc-hexamethyl propylene amine oxim, 123I-iodoamphetamine, and 133xenon studies.37–40 Thus, hyperperfusion could potentially be underestimated in this study. Finally, we used SPECT to measure cerebral perfusion in the current study, which is not always available in clinical routine. Efforts are being made to replace this technique with other modalities, such as less invasive MRI arterial spin labeling, which does not result in radiation exposure.
In summary, our study demonstrates PSE patients present prolonged postictal hyperperfusion concordant with seizure semiology and EEG findings and that SPECT may complement scalp EEG in PSE. Postictal SPECT thus has potential in the diagnosis of PSE, especially in patients without epileptiform discharges on EEG. Additionally, postictal SPECT has a wide diagnostic time window, allowing a diagnosis of PSE hours, or even days, after seizure end. Postictal subtraction SPECT may serve as a promising modality in the diagnosis and localization of PSE.
Supplemental Material
JCB902742 Supplemental Material - Supplemental material for Visualizing prolonged hyperperfusion in post-stroke epilepsy using postictal subtraction SPECT
Supplemental material, JCB902742 Supplemental Material for Visualizing prolonged hyperperfusion in post-stroke epilepsy using postictal subtraction SPECT by Kazuki Fukuma, Katsufumi Kajimoto, Tomotaka Tanaka, Shigetoshi Takaya, Katsuya Kobayashi, Akihiro Shimotake, Riki Matsumoto, Akio Ikeda, Kazunori Toyoda and Masafumi Ihara in Journal of Cerebral Blood Flow & Metabolism
Footnotes
Funding
The author(s) disclosed receipt of the following financial support for the research, authorship, and/or publication of this article: This research was supported by the Practical Research Project for Lifestyle-related Diseases including Cardiovascular Diseases and Diabetes Mellitus from the Japan Agency for Medical Research and Development (AMED). This study was also partially supported by the Japan Society for the Promotion of Science (JSPS) (16K09715 and 19K16888). Role of the Funder/Sponsor: AMED and JSPS had no role in the design and conduct of the study; collection, management, analysis, and interpretation of the data; preparation, review, or approval of the manuscript; and decision to submit the manuscript for publication.
Declaration of conflicting interests
The author(s) declared the following potential conflicts of interest with respect to the research, authorship, and/or publication of this article: Department of Epilepsy, Movement Disorders, and Physiology, Kyoto University Graduate School of Medicine was an endowment department supported by a grant from GlaxoSmithKline K.K., NIHON KOHDEN CORPORATION, Otsuka Pharmaceutical Co., and UCB Japan Co., Ltd. until May 2018. Since 1 June 2018, this department has changed to the Industry-Academia Collaboration Courses. All other authors declare that they have no conflict of interest.
Authors’ contributions
KF: study conception and design; data acquisition, analysis, and interpretation; drafting of the paper; KKa: study conception; imaging data analysis and interpretation; TT: study conception and design; data acquisition; ST: study design; critical revision of the manuscript; KKo: EEG analysis and interpretation; diagnosis; AS: EEG analysis and interpretation; diagnosis; RM: critical revision of the manuscript; AI: data interpretation; critical revision of the manuscript; KT: critical revision of the manuscript; and MI: study conception and design; data interpretation; critical revision of the manuscript. All authors approved the final version of the manuscript.
Supplemental material
Supplemental material for this article is available online.
References
Supplementary Material
Please find the following supplemental material available below.
For Open Access articles published under a Creative Commons License, all supplemental material carries the same license as the article it is associated with.
For non-Open Access articles published, all supplemental material carries a non-exclusive license, and permission requests for re-use of supplemental material or any part of supplemental material shall be sent directly to the copyright owner as specified in the copyright notice associated with the article.