
Abstract
Alzheimer's disease (AD) and subcortical ischemic vascular dementia (SIVD) have overlapping pathologies and risk factors, but their underlying neurodegenerative mechanisms are basically different. We performed magnetic resonance spectroscopy (MRS) to study metabolite differences between the two diseases
Keywords
Introduction
Atrophy of the hippocampus is a well-recognized feature of Alzheimer's disease (AD) and is one of the hallmarks for diagnosis of the disease. Burton et al (2009) reported that medial temporal atrophy was well correlated with neurofibrillary tangle pathology and was a highly accurate diagnostic marker for AD. However, although less prominently, hippocampal atrophy can be seen in patients with other types of dementia such as dementia with Lewy bodies and subcortical ischemic vascular dementia (SIVD), and this reduces the certainty of diagnosis using hippocampal morphometry. In fact, in one autopsy study, patients with SIVD had 18.2% smaller mean hippocampal volume than cognitively normal subjects and 11.1% larger mean hippocampal volume than patients with AD (Du et al, 2002).
Although the etiologies of AD and SIVD differ, vascular risk factors, such as hypertension, hyperlipidemia, diabetes mellitus and metabolic syndrome, predispose to both AD and SIVD (de la Torre, 2010). Several clinicopathological studies have postulated that the presence of lacunar infarcts significantly increases the risk for dementia among individuals with AD lesions (Esiri et al, 1999; Launer et al, 2008). Furthermore, histopathological studies disclosed a significant number of demented patients with both Alzheimer's pathology and vascular lesions. Petrovitch et al (2001) reported Alzheimer's pathology present in 20% of demented patients, vascular lesions present in 24%, and mixed pathologies (i.e., AD and vascular dementia (VaD)) present in 45% in the Honolulu-Asia Aging Study. Despite such similarities, it is important to differentiate between AD and SIVD, because failure to make this distinction inevitably limits the possible accuracy of research into prevention, risk factors, and pathophysiology, and the search for treatments of most benefit to patients.
Magnetic resonance spectroscopy (MRS) reveals biochemical features of diseases noninvasively and has been widely used in the evaluation of brain disorders. There have been several attempts to adopt this technique for differential diagnosis of AD and VaD. Several such attempts have relied on comparison of concentration ratios without identifying specifically how each metabolite concentration actually changed. Several studies found myoinositol/creatine and phosphocreatine (mIns/Cr) ratios significantly raised in patients with AD, but unchanged in SIVD cases: Waldman et al (2002) measured brain concentrations of
The failure of these mixed results to produce a coherent picture highlights two sources of uncertainty: first, the lack of detail on specific metabolite profile changes; and second, the heterogeneity of pathologies included in ‘vascular diseases,’ such as post-stroke dementia, multiinfarct dementia, and strategic infarcts or large artery disease, cardiac embolic events, and small vessel disease. This present study was intended to reduce those uncertainties, both by attempting improved metabolite level measurements and by narrowing patient selection from VaD to fit the description of ‘SIVD’; this latter is not an entirely established concept, but in pragmatic terms it should narrow the range of etiologies from ‘VaDs’ to those caused by arteriosclerosis of small vessel disease and characterized by lacunar infarcts, focal and diffuse ischemic white matter lesions, and incomplete ischemic injury. Also, to the extent that the concept is accepted, SIVD is the commonest subclass of VaD (Bowler, 2007), and the onset is usually insidious and challenging to separate from AD. We applied single-voxel proton MRS to obtain high-quality spectra, and the results were explored by both relative and absolute quantifications. The volumes of interest (VOI) were set in the right and left hippocampus and posterior cingulate and precuneal cortices (PCC), since our previous study of voxel-based morphometry (VBM) showed that those regions are commonly affected in AD patients (Shiino et al, 2006).
Subjects and methods
Originally, 37 patients with SIVD and 129 patients with AD were recruited consecutively and prospectively for this study. The patients were screened carefully on the basis of clinical history and interviews with relatives and/or caregivers, psychological test results, blood and biochemistry data including thyroid hormones and blood vitamins (B1, B2, B12, and folate), and findings on brain magnetic resonance imaging. A basic set of psychological tests consisting of Mini-Mental State Examination (MMSE), Clinical Dementia Rating, Japanese Wechsler Adult Intelligence Scale-Revised (Shinagawa et al, 1990) and Japanese Wechsler Memory Scale-Revised (Sugishita, 2001), Trail-Making Test-A and -B, verbal fluency test, and Zung Self-rating Depression Scale (SDS) were performed. Tests including the Frontal Assessment Battery and Wisconsin Card Sorting Test were added when necessary.
Dementia was diagnosed in accordance with the Diagnostic and Statistical Manual of Mental Disorders, Fourth Edition (American Psychiatric Association, 1994). Patients with AD fulfilled the NINCDS-ADRDA criteria for probable AD (McKhann et al, 1984), and those with SIVD met the criteria for possible Binswanger's disease proposed by Bennett et al (1990) and modified NINDS-AIREN criteria (Erkinjuntti et al, 2000). Patients who scored ≥ 40 on the SDS, those with a condition corresponding to depression or mood disorders according to the International Classification of Diseases-10, those with a history of organic disorder of the brain (nonlacunar infarction, subarachnoid hemorrhage, epilepsy, head trauma, brain tumor, Parkinson's disease, etc.) were excluded from the study. Patients suspected of having dementia other than AD, such as Lewy body disease and frontotemporal lobar degeneration, were excluded. Patients with SIVD who were suspected of having idiopathic normal pressure hydrocephalus or mixed dementia were also excluded from the study. Patients judged inappropriate for other reasons by the researchers were excluded according to the research criteria of Dubois et al (2007). Since distinguishing AD from SIVD was complex but essential to the study, AD patients who had deep white matter legions of early-confluent or confluent type and/or one or more lacunar infarctions on MR images were excluded from the study. All SIVD patients had confluent type of deep white matter lesions, atrophy of the white matter with enlargement of lateral ventricles, five and more lacunar infarctions and no family history of AD.
Initially, 49 subjects were recruited from among volunteers aged> 60 years as possible control subjects. All control subjects had a score of ≥ 26, in both the MMSE and the Japanese version of the Montreal Cognitive Assessment (Fujiwara et al, 2010). Individuals showing leukoaraiosis on magnetic resonance imaging were not immediately regarded as unhealthy, but subjects with risk factors for cerebrovascular disorders such as hypertension and diabetes, those with vascular diseases such as lacunar infarction and microhemorrhage, and those with a Clinical Dementia Rating score other than zero were excluded from the study.
The MR spectra with %SD (Cramer—Rao lower bounds) of metabolite peaks of interest> 20% were excluded. As a result, the final subjects for this study were 30 patients with SIVD, 99 patients with AD, and 45 elderly controls (EC).
Magnetic resonance imaging and MRS were conducted on a 1.5-T scanner (Signa Lx, General Electric Medical Systems, Milwaukee, WI, USA) at our university. The VOI for MRS were set in three regions: the left and right hippocampi and the PCC on bilateral medial cortices (Figure 1). Each patient was positioned with the neck extended by placing a pillow behind the shoulders until the long axis of the hippocampus became parallel to the axial plane. To set the VOI on the hippocampus, T2-weighted images (repetition time/echo time = 4,000/107 milliseconds, slice thickness = 3 mm, gapless, 15 slices) were acquired in the coronal plane perpendicular to the long axis of the hippocampal formation. To set the VOI on the PCC, sagittal T1-weighted images (repetition time/echo time = 68/1.6 milliseconds, flip angle = 60, slice thickness = 5 mm, gapless, 17 slices) and axial T2-weighted images were used. Magnetic resonance spectroscopy was performed using a fully automated point-resolved spectroscopy (PRESS) sequence (Probe-P, GE Medical Systems, Milwaukee, WI, USA) with TR = 2000 milliseconds and TE = 30 milliseconds. The number of excitations was 192 in the hippocampus, 128 in the PCC.
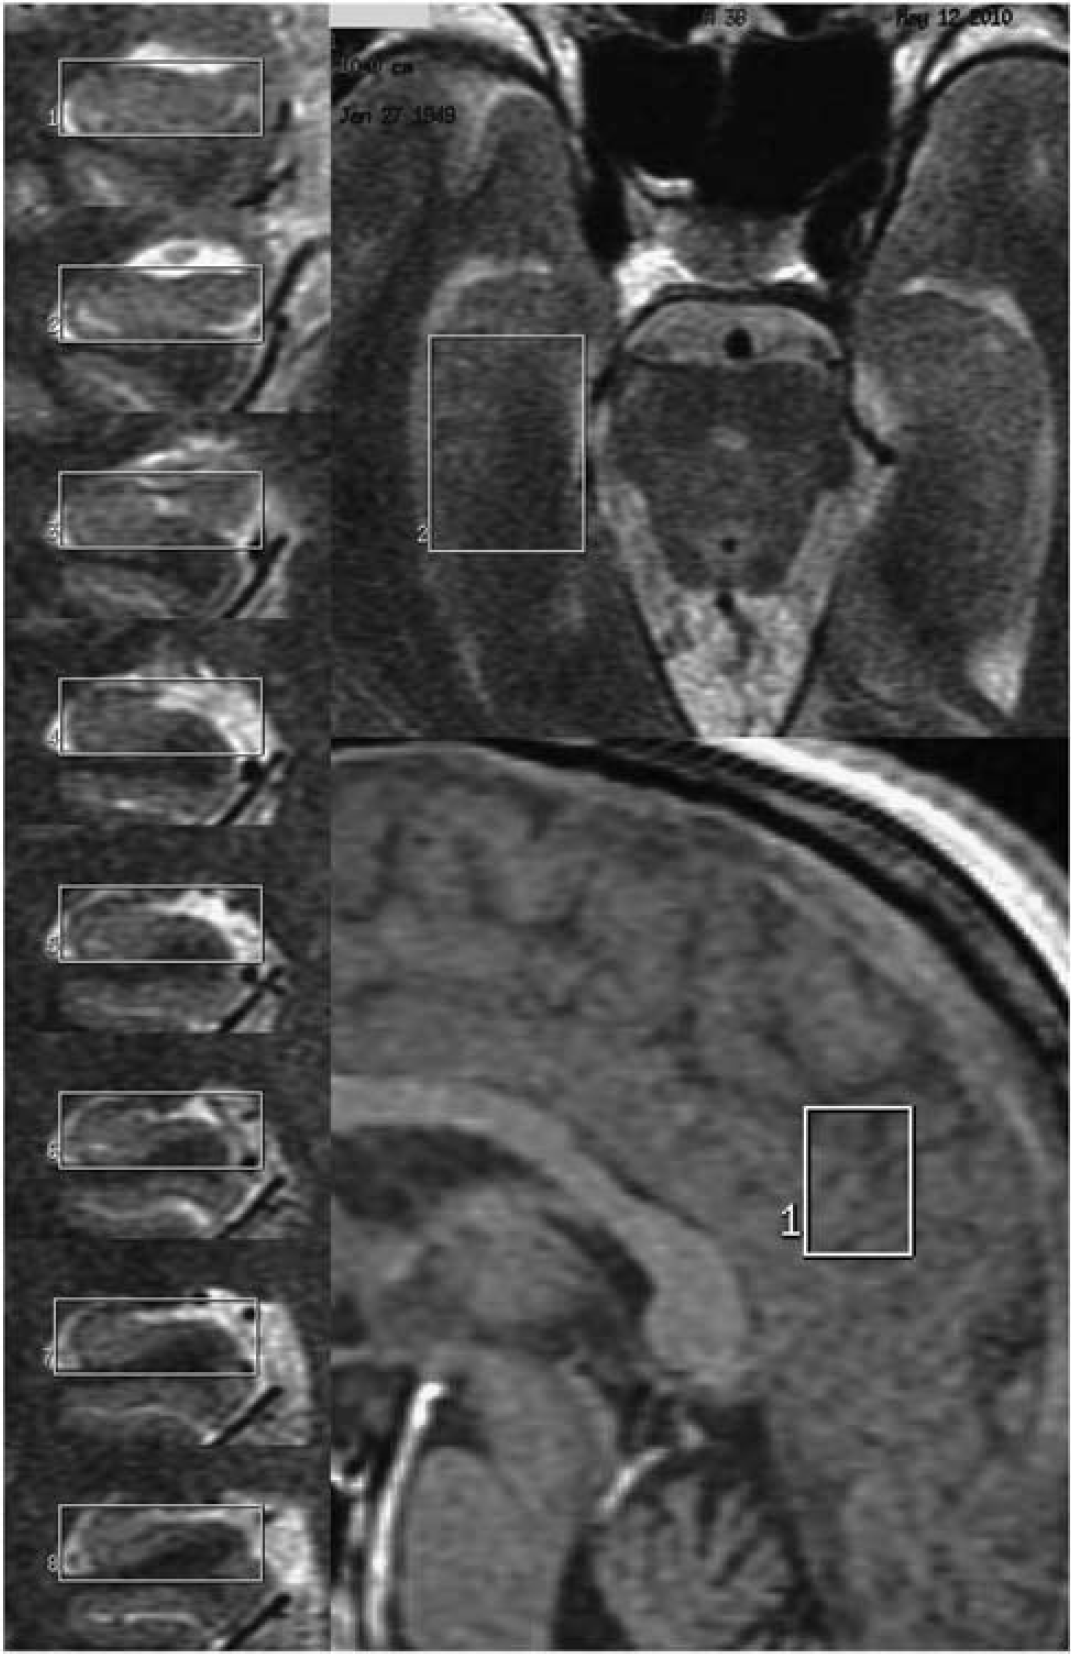
Representative location of the volume of interest set on hippocampus and posterior and precuneal cortices for magnetic resonance spectroscopy (MR).
Spectrum data were analyzed using LCModel (version 6.0; LCModel Inc., Oakville, ON, Canada) (Provencher, 1993). We did not use any filtering process such as apodization and/or removal of residual water signal before the LCModel analyses. Assignment of the resonances of interest included NAA at 2.02 p.p.m., glutamate and glutamine (Glx) at 2.1 to 2.4 p.p.m., Cr at 3.03 p.p.m., Cho at 3.20 p.p.m., and mIns at 3.55 p.p.m. For correction of partial volume, the percentage volume of cerebrospinal fluid in the VOI was calculated in the T2-weighted images by segmenting the intra-VOI structures into brain parenchyma and cerebrospinal fluid using Photoshop (Adobe Systems Incorporated, San Jose, CA, USA). Absolute metabolite concentrations (mmol/L brain tissue) were calculated using tissue water signal as an internal reference. For signal correction of metabolites, longitudinal T1 and transverse T2 values were referred to the values of the gray matter reported by Kreis et al (1993) and to those in the hippocampus reported by Choi and Frahm (1999). Glutamine and glutamate is not a single chemical, so the concentration is shown as ‘institutional units.’
To compare hippocampal atrophy between the AD and the SIVD groups, we performed VBM analyses using Statistical Parametric Mapping 8 software (SPM8, Wellcome Department of Imaging Neuroscience, University College, London, UK). The theory and details of the method have been described elsewhere (Ashburner, 2007). T1-weighted MR imaging was performed using spoiled gradient-recalled pulse sequence. The acquisition parameters were as follows: 9.1 milliseconds/1.9 milliseconds/2 (TR/TE/excitation) to give contiguous slices of 1.4 mm thickness with 1/2 thickness overlap. Flip angle was 20 degrees, acquisition matrix 256 × 192, field of view 20 cm, and 180 to 220 axial slices were used. Two-sample
Statistical significance was calculated using JMP software (version 5.01, SAS Institute Inc., NC, USA). Demographic and clinical characteristics were compared using Student's
The protocol was approved by the local ethics committee of our university, and informed consent was obtained from all participants and their responsible caregivers in accordance with the Declaration of Helsinki.
Results
Demographic data of the SIVD, AD, and EC groups are summarized in Table 1. The mean age was not significantly different among the three groups, but the education period was longer in SIVD than in AD. The MMSE scores were not significantly different between AD and SIVD. Neurological manifestations and vascular risk factors of the subjects are summarized in Table 2. The results of half-normal plot analysis for multiple regression analysis between MMSE and metabolites concentration are shown in Table 3. The most significant contributing factors to the MMSE score were NAA in the left hippocampus in the AD cases and Glx in the left hippocampus in SIVD. The coefficients of determination (
Demographic information for AD, SIVD, and EC subjects
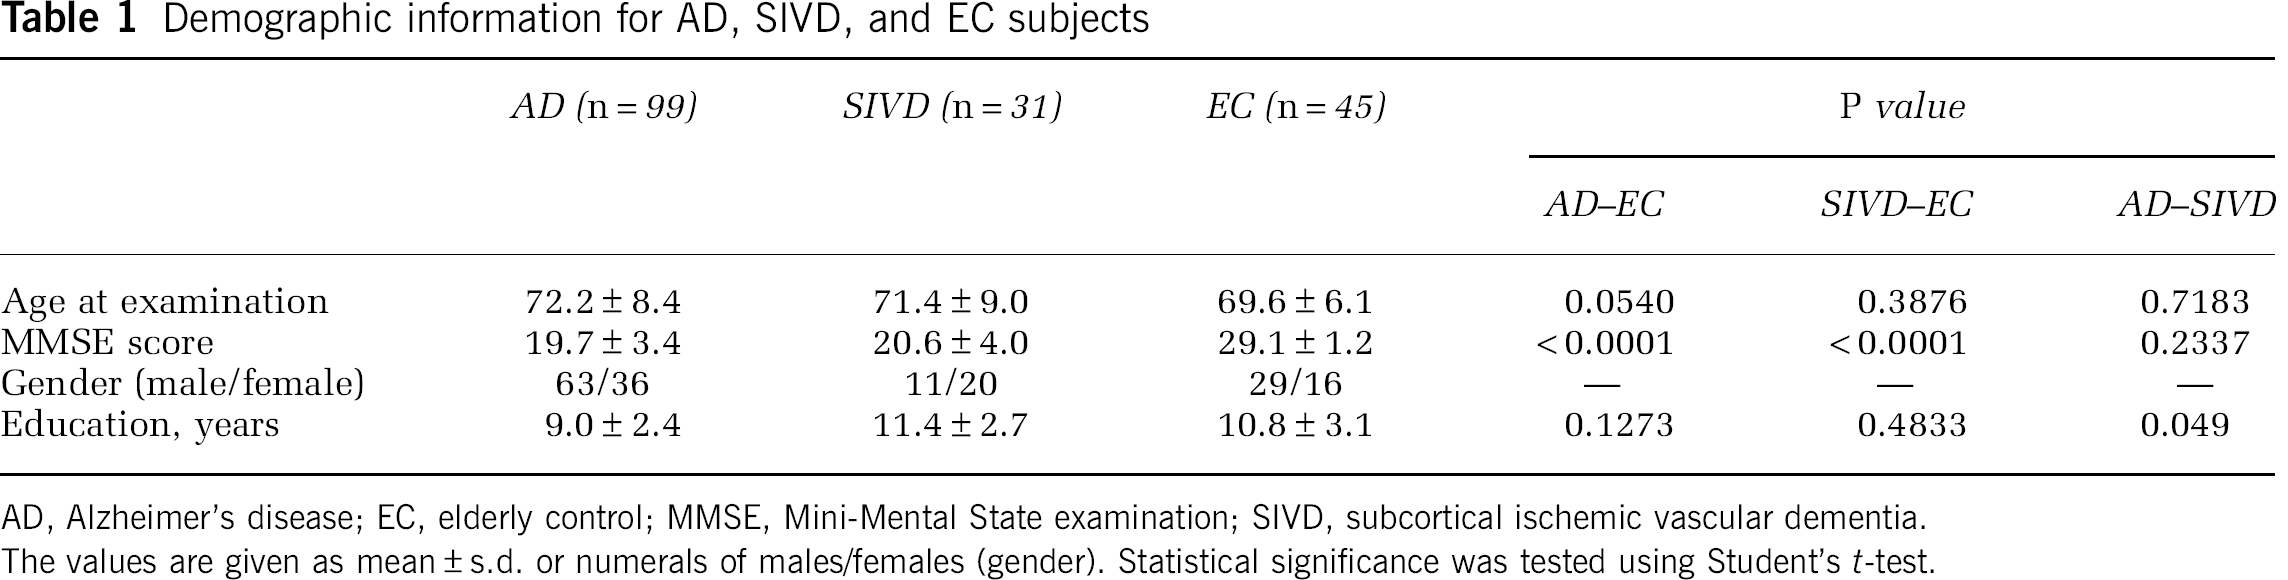
AD, Alzheimer's disease; EC, elderly control; MMSE, Mini-Mental State examination; SIVD, subcortical ischemic vascular dementia.
The values are given as mean ± s.d. or numerals of males/females (gender). Statistical significance was tested using Student's
Neurological manifestations and past history of AD, SIVD, and EC subjects
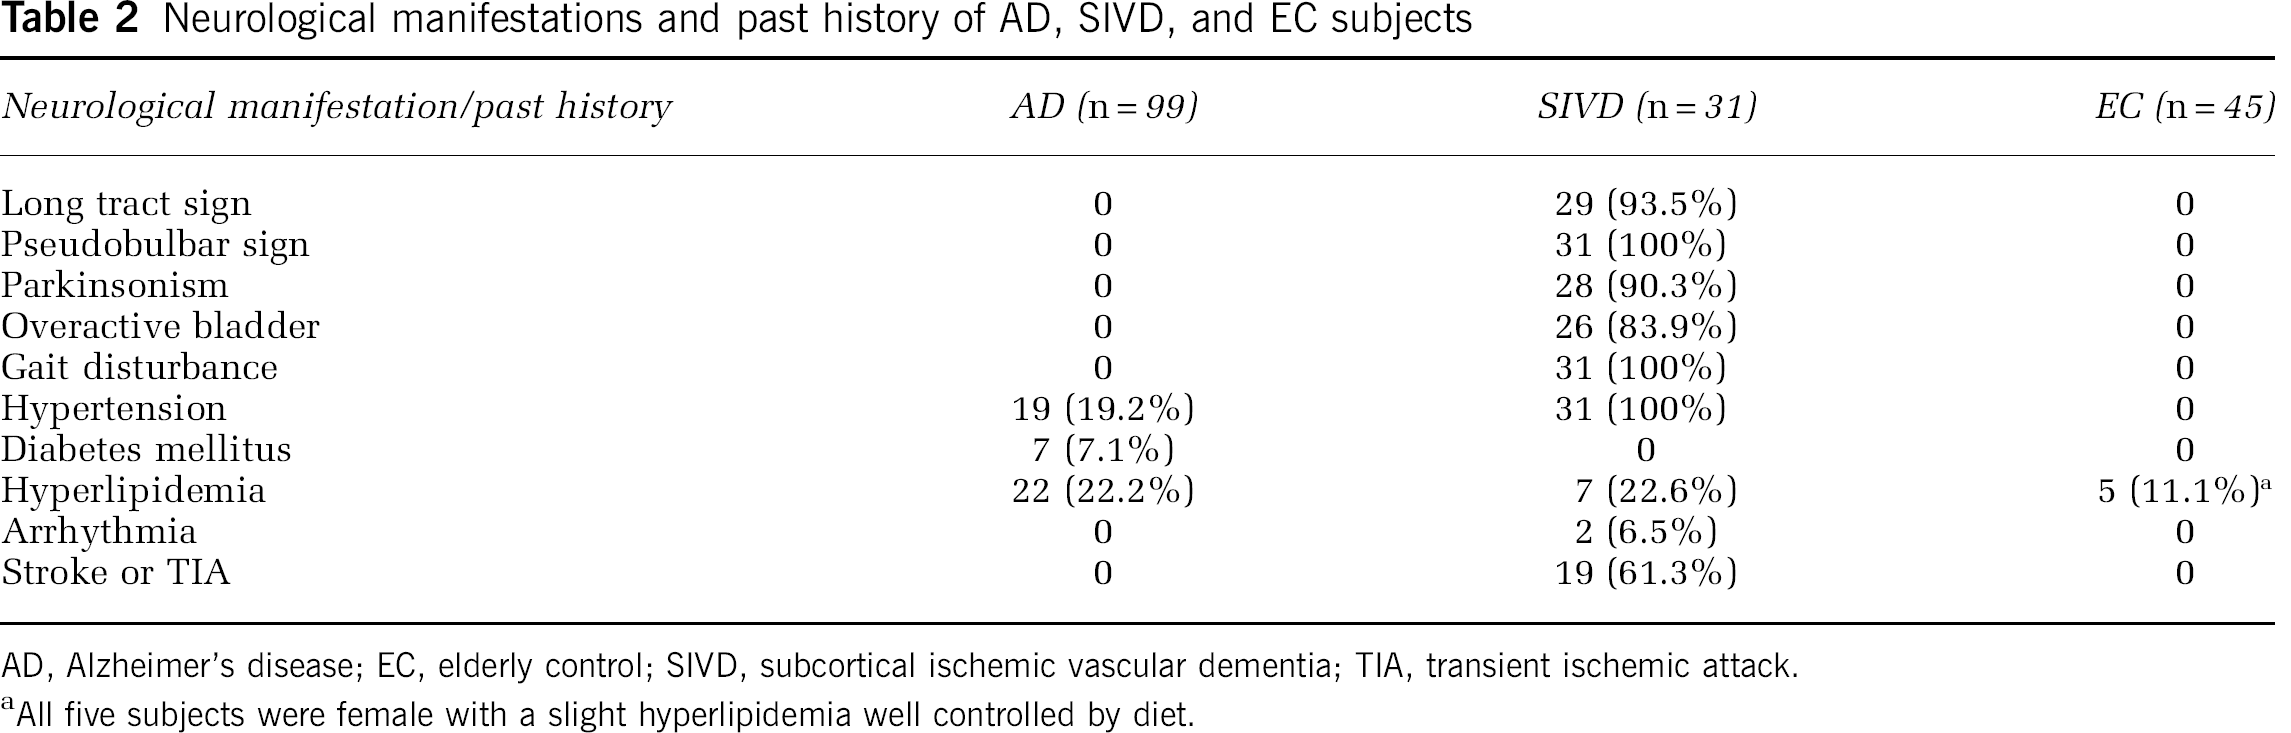
AD, Alzheimer's disease; EC, elderly control; SIVD, subcortical ischemic vascular dementia; TIA, transient ischemic attack.
All five subjects were female with a slight hyperlipidemia well controlled by diet.
Results of half-normal plot analysis for multiple regression analysis between MMSE and metabolites
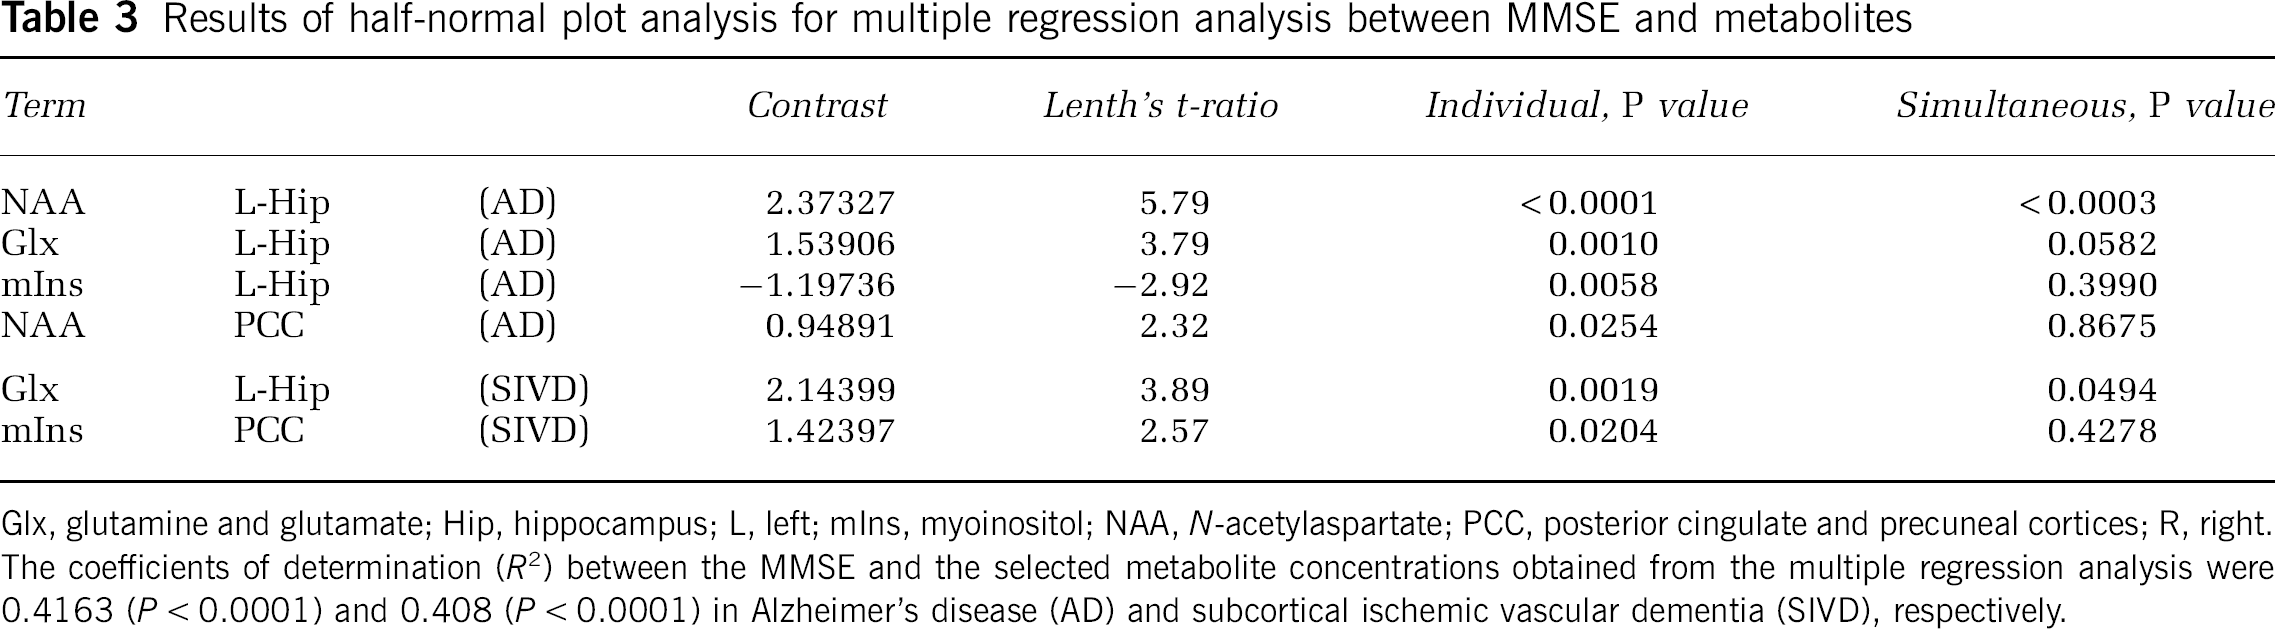
Glx, glutamine and glutamate; Hip, hippocampus; L, left; mIns, myoinositol; NAA,
The results of MRS are shown in Table 4, and representative MR spectra of AD, SIVD, and EC subjects are shown in Figure 2. In summary (1) NAA was significantly reduced in the regions of bilateral hippocampi and PCC in both the SIVD and AD. (2) The NAA reduction of the hippocampus was more prominent in the AD than in the SIVD. (3) mIns was significantly increased in the bilateral hippocampi and in the PCC in the AD, whereas it was reduced or at lease not increased in the same regions in the SIVD. (4) Glx was significantly reduced in the bilateral hippocampi in both the SIVD and AD, and in the PCC in the AD but not in the SIVD. (5) Cr was significantly reduced in all three regions in SIVD, but not in AD except in the PCC. (6) Cho was reduced in the hippocampi in both AD and SIVD, but significance was found only in the left side. (7) The NAA/Cr ratio was significantly reduced in the bilateral hippocampi in AD. In SIVD, it was barely significant in the left hippocampus. (8) The mIns/Cr ratio was significantly increased in all regions in AD, but not in SIVD. (9) There were no significant differences in Glx/Cr ratios in the three groups. (10) mIns/NAA ratios in bilateral hippocampi were significantly different between the AD and SIVD, this ratio being increased in the AD but not in the SIVD when compared with EC.
Concentration of the metabolites measured by MR spectroscopy
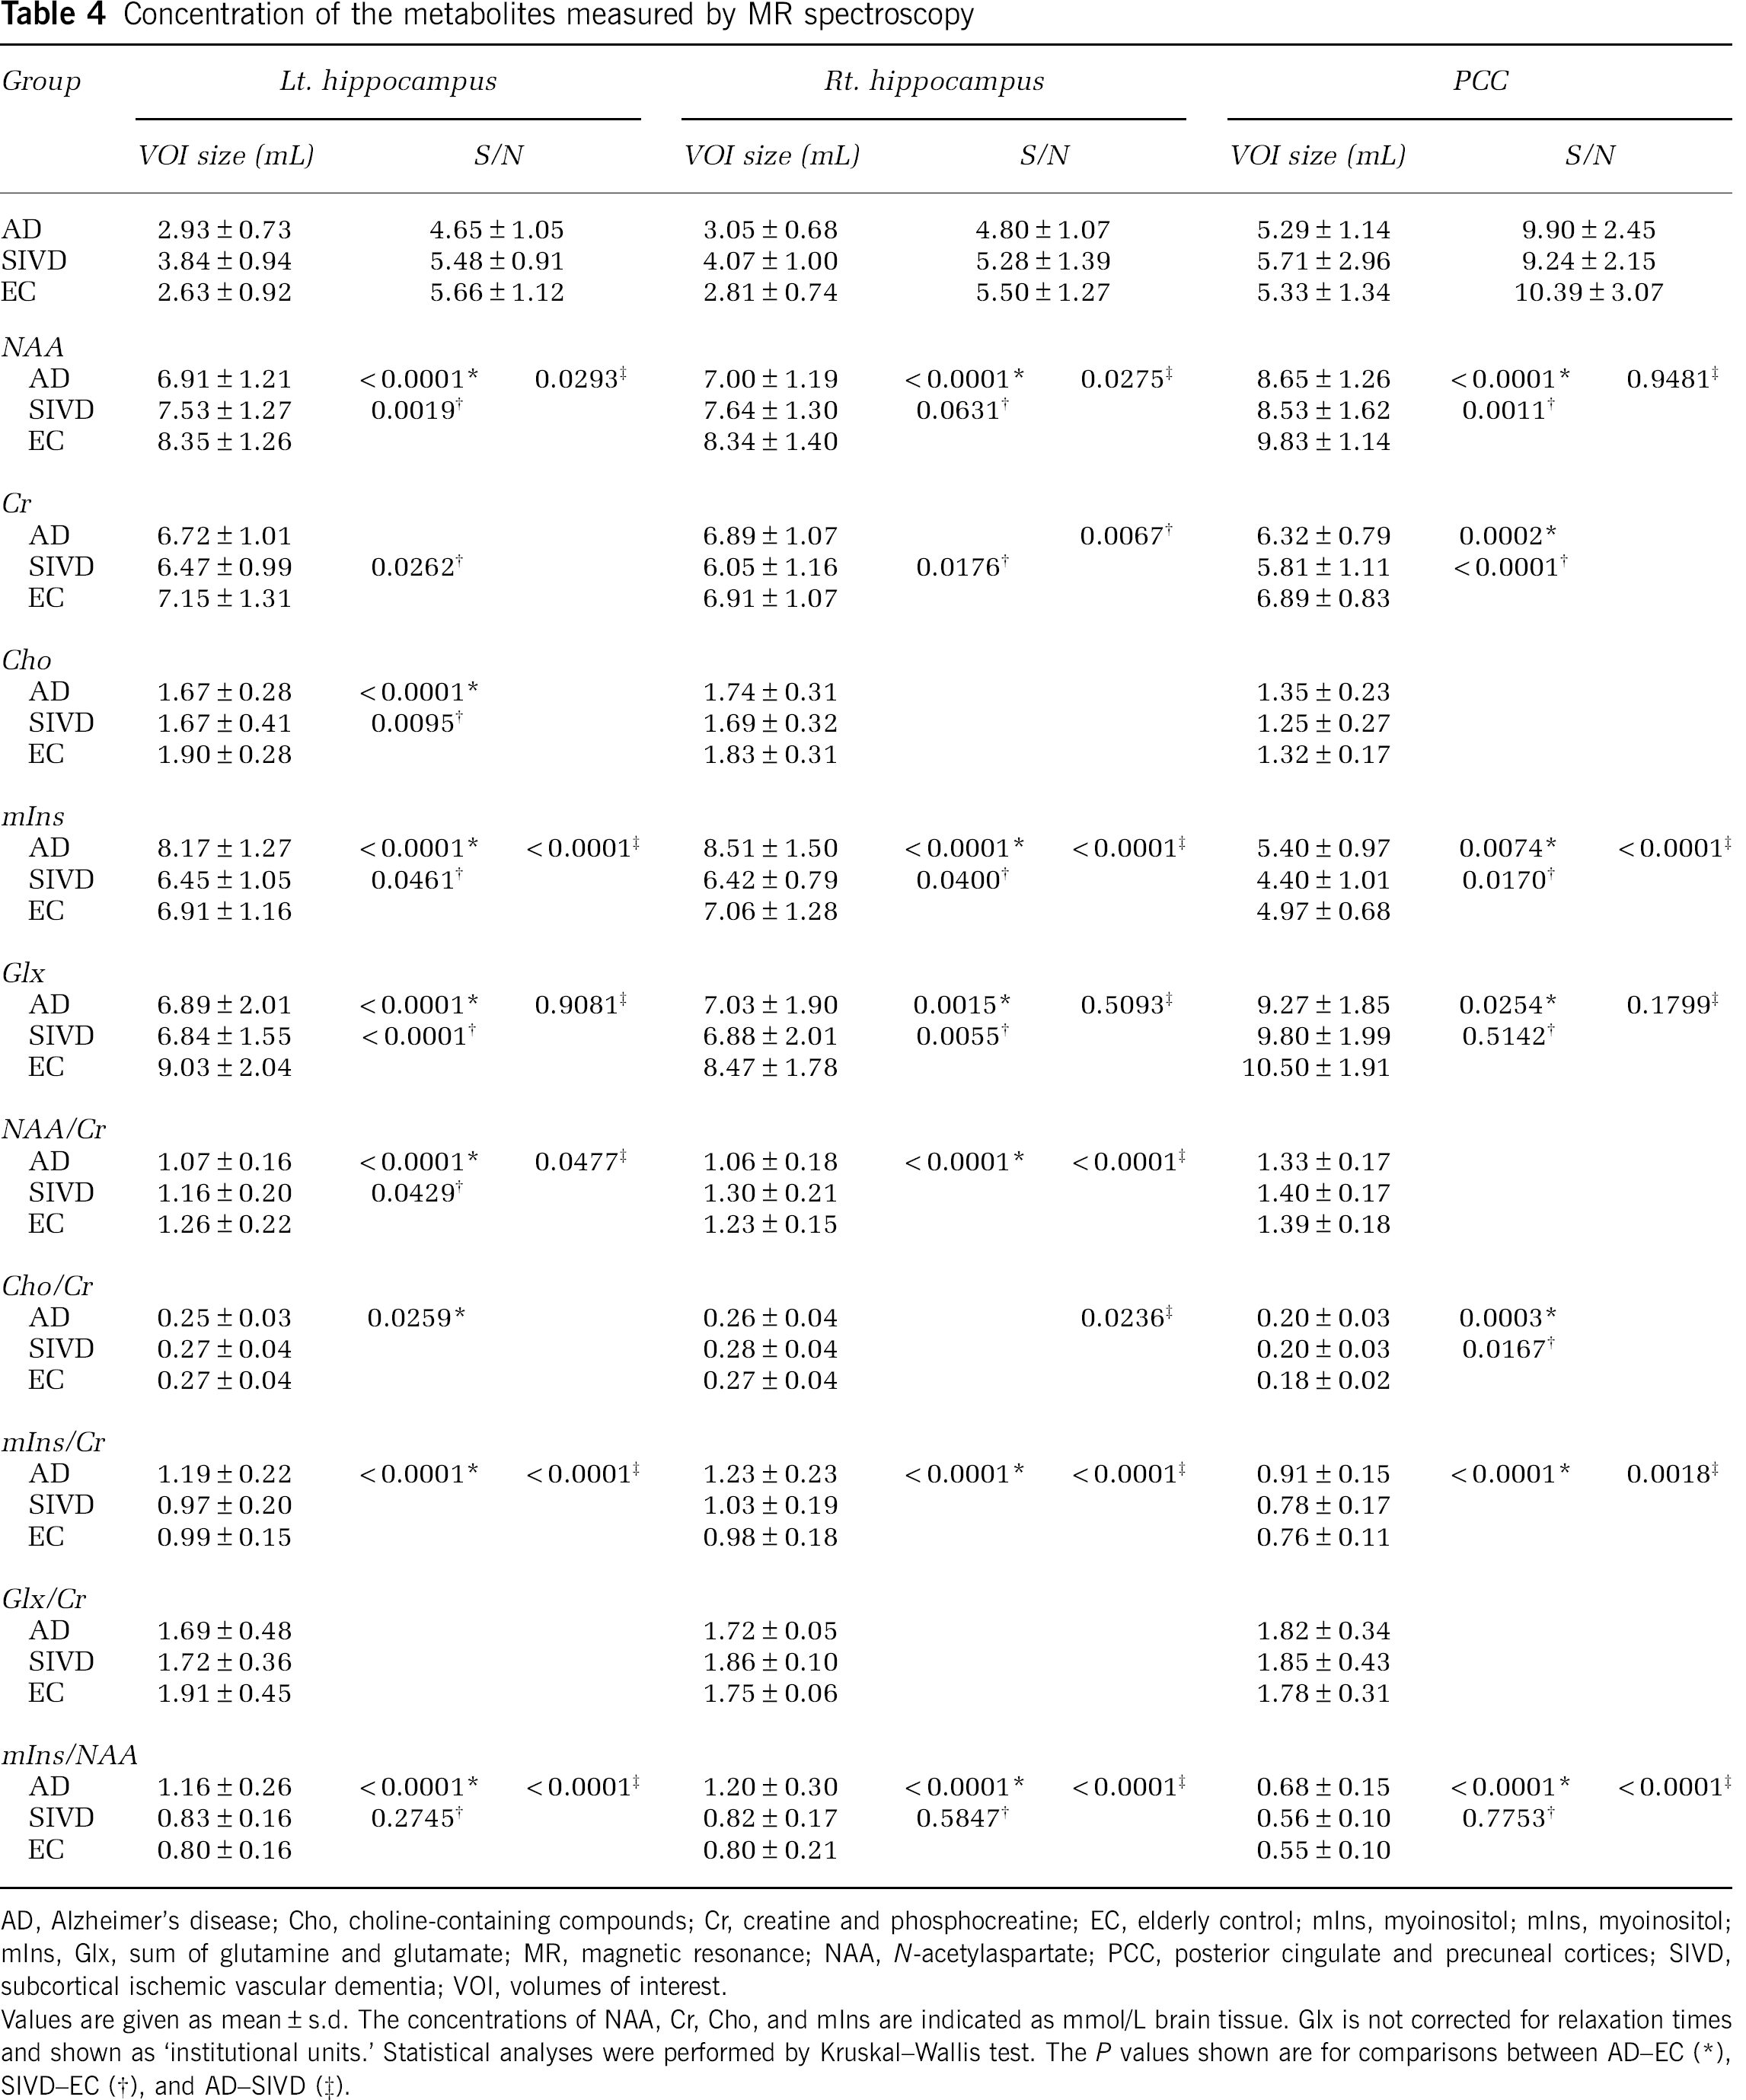
AD, Alzheimer's disease; Cho, choline-containing compounds; Cr, creatine and phosphocreatine; EC, elderly control; mIns, myoinositol; mIns, myoinositol; mIns, Glx, sum of glutamine and glutamate; MR, magnetic resonance; NAA,
Values are given as mean ± s.d. The concentrations of NAA, Cr, Cho, and mIns are indicated as mmol/L brain tissue. Glx is not corrected for relaxation times and shown as ‘institutional units.’ Statistical analyses were performed by Kruskal—Wallis test. The
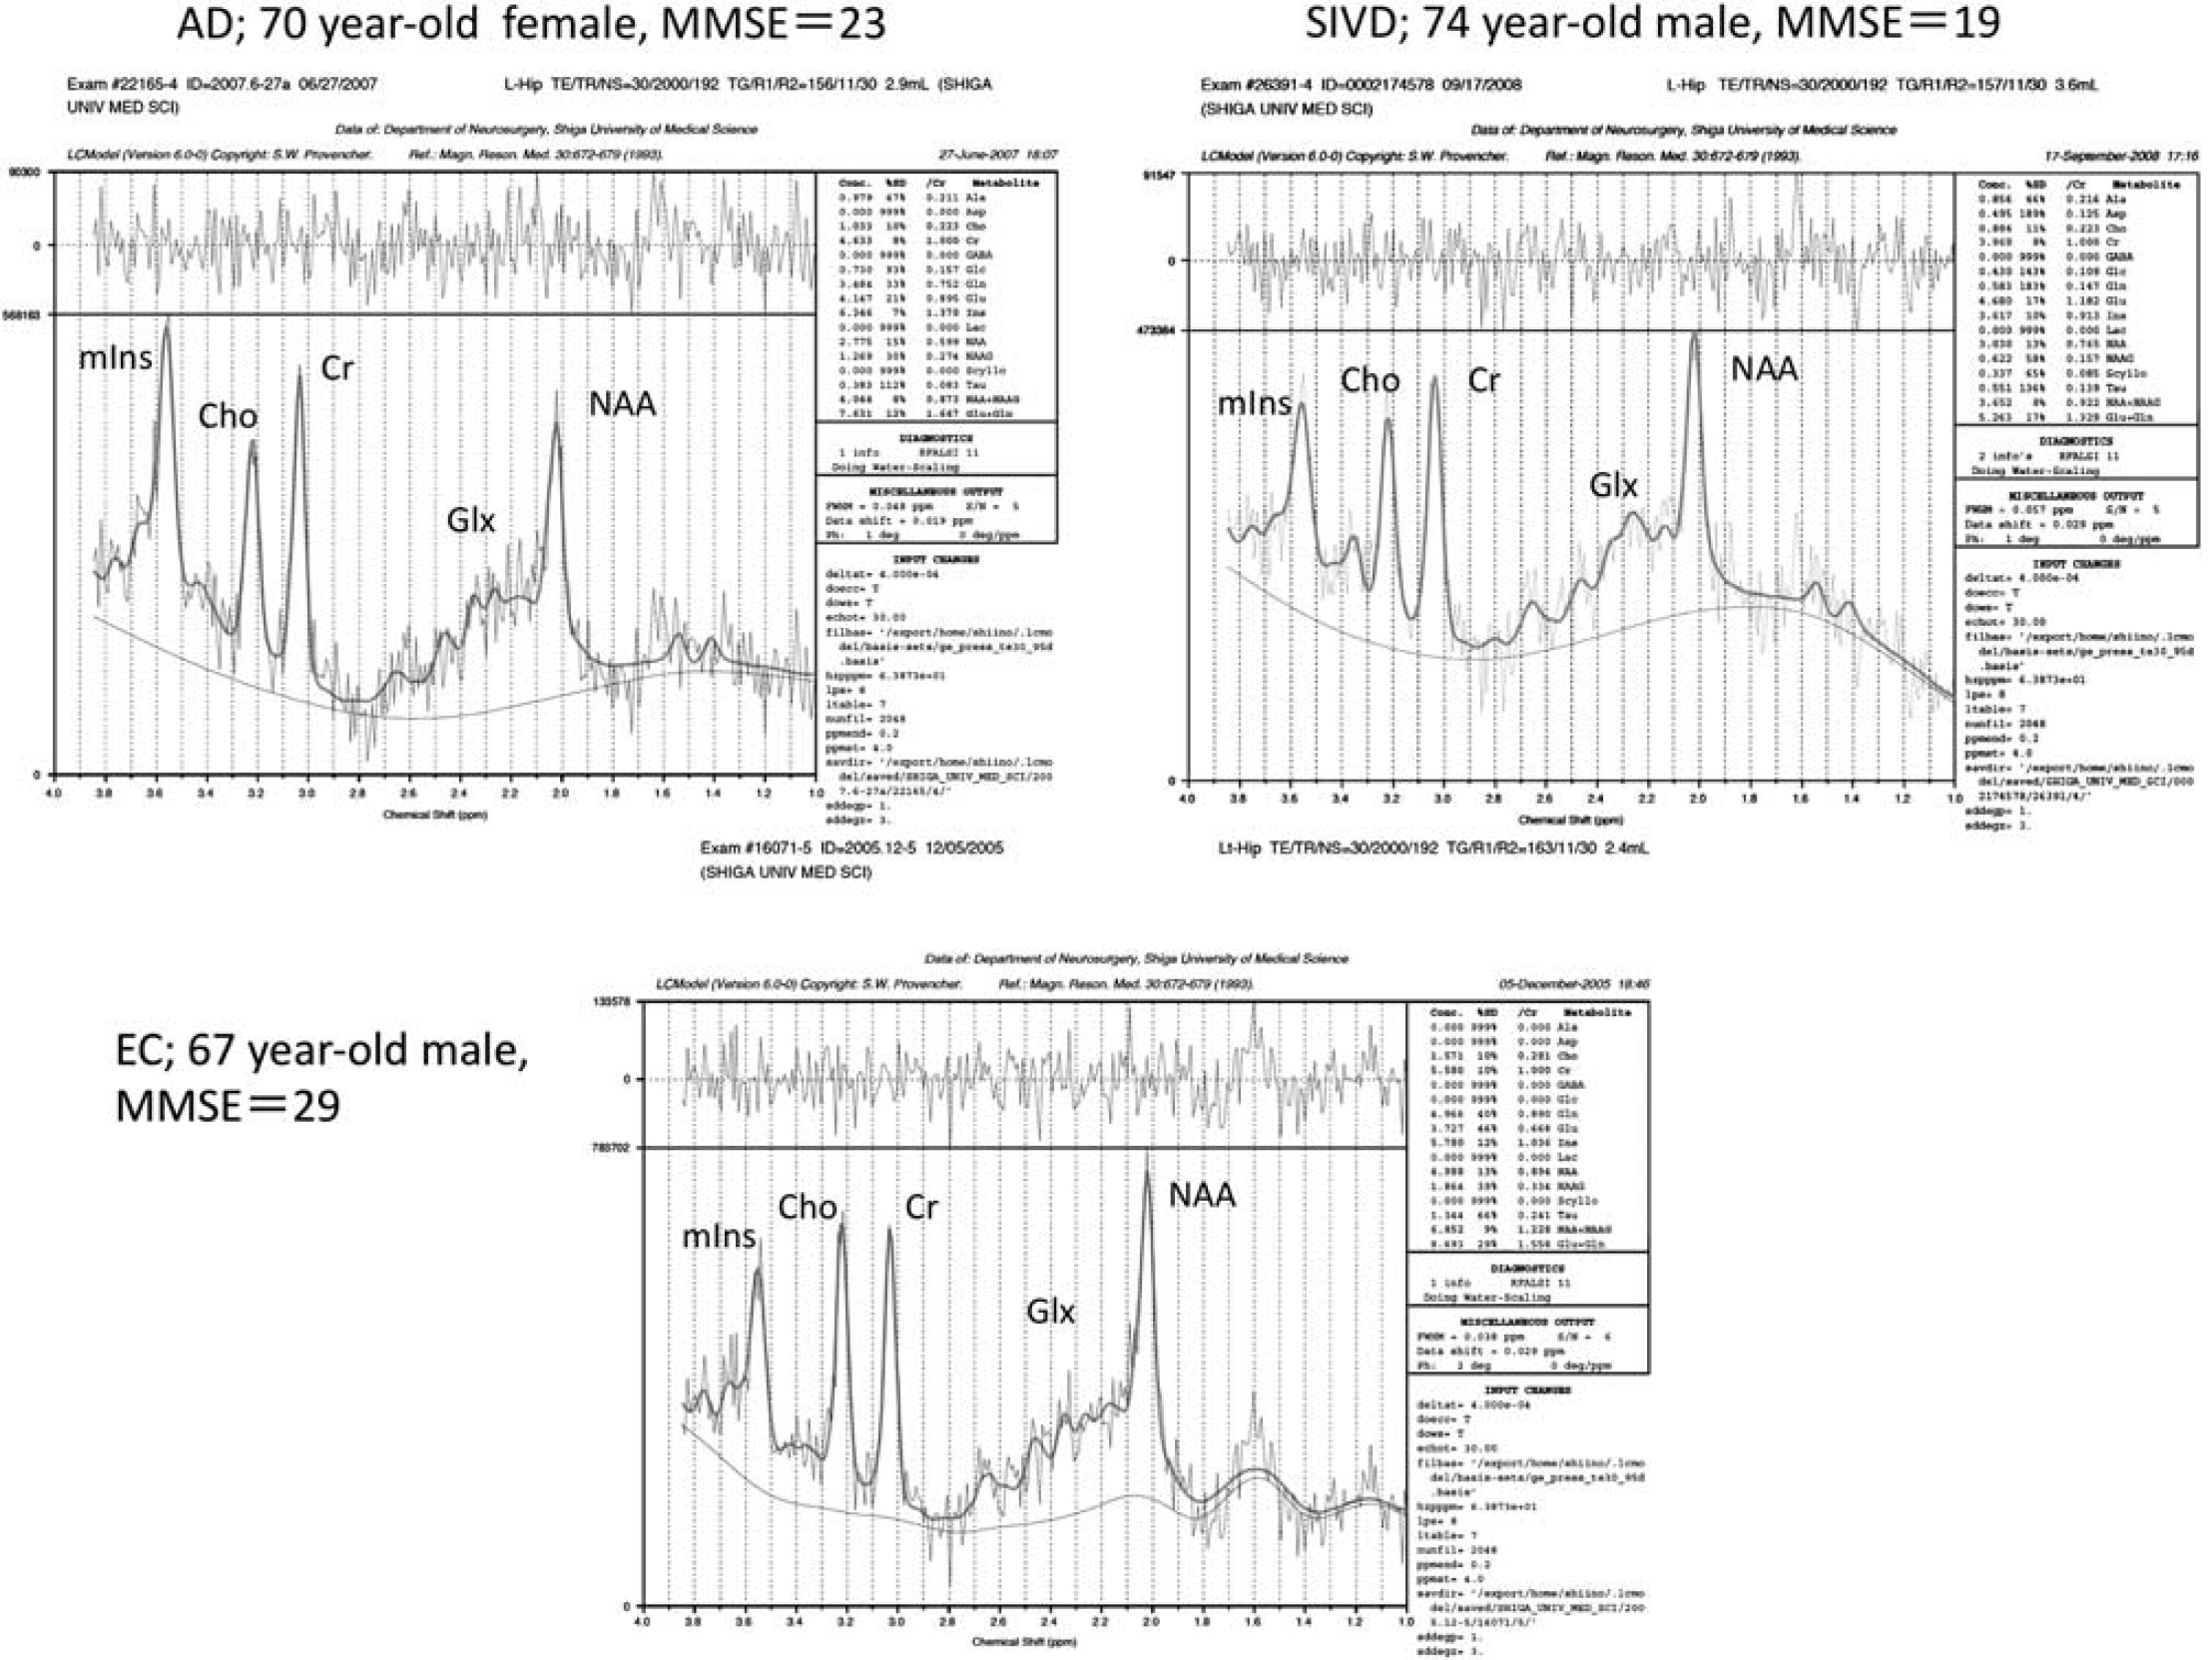
Representative magnetic resonance (MR) spectra of the left hippocampus. Spectra are cases of Alzheimer's disease (AD), subcortical ischemic vascular dementia (SIVD), and elderly control (EC); the voxel sizes were 2.9, 3.6, and 2.4 mL, respectively. Peaks of the spectrum are indicated as follows;
To identify factors that may markedly contribute to differentiation between the SIVD and AD groups from the items measured by MRS, half-normal plot analysis of the measured values was performed for the hippocampus and PCC. Lenth's
Results of half-normal plot analysis for differentiation between AD and SIVD
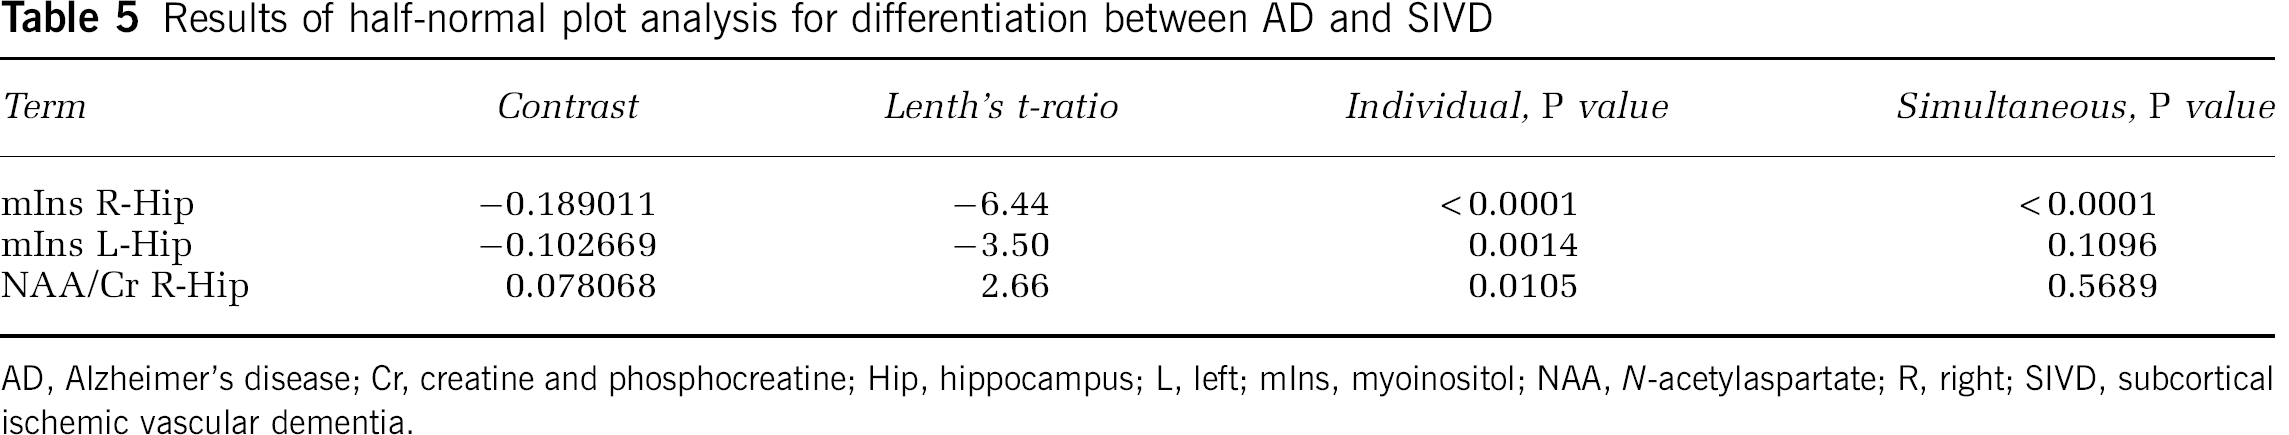
AD, Alzheimer's disease; Cr, creatine and phosphocreatine; Hip, hippocampus; L, left; mIns, myoinositol; NAA,
The results of VBM are shown in Figure 3. The colored areas indicate atrophied regions with
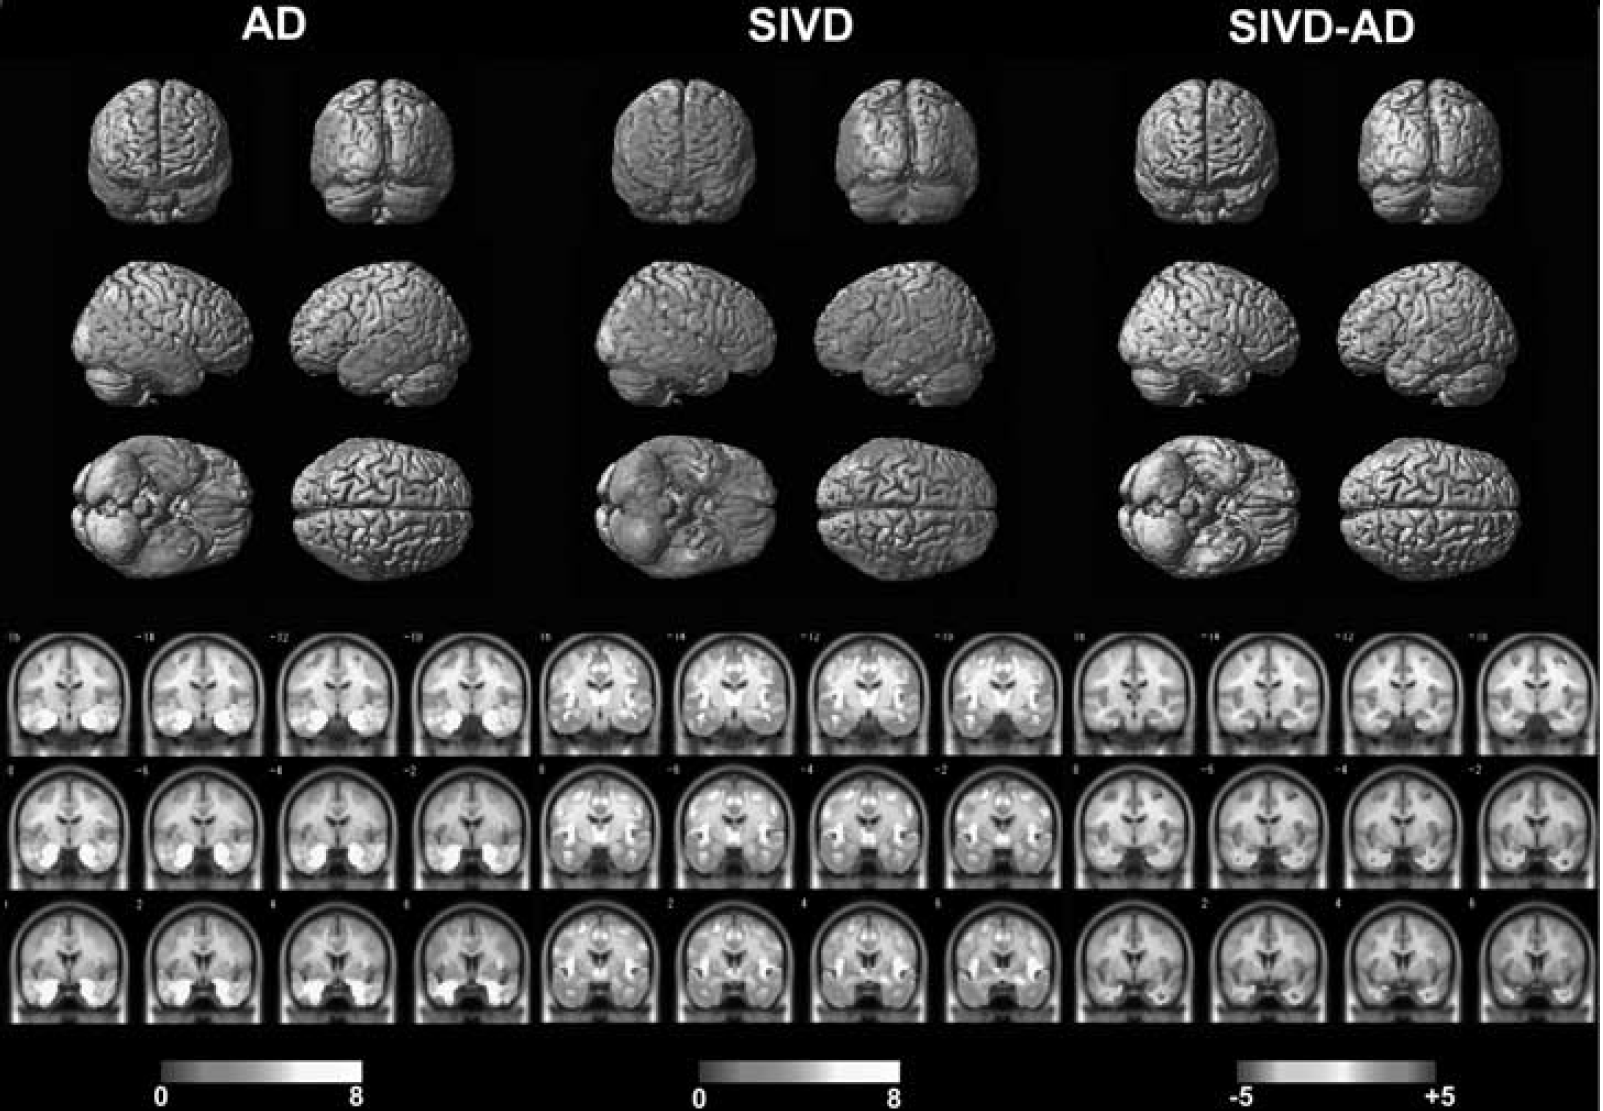
Distribution of
Regional
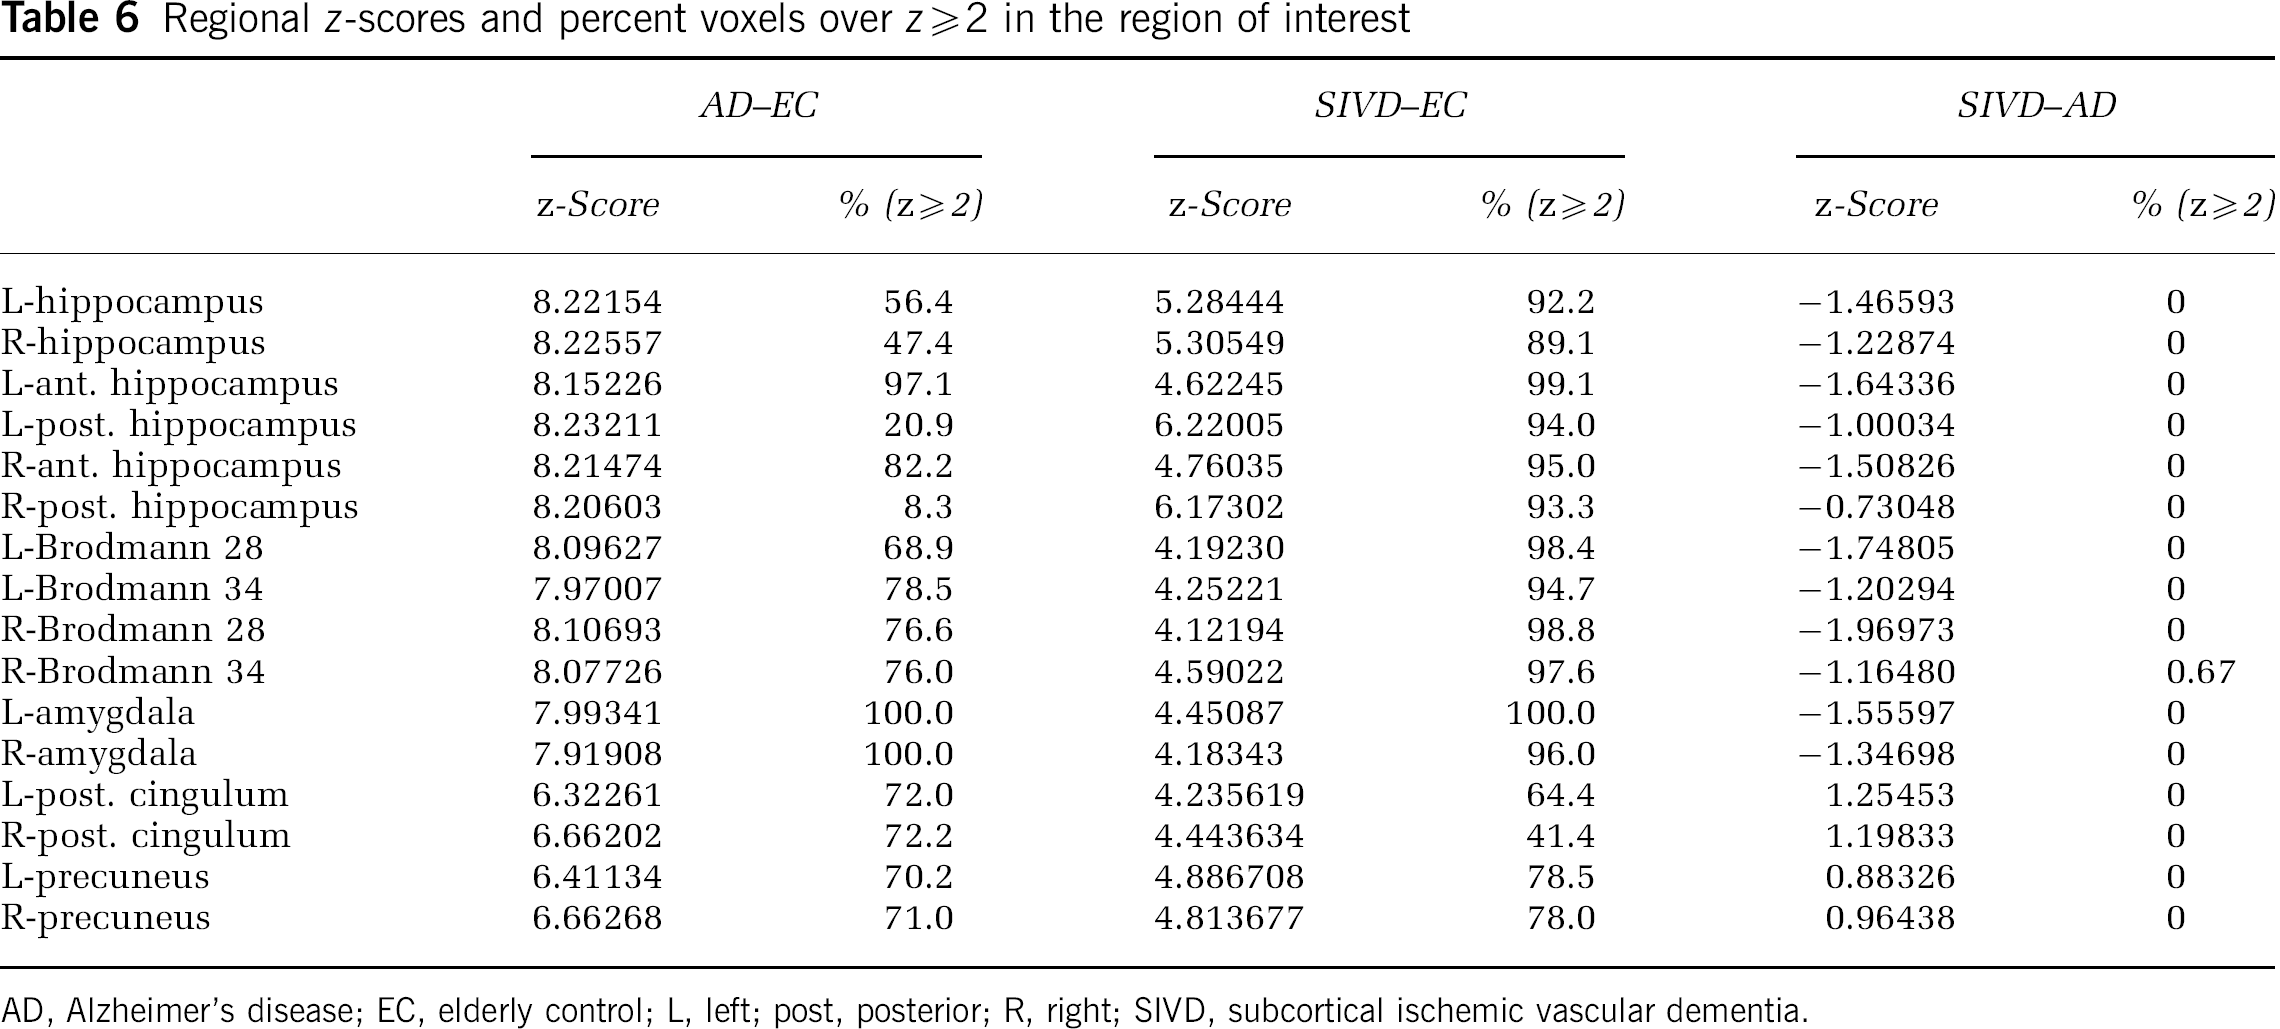
AD, Alzheimer's disease; EC, elderly control; L, left; post, posterior; R, right; SIVD, subcortical ischemic vascular dementia.
Discussion
Our study showed that the metabolism of mIns in the hippocampus and PCC differs between AD and SIVD patients. This suggests the existence of different pathologic pathways, which may prove useful in differentiating between these diseases
The finding of the decreased or not increased mIns concentration in the SIVD patients was somewhat unexpected, since the increase in mIns concentration has been believed to be the results of glial proliferation (Glanville et al, 1989) or of an increase in glial cell size (Ross et al, 1998) after neuron loss in many disorders such as inflammation, multiple sclerosis, and AD, although lowering of mIns can occur in certain states such as hyperammonemia, chronic hyponatremia, and lithium or valproate treatment. Interestingly, there are reports that glial proliferation alone cannot explain the brain mIns elevation (Huang et al, 1999; Bernabeu et al, 2009) and the exact mechanism remains unclear. Since most of the brain mIns concentration is regulated by its transport system, it is also assumed that mIns elevation is related to glial response to osmoregulation (Brand et al, 1993; Chen et al, 2009; Lang, 2007).
There have been reports showing differences of hippocampal pathology between AD and SIVD. Kantarci et al (2008) reported that increases in mIns were associated with higher Braak stage, higher neuritic plaque score, and greater likelihood of AD. Kril et al (2002) reported that patients in both AD and small vessel disease groups showed little difference in the degree of neuronal loss in the hippocampus, with only the mechanism of degeneration differing between these dementia syndromes. They speculated that the mechanism of neuronal degeneration in small vessel disease is apoptosis, since that would be consistent with an absence of pathological debris. Viswanathan et al (2006) showed that neuronal apoptosis may be a mechanism of cortical atrophy in CADASIL. They assumed that such apoptosis would be secondary to axonal damage in the underlying white matter through deafferentation or retrograde neuronal degeneration. Although they found no evidence of apoptosis in the hippocampus, the consistent pathological appearance in the two reports seemed to be less apparent inflammatory or active glial reaction in the hippocampus. From these observations, it can be speculated that the unchanged mIns level in SIVD patients is a result of sparse population of glial cells and/or inactivation of glial cells in this region.
Significant atrophy of the hippocampus is one of the pathological and radiological hallmarks of AD. Volume loss and NAA decrease in the hippocampus in the AD group is thought to be a result of neuronal loss in this region. There are several reports showing that hippocampal atrophy is well correlated with neuronal loss in this region, and neuronal number is well correlated to NAA concentration (Cheng et al, 2002; Kril et al, 2004; Bobinski et al, 1996). In the SIVD patients in our study, the NAA reduction in the hippocampus would reflect local neuronal loss. This finding is consistent with a number of pathological descriptions of hippocampal atrophy in the absence of neurofibrillary tangles in patients with pathologically ‘pure’ SIVD (Kril et al, 2002; Vinters et al, 2000). O'Sullivan et al (2009) concluded that hippocampal atrophy in patients with CADASIL was due to vascular mechanisms rather than comorbid AD pathology, since the hippocampal volume correlated with lacunar lesion volume. Schuff et al (2003) performed MRS, and measured hippocampal volume, and compared the results between 43 patients with AD and 13 patients with SIVD. They found hippocampal atrophy in SIVD, but the NAA reduction was not significant. However, it might have reached significance if the number of SIVD subjects had been larger because there was a tendency to NAA reduction in the hippocampus in their study.
In the present study, it was noteworthy that Cr concentration decrease in the hippocampus and PCC was observed in the SIVD patients, since Cr concentration has been thought to be constant, homogenously distributed throughout the brain, and unchanged by age or a variety of diseases. In AD patients, Cr concentration decreased, with significance in the PCC but not in the hippocampus. We speculate that Cr concentration may change depending on the tissue cellularity of the brain because Cr are present in both neuronal and glial cells (de Graaf, 2007). In other words, metabolites/Cr ratios represent values corrected by brain tissue cellularity. It is well known that dysfunction of the blood—brain barrier and extravascular leakage of proteins occur in the brain during SIVD, and this causes expansion of extracellular space and decrease in cellularity (Akiguchi et al, 1998). This would not conflict with our finding that Glx/Cr ratio did not change significantly despite the significant decrease of Cr concentration, since Glx represented the total amount in both neurons and glia.
The pathological mechanism of hippocampal atrophy in SIVD is somewhat unclear. We have no findings to explain this. In our previous pathological study (Akiguchi et al, 2004), chronic ischemic white matter changes were seen in the temporal stem in SIVD patients. However, the lesions in the temporal white matter were fewer than those in the frontal and parietal lobes. In fact, in our study only 6 of 31 SIVD patients had white matter lesions in the temporal lobe. Hippocampal neurons are vulnerable to a variety of compromising situations such as transient or chronic ischemic insult, glucocorticoid elevations or chronic stress, and high concentration of glutamate release. The etiology of hippocampal neuron loss is an issue to be solved in future.
We found metabolite profile differences between AD and SIVD in the hippocampus and PCC, but we need to compare the results to previous studies.Kantarci et al (2004) examined MRS in the PCC and reported results similar to ours. They reported mIns/Cr ratios increased in AD but unchanged in VaD. The decrease in NAA/Cr ratio was significant in AD but not in VaD. This does not necessarily imply the preservation of neurons in SIVD, since the Cr level must be also decreased in this region as shown by our studies. We also found that the hippocampus is better than the PCC as a target for MRS to discriminate between the two disorders. Jessen et al (2009) reported a trend to reduced mIns in the hippocampus of non-AD-type dementia and mild cognitive impairment, compatible with the results of our study. In their multicenter study, however, the concentration of mIns in the hippocampus of AD did not apparently increase. As they mentioned in the discussion, measuring mIns in the hippocampus was technically somewhat difficult. In our study, only a single researcher performed the MRS using the same MR machine, and we used standard error estimates (Cramer—Rao lower bounds) to reduce the contamination of erroneous value in the spectra. The results of Waldman et al (2002), although they measured in the occipital lobe, were quite similar with ours, and their report was the first we know of showing differences of mIns/Cr between AD and VaD. In contrast to those papers, Herminghaus et al (2003) showed results different from ours. They measured several regions in AD and VaD patients, including medial parietal gray matter (close to the PCC) and the medial temporal gyrus of the dominant hemisphere, and showed decreased NAA/Cr and increased mIns/Cr in both AD and VaD. The protocol of their MRS study was similar to ours; they used a 1.5-T scanner and LCModel, except that they used a stimulated echo acquisition mode sequence. Since it is unlikely that different pulse sequence leads to different results, we cannot speculate on the reason for their different findings.
One limitation of this study was that the diagnoses of AD and SIVD were not based on pathological examination. We carefully selected the subjects and followed them for at least 2 years before final diagnosis. The small number of SIVD patients, and the difference in the education period between the AD and SIVD groups, increase uncertainty. Magnetic resonance spectroscopy seemed to be useful for differentiating between AD and SIVD, but the next step would be to validate our observations in an independent data set. We adopted the T2 values reported by Choi and Frahm (1999) for the correction of metabolites concentration in the hippocampus, but those values were measured at field strength of 2 T Since the T2 values are increased at lower field strengths, the exact metabolite concentrations in the hippocampus may have been higher than the values we calculated. If the T2 value changed by 10%, the estimated metabolite concentration would have changed by only 1% in case of echo time at 30 milliseconds. Moreover, this small correction would affect the data of patients and controls to the same extent.
Conclusions
Proton MRS showed metabolic profile differences between AD and SIVD, suggesting different mechanisms in the pathogenesis of the diseases. The difference of mIns concentration in the hippocampus would be one marker for differentiation between AD and SIVD.
Footnotes
Acknowledgements
The authors would like to mention that the cooperation of several researchers was indispensable for obtaining and reporting these research results. The clinical diagnoses of AD and SIVD were made by Dr Akiguchi, an honorary member of the Japan Society for Dementia Research, and Drs Watanabe and Shirakashi, experts in neurology. Neuropsychological tests were conducted by Dr Kotani. Technical guidance concerning MRS was given by Drs Inubushi and Morikawa, and MRS examinations were performed by Dr Yoshimura. The authors are also deeply grateful for the cooperation of members of the Department of Radiology, Shiga University of Medical Science, in performing MRS.
The authors declare no conflict of interest.