
Abstract
The penumbra is sustained by an increased extraction of oxygen (OEF) from blood to brain tissue. Metabolic imaging may improve penumbra specificity when examining stroke patients with wake-up stroke and a long time between admission and symptom onset. We used MRI to examine OEF, and compared the volume of regions with elevated OEF to the volume of regions with perfusion deficit in a M2 occlusion model (M2CAO) with preserved collateral blood flow. OEF was calculated from BOLD MRI examining tissue R2′, with ASL perfusion imaging employed to determine cerebral blood flows (CBF) and volumes. Diffusion imaging was used to identify the ischemic core (IC). Examinations were performed during and after transient M2CAO in rats. The IC-OEF mismatch was significantly smaller than the IC-CBF mismatch during M2CAO. The penumbra OEF was significantly increased during M2CAO, and decreased significantly after reperfusion. The IC-OEF mismatch may provide increased penumbra specificity compared to IC-CBF mismatch regimens. Results strongly indicate the potential of metabolic MRI for thrombectomy patient selection in cases with a long time from symptom onset to admission. Results demonstrate the effectiveness of reperfusion in alleviating metabolic disturbances in ischemic regions, emphasizing fast treatment to achieve significant neurological recovery in stroke patients.
Introduction
A large vessel occlusion in the brain causes an ischemic lesion that expands gradually into adjacent tissue within the affected supply region. 1 The restoration of blood flow to the perfusion deficit surrounding the ischemic core (IC), i.e. the diffusion-perfusion mismatch,2,3 has accordingly emerged as the focus of acute stroke therapy. Several randomized clinical trials have reported positive results from recanalizing treatment of acute ischemic stroke (AIS), when supported by diagnostic imaging. 4 Yet points of criticism have been directed at the conventional interpretation of the diffusion–perfusion mismatch, with reports suggesting an overestimation of the amount of penumbra contained within hypoperfused regions.5,6
The viability of the ischemic penumbra is sustained by the dilation of collateral vessels and by the increased extraction of oxygen from blood to brain tissue.7–9 With the recently published DAWN and DEFUSE 3 trials,10,11 along with reports on a prolonged time-period for penumbra viability in clinical and experimental studies,12–14 there are now suggestions that a tissue window may come to replace the time window as the overriding prejudice in the triage of AIS patients. 15 This requires metabolic imaging capable of providing highly specific read-outs of ischemic yet viable tissue, not only in the acute but probably even more importantly in the sub-acute phase of AIS.
Commonly used animal AIS models, such as the intra-luminal suture model (MCAO),16,17 have been limited by the fact that they produce extensive ischemic core regions, thereby simulating the large hemispheric stroke found in patients with carotid T occlusions.18–20 We used a middle cerebral artery (MCA) M2 segment occlusion model (M2CAO) that was designed specifically to simulate human stroke cases suitable for acute revascularization. 21 In contrast to the MCAO model, which causes a severe decrease of collateral blood flow through the circle of Willis and leptomeningeal anastomoses, the M2CAO model preserves collateral blood flow from the anterior and posterior cerebral arteries to the territory of the MCA, thereby providing a more accurate simulation of the subtype of AIS that occurs in patients who suffer typical cardio embolic or larger cortical or subcortical human AIS, and who are suitable candidates for revascularization treatment.13,20–22 The primary objective of this study was to assemble a non-invasive magnetic resonance imaging (MRI) protocol capable of determining oxygen extraction fraction (OEF), and subsequently to compare the volume of the IC-OEF elevation mismatch with that of the IC-CBF deficit mismatch in regions affected by M2CAO. The M2CAO model also enables controlled, non-invasive, in-MRI-bore restoration of blood flow (reperfusion) which permitted us to examine the acute effects of reperfusion on the oxygen metabolism of ischemic regions.
Materials and methods
The data that support the findings of this study are available from the corresponding author on reasonable request.
Experimental design
Quantitative blood oxygen level dependent (qBOLD)23,24 was used in combination with arterial spin labeling (ASL) perfusion-weighted imaging (PWI) to calculate approximate values for OEF and for the cerebral metabolic rate of oxygen (CMRO2) (µmol/100 g/min).
Sprague Dawley (SD) rats were subjected to transient occlusion of the M2 branch of the MCA. 21 Blood gas tests were performed prior to the procedure. Immediately upon M2CAO, animals were transferred to the MRI scanner. The imaging protocol (Figure 1) consisted of diffusion-weighted imaging (DWI), used to identify IC regions, and subsequently, spin-echo (SE) multi echo multi slice (MEMS) and multi gradient echo (MGE3D) to measure R2 and R2* relaxation rates, respectively. Turbo Dynamic ASL (T-DASL)25–26 PWI was performed to measure arterial cerebral blood volume fractions (CBVa) according to a previously described method. 26 CBVa was converted into estimations of venous CBV (CBVv) through the use of an arterial-venous partition fraction 27 of 0.25. Continuous ASL PWI 28 was used to acquire measurements of CBF. At the completion of the imaging protocol, M2 recanalization, i.e. reperfusion, was performed in-bore and the protocol was repeated. Animals were then sacrificed.
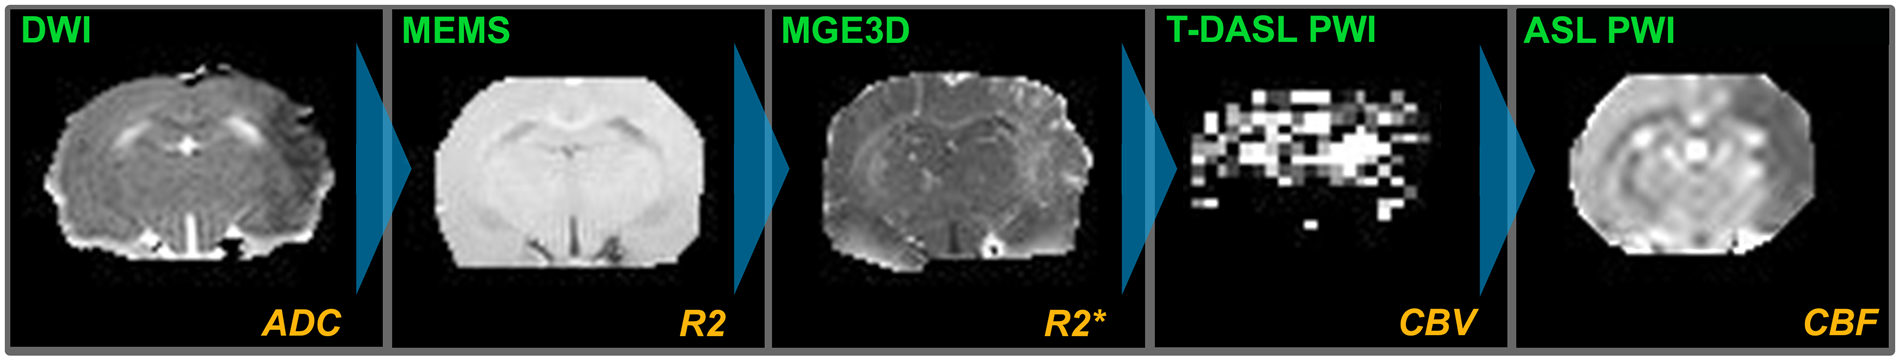
The imaging sequence used in the study. Imaging was performed during M2CAO, and repeated following the restoration of M2 blood flow. MRI methods used (green) and the detected read-outs (orange). Animals were first examined with diffusion-weighted imaging (DWI), followed by multi-echo-multi-slice (MEMS) and multi-gradient-echo 3D (MGE3D) sequences to measure R2 and R2* relaxation rates. Animals were subsequently examined with turbo dynamic arterial spin labeling (T-DASL) and continuous arterial spin labeling (ASL) perfusion-weighted imaging (PWI) in order to establish the hemodynamic parameters of cerebral blood volume (CBV) and cerebral blood flow (CBF).
Theory
As the OEF of ischemic tissue becomes elevated, the result is an increase in the fraction of deoxygenated hemoglobin (dHb) within the blood.29,30 qBOLD MRI23,24 uses the paramagnetic properties of dHb to generate measurements of oxidative metabolism. With the accumulation of dHb, the magnetic susceptibility of blood increases and gives rise to mesoscopic magnetic field inhomogeneities which increase the transverse relaxation rates R2 (1/T2) and R2* (1/T2*) of adjacent tissue. The R2′ relaxation rate exclusively describes the effect of these inhomogeneities, by removing from R2* the contribution of microscopic tissue T2 decay as measured by R2 (equation (1))23,24,29,31

A commonly accepted model by Yablonskiy et al.23,31,32 describes the correlation of R2′ relaxation rate to dHb fraction in a network of randomly distributed cylinders, and allows the approximate determination of OEF by combining R2′ with the CBVv fraction according to equation (2)
Calculation of OEF and CMRO2 maps
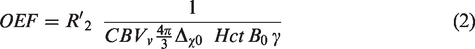
OEF maps were calculated according to equation (2). Δχ0 is the susceptibility difference between fully oxygenated and fully deoxygenated blood = 0.264 ppm, 35 Hct is the blood hematocrit fraction, B0 is the magnetic field strength and γ is the gyromagnetic ratio for the proton nucleus = 2.68 × 10⁸. The level of arterial blood oxygenation was postulated at 100%, i.e. the fraction of hemoglobin in oxygenated form equals 1/1. CBVv is the volume fraction of deoxygenated, venous blood in each voxel and was produced from T-DASL-derived CBVa measurements by applying a 0.25 arterial-venous partition fraction 27 as mentioned above.
In voxels where the calculated OEF resulted in a value > 1, the value was regularized to 1, as the extraction of blood oxygen in these voxels should be considered at the physiological maximum, i.e. 100%.
Once approximate values of OEF had been established, approximate values of CMRO2 µmol/100 g/min were calculated by factoring in hemodynamic parameters according to the following relationship (equation (3))

Animal care and use
Twenty male SD rats (weight range 302–422 g) were used. Animal handling and experiments were conducted and applied according to the guidelines of the Animal Welfare Board at Karolinska Institutet and approved by the Stockholm Northern Regional Ethical Committee (N4/15). Experiments were conducted and reported in compliance with the Animal Research: Reporting in-Vivo Experiments (ARRIVE) guidelines.
Animals were kept in groups in cages in a humidity controlled, thermoregulated facility with a 12-h/12-h-light/dark cycle and access to food and water ad libitum. Animals were euthanized through decapitation while in deep anesthesia.
Ischemic stroke model
The M2CAO method was performed using a previously described procedure. 21 In summary, anesthesia was induced at a 4%, and sustained at a 1.5–2%, Isoflurane (Virbac, Carros Cedex, France) concentration in an air:oxygen mixture (7:3). Animals were administered a 0.4 mL/kg dose of a local analgesic (Lidocain, 1%, Astra Zeneca, London, UK). A rectal thermistor-equipped heating pad maintained animal body temperature. Vital signs were monitored throughout the surgical procedure.
X-ray fluoroscopy guidance (Philips Allura Xper XD20 Interventional X-ray system, Philips Medical Systems) was used for the endovascular procedure. A 0.007-inch microwire (Hybrid; Balt Extrusion, Montmorency, France), sheathed inside a 0.020-inch microcatheter (Ultraflow; Covidien, Mansfield, MA, USA), was introduced through the ventral tail artery. The microcatheter was placed in the proximal descending aorta and the tip of the microwire was advanced further until positioned in the M2 segment of the MCA, achieving M2CAO. Reperfusion was obtained by retracting the microwire from the M2 segment.
MRI – Acquisition
Animals were kept anesthetized with Isoflurane during MRI examinations. The head of the animal was placed in a MRI-compatible stereotactic frame in order to achieve spatial consistency between examinations and to reduce motions artifacts. The proximal ends (farthest from the animal) of the microcatheter and microwire were left accessible outside the bore of the MRI-scanner during examinations. This allowed minimally invasive reperfusion without the need to alter the in-bore position of the animal. Animal vital signs (SA – instruments, Stony Brook, NY, USA), including arterial oxygen saturation, were monitored continuously throughout examinations, and a continuous flow of heated air, regulated by a rectal thermistor, maintained animal body temperature.
The MRI examination was performed in a horizontal 9.4 Tesla (T) Magnet (Varian, Yarnton, United Kingdom) with a maximum gradient strength of 600 mT/m. An actively tuned birdcage resonator was used for excitation and an actively detuned 4-channel phase array surface coil (Rapid Biomedical GmbH, Wurzburg-Rimpar, Germany) was used as the receiver coil. An actively tuned surface coil for flow-induced adiabatic inversion of the arterial blood in the neck was used for ASL tagging. The durations of scans were: DWI: 5 min. MEMS: 6 min. MGE3D: 7 min. T-DASL: 22 min. ASL-PWI: 5 min.
DWI
DWI was acquired through multi-slice three shot SE echo-planar-imaging (EPI) as described previously by Little et al. 13 The central slice of the slice package was placed on the slice with the largest lesion size on the DWI scout.
T2 imaging
T2 imaging was performed using a MEMS sequence with the following parameters: 16 evenly spaced echoes ranging from echo times (TE) = 6.94 to 110.98 ms, 15 continuous slices of 1 mm thickness with a matrix size of 128 × 128 and a field of view (FOV) of 32 × 32 mm.
T2* imaging
T2* imaging was performed using a MGE3D sequence with the following parameters: 12 evenly spaced TE ranging from 2.19 to 37.21 ms, a matrix size of 128 × 96 × 64 covering a FOV of 32 × 24 × 16 mm3, a flip angle of 13°, a repetition time (TR) of = 70 ms. Saturation bands (rostral, caudal and inferior to the brain) were used to suppress signals originating from outside the FOV.
ASL PWI
T-DASL25,26 was collected in three slices of 2 mm thickness, with the central slice placed in the core of the infarct observed in the DWI scout. The additional slices were shifted in the anterior and posterior directions, respectively.
T-DASL data collected in the presence and in the absence of vascular suppression was used to estimate the relative CBVa.25,26 Imaging parameters for the single shot gradient-echo echo planar imaging were TR = 67.6 ms, flip angle 11°, matrix size 48 × 48 with Cartesian sampling for a FOV of 32 × 32 mm2, slice thickness 2 mm. Vascular suppression was obtained through a pair of 1 ms gradients pulses, parallel and antiparallel to the read-out gradient direction, i.e. inferior-superior. The vascular suppression pulses were played with amplitudes of corresponding to b-values of 50 s/mm2 or zero in the presence and absence of vascular suppression, respectively. Tagging of the arterial blood was accomplished by applying a b1-field corresponding to approximately 100 Hz at the level of the carotids through the actively tuned surface coil placed under the neck of the rat, in the presence of a gradient of 1 Gauss/cm in the rostral-caudal direction. The tagging position was 17 mm proximal to the image slice.
In each 2 mm slice, acquisition started with a 10-s recovery period where equilibrium magnetization was established. Thereafter, the excitation pulse and the EPI readout module were repeated 888 times with a TR = 67.6 ms, resulting in 888 images in 1 min. First, 148 images were acquired in the absence of tagging to achieve a steady-state condition. After establishing the steady-state, tagging was applied during the recovery times, i.e. between the readout module and the excitation pulse (50 ms), for 5 s. Thereafter, the tagging was turned off for 5 s and the steady-state was re-established. This 10-s cycle was repeated five times. Thereafter, a 10-s recovery period ensued in the absence of radio frequency-power to re-establish equilibrium magnetization before repeating the experiment, with the modification that the vascular suppression gradients were turned on. The experiment was repeated three times in the presence and absence of vascular suppression, for each of three different slice positions.
Continuous ASL was acquired as described previously. 13
MRI processing
R2-mapping
A single exponential decay function was fitted to the magnitude images of the multi echo multi slice (MEMS)-data within VnmrJ 4.0. The resulting R2 maps were interpolated to match the high resolution of the R2* maps in Matlab 2010.
R2*-mapping
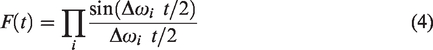
Image processing was performed in Matlab using in-house scripts. The R2* was extracted from multi gradient echo (MGE3D) T2* images through the construction of complex valued images. Singular value decomposition was then used to reduce the noise and merge the information from the different channels in the MGE3D images. The complex-valued decay of each pixel was fitted to a complex-valued single exponential decay, where the real part of the decay constant is the apparent R2* and the imaginary component is the off-resonance frequency. Corrected R2* maps were calculated by applying the convolution kernel F(t) which expresses contributions from macroscopic field inhomogeneities to signal attenuation33,34 (equation (4)). For cuboid voxels with constant background gradients in the read, phase and phase2 directions, the convolution kernel is a product of three sinc functions, i.e.
T-DASL
T-DASL 26 data were analysed pixel-wise with in-house Matlab (Mathworks, Nantucket) code. The temporal curve for each pixel was analysed in a three-step process. Initial estimates of the initial signal, S0, the steady-state signal in the absence of tagging, Mss, and the longitudinal relaxation rate, R1, were obtained by fitting a function of the form S(t)=S0 exp(−t Rʹ1 app ) + Mss(1−exp(−t Rʹ1 app )) to the first 10 s before the onset of the tagging.
Only pixels displaying at least an initial signal intensity above a constant threshold was analysed further as the arterial cerebral blood volume (CBVa) analysis requires high signal-to-noise ratio. Hence, pixels originating from tissue remote to the surface coil or low signalling in the epi images were excluded from further analysis. The ensuing data, i.e. the three periods of lower intensity, were fitted to a two-compartment model with the adjustable parameters: transition time, τ, perfusion rate, f, while literature data for the blood tissue partition coefficient (λ = 0.9) and longitudinal relaxation rate of blood (R1blood = 0.43 s−1) 25 were assumed. The labelling efficiency was estimated from the ratio of the tagging period relative to the repetition time (TR) multiplied with the typical labelling efficiency for the used configuration, i.e. 75%.
The initial fitting was performed independently for data acquired in the absence and presence of vascular suppression. In the next phase, eight parameters were fitted simultaneously to the data acquired in the absence and presence of vascular suppression. The apparent perfusion, apparent transition time and apparent initial signal intensity were allowed to vary between the examinations performed in the absence and presence of vascular suppression, while the apparent flip angle and the longitudinal relaxation rate of tissue were fixed in the absence and presence of vascular suppression. Regularizing conditions of the initial signal intensity in the absence of vascular suppression was greater or equal to the signal intensity in the presence of vascular suppression, the apparent transition time in the absence of vascular suppression was shorter or equal to the apparent transition time in the presence of vascular suppression and the apparent perfusion in the absence of vascular suppression was greater or equal to the apparent perfusion in the presence of vascular suppression.
The CBVa fraction was calculated thereafter from the resulting parameters using equation (4) of Meng et al. 26 CBVa maps were subsequently interpolated to the high resolution of the R2* maps to achieve pixel correspondence by the nearest neighbour interpolation. Subsequently, an arterial-venous volume fraction of 0.25 was applied for the conversion of CBVa into estimates of CBVv, 27 i.e. the fraction of each voxel consisting of venous blood.
Analysis and regions of interest
The region of interest (ROI) delineating the IC was manually traced in apparent diffusion coefficient (ADC) maps collected after reperfusion. The IC ROI was defined as cortical regions with an apparent reduction in ADC compared to corresponding regions in the healthy, contralateral hemisphere. An analysis was performed to evaluate the degree of ADC reduction in IC ROIs when compared to immediately surrounding tissue. Please see Supplemental Material and Supplementary Figure 1 for a description of, and results from, the performed analysis.
IC ROIs were transferred to CBF maps collected during M2CAO, where IC-CBF mismatch ROIs were manually traced to include cortical tissue with an apparent perfusion deficit compared to the contralateral cortex, but not recruited to the IC. An analysis was performed to evaluate the degree of perfusion deficit in the IC-CBF mismatch ROIs when compared to immediately surrounding tissue. Please see Supplemental Material and Supplementary Figure 2 for full description and results.
IC ROIs were transferred to OEF maps collected during M2CAO, where the IC-OEF mismatch ROIs were manually traced to include tissue with an apparent OEF elevation compared to the contralateral cortex, but not recruited to the IC.
Two principal analyses were performed. We first compared the volume of the IC-OEF mismatch to the volume of the IC-CBF mismatch. In the second analysis, we examined the effect of M2CAO and reperfusion on OEF and CMRO2 (µmol/100 g/min) in ischemic regions. The penumbra ROI (PEN) was manually traced in CBF maps collected during M2CAO. The PEN was defined as severely hypoperfused cortical voxels with a CBF of 12–22 ml/100 g/min 6 but not recruited to the IC (please see Supplementary Figure 3 for demonstration of IC and PEN ROIs). The term ischemic regions refer to both the IC and the PEN.
For all ROI types, control regions of comparable size and position were placed in the contralateral hemisphere. ROIs were used to extract data from R2′, CBF, CBVv, OEF and CMRO2 maps collected during M2CAO and after reperfusion.
ITK-SNAP 36 software was used for ROI segmentation. Each examination was visually inspected. Susceptibility artifacts from the microwire used to cause M2CAO were excluded from regions of interest by visual inspection in R2* images. ROIs were therefore subject to restrictions due to the necessity to exclude artifacts. Although these artifacts were not as a rule present in ADC or CBF maps, we chose to use the final ROIs, where artifact exclusion had been performed, consistently across all read out measurements. The final ROIs were also filtered to exclude voxels excluded from the T-DASL-derived calculation of CBVv due to low signal strength.
Statistical methods
Paired t-tests were performed for comparative analysis. P ≤ 0.05 was considered statistically significant.
Results
Animals and exclusions
Twenty animals were subjected to M2CAO and examined with MRI before and after reperfusion. All animals survived the full examination. Technical malfunction resulted in an incomplete examination and therefore exclusion of one animal. Two animals were excluded due to magnetization transfer artifacts in images collected during M2CAO. Another three animals were excluded due to hemorrhagic complications upon reperfusion. In one animal, no IC or PEN was present, preventing analysis. One animal had PEN, but no apparent IC. This animal was included in the analysis of oxidative metabolism in the PEN, but not in the comparison between IC-CBF and IC-OEF mismatch volumes. The mean M2CAO duration for animals included in the final analysis was 78 ± 11 min. The mean volume of the Ischemic lesion in examined tissue regions was 19.1 ± 19 mm3. The mean ± SD time lapses from the start of M2CAO to the start of scans were: DWI: 21 ± 6.6 min. MEMS: 27 ± 7.1 min. MGE3D: 35 ± 9.0 min. T-DASL: 46 ± 13 min. ASL: 68 ± 13 min. The mean ± SD time lapses from reperfusion to the start of scans were: DWI: 13 ± 3.2 min. MEMS: 18 ± 2.8 min. MGE3D: 24 ± 2.9 min. T-DASL: 33 ± 3.3 min. ASL: 56 ± 6.2 min. Animal physiology data are available in the Supplemental material.
ADC restriction in IC compared to surrounding tissue
The ADC of the outer perimeter of the IC ROI was significantly decreased when compared to immediately surrounding tissue. Please see Supplemental Material as well as Supplementary Figure 1 for complete results.
CBF deficit in IC-CBF mismatch compared to surrounding tissue
The CBF of the outer perimeter of the IC-CBF mismatch was significantly lower than the CBF of immediately surrounding tissue. Please see Supplemental Material as well Supplementary Figure 2 for complete results.
IC-OEF mismatch to IC-CBF mismatch volume comparison
Our analysis determined that the volume of the IC-OEF mismatch (25.8 ± 8.4 mm3) was significantly smaller than the volume of the IC-CBF mismatch (37.6 ± 14 mm3) during M2CAO (p = 0.0017) (Figure 2(b)). The average OEF was 0.906 ± 0.049 in the IC-OEF mismatch and 0.589 ± 0.063 in the IC-CBF mismatch.
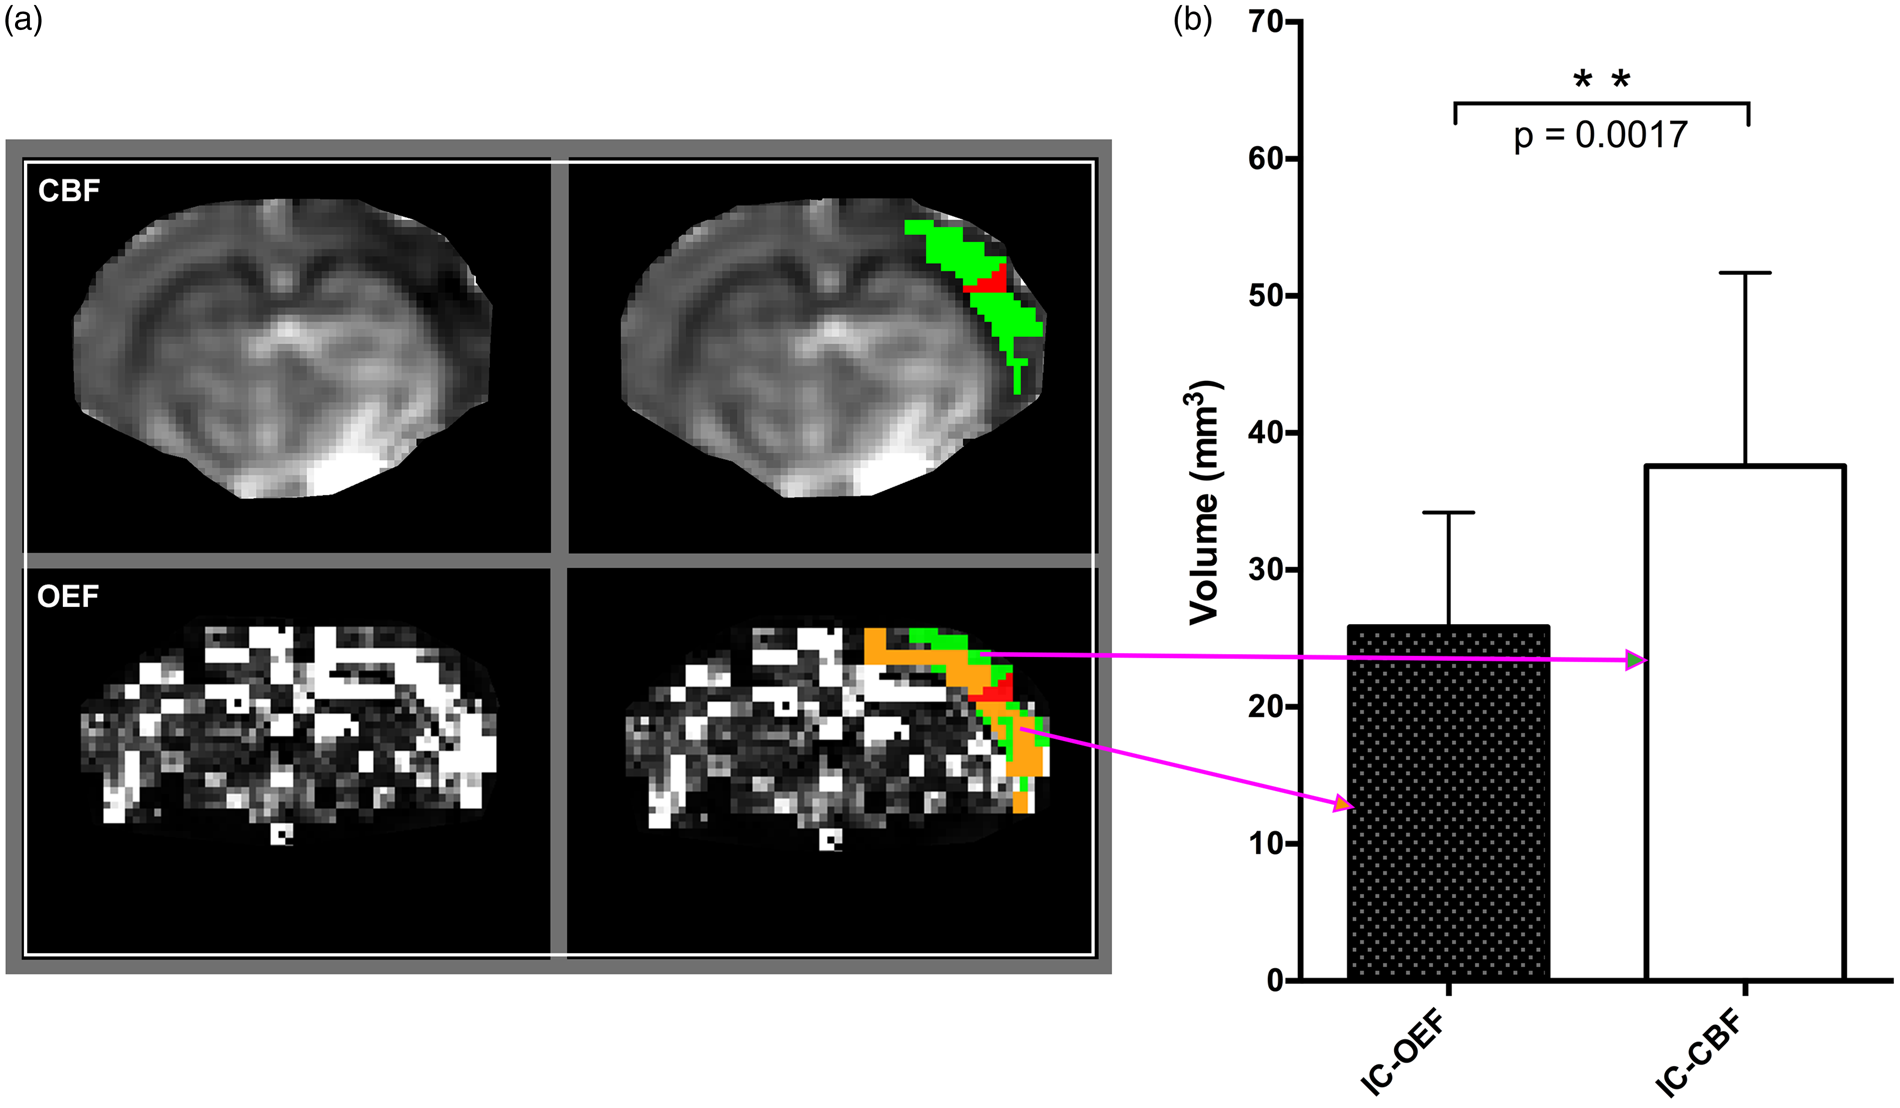
Volumetric comparison of mismatch regions during M2CAO. (a) Examples of regions of interest from a single animal. Cerebral blood flow (CBF) and oxygen extraction fraction (OEF) maps are shown in the left column. The ischemic core (IC) (red) was segmented in apparent diffusion coefficient (ADC) maps derived from diffusion-weighted imaging and was defined as regions with an apparent decrease in ADC. The IC-CBF mismatch ROI (green) was defined as viable regions, i.e. not included in the IC, with an apparent decrease in CBF, and can be seen at the top of the right column. The IC-OEF mismatch (orange) was defined as viable regions with an apparent OEF elevation and is shown at the bottom of the right column. (b) Statistical comparison: The volume of the IC-OEF mismatch was significantly smaller (p= 0.0017) than the volume of the IC-CBF mismatch.
Increased OEF in ischemic regions
We examined the pathological changes in oxygen metabolism in the PEN. The PEN was defined as severely hypoperfused tissue (CBF between 12 and 22 ml/100 g/min) not recruited to the IC. Analysis revealed a significantly increased OEF in the PEN during M2CAO (0.569 ± 0.11) when compared to the control region (0.348 ± 0.12) (p = 0.0008) (Figure 3(a)). The OEF of the IC was also significantly increased (Figure 3(b)) when compared to the corresponding control region (0.572 ± 0.18 vs. 0.0.391 ± 0.18, p = 0.0401).
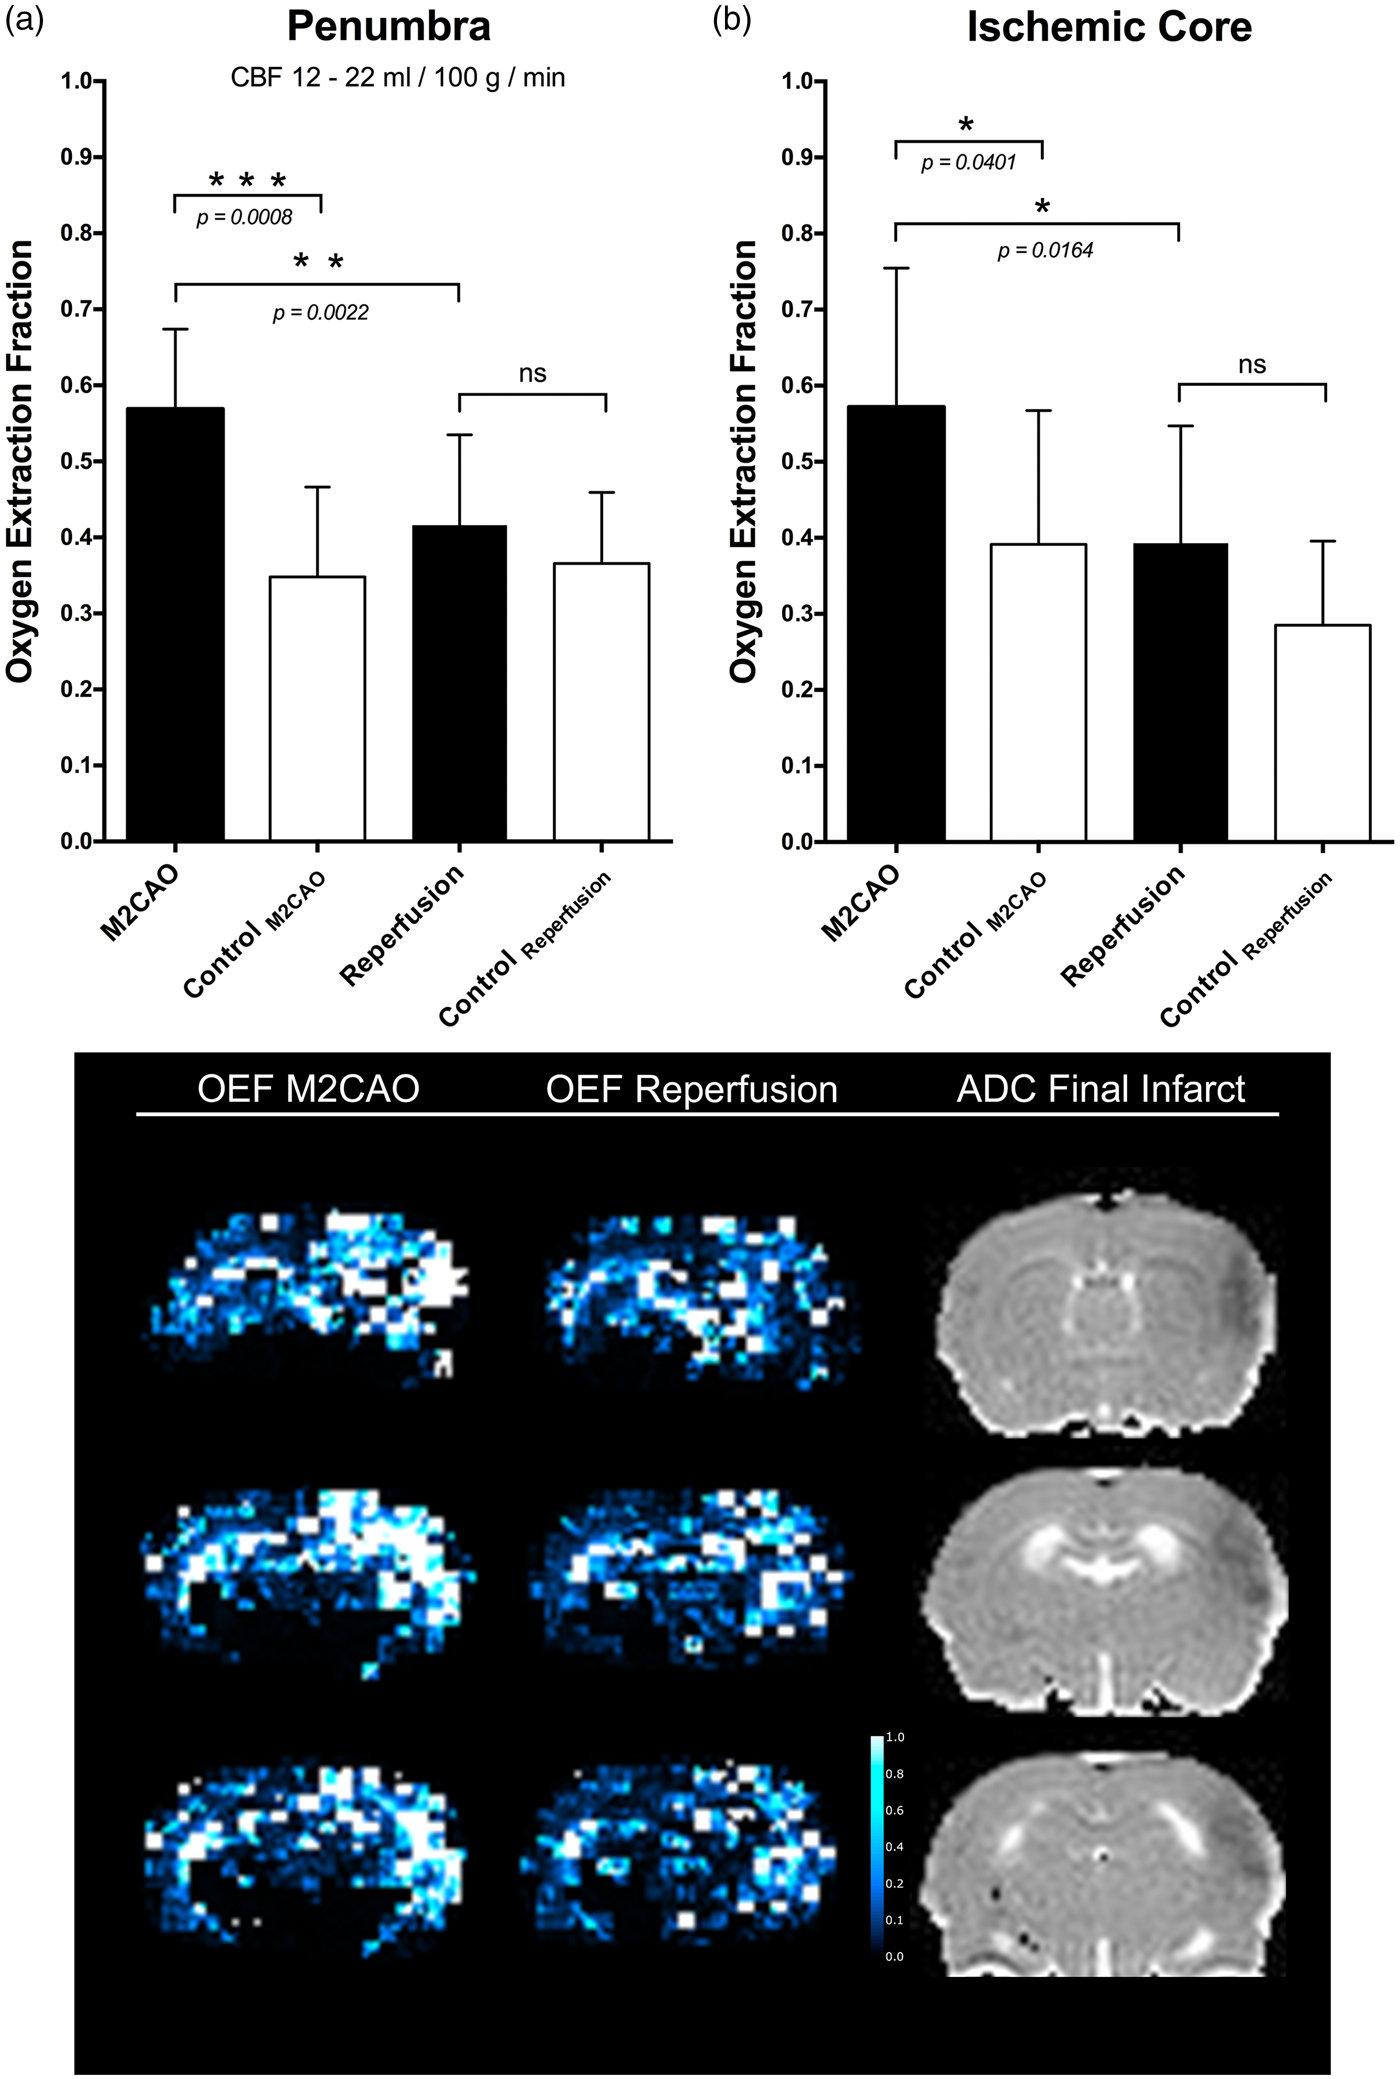
The oxygen extraction fraction (OEF) in ischemic regions during M2 occlusion (M2CAO) and after the restoration of blood flow (reperfusion). Increased OEF occurred in the penumbra (a), and in the ischemic core (b) during M2CAO but decreased upon reperfusion. The lower panel shows three axial slices from the same animal where a clear OEF elevation has occurred in peri-infarct regions. Reperfusion decreases the OEF of ischemic yet viable brain tissue towards metabolic homeostasis (middle column).
Reperfusion caused the OEF of the PEN and the IC to decrease significantly (PEN: 0.416 ± 0.12, IC: 0.393 ± 0.15) from levels present during M2CAO (p= 0.0022 and p = 0.0164). No significant difference between ischemic regions and corresponding control regions remained after reperfusion (Figure 3(a) and (b) and Figure 3 lower panel).
Reduced CMRO2 in the ischemic regions restored by reperfusion
The CMRO2 (µmol/100 g/min) of the PEN was significantly reduced during M2CAO (93.9 ± 17.7 vs. 349 ± 88.8, p value < 0.0001) when compared to the corresponding control region (Figure 4). Reperfusion resulted in a significant increase of PEN CMRO2 to 255 ± 99.1 (p value = 0.0002). A significant difference between PEN and control region CMRO2 remained after reperfusion (p = 0.0156). The CMRO2 of the IC during M2CAO was lower than that of the control region (231 ± 246 vs. 352 ± 182), but the difference was not significant. Reperfusion resulted in a non-significant increase in IC CMRO2.
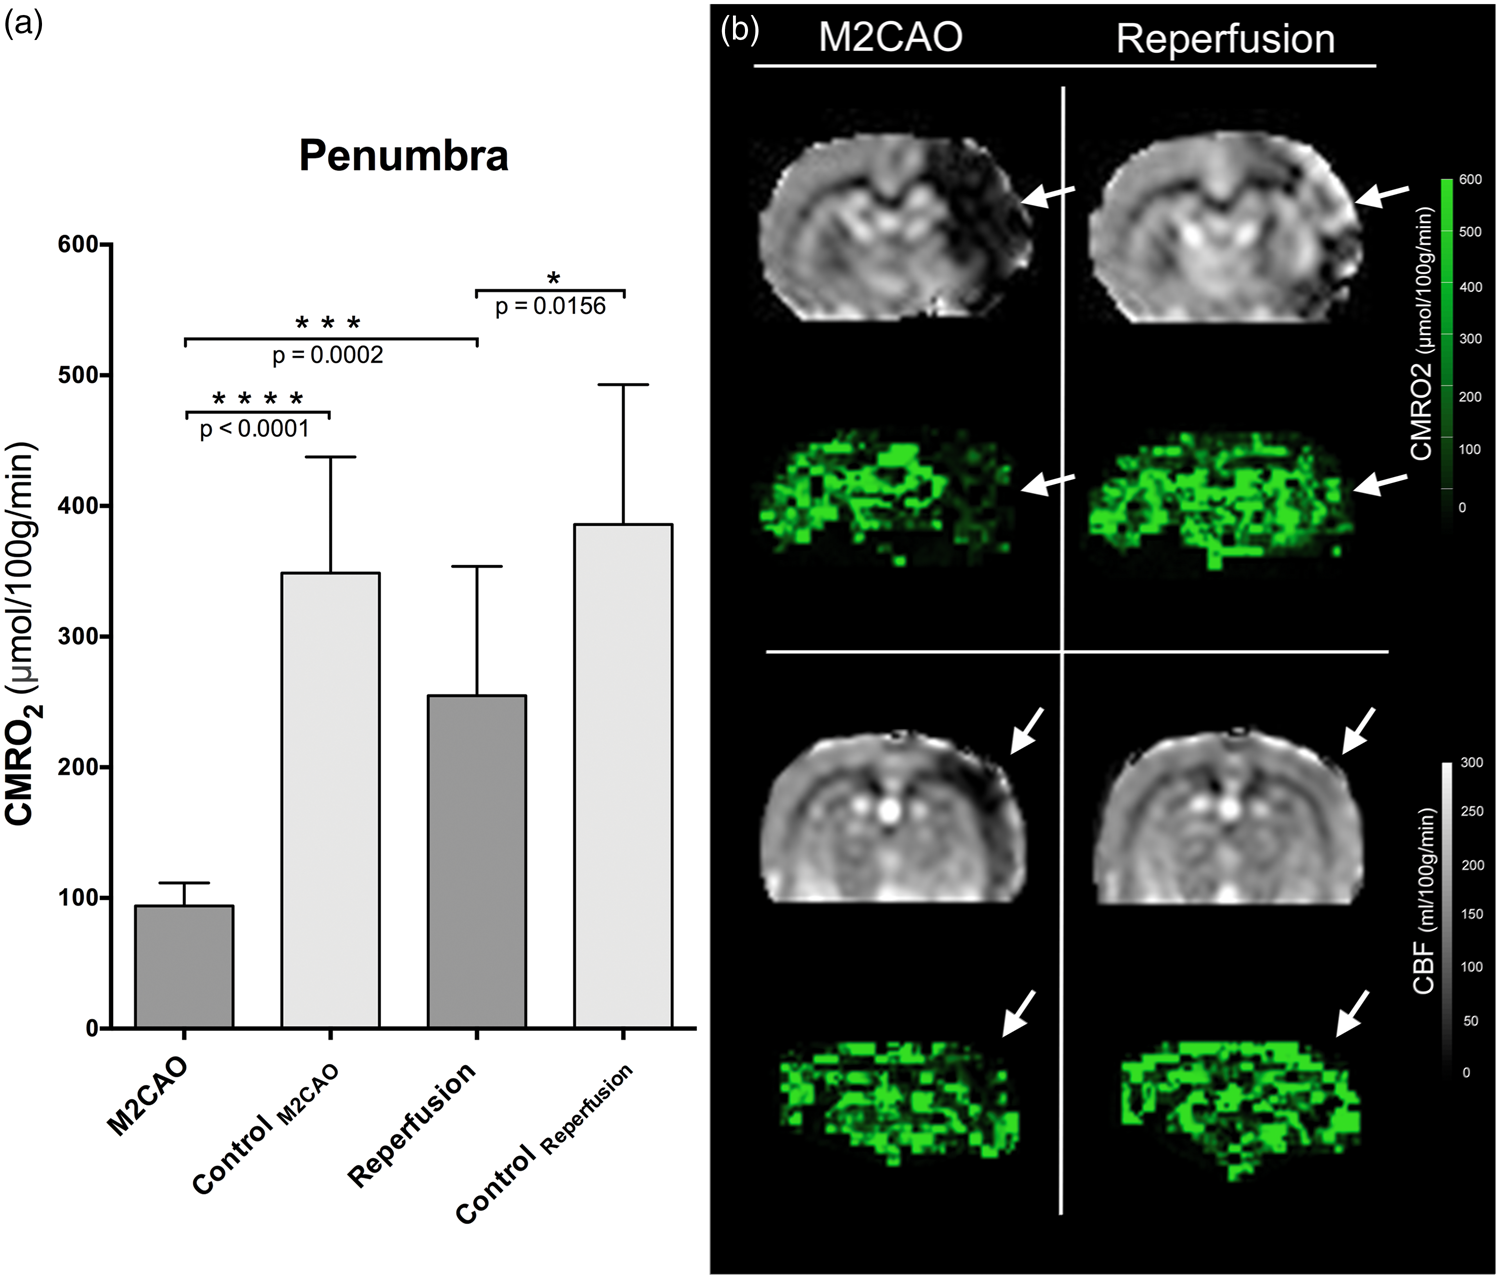
(a) The cerebral metabolic rate of oxygen (CMRO2) (µmol/100 g/min) of the penumbra (CBF: 12–22 ml/100 g/min) and the control region during M2CAO and after reperfusion (mean ± SD). A significant CMRO2 reduction occurred during M2CAO, but increased significantly upon reperfusion. A significant difference between penumbra and control region CMRO2 remained after reperfusion. (b)Axial slices from two different animals displaying the impaired CMRO2 of regions with decreased CBF (white arrows) during M2CAO (left column). Upon reperfusion, there is a clear improvement of CMRO2 in these regions (right column).
CBF, CBVv and R2′ in regions of interest
Results are summarized in Table 1.
Parameters of interest in examined regions of interests during M2CAO and after reperfusion.
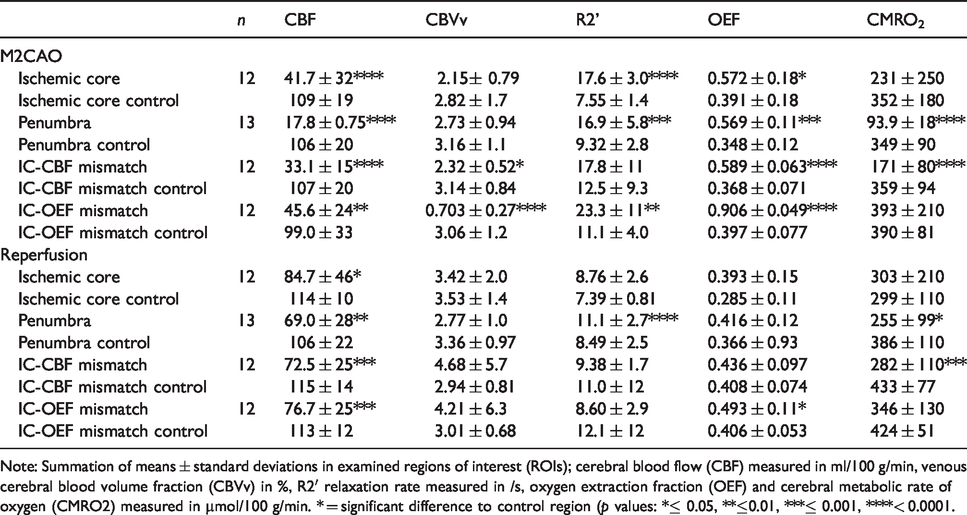
Note: Summation of means ± standard deviations in examined regions of interest (ROIs); cerebral blood flow (CBF) measured in ml/100 g/min, venous cerebral blood volume fraction (CBVv) in %, R2′ relaxation rate measured in /s, oxygen extraction fraction (OEF) and cerebral metabolic rate of oxygen (CMRO2) measured in µmol/100 g/min. * = significant difference to control region (p values: *≤ 0.05, **≤0.01, ***≤ 0.001, ****< 0.0001.
CBF levels (ml/100 g/min) of the IC (41.7 ± 32.1), PEN (17.8 ± 0.751), IC-CBF mismatch (33.1 ± 14.5) and IC-OEF mismatch (45.6 ± 23.6) were significantly decreased during M2CAO when compared to corresponding control regions (p values of < 0.0001, < 0.0001, < 0.0001 and 0.0011, respectively). Reperfusion caused a significant CBF increase in all ROIs to levels of 84.7 ± 45.8 (IC), 69.0 ± 27.7 (PEN), 72.5 ± 25.2 (IC-CBF mismatch) and 76.7 ± 24.9 (IC-OEF mismatch) (p values of 0.0074, < 0.0001, 0.0001 and 0.0005). Significant differences in CBF remained between ROIs and control regions after reperfusion (p values of 0.0413 (IC), 0.0046 (PEN), 0.0001 (IC-CBF mismatch) and 0.0001 (IC-OEF mismatch)).
CBVv levels (volume fraction (%)) of the IC (2.15 ± 0.791), PEN (2.73 ± 0.938), IC-CBF mismatch (2.32 ± 0.523) and IC-OEF mismatch (0.703 ± 0.269) were decreased during M2CAO. The decrease was significant in the IC-CBF mismatch and IC-OEF mismatch ROIs (p values = 0.0236 and <0.0001, respectively). No significant differences in CBVv remained between ROIs and corresponding control regions after reperfusion.
R2′ levels (/s) were significantly increased in the IC (17.6 ± 2.98), PEN (16.9 ± 5.79) and IC-OEF mismatch (23.3 ± 11.5) during M2CAO (p values of < 0.0001, 0.0005, 0.0034) and non-significantly increased in the IC-CBF mismatch (17.8 ± 10.6) when compared to control regions. Reperfusion caused a significant R2′ decrease in all ROIs (p values < 0.0001 (IC), 0.0038 (PEN), 0.0147 (IC-CBF mismatch) and 0.0008 (IC-OEF mismatch). A significant difference in R2′ remained between the PEN and the corresponding control region after reperfusion < 0.0001.
Discussion
AIS causes the time-dependent and continuous accumulation of irreversible damage within penumbra tissue-at-risk. 37 The restoration of blood flow to hypoperfused areas surrounding the IC has accordingly emerged as the focus of AIS treatment. The IC-CBF mismatch has been proposed to delineate the ischemic penumbra. However, several points of criticism have been directed against it, with reports suggesting an underestimation of the volume of oligemia within the perfusion deficit. 5 There is a continuous debate regarding the absolute blood flow thresholds separating the ischemic penumbra from benign oligemia and from irreversibly damaged tissue regions. 38 In a systemic review performed by Bandera et al., 38 it was observed that although mean values for relevant blood flow thresholds were largely consistent with those in experimental studies, the deviation of results was so varied that further validation is required in order to increase the diagnostic value of PWI. A significant complication in the validation of the IC-CBF mismatch as a surrogate of the penumbra is that the apparent size of the perfusion deficit differs depending on which perfusion parameter is used.2,39,40 A lack of methodological consistency between examinations could obviously have large implications for the individual patient when the decision is made whether to attempt revasculatory intervention. We chose to perform manual segmentation of the apparent CBF deficit rather than an automated threshold selection of the IC-CBF mismatch ROI. The reason was that we have experience in interpreting PWI and CBF maps during M2CAO, and therefore considered it the best method to adequately analyze the data. An analysis evaluating the CBF deficits of the IC-CBF mismatch ROI was performed, showing a significant difference between the perimeter of the IC-CBF mismatch ROI and the immediately surrounding tissue not included in the IC-CBF mismatch ROI (please see Supplemental Material and Supplementary Figure 2 for a full and detailed description).
We used metabolic MRI to demonstrate how IC-OEF-elevation mismatch provides a more restricted delineation of the ischemic penumbra than does IC-CBF mismatch. Results are interpreted as an improvement on penumbra specificity based on several considerations. Firstly, the M2CAO model used in this study has shown previously that although irreversible damage continues to accumulate also after the hyperacute phase, its spread at the expense of adjacent hypoperfused tissue is restricted, and does not grow to encompass the entirety of the CBF mismatch even after 10 h of M2CAO. 13 Similar results have been found in AIS patients, who when examined at 10 h after symptom onset had DWI lesion-PWI hypoperfusion volume ratios at approximately 30%. 41 Secondly, results presented in this study show how viable yet severely hypoperfused tissue (CBF 12–22 ml/100 g/min) suffers increased OEF, as well as decreased CMRO2, consistent with ischemic brain tissue undergoing metabolic adjustment to sustain vital energy requirements. 42 These results are largely in agreement with results from peri-infarct and DWI-PWI mismatch regions examined with oxygen-15 (15O) positron emission tomography (PET) in AIS patients5,43,44 and in animals subjected to MCA occlusion.45–47 Moreover, reperfusion resulted in a return to metabolic homeostasis in the examined tissue, as would be expected of penumbral tissue. We conclude from this that the tissue contained within the IC-OEF mismatch is in fact viable tissue-at-risk with a smaller fraction of benign oligemia than what is present within the IC-CBF mismatch.
The IC ROI employed in this study was defined as tissue with an apparent decrease in ADC in DWI examinations performed after reperfusion. DWI was chosen because it has proven a highly effective technique for the hyperacute detection of ischemia-induced brain damage, 1 and has previously been used by us to characterize the spread of ischemic injury resulting from M2CAO. 13 An analysis evaluating the ADC restriction of the IC ROIs used in this study was performed, with results showing a significant difference between the perimeter of the IC lesion and the immediately surrounding tissue (please see Supplemental Material and Supplementary Figure 1 for a full and detailed description). While OEF elevation in the ischemic penumbra has been well documented in 15 O studies, the fact that we observed increased OEF also in the IC is noteworthy. An increased OEF in the IC would seem to support that some cells remain metabolically active as they accumulate cytotoxic edema48–50 and may still be viable at the time of examination. The fact that fractions of the IC may not yet have suffered irreversible damage at the time of examination did not adversely affect our analysis considering that, in each animal, the same IC ROI was used when delineating IC-OEF and IC-CBF mismatches.
The clinically beneficial effects of mechanical thrombectomy in large vessel AIS have been demonstrated in several randomized trials. 4 While the time is brain doctrine is appropriate in the initial hours after ictus, a significant number of patients do not receive recanalizing treatment because they fall outside of the fixed time-window indicating intervention, 51 or have an uncertain time of onset. There are now increasing reports of sustained penumbra viability beyond the hyper-acute phase of ischemic stroke. 14 The DAWN trial showed the benefits of delayed thrombectomy in patients with limited ischemic lesions in conjunction with a clinical presentation indicating the presence of functionally impaired, i.e. penumbral, tissue as long as 24 h after ictus. 10 The DEFUSE 3 trial repeated these results but with a time period up to 16 h after ictus 11 in patients with regions of ischemic but still viable tissue. Marchal et al. 52 used 15 O PET to identify penumbral regions in stroke patients as late as 16 h after ictus, and in a [ 18 F] Fluoromisonidazole study performed by Markus et al., 53 there were substantial volumes of hypoxic yet viable tissue as late as 12–48 h after stroke. The prospect of prolonged penumbra viability supports the implementation of a tissue window as the deciding factor when identifying and handling the proportion (≤30%) of large vessel AIS patients who experience slow-progressing infarcts, and who present beyond the initial 6 h of AIS.14,15,54 Metabolic MRI would provide valuable support for clinical decision-making in this patient group. In fact, studies employing oxygen sensitive MRI such as quantitative susceptibility mapping and T2′, R2′-based methods have recently shown how CBF hypoperfusion correlates to estimates of OEF increase in AIS patients.55,56
The qBOLD imaging used in this study was based on the work by Yablonskiy et al.23,31 describing the effect of venous dHb concentration on tissue R2′. Although R2 and R2* measurements have previously been used in BOLD MRI, the qBOLD R2′ method has several advantages. 57 R2′ retains the oxygen sensitive capabilities of R2* but removes the R2 contribution which is susceptible to manifest pathology such as vasogenic edema and inflammatory gliosis13,58–61 (equation (1)). A limitation to qBOLD MRI is the need to combine several MRI techniques. In this study, the T-DASL-derived CBVv is the limiting factor in terms of spatial resolution and SNR. We chose T-DASL rather than a dynamic susceptibility contrast approach (DSC) because we wanted to examine animals twice, during M2CAO and again directly after reperfusion. This had not been possible with DSC considering the necessary wash-out time of contrast agents such as gadolinium. 62 Despite the limitations of T-DASL, however, CBVv fraction (%) values acquired in healthy control regions are in line with the literature63,64 and show reasonably low deviation between animals (Table 1).
qBOLD and R2′ imaging have been used in AIS research studies in experimental and clinical settings,56,63,65,66 and were used by us to compare the volumes of IC-OEF and IC-CBF mismatch at identical time points in the same animals. OEF levels of healthy control regions were in agreement with those previously reported in rats using gold standard 15 O PET, 47 and with those reported in studies validating BOLD MRI through blood oxygenation measurements.24,65
Conclusions
IC-OEF mismatch has the potential to identify salvageable penumbra, with increased OEF indicating metabolic stress yet sustained viability. Results presented in this study show how IC-OEF mismatch provides a spatially restricted delineation of tissue at risk compared to IC-CBF mismatch. Due to its intrinsic benefits of not being biased by the accumulation of vasogenic edema or acute inflammation, R2′-based metabolic imaging is suited to assessing tissue viability also in cases of slow-progressing, sub-acute AIS.
Supplemental Material
JCB892271 Supplemental Material - Supplemental material for Oxygen metabolism MRI – A comparison with perfusion imaging in a rat model of MCA branch occlusion and reperfusion
Supplemental material, JCB892271 Supplemental Material for Oxygen metabolism MRI – A comparison with perfusion imaging in a rat model of MCA branch occlusion and reperfusion by Philip V Little, Sandra E Kraft, Arvin Chireh, Peter Damberg and Staffan Holmin in Journal of Cerebral Blood Flow & Metabolism
Footnotes
Funding
The author(s) disclosed receipt of the following financial support for the research, authorship, and/or publication of this article: The study was funded and supported by The Söderberg foundation, Karolinska Institutet, Uppdrag Besegra Stroke, Stockholm County Council and MedTechLabs.
Acknowledgements
Experiments were performed at the Karolinska Experimental Research and Imaging Centre (KERIC). We are grateful to the staff at KERIC for their assistance.
Declaration of conflicting interests
The author(s) declared no potential conflicts of interest with respect to the research, authorship, and/or publication of this article.
Authors’ contributions
PL, PD and SH designed the study. PL, AC and PD performed experiments. PL, SK and PD performed the processing of raw data. PL performed the analysis. PL, PD and SH interpreted results of the analysis. PL, SK, PD and SH contributed to the writing of the manuscript.
Supplemental material
Supplemental material for this article is available online.
References
Supplementary Material
Please find the following supplemental material available below.
For Open Access articles published under a Creative Commons License, all supplemental material carries the same license as the article it is associated with.
For non-Open Access articles published, all supplemental material carries a non-exclusive license, and permission requests for re-use of supplemental material or any part of supplemental material shall be sent directly to the copyright owner as specified in the copyright notice associated with the article.