
Abstract
Functional MRI (fMRI) can identify active foci in response to stimuli through BOLD signal fluctuations, which represent a complex interplay between blood flow and cerebral metabolic rate of oxygen (CMRO2) changes. Calibrated fMRI can disentangle the underlying contributions, allowing quantification of the CMRO2 response. Here, whole-brain venous oxygen saturation (Y v ) was computed alongside ASL-measured CBF and BOLD-weighted data to derive the calibration constant, M, using the proposed Y v -based calibration. Data were collected from 10 subjects at 3T with a three-part interleaved sequence comprising background-suppressed 3D-pCASL, 2D BOLD-weighted, and single-slice dual-echo GRE (to measure Y v via susceptometry-based oximetry) acquisitions while subjects breathed normocapnic/normoxic, hyperoxic, and hypercapnic gases, and during a motor task. M was computed via Y v -based calibration from both hypercapnia and hyperoxia stimulus data, and results were compared to conventional hypercapnia or hyperoxia calibration methods. Mean M in gray matter did not significantly differ between calibration methods, ranging from 8.5 ± 2.8% (conventional hyperoxia calibration) to 11.7 ± 4.5% (Yv-based calibration in response to hyperoxia), with hypercapnia-based M values between (p = 0.56). Relative CMRO2 changes from finger tapping were computed from each M map. CMRO2 increased by ∼20% in the motor cortex, and good agreement was observed between the conventional and proposed calibration methods.
Keywords
Introduction
Measurement of the brain's metabolic response to a stimulus provides insight into the regional recruitment and activation of neurons. As the brain relies almost entirely on oxidative metabolism to meet its energy needs, the cerebral metabolic rate of oxygen (CMRO2) can be used to characterize the overall metabolic requirements of the brain. Traditional blood-oxygen level dependent (BOLD) MRI is sensitive to changes in the effective transverse relaxation rate (R2*) due to local changes in deoxyhemoglobin (dHb) content and concentration. 1 In response to neural activation, the BOLD signal ultimately changes due to a combination of increased local metabolism (e.g. increased [dHb]) and a surplus of local blood flow (which tends to decrease [dHb]). Thus, due to the competing processes, traditional BOLD yields patterns of activation but cannot on its own quantify the magnitude of the CMRO2 response. 2
Calibrated fMRI, on the other hand, can quantify relative CMRO2 changes in response to a stimulus,3,4 and, more recently, voxel-wise CMRO2 at rest.5–7 By measuring BOLD and cerebral blood flow (CBF) changes (via arterial spin labeling, ASL) in response to a global stimulus – the so-called calibration scan, the relationship between BOLD, CBF, and CMRO2 is revealed, yielding the calibration constant, M, which represents the maximum possible BOLD signal change that would be achieved with complete washout of dHb. Subsequently, task-evoked changes in BOLD and CBF can be converted to relative CMRO2 changes.3,8,9 Thus, following the calibration scan, calibrated fMRI can quantify relative CMRO2 responses with both high spatial and temporal resolution.
Most calibration methods use vasoactive stimuli such as hypercapnia,3,4 hyperoxia,10,11 carbogen, 12 or a combination thereof,5–7,13 to determine M. Separate assumptions and calibration equations are used, depending on the choice of stimulus. Hypercapnia (HC, e.g. ∼5% CO2 in room air) induces large blood flow changes in the cerebral cortex due to vasodilation and increased perfusion pressure secondary to changes in blood pressure. 14 Hyperoxia (HO, increased fraction of inspired oxygen, FiO2 > 21%) increases the oxygen carrying capacity of arterial blood via plasma-dissolved oxygen. More modest CBF changes are observed in response to HO, with reports suggesting that CBF remains relatively constant 15 or slightly decreases. 16 HO also induces a positive BOLD response17,18 attributed to an overall decrease in local [dHb], as abundant plasma-dissolved oxygen reduces the amount of hemoglobin-bound O2 offloaded to tissue.
Due to the relative paramagnetism of deoxyhemoglobin, MRI lends itself to the measurement of venous oxygen saturation (Y v ), where [dHb]∝(1-Y v ), through T2- 19 or susceptometry-based oximetry (SBO).20,21 If it is assumed that changes in venous oxygen saturation are spatially uniform in response to the gas breathing stimulus, whole-brain measures of Y v (e.g. from the superior sagittal sinus, SSS) may be used to better inform the calibration procedure. To that end, we herein propose a calibration method, termed Y v -based calibration, applied identically to HO or HC stimuli, in which BOLD, ASL, and MR-measured whole-brain Y v are incorporated to determine M. We introduce an interleaved ASL, BOLD, and dual-echo GRE sequence, OxBOLD, to concurrently measure CBF, BOLD, and Y v . We compare M maps derived from conventional and proposed (Y v -based) calibration models, and finally demonstrate the ability to measure the relative CMRO2 response to finger tapping.
Theory
The goal of calibrated fMRI is to disentangle the CMRO2 response from BOLD and CBF changes. As described by Davis, et al.,
3
calibrated fMRI relates the BOLD signal changes to the relative response of the cerebral blood volume (CBV) and venous [dHb] as
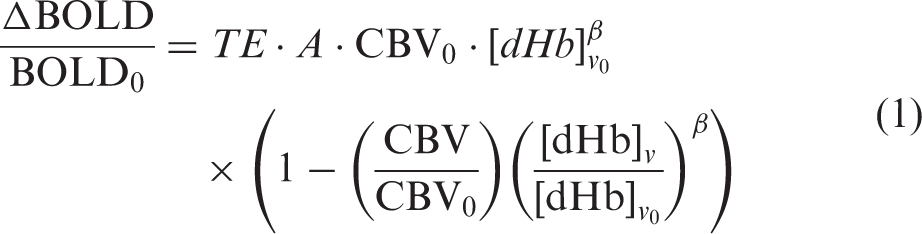
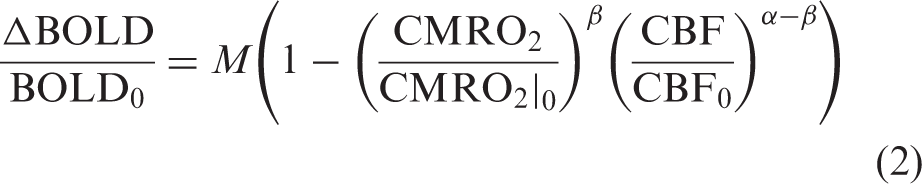
There are a variety of strategies to solve for M, generally involving a calibration experiment in which BOLD, CBF, and sometimes [dHb]v are simultaneously measured during a stimulus assumed to be isometabolic (typically HC or HO gas breathing). In the original model proposed by Davis et al.,
3
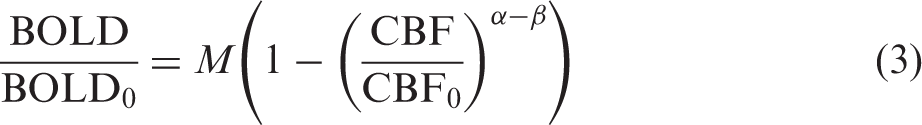
using HC as a vasoactive stimulus with an assumed isometabolic response allows simplification of equation (2) to
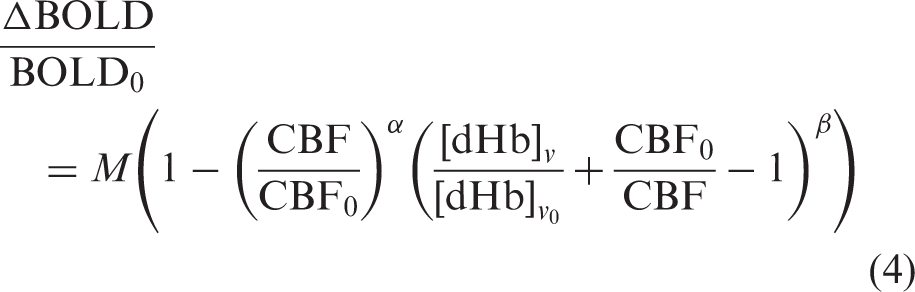
Alternatively, HO can be used as a stimulus for BOLD calibration.10,11 Initially proposed by Chiarelli et al.,
10
M can be determined by simultaneously measuring BOLD and CBF changes in response to HO, while estimating [dHb]v from changes in the expired oxygen (e.g. partial pressure of end-tidal O2, PETO2). Given that [dHb]
v
changes both because of increased oxygen content in arterial blood (proportional to the partial pressure of oxygen in inspired air) and changes in blood flow, a correction term is added to equation (1) as
However, the conversion from changes in PETO2 to [dHb] is rather indirect, relying on the assumption that oxygen extraction fraction (OEF) is constant between the normoxic and hyperoxic conditions, and that [dHb] changes are not only spatially uniform in the brain, but also throughout the body.
Alternatively, MRI can be used to quantify intravascular Y
v
in a large draining vein using SBO. By modeling a vein, in this case the SSS, as a long, straight cylinder oriented relatively parallel to B0, an analytical solution can relate the magnetic susceptibility-induced incremental field shift due to the presence of paramagnetic deoxyhemoglobin inside the vein (measured as the vein-tissue difference in the rate of inter-echo phase accrual from gradient echo data) to Y
v
as20,21

With the Y v -based calibration model, all parameters are obtained from the MRI experiment, and the brain's global oxygen extraction is directly measured, therefore it does not need to be assumed as constant between the baseline and stimulus conditions. Isometabolism does not need to be explicitly assumed; however, if no CMRO2 change occurs in response to the stimulus, the Y v -based model simplifies to the original model proposed by Davis et al. 3 as shown in equation (2). Furthermore, the Y v -based calibration model can theoretically be applied in the context of any global neurometabolic stimulus that produces spatially uniform changes in Y v .
Materials and methods
Thirteen young healthy subjects (mean ± standard deviation age = 30.1 ± 4.2 years, 7 male) were recruited to participate in the study after providing written informed consent. All aspects of this study were approved by the Institutional Review Board of the University of Pennsylvania as guided by the ethical principles set forth in the Belmont Report. Each subject completed screening and medical history questionnaires, followed by MRI scanning procedures and a venous blood draw. OxBOLD (described below) data were collected for 5 min during each condition including (1) normocapnic/normoxic baseline, (2) HO, (3) finger tapping (while breathing normocapnic/normoxic air), and (4) HC. Partial pressure of end-tidal oxygen (PETO2) and CO2 (PETCO2) were monitored and stimulus gases delivered via the RespirAct Gas Control System (Thornhill Research, Toronto, Canada). Following the MRI experiment, a venous blood draw was performed to determine the subject's hematocrit.
Image acquisition
Data were collected at 3T (Siemens Prisma, VE11C, Erlangen, Germany) using a 32-channel head coil. Subjects were positioned supine, and a mask was placed over their nose and mouth and secured with medical skin tape to achieve an air-tight seal. Localizers were followed by a time-of-flight angiographic sequence, used to plan the locations of the pseudo-continuous arterial spin labeling (pCASL) labeling plane and dual-echo GRE acquisition. Subsequently, a sagittal T1-weighted MPRAGE was acquired for image registration and gray matter (GM) versus white matter (WM) segmentation. A series of OxBOLD scans, each lasting 5 min, were then collected at rest, while the subject was breathing stimulus gases (i.e. HO and HC), and while the subject performed a block-design finger tapping task.
OxBOLD is a three-part interleaved sequence comprising background-suppressed 3D-RARE stack-of-spirals pCASL,
25
BOLD-weighted 2D spiral, and dual-echo GRE acquisitions. To maximize the temporal SNR of both BOLD and ASL data, a dual-acquisition approach
26
was used. Briefly, background-suppression pulses were used to reduce the signal from static GM, WM, cerebrospinal fluid (CSF), and remnant local blood to ∼1% of the initial magnetization. Following the 3D-RARE stack-of-spirals readout, a 1.3 s delay was allotted for recovery of longitudinal magnetization prior to the BOLD-weighted acquisition. Following the full BOLD acquisition, a global saturation pulse was applied and single-slice, dual-echo GRE data were acquired to determine Y
v
in the SSS via SBO.20,21 The OxBOLD pulse sequence and longitudinal magnetization of various tissues in the brain over the course of one OxBOLD TR are shown in Figure 1.
OxBOLD pulse sequence showing interleaved approach for ASL, BOLD, and susceptometry-based oximetry (SBO) data. Relative slice/slab locations are shown on the right, where the dark red block corresponds to the 3D ASL FOV with labeling plane is shown in green, the light red boxes show the BOLD-weighted slices, and the blue shows the single-slice SBO acquisition location. The relative longitudinal magnetization (Mz/M0) over the course of one TR is shown on bottom for gray matter (GM, T1 = 1300 ms), white matter (WM, T1 = 800 ms), local blood (e.g. not accounting for blood flowing in from the labeling plane, T1 = 1660 ms), and cerebrospinal fluid (CSF, T1 = 4000 ms). The background-suppression pulses during the ASL labeling and post labeling delay periods reduce the static tissue signal to ∼1% of its initial value. A delay is allotted between the ASL and BOLD acquisitions and again between BOLD and SBO acquisitions to allow for signal recovery.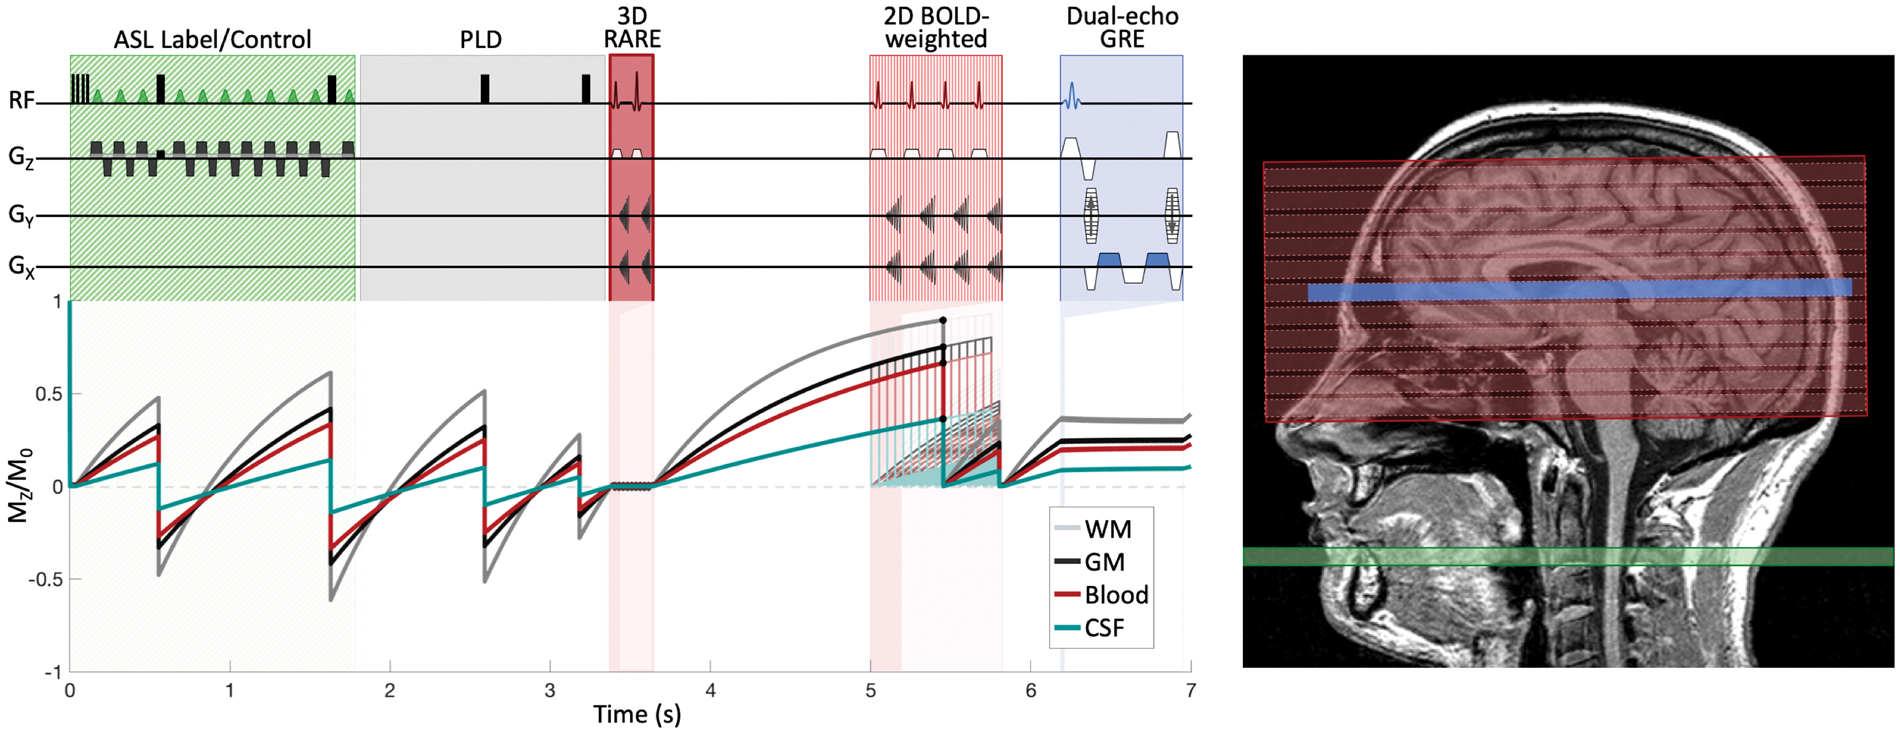
ASL and BOLD data were acquired with full-brain spatial coverage, albeit with 3D and 2D readouts, respectively. The pCASL labeling plane was positioned based on the time-of-flight acquisition at a location where the internal carotid and vertebral arteries were relatively straight and parallel to B0. The dual-echo GRE data were acquired in the middle of the straightest portion of the SSS. Though the dual-echo GRE acquisition is single-slice, the measured data represent the brain's global average Y v .
Acquisition parameters for each component of the OxBOLD sequence are as follows – pCASL: FOV = 240 × 240 × 96 mm3, 3D, single-shot, variable-density, spiral-out trajectory readout with duration = 265 ms, TE = 15.9 ms, reconstruction matrix = 64 × 64×16, unbalanced labeling with label duration = 1.8 s, post labeling delay (PLD)=1.5 s, and background suppression achieved with four successive pulses to reduce the background signal to 1% of its initial value as described in Maleki et al. 27 BOLD-weighted acquisition with: FOV = 240 × 240 mm2, slice thickness = 6 mm, 16 slices, 2D, single-shot, spiral-out trajectory readout with reconstruction matrix = 64 × 64, and TE = 29 ms. Single-slice multi-echo GRE data were acquired near the straightest portion of the SSS with: FOV = 208 × 208 mm2, slice thickness = 5 mm, acquisition matrix = 208 × 52, keyhole 28 reconstruction using fully-phase encoded reference scan obtained at the start of the acquisition yielding image matrix = 208 × 208, TR/TE/ΔTE=15/3.78/3.52 ms, and flip angle = 15°. Overall sequence TR=7 s, corresponding to one ASL tag-control pair every 14 s.
Gas manipulations
Gases were delivered and monitored via the RespirAct Gas Control System, which is capable of independently targeting PETO2 and PETCO2. 29 Subjects were connected to the system throughout the imaging experiment, breathing normoxic/normocapnic air during the localizers, T1-MPRAGE, and baseline and finger tapping OxBOLD acquisitions. HO was prescribed as ΔPETO2 = 230 mmHg, corresponding to FiO2 ≈ 50%, and HC as ΔPETCO2 = 8 mmHg. The transition between stimulus states was a step for HO and a 30 s ramp for HC. In all cases, the subject was given time to adjust to the stimulus (∼1 min) prior to the start of image acquisition.
Motor stimulus
To make efficient use of the scan session, motor stimulus data were collected between the HO and HC stimulus experiments. A block-design, bilateral finger tapping task was performed while the subjects breathed normocapnic/normoxic air. For 70 s blocks (equivalent to 10 TRs), subjects were instructed to rest, then tap each finger to their thumb serially, then rest, then tap. Subjects verbally confirmed their participation at the end of the scan.
Data processing and analysis
Data preprocessing and analysis were carried out using SPM (version 12, Wellcome Trust Center for Neuroimaging, University College London, UK) and custom scripts in Matlab (Mathworks, MA).
The T1 anatomical images were segmented to obtain a GM probability map. Subsequently, it was coregistered to the first BOLD image in the baseline series and the transformation matrix was applied to the probability map. The coregistered GM probability map was then resliced to the resolution of the BOLD images and a GM binary mask was obtained by thresholding the probability map using a threshold of 0.3.
BOLD processing
BOLD images from all series (baseline, HO, finger tapping and HC) were realigned to the first image in the baseline series and smoothed with a Gaussian filter of 6 mm full-width-at-half-maximum (FWHM).
Task activation analysis
The smoothed images from the finger tapping series were entered into a general linear model (GLM) with two conditions (rest and finger tapping). A regressor was included to model the ASL effect (i.e. the effect of the BOLD image being acquired after ASL control or label acquisitions). A high-pass filter was applied with a cutoff value of 512 s and serial correlations were accounted for using an autoregressive AR(1) model. Activation maps generated by the finger tapping task were assessed with a contrast comparing finger tapping to the rest condition. Obtained activation maps were thresholded by uncorrected p < 0.005 (T>2.72).
Gas stimuli analysis
The smoothed images from the baseline, HO, and HC series were entered into a GLM with three conditions. The model included a regressor to account for the ASL effect and an additional regressor to model the signal linear drift, necessary due to the relatively long duration of the gas stimulus acquisitions. A high-pass filter was applied with a cutoff value of 4096 s and serial correlations were accounted for using an autoregressive AR(1) model. The maps of regression coefficients (beta images) were used to compute the BOLD signal at baseline (BOLD0) and the signal changes induced by HO (ΔBOLDHO) and HC (ΔBOLDHC).
ASL processing
ASL images (both label and control) from all series were realigned to the first ASL image in the baseline series. Label and control images were pair-wise subtracted to generate perfusion-weighted images and smoothed using a Gaussian filter (FWHM=6 mm).
Task activation analysis
Perfusion-weighted images from the finger tapping series were entered into a similar GLM as used for BOLD analysis, excluding the ASL regressor and the autoregressive AR(1) model. Perfusion activation maps were obtained contrasting the finger tapping and rest conditions and thresholded by uncorrected p < 0.005 (T>2.92).
Gas stimuli analysis
Perfusion-weighted images from the other three series (baseline, HO, and HC) were entered into a GLM, as previously described for BOLD, excluding the ASL regressor and the autoregressive model. The obtained beta images were used to compute the perfusion signal at baseline, during HO and HC, and the perfusion changes induced by HO and HC stimuli, which were used to calculate M. In addition, perfusion was quantified in physiologic units as described by Alsop et al. 30 with labeling efficiency of 60% due to the background-suppression scheme. Assumed values of T1,blood were 1660 ms for normoxic conditions 31 and 1500 ms for HO with FiO2 ≈ 50%.16,32,33
Whole-brain Yv
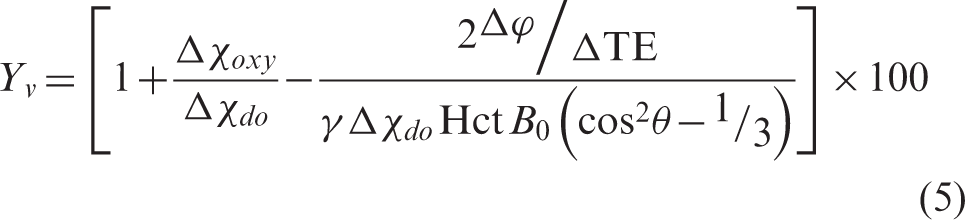
To compute Y v , the tilt angle of the SSS with respect to B0 was measured from the time-of-flight series. Then, the phase difference between the two images separated by ΔTE was computed, and the bias field in the posterior aspect of the brain was fit to a second-order polynomial and corrected as described previously. 34 Regions of interest (ROIs) in the SSS and extravascular reference tissue were manually defined, and the phase difference between the vein and background tissue was used to compute whole-brain Y v from equation (5).
Calculation of [dHb] from PETO2 data
To compare results to the HO calibrated fMRI model proposed by Chiarelli et al., 10 PETO2 data were converted to [dHb] v /[dHb]v0 as described previously. Briefly, the arterial oxygen tension, inferred from PETO2, was converted to arterial oxygen saturation. 35 Then, the content of oxygen in arterial (CaO2) and venous (CvO2) blood was computed, assuming a constant OEF of 30%. CvO2 was converted into Y v for both the baseline and HO conditions. The ratio of (1−Y v ) during HO to that at rest was ultimately used as the input ([dHb] v /[dHb]v0) to the PETO2-based calibration model. Calculated [dHb] v /[dHb]v0 from PETO2 were also compared to the ratio of (1−Y v )HO/(1−Y v )0 derived from MR-acquired data.
Quantification of M maps
In all cases, α = 0.1836 and β = 1.537 were assumed, and four M maps were computed for each subject based on the following calibration approaches:
HO Y
v
-based: direct measurement of whole-brain Y
v
using baseline and HO stimulus data, with equation (6). HO PETO2-based: model proposed by Chiarelli et al.
10
using baseline and HO stimulus data with [dHb]v derived from PETO2 data, using equation (4). HC Y
v
-based: direct measurement of whole-brain Y
v
using baseline and HC stimulus data, with equation (6). HC isometabolism: model proposed by Davis et al.,
3
using baseline and HC stimulus data and assuming isometabolism, following equation (3).
In all cases, the CBF/CBF0 ratio was replaced by the ratio of perfusion-weighted signals. A correction factor was applied to the perfusion signal ratio to account for the shortened T1 of blood during HO.
38
Specifically, the relative perfusion ratio between HO and normoxia conditions was multiplied by 1.15 to account for the change in T1.
The mean value of M in GM was computed in a mask obtained from the intersection of BOLD images thresholded to a relative intensity of >0.8 (to exclude areas of BOLD signal loss) and the GM mask computed from segmentation of the T1-MPRAGE. M values were averaged within this mask, excluding outliers, defined a priori. For HC calibration, a voxel M value was considered an outlier if: the perfusion change due to HC was negative or >200%, the BOLD signal change was negative or >15%, or the M value was negative or >40%. For the other two cases, outliers were defined as voxels with perfusion changes >200%, with the other conditions remaining the same.
Relative CMRO2 response
Relative CMRO2 (rCMRO2) maps during finger tapping were computed on a voxel-wise basis as
Prior to obtaining the mean, voxels were discarded if the relative CMRO2 was reduced (e.g. rCMRO2 < 1) or more than doubled (e.g. rCMRO2 > 2). Average rCMRO2 in the motor cortex (MC) was computed by averaging values in left and right MC ROIs that were defined by the intersection of areas of activation in the BOLD and ASL finger tapping activation maps.
Statistical analysis
Due to the somewhat limited sample size, a normal distribution cannot be assumed, and therefore non-parametric tests were used for statistical analysis. Wilcoxon signed-rank tests were used to compare the gas stimulus response to baseline for changes in PETO2, PETCO2, and Y v (or [dHb]v). Differences between M values and relative CMRO2 changes obtained from the four calibration models (HO Y v -based, HO PETO2-based, HC Y v -based, and HC isometabolism calibration) were evaluated by means of the Friedman test (non-parametric corollary of the repeated measures ANOVA). If the Friedman test was significant, post hoc paired Wilcoxon signed-rank tests were used to test for individual differences. For all tests, p < 0.05 was considered significant. Agreement between the mean GM M and relative CMRO2 changes derived from the HO Y v -based, HO PETO2-based, HC Y v -based, and HC isometabolism calibration models was assessed via Bland–Altman analyses.
Results
Incomplete data were obtained for three subjects: one withdrew due to discomfort during HC, in one subject, the RespirAct system failed to target the desired PETO2 and PETCO2 values, and for the third subject, the ASL labeling plane was incorrectly placed. The remaining 10 subjects are included in subsequent analyses.
Gas manipulations
Figure 2 shows targeted and measured PETO2 and PETCO2, monitored by the RespirAct over the course of the OxBOLD scans in a representative subject. Across all subjects, the mean ( ± standard deviation) of baseline PETO2 was 151 ± 6 mmHg and PETCO2 was 39 ± 5 mmHg. During the HO stimulus period, PETO2 increased to 352 ± 15 mmHg (p < 0.005), with no change in PETCO2 (=39 ± 5 mmHg, p = 0.77). During the HC stimulus, PETCO2 increased to 47 ± 6 mmHg (p < 0.005), with no change in PETO2 (=154 ± 7 mmHg, p = 0.13).
Targeted (line) and measured (dots) end-tidal oxygen (top) and carbon dioxide (bottom) data in a representative subject. OxBOLD data were acquired during baseline (normoxic/normocapnic air), hyperoxia (+230 mmHg from baseline), and hypercapnia (+8 mmHg from baseline) periods. The finger tapping task was performed while breathing normocapnic/normoxic air between the hyperoxia and hypercapnia periods to make efficient use of scan time. The finger tapping task was 70 s off, then 70 s on, repeated twice. In most subjects, the nominal targeted baseline PETO2 was lower than the measured PETO2, as is shown here.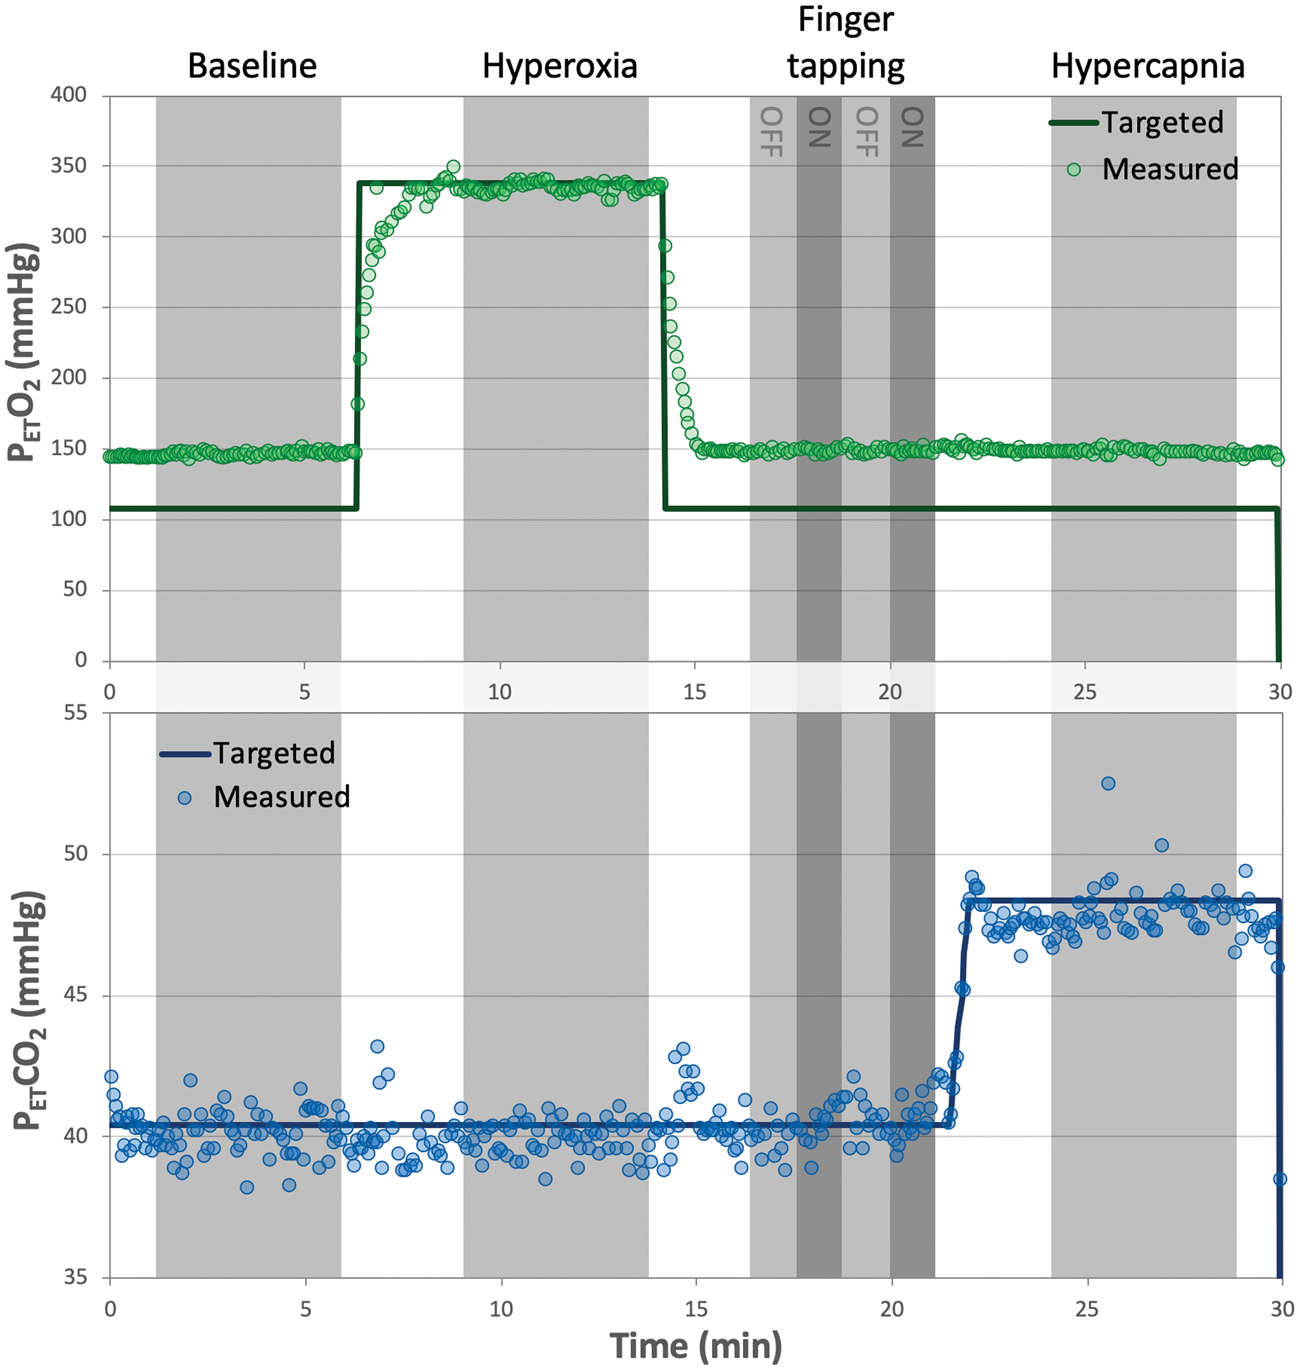
BOLD, ASL, and Yv changes during gas stimuli
Figure 3 shows the baseline and gas stimulus images for BOLD, perfusion, and Y
v
. BOLD and perfusion data are shown in a representative slice, though both acquisitions have full-brain coverage. Table 1 summarizes the response to the gas stimuli, quantified M for the various models, and relative CMRO2 responses to the finger tapping task. CBF was not significantly different between baseline and HO (p = 0.28), but as expected, a large increase in blood flow occurred during HC (p < 0.005). More modest ΔBOLD signal changes were observed between baseline and HO than between baseline and HC (p < 0.005).
Baseline and gas stimulus images for ASL (signal intensity, SI, difference from control and label acquisitions), ΔBOLD, and susceptometry-based oximetry (SBO). Left panel shows anatomic images for reference. Perfusion-weighted signal was relatively unchanged in response to hyperoxia but increased substantially during hypercapnia. The BOLD response was similarly more prominent in response to hypercapnia, though both hyperoxia and hypercapnia stimuli elicited a positive BOLD response. The phase data were converted to venous oxygen saturation through the SBO model. The phase contrast between the superior sagittal sinus (indicated by the arrow) decreases during hyperoxia and hypercapnia, corresponding to an increase in venous oxygen saturation. Mean ± standard deviation of measurements during baseline and gas stimulus periods, calculated calibration constants, and relative CMRO2 responses to finger tapping. PETO2 and PETCO2: the partial pressure of end-tidal oxygen and carbon dioxide, respectively; CBF: cerebral blood flow; Y
v
: venous oxygen saturation; M: calibration constant; MC: motor cortex; rCMRO2: relative cerebral metabolic rate of oxygen in response to finger tapping. p < 0.005 for difference between stimulus period and baseline.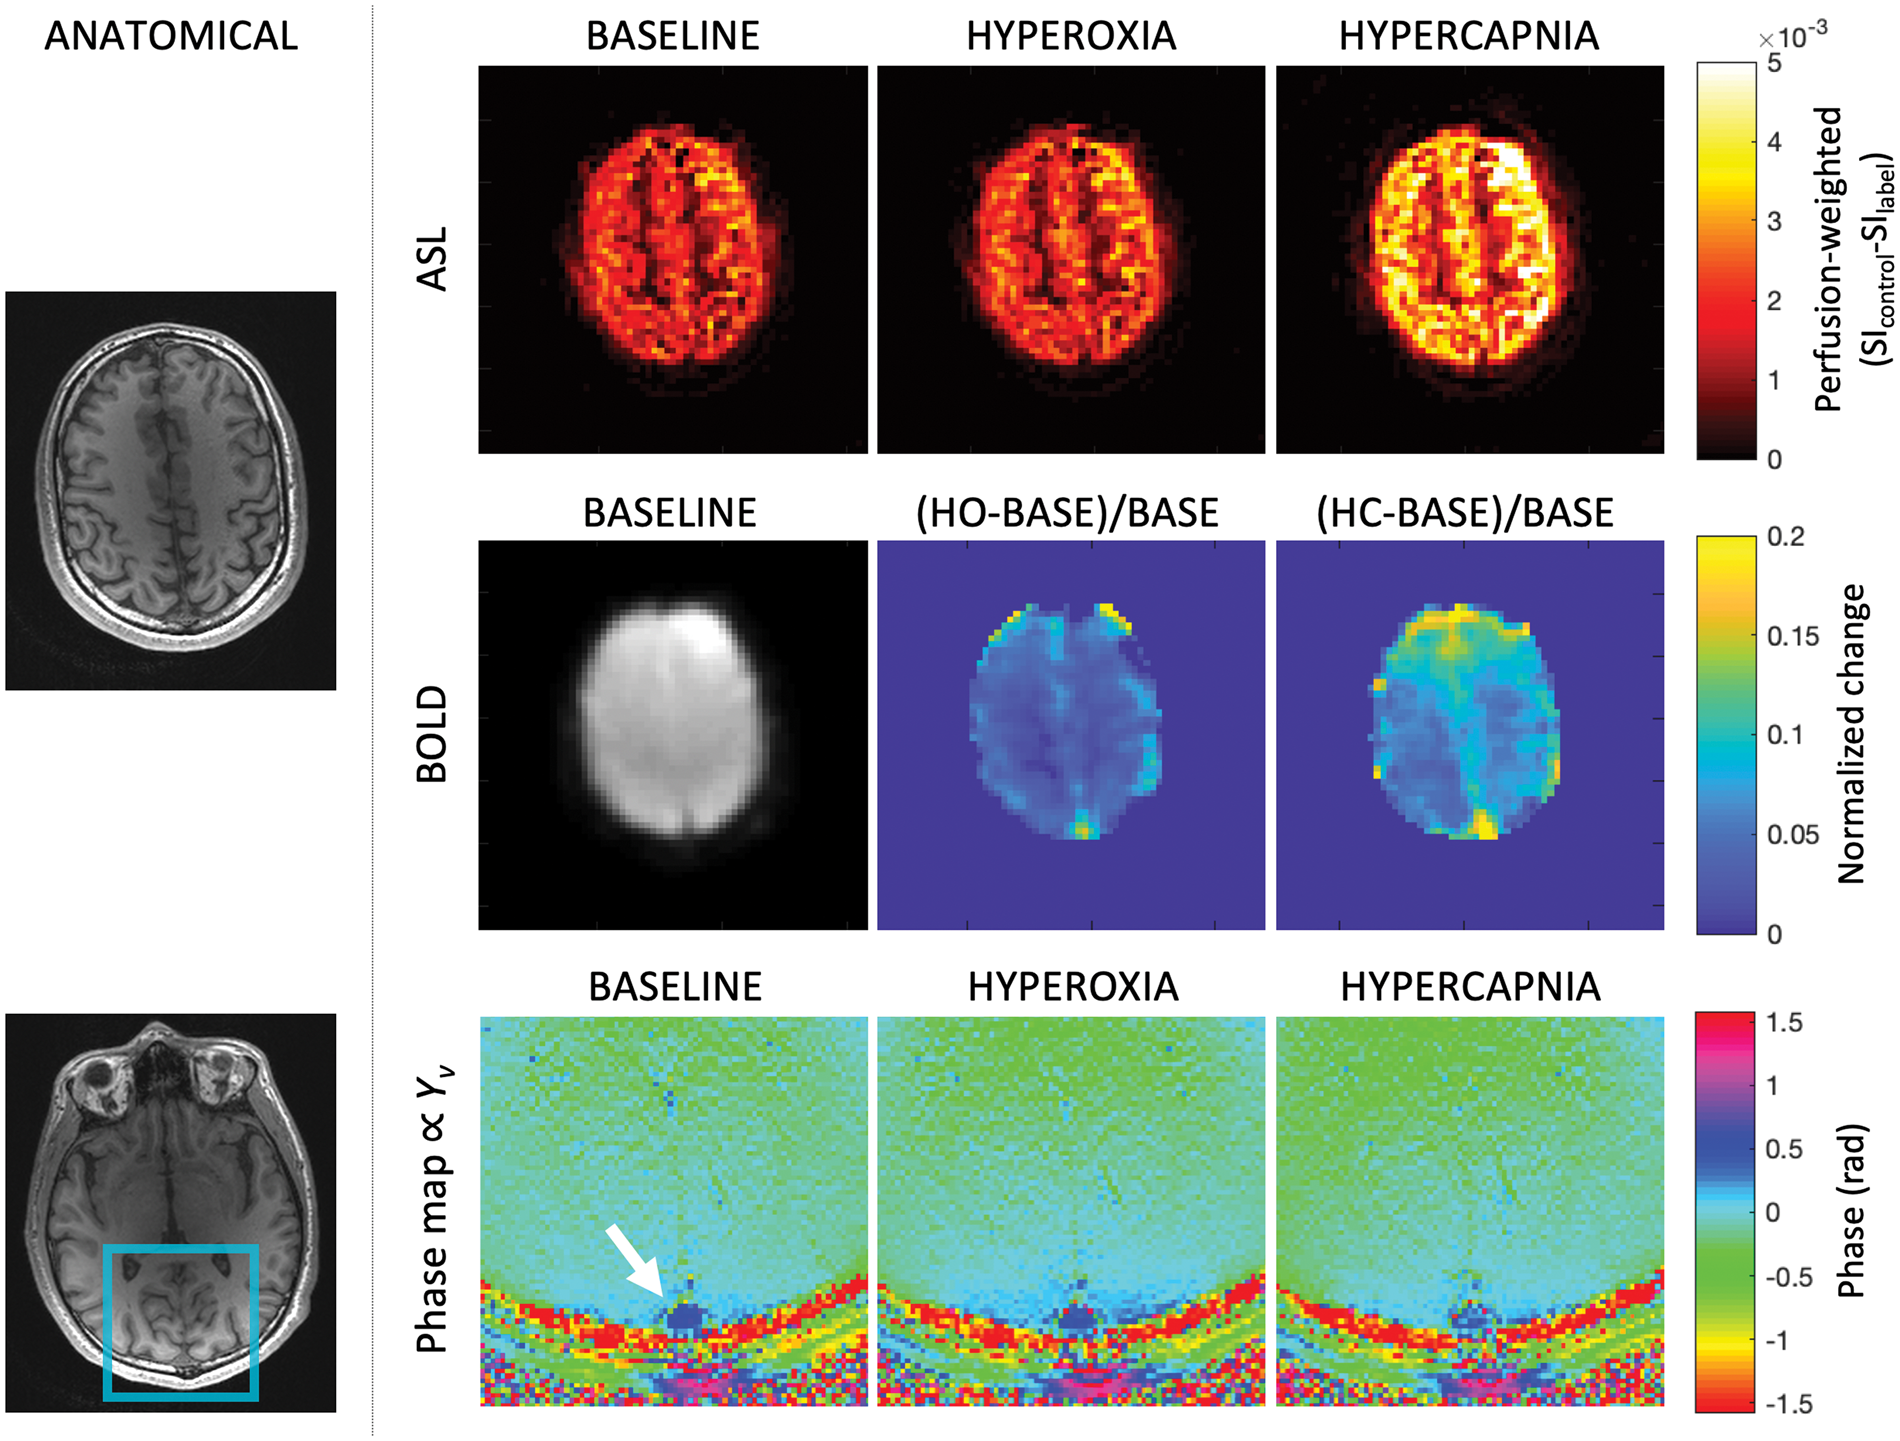
As measured by SBO, Y v in the SSS at baseline was 61 ± 8% HbO2, which increased to 67 ± 7% HbO2 during HO (p < 0.005), and 75 ± 10% HbO2 during HC (p < 0.005). The mean tilt angle of the SSS relative to B0 was 15 ± 10°. For input into the HO PETO2-based calibration model, measured PETO2 was converted to relative [dHb]. Using this approach, [dHb]v/[dHb]v0 decreased to 0.90 ± 0.01 during HO relative to the baseline condition. As a direct comparison, the ratio of hyperoxic to baseline (1−Y v )/(1−Y v )0 derived from SBO was 0.85 ± 0.10. The difference between PETO2-derived [dHb]v changes and the SBO-derived (1−Y v ) response was not significant (p = 0.32).
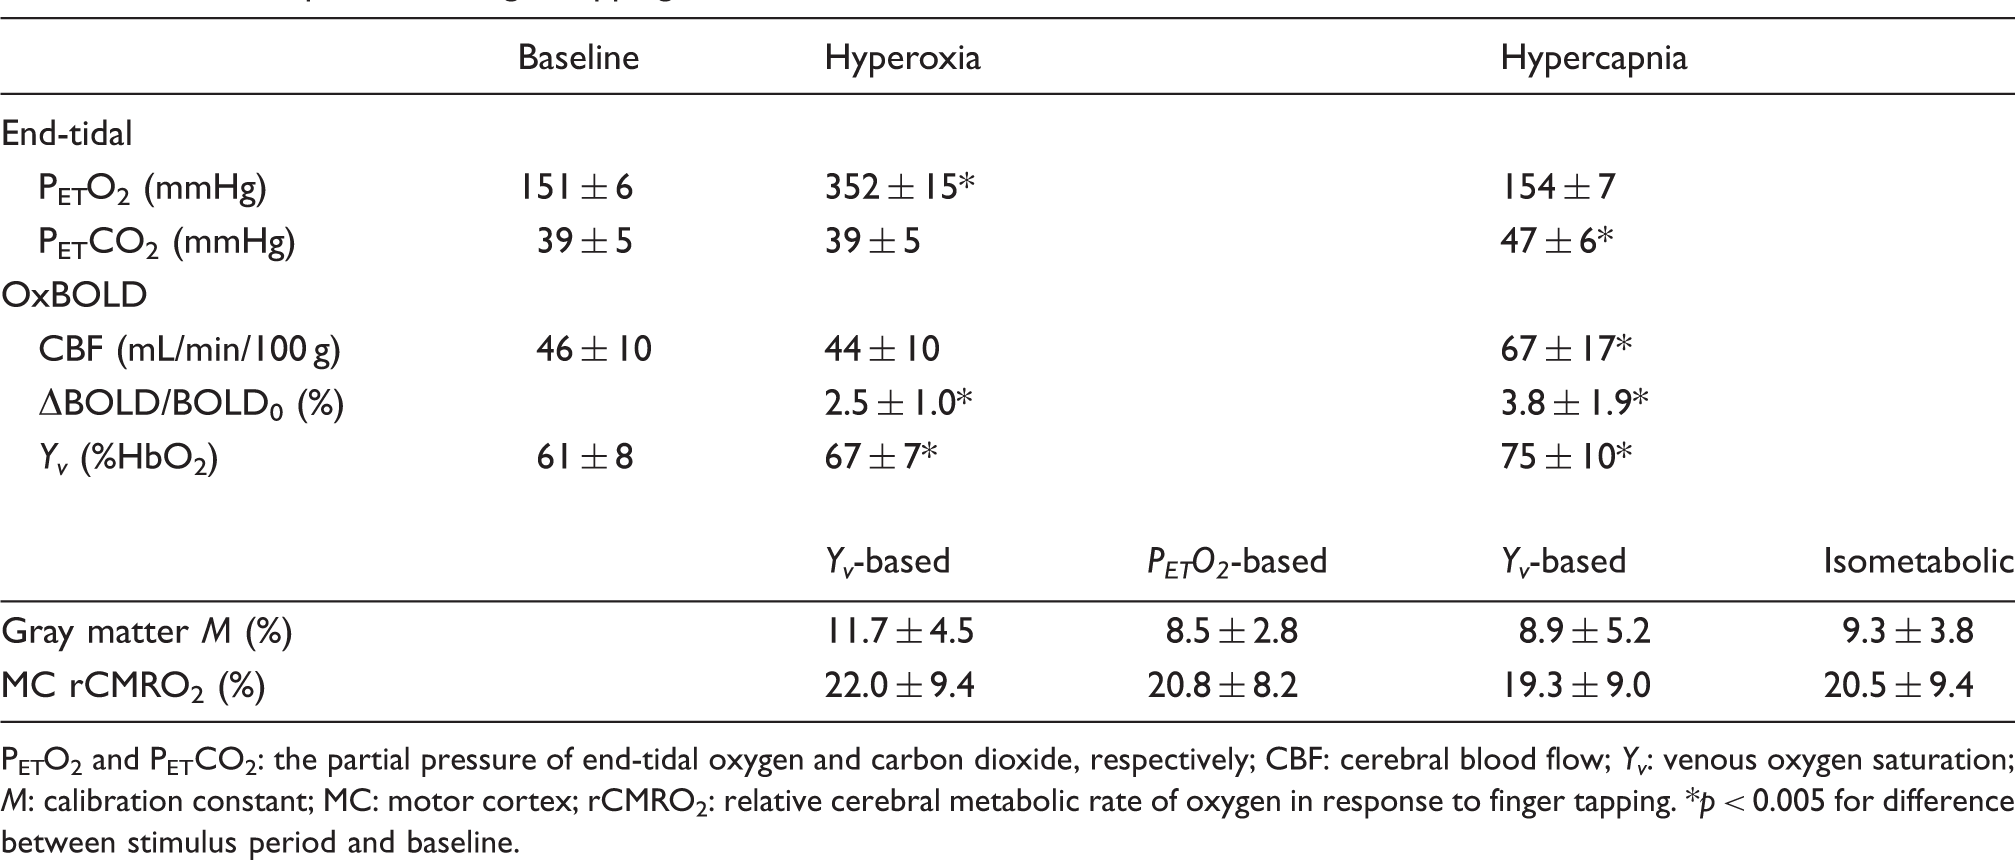
M maps
Examples of M maps derived from the proposed Y
v
-based model from HO and HC stimulus data are compared to M maps based on the standard calibration models in Figure 4. M maps demonstrate expected gray-white matter anatomic contrast for each of the models. The percentage of voxels after outlier exclusion did not differ between calibration methods. Mean % of GM voxels included in the final analysis was 71 ± 18% (HO Y
v
-based), 74 ± 15% (HC Y
v
-based), 74 ± 18% (HC isometabolism), 72 ± 17% (HO PETO2-based), p = 0.43. Mean M in GM was 11.7 ± 4.5% (HO Y
v
-based), 8.9 ± 5.2% (HC Y
v
-based), 9.3 ± 3.8% (HC isometabolism), and 8.5 ± 2.8% (HO PETO2-based). The difference between the average M quantified using the various calibration methods was not significant (p = 0.56). Results of the Bland–Altman analysis are shown in Figure 5. Comparing each of the methods, the mean bias of M was no greater than 3.2 (in M, %) with limits of agreement encompassing 0 in all cases.
M maps showing axial acquisition, and sagittal and coronal reformats in a representative subject. M maps were obtained from hyperoxia (HO) and hypercapnia (HC) gas stimulus data using the proposed Y
v
-based model and conventional models. Maps demonstrate relative mutual agreement in this representative subject. Bland–Altman analysis plots assessing the agreement of M (top series) and rCMRO2 (bottom series) between the various calibration models. Overall the mean bias was near zero, and the calculated limits of agreement (±1.96×standard deviation) encompassed zero.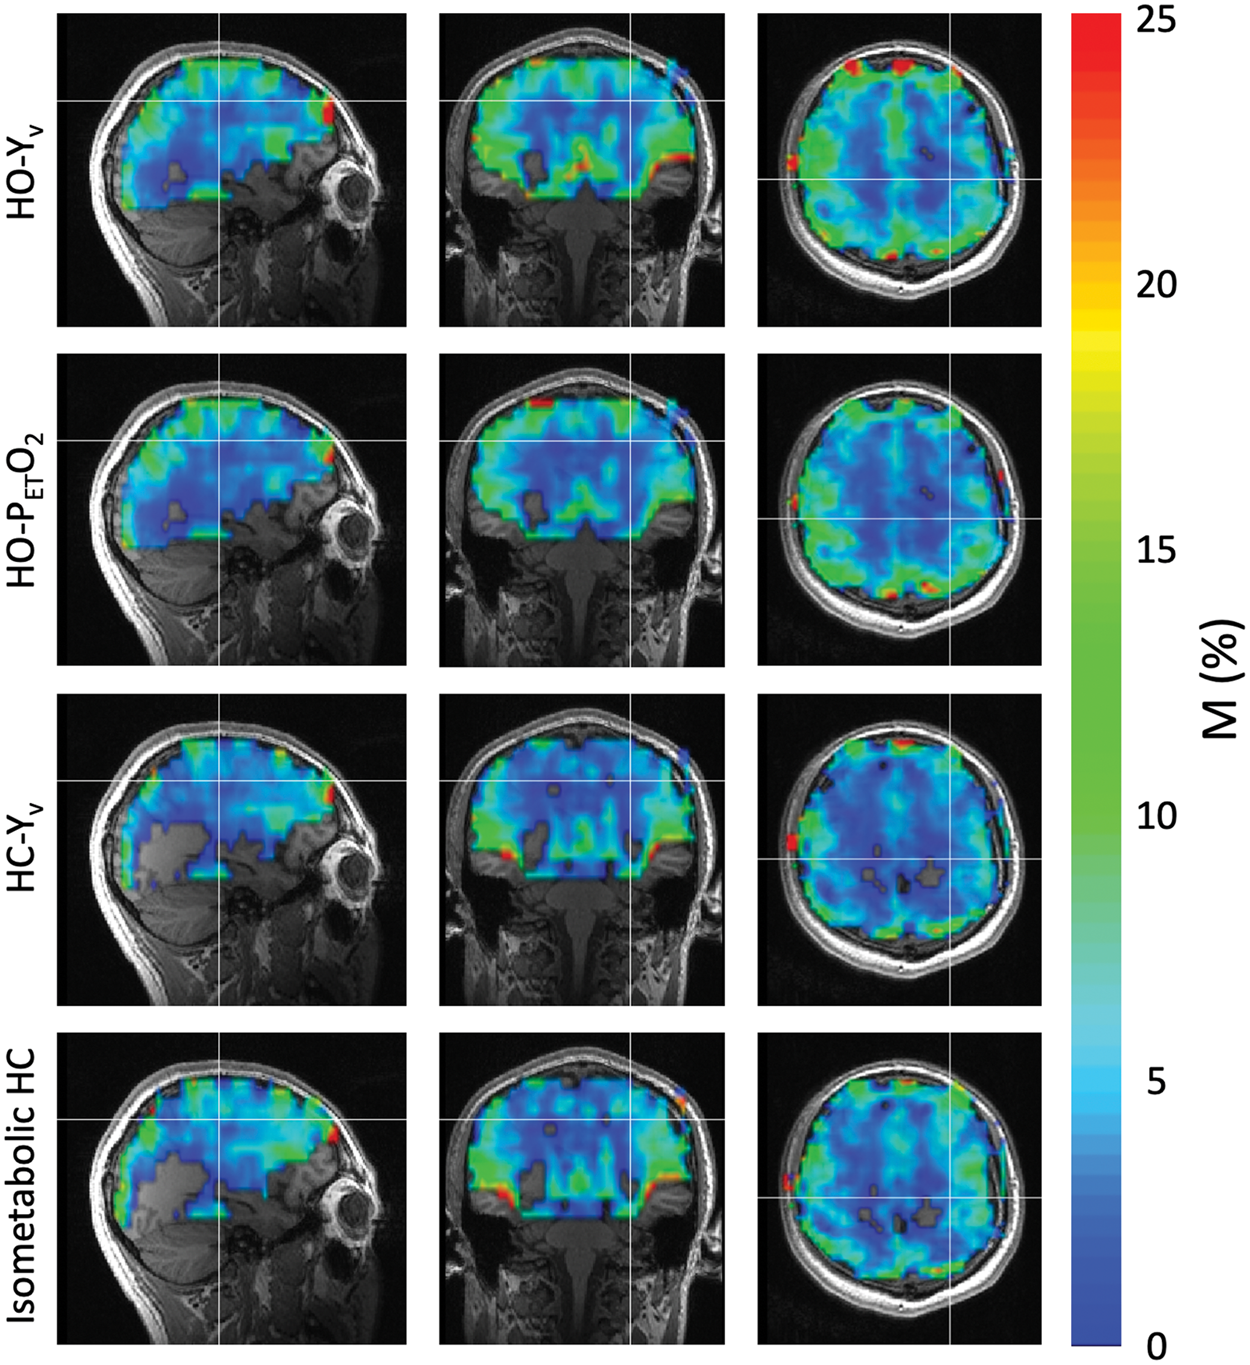
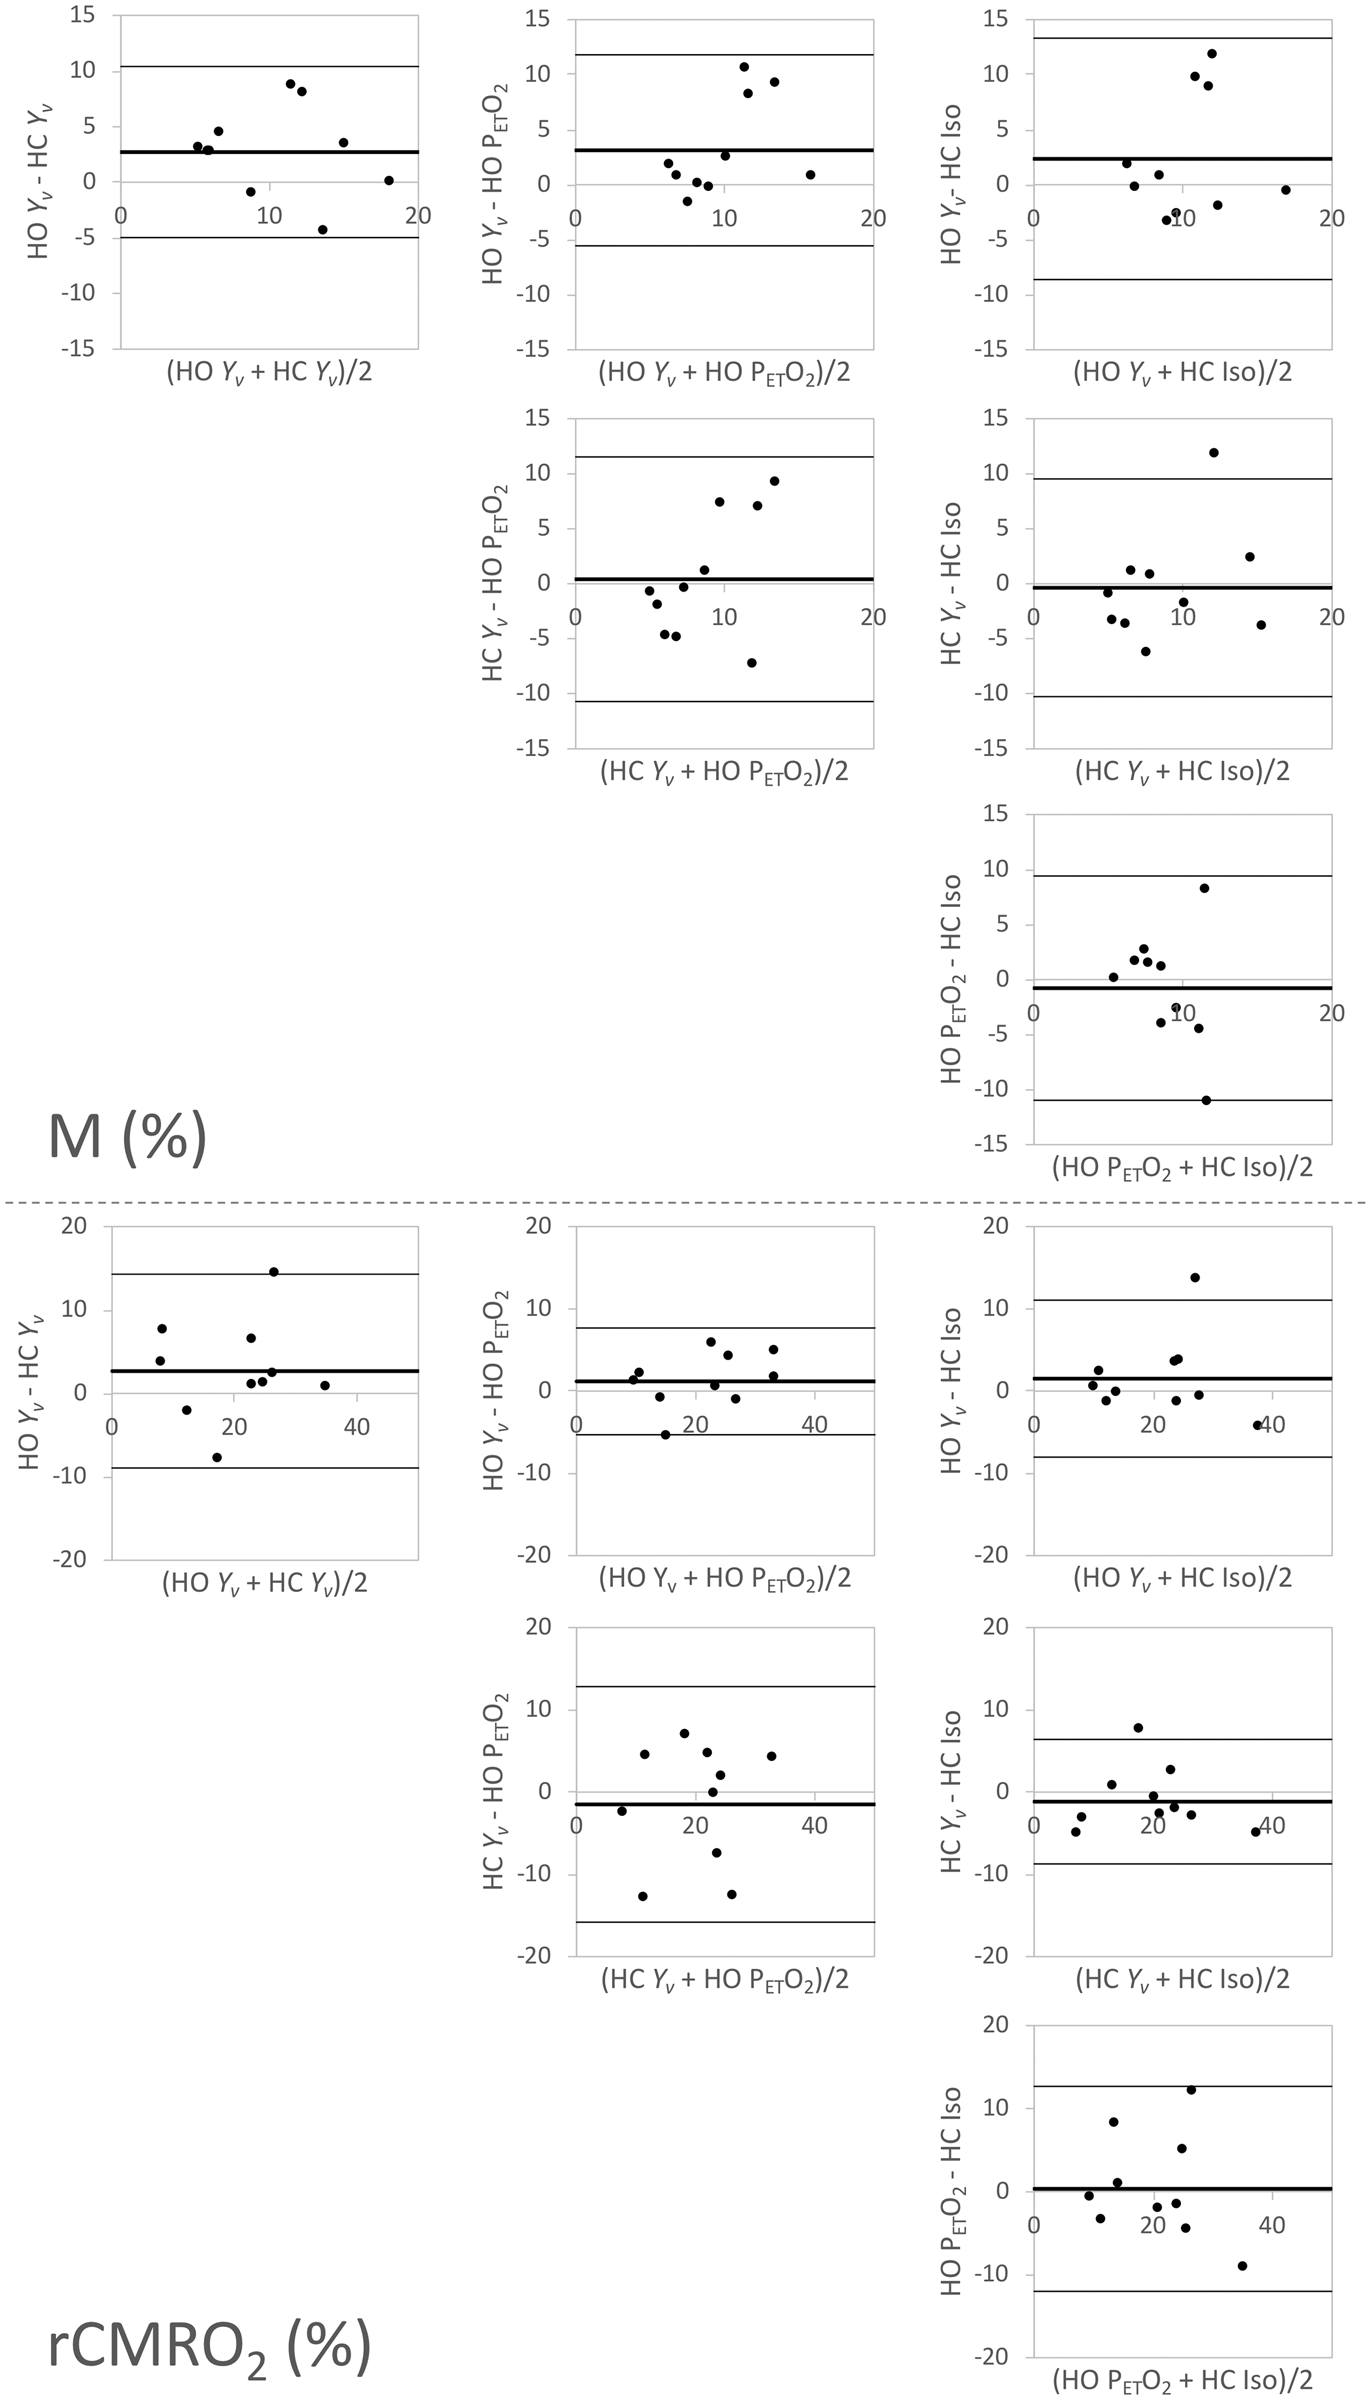
Task-evoked CMRO2 changes
The finger tapping task activated regions in the motor cortex in both the ASL and BOLD (and thus rCMRO2) images. Across all subjects, CBF increased by 30.7 ± 9.4% in the activated regions, whereas the BOLD-weighted signal increased by 0.9 ± 0.2%. Based on voxel-wise M maps from each calibration model, CMRO2 in the motor cortex increased by 22.0 ± 9.4% (HO Y
v
-based model), 19.3 ± 9.0% (HC Y
v
-based model), 20.5 ± 9.4% (HC isometabolism model), and 20.8 ± 8.2% (HO PETO2-based model). The difference of rCMRO2 among the four models was not significant (p = 0.25). Relative CMRO2 changes in a representative subject are shown in Figure 6, demonstrating both localization and magnitude of the CMRO2 response. Bland–Altman results are shown in Figure 5. As in M, the mean bias of rCMRO2 was close to 0 for all comparisons.
Relative CMRO2 change in response to a finger tapping task in a representative subject. Focal CMRO2 increases are observed in the motor cortex. While these data are derived from the same task-based BOLD and ASL data, the M maps used to convert the relative BOLD and CBF changes differ.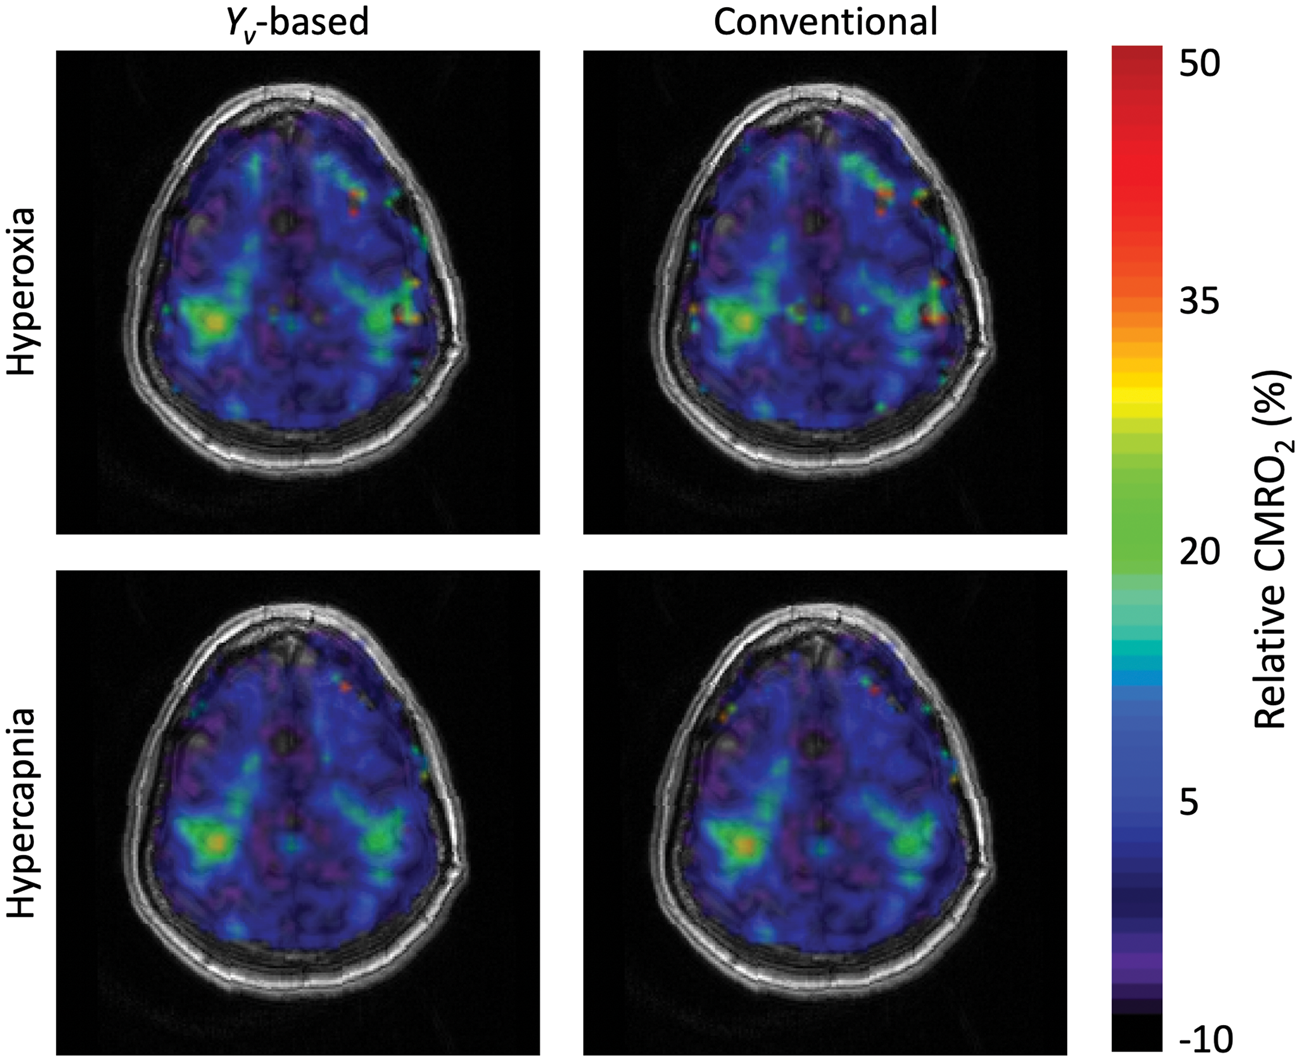
Discussion
This work demonstrates the utility of OxBOLD combined with the Y v -based model for calibrated fMRI. Using the Y v -based model, average M values and maps were similar to those derived from accepted models for both HO and HC stimuli. The proposed method directly measures whole-brain Y v , rather than relying on conversion of end-tidal O2, and does not mandate an assumption on baseline OEF or of isometabolism as is required for the models described by Chiarelli et al. 10 and Davis et al. 3 The mean M values in GM were in mutual agreement over the four calibration experiments. Derived from identical task response data, rCMRO2 changes in the motor cortex calculated based on Y v -based M maps agree well with the relative response obtained from existing models' M maps as well.
The critical assumption made for Y v -based calibration is that gas stimulus-induced changes in Y v across the brain are spatially uniform. Note that this does not require that baseline OEF is constant (though there is evidence from MRI 39 and PET 40 studies that OEF is quite uniform over the brain). As long as OEF changes are spatially uniform, the model would apply irrespective of metabolic changes (or lack thereof). Thus, in addition to the calibration stimuli explored in this study, Y v -based calibration could theoretically be applied in the context of other global vasoactive stimuli that are not necessarily isometabolic. One could, therefore, explore alternative stimuli such as breath-hold, 41 hypoxia, 42 caffeine, 43 or possibly anesthesia. 44 This is unlike the HO PETO2-based and HC isometabolism model, where an isometabolic response to the calibration stimulus is inherently assumed. Recently, there have been conflicting reports regarding the metabolic response to these stimulus gases, where some report isometabolism to HC45,46 and HO, 47 and others have found CMRO2 decreases in response to even mild HO or HC. 15
In consideration of the inherent assumption underlying the Y v -based model, studies investigating BOLD and CBF-based cerebrovascular reactivity (CVR) indicate non-uniform CVR throughout the cortex in response to HC, with smaller changes in WM compared to GM. 48 If HC is indeed isometabolic, then GM/WM CVR differences would imply that WM and GM OEF changes are also not spatially uniform, thus contradicting the necessary assumption for Yv-based calibration. However, this may not impart a measurable error in the data. Assuming that conservatively, CBF in WM is half that of GM,49,50 and that the volume of WM is again about half that of GM, 51 then blood flow from GM contributes to 80% of the total blood flow in the SSS under resting conditions. CBF-based CVR studies have reported a 1.9%/mmHg CBF change in GM compared to 1.1%/mmHg change in WM. 48 During a + 8 mmHg HC challenge, flow will therefore increase in both GM and, to a somewhat lesser extent, WM. If we assume that baseline OEF is uniformly 30.0% and HC is isometabolic, the CVR-based flow changes imply OEF in GM is reduced to 26.0%, whereas OEF in WM is reduced to 27.6% during HC (calculated via Fick's principle). Given the GM/WM blood flow contribution to blood in the SSS (which would favor GM slightly more during HC), the measured OEF in the SSS would be 26.3%. As the focus for this calibrated fMRI study is on GM, the WM/GM CVR differences would thus contribute an imperceptibly small offset in the SBO data (Δϕ < 0.005 radians, (equation (5)).
Prior reports imply that HO-induced flow changes are small and generally spatially uniform, 16 thus suggesting that the assumption inherent to the Y v -based model would be valid in the context of a HO stimulus. In fact, more stringent assumptions are placed on the PETO2-based model 10 : OEF is assumed to be invariant to HO; and [dHb]v changes are assumed as constant throughout the entire body since the expired air is equilibrated with the systemic circulation. It also should be noted that changes in [dHb]v in response to HC cannot be inferred from PETO2.
Comparing HO calibration models, we note that in the Y v -based model, we did not include the CBF correction term that is employed in the PETO2-based model proposed by Chiarelli et al. 10 By including the CBF correction term, the model does not reduce to the unmodified calibrated fMRI equation (equation (2)) proposed by Davis et al. 3 unless isometabolism is specifically assumed or CBF changes do not occur. As with HC, there is some debate about the physiologic response to HO, with some reports showing no change in CMRO2, 52 while other work suggests depression of CMRO2. 15 Furthermore, accurate quantification of CBF changes in response to HO requires knowledge of arterial blood T1, which shortens due to the presence of plasma-dissolved oxygen. 38
Despite the differences in the assumptions and calibration equations, the mean M and relative CMRO2 response were in mutual agreement between the methods. There is also reasonable agreement between the mean M reported herein and values reported previously. As described in the introduction, M represents the maximum BOLD signal change with full washout of deoxyhemoglobin, and is related to vessel geometry and size, baseline OEF, field strength, and TE. As summarized in Gauthier et al. 53 and Lajoie, et al., 54 the mean M from prior reports, here corrected for the OxBOLD TE=29 ms, ranges from 5.1% 55 to 11.7%. 56 Thus, the mean M reported herein is on the higher end, especially for HO Y v -based calibration data, but within the range of previous reports. The relative CMRO2 response of ∼19–22% to finger tapping is similar to findings by Tak et al., 57 who reported an 18% CMRO2 increase in the motor cortex. Our present results are, however, somewhat higher than a prior report from our group, 26 which found rCMRO2 ∼13%. The discrepancy herein could be attributed to the removal of outliers, where in the present study only voxels with a positive CMRO2 response were ultimately included in the motor cortex ROI. Another possible reason for discrepancy between our work and prior studies is the chosen values for exponents α and β. As detailed by Griffeth and Buxton, 58 the accuracy and precision of M and rCMRO2 results depend on appropriate selection of these parameters. More recently, Shu et al. 59 proposed mapping β, the factor relating intra- and extra-vascular BOLD signal contributions, rather using a single value across the brain. However, specific impacts of varying the constants in the calibration equations were not evaluated herein.
The OxBOLD sequence follows the dual-acquisition approach for ASL and BOLD, which provides improved temporal signal-to-noise ratio of CBF due to optimized background suppression, while maintaining BOLD temporal signal-to-noise ratio. 26 Although the kx–ky readout trajectory and spatial coverage are identical, the difference in encoding strategy (3D for ASL versus 2D for BOLD) leads to distinct distortion and blurring artifacts between the two sets of images. The distortions are most pronounced at air-tissue interfaces, such as the nasal sinuses and auditory canals, but notably the motor cortex is unimpacted. To generate M maps and compute rCMRO2, the BOLD and ASL data are combined on a voxel-wise basis. Therefore, these distortions may impact the overall accuracy of the results, but would influence all calibration methods similarly.
The Y v -based model could theoretically be applied to independently acquired BOLD, ASL, and Y v data, as preliminarily explored for HO calibration by Driver et al. 11 However, sequential acquisition would be less time-efficient, and may be prone to physiologic drift over the course of the stimulus. T2-based oximetry may alternatively be used to quantify whole-brain Y v in the SSS15,19 or other veins such as the straight sinus. 60 However, if included in an interleaved sequence, the overall TR would be prolonged to accommodate multiple T2-preparation and readout periods. As veins become closer to perpendicular to B0, SBO cannot be used to quantify Y v since the induced field outside the vessel, which is ignored in equation (5), becomes increasingly non-uniform. However, simulations show only modest error is introduced for vessels that deviate <30° from B0, 61 and the tilt angle of SSS is generally well within this bound.
Ideally, global (whole-brain or whole-body) measures of [dHb]v would be replaced by voxel-wise maps of OEF, which would additionally permit quantification of both resting and stimulus-evoked CMRO2 in physiologic units. In a method initially proposed by Bulte et al., 6 a hypercapnic stimulus was used to determine M, and subsequently combined with BOLD and ASL signal changes in response to HO to quantify baseline OEF on a voxel-wise basis. Alternatively, Gauthier et al. 5 proposed use of a generalized calibration model 13 in which fractional changes in BOLD, CBF, and arterial oxygen content are used to estimate M as a function of baseline OEF. By incorporating both HO and HC data, the voxel-wise solution for M and OEF is obtained as the intersection of the HO- and HC-derived M versus resting OEF curves. Furthermore, evaluating the response to carbogen (a hypercapnic/hyperoxic stimulus), the authors showed that the intersection of all three curves occurred coincidentally. As is the case for M mapping, use of the Y v -based model in the context of dual-gas calibration may help to alleviate some inherent assumptions.
Other studies have investigated gas-free methods to calibrate the BOLD signal or otherwise quantify OEF at rest. Most of these methods relate the reversible component of the effective transverse relaxation rate (R2′) to local [dHb]. 62 For example, Blockley et al.63,64 investigated the use of a gas-free refocusing-based calibration in which R2- and R2′-sensitive imaging were used to determine a calibration constant related to M. Berman et al. 65 recently extended this gas-free calibration approach to additionally correct for the effect of variation in vessel size. Alternatively, by modeling the capillary network as randomly oriented cylinders, R2′ can be directly related to Y v by means of what is generally referred to as ‘quantitative BOLD’ (qBOLD). 39 Combining voxel-wise estimates of OEF from qBOLD with CBF maps from ASL permits quantification of local CMRO2 via Fick's principle. However, to date, qBOLD sequences are time prohibitive if whole-brain coverage is desired, 66 and thus cannot quantify changes in CMRO2 in response to a stimulus. Another approach to quantify CMRO2 focuses on the parenchymal susceptibility changes in response to a global stimulus, causing, for instance, vasoconstriction as achieved by caffeine administration or hyperventilation. In this manner, Zhang et al.67,68 obtained maps of CMRO2 using constituent susceptibilities (obtained from quantitative susceptibility mapping 69 ) and voxel-wise CBF. While this approach is potentially powerful, the small change in tissue susceptibility in response to a challenge (∼+0.005 ppm for caffeine) is difficult to precisely measure. Furthermore, a baseline and stimulus measurement are required to generate a CMRO2 map, thus, like qBOLD, the technique is limited to probing CMRO2 in the steady state.
The results reported herein show that Y v -based calibration can be applied in the context of either HO or HC stimuli. In the healthy subjects recruited for this study, HO was better tolerated than HC, and therefore HO may be preferred for future clinical adaptation of calibrated fMRI. Furthermore, there is widespread availability of oxygen in most hospital settings, whereas HC, requiring controlled delivery of CO2 mixed in room air, maybe more difficult to broadly disseminate. Translation of Y v -based calibration to clinical patient populations will require careful consideration of the critical assumption of uniform changes in Y v in response to the stimulus condition. This assumption would likely hold true for the study rCMRO2 in patients with degenerative brain disorders, but maybe less appropriate in the context of local perturbations of CBF (e.g. ischemic stroke).
Conclusions
MR-measured whole-brain Y v can be incorporated into calibrated fMRI models that relate BOLD, CBF, and CMRO2 changes in response to a stimulus. The Y v -based model can be equivalently applied to HO or HC gas stimuli, and it relaxes the underlying assumption of isometabolism in response to the gas stimulus as all of the input parameters are directly measured. Realization of the Y v -based model was achieved with the OxBOLD sequence, providing concurrent measurement of CBF, BOLD-weighted signal, and whole-brain Y v . Overall agreement was found between traditional calibration models and the Y v -based calibration both in terms of the calibration constant, M, and the relative CMRO2 response to finger tapping.
Footnotes
Funding
The author(s) disclosed receipt of the following financial support for the research, authorship, and/or publication of this article: This work was supported by the National Institutes of Health grants R21 EB022687, T32 EB020087, and P41 EB015893.
Acknowledgements
The authors wish to thank Kelly Sexton, Morgan Kelly and Kathleen Thomas for support with subject recruitment, and Norman Butler, Patricia O'Donnell, Doris Cain and Jacqui Meeks for their assistance with the MRI scans.
Declaration of conflicting interests
The author(s) declared no potential conflicts of interest with respect to the research, authorship, and/or publication of this article.
Authors' contributions
EKE, MAFS, AERS, ZBR, and FWW conceived and designed this study. EKE, MAFS, AERS, HL, MV, and ZBR contributed to the pulse sequence design, implementation, and reconstruction and analysis methods. EKE, MAFS, AERS, and HL collected and analyzed data. EKE, MAFS, AERS, HL, and FWW contributed to data interpretation. EKE and MAFS drafted the manuscript. AERS, HL, MV, ZBR, JAD, and FWW critically revised the manuscript. All authors approved the final version of the manuscript for publication.