
Abstract
Infarct growth from the early ischemic core to the total infarct lesion volume (LV) is often used as an outcome variable of treatment effects, but can be overestimated due to vasogenic edema. The purpose of this study was (1) to assess two components of early lesion growth by distinguishing between water uptake and true net infarct growth and (2) to investigate potential treatment effects on edema-corrected net lesion growth. Sixty-two M1-MCA-stroke patients with acute multimodal and follow-up CT (FCT) were included. Ischemic lesion growth was calculated by subtracting the initial CTP-derived ischemic core volume from the LV in the FCT. To determine edema-corrected net lesion growth, net water uptake of the ischemic lesion on FCT was quantified and subtracted from the volume of uncorrected lesion growth. The mean lesion growth without edema correction was 20.4 mL (95% CI: 8.2–32.5 mL). The mean net lesion growth after edema correction was 7.3 mL (95% CI: −2.1–16.7 mL; p < 0.0001). Lesion growth was significantly overestimated due to ischemic edema when determined in early-FCT imaging. In 18 patients, LV was lower than the initial ischemic core volume by CTP. These apparently “reversible” core lesions were more likely in patients with shorter times from symptom onset to imaging and higher recanalization rates.
Introduction
In ischemic strokes, early follow-up imaging to capture infarct lesion volume has been a pragmatic imaging endpoint for evaluation of treatment effects in stroke trials in order to include as many patients as possible.1–7 Lesion growth from initial to follow-up imaging is regularly evaluated based on the difference between the volume of the infarct lesion in early follow-up CT (FCT) and the volume of the initial early infarct lesion (i.e. ischemic core lesion), which is mostly determined by means of computed tomography perfusion (CTP).3,7–11 However, measurement of lesion volume in the subacute time window is biased by additional edema masking the true infarct volume, which ultimately may lead to an overestimation of infarct growth into brain tissue.12,13 This effect directly influences the evaluation and comparison of therapy effects in stroke trials using infarct volume at early follow-up as imaging endpoint.
Lately, a magnetic resonance imaging (MRI)-based study aimed to separately quantify infarct growth after acute stroke and concluded that 20% to 36% of lesion expansion at 24 h and one week was induced by edema. 14 In the past, studies employing computed tomography (CT) for measurement of early lesion growth did not differentiate between true infarct and edema, and this may affect most acute stroke patients who receive CT because of its applicability, wide availability, and speed. 15 Recently, a quantitative imaging method has been introduced to quantify the volume of net water uptake in infarct lesions due to ischemic edema based on CT densitometry. 16 This method has lately been used to correct subacute lesion volumes in CT for their proportion of edema to improve the estimation of final infarct volume. 17 It remains unclear how edema correction may affect measurement of early lesion growth in acute brain infarct from admission to early 24-h follow-up.
Our aim was to investigate the dynamics of early brain infarction using this quantitative imaging biomarker in order to differentiate between the two components of lesion growth: increasing lesion volume due to water uptake (i.e. edema) versus increasing volume due to true tissue infarct. We hypothesized that early lesion growth is significantly overestimated due to ischemic edema. As it is known that succesful recanalization decreases final infarct volume, we also sought to investigate potential treatment effects of mechanical recanalization on edema-corrected net infarct growth. 18
Methods
Patients
For this study, anonymized data from our prospectively collected stroke database from three German stroke centers were analyzed retrospectively, admitted from January 2015 to August 2017. Anonymized data were recorded in accordance with ethical review board approval and no informed consent was necessary after review (Ethics Committee of the University of Hamburg Chamber of Physicians, Hamburg, Germany). The data that support the findings of this study are available from the corresponding author upon reasonable request.
Patients were screened consecutively based on a priori defined inclusion criteria: (1) acute ischemic middle cerebral artery (MCA) stroke with occlusion of the M1 segment and non-enhanced CT (NECT), CT angiography (CTA), and CTP performed on admission; (2) performed mechanical thrombectomy after admission imaging; (3) early FCT acquired approximately 24 h after admission; (4) documented time of symptom onset to imaging; (5) National Institutes of Health Stroke Scale (NIHSS) score above 3; (6) Absence of intracranial hemorrhage, preexisting thromboembolic or hemodynamic infarctions or preexisting significant carotid stenosis; (7) Absence of malignant mass effect with or without performed decompressive hemicraniectomy. Baseline clinical characteristics and demographic information were extracted from the medical records, as well as information about recanalization success determined by the thrombolysis in cerebral infarction (TICI) scale.
All study protocols and procedures were conducted in accordance to the ethical guidelines (Ethics committee of the Hamburg Chamber of Physicians, Hamburg, Germany) and in compliance with the Declaration of Helsinki.
Image acquisitions
All patients received a comprehensive stroke imaging protocol at admission with NECT, CTA, and dynamic time-resolved CTP performed in equal order on 128 or 256 dual slice scanners (Philips iCT 256, Siemens Somatom Definition Flash). NECT: 120 kV, 280–340 mA, 5.0 mm slice reconstruction, 1 mm increment, 0.6 mm collimation, 0.8 pitch, H20f soft kernel, CTA: 120 kV, 175-300 mAs, 1.0-mm slice reconstruction, 1-mm increment, 0.6-mm collimation, 0.8 pitch, H20f soft kernel, 80 mL highly iodinated contrast medium, and 50 mL NaCl flush at 4 mL/s; scan starts 6 s after bolus tracking at the level of the ascending aorta. CTP: 80 kV, 200–250 mA, 5 mm slice reconstruction (max. 10 mm), slice sampling rate 1.50 s (min. 1.33 s), scan time 45 s (max. 60 s), biphasic injection with 30 mL (max. 40 mL) of highly iodinated contrast medium injected with at least 4 mL/s (max. 6 mL/s) followed by 30 mL sodium chloride chaser bolus. All perfusion datasets were inspected for quality and excluded in case of severe motion artifacts.
Image analysis
The calculation of perfusion parameter maps based on the admission CTP datasets was performed using the software tool AnToNIa.19–23 Infarct core was operationally defined by CT perfusion threshold, i.e. any ischemic brain lesion with markedly decreased rCBF (≤30% compared to contralateral normal tissue) following published references.8,18,24–26 In the FCT, LV was captured by manual segmentation of the hypoattenuated infarct lesion using semiautomatic commercially available software (Analyze 11.0, Biomedical Imaging Resource, Mayo Clinic, Rochester, MN). The rater was blinded for all other imaging data and patient information in random order. Ischemic lesion growth from initial to follow-up imaging was calculated by subtracting the early ischemic core volume (Vol_rCBF) from LV (equation (1)).

Lesion water uptake quantification
The edematous component of the infarct lesion due to net water uptake can be quantified using CT densitometry.16,27 To determine the volume of edema (EV) of the LV, net water uptake within infarct lesions was measured as recently described.15–17,28 This quantitative method is based on a physical principle of CT densitometry and volumetric change whereby the product between the volume of a body and its mean CT density remains constant regardless of the volume of water uptake. This contingent relationship describes the direct link between the expanding volume of infarct lesions due to ischemic edema and decreasing CT density (see supplemental content of Broocks et al. 16 : http://links.lww.com/RLI/A360).
Accordingly, edematous volumetric changes of ischemic lesions due to water uptake were directly quantified by measurements of ischemic hypodensity. Briefly, the mean density of the infarct lesion (Dinfarct) was measured in a region of interest (ROI) defining the hypoattenuated area of infarcted brain tissue. The corresponding normal density (Dnormal) was determined in a ROI mirrored symmetrically to the normal non-ischemic hemisphere and adjusted anatomically to exclude sulci. Only Hounsfield units (HUs) between 20 and 80 were used for average value calculation to exclude voxels that likely belong to cerebrospinal fluid (CSF) or calcification. Based on Dinfarct and Dnormal, the net water uptake per volume of infarct was calculated according to equation (2)
16

Subsequently, the calculated proportionate net water uptake was multiplied with LV to determine the absolute edema volume (EV) (equation (3)). Finally, EV was subtracted from the volume of uncorrected lesion growth to obtain the volume of edema-corrected net infarct growth, e.g. the volume of infarcted brain tissue that was added to the initial ischemic core volume until the time point of FCT imaging distinguished from ischemic edema (equation (4)).
27


Figure 1 exemplifies the calculation of net lesion growth.
Illustration of net infarct growth calculation. The initial ischemic core volume is calculated by volumetric segmentation of the initial relative cerebral blood flow volume (Vol_rCBF) using a threshold of <30%. In the follow-up computed tomography (FCT), the total lesion volume (LV) is subtracted using volumetric measurements. Uncorrected lesion growth was calculated by subtracting the ischemic core volume (Vol_rCBF) from the total LV in the FCT. Water uptake is quantified based on CT densitometry of the ischemic lesions compared to the normal density in a mirrored contralateral correlate as described recently.
16
To obtain the edema-corrected net infarct growth, edema volume (EV) is subtracted from the uncorrected lesion growth volume.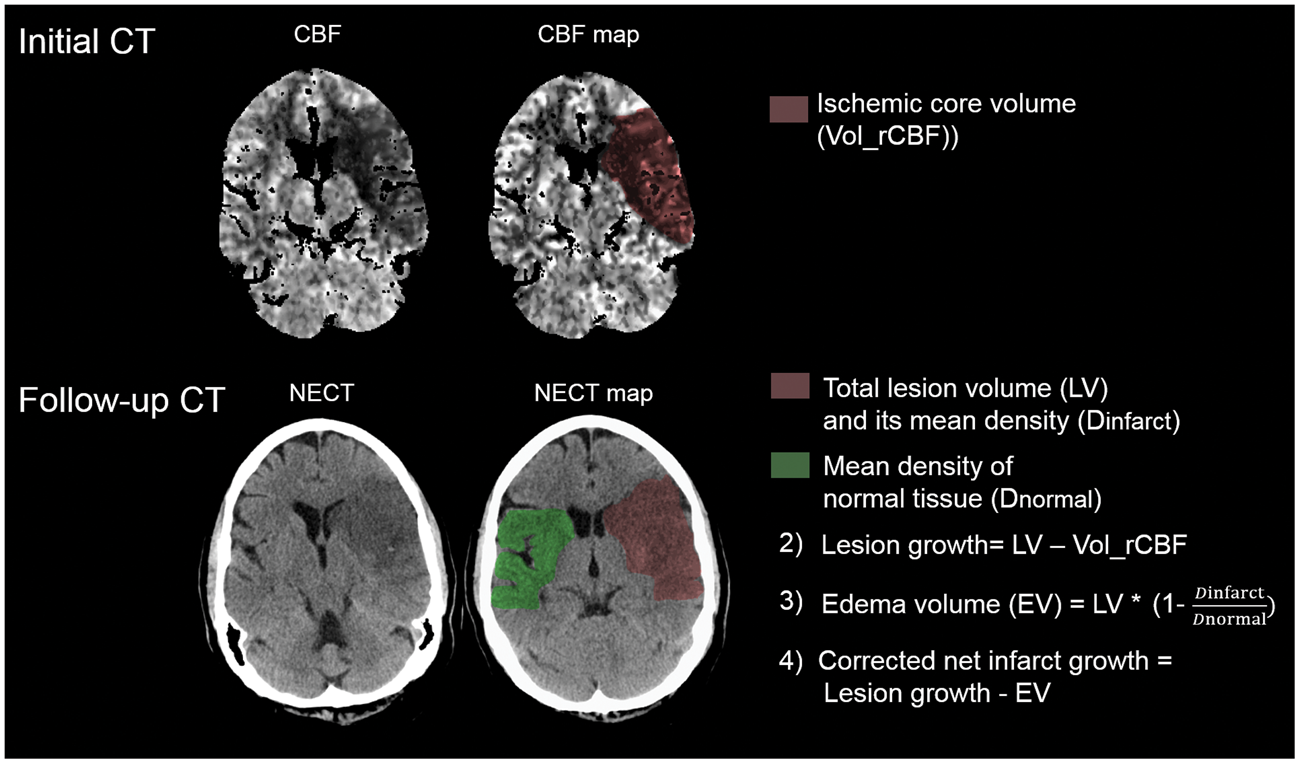
Statistical analysis
Kolmogorov–Smirnov tests were used to determine if the data sets were well-modeled by a normal distribution and continuous variables are presented as means and standard deviations or 95% confidence intervals (normal distribution) or medians and interquartile ranges (IQRs). For categorial data, absolute and relative frequencies are given. We compared ischemic lesion growth from the initial ischemic core to the infarct volume in the FCT with and without edema correction among all included patients using Mann–Whitney-U tests. A multiple linear regression analysis was performed to test the potential influence of the existing time from onset to imaging and recanalization status on edema-corrected net infarct growth as dependent variable. Moreover, net infarct growth was dichotomized (positive lesion growth versus partly “reversible” ischemic core) and recanalization status as well as the existing time window from symptom onset was investigated as potential influencing factor. Boxplot diagrams were induced to illustrate group differences and similarities. To test potential treatment effects of mechanical thrombectomy, net infarct growth was compared in patients with (TICI scale 2b and 3) versus without successful endovascular recanalization. A statistically significant difference was accepted at a p-value of less than 0.05. Analyses were performed using MedCalc (version 11.5.1.0; Mariakerke, Belgium) and R (R Core Team. R: A Language and Environment for Statistical Computing. R Foundation for Statistical Computing. Vienna, Austria, 2017).
Results
Patients
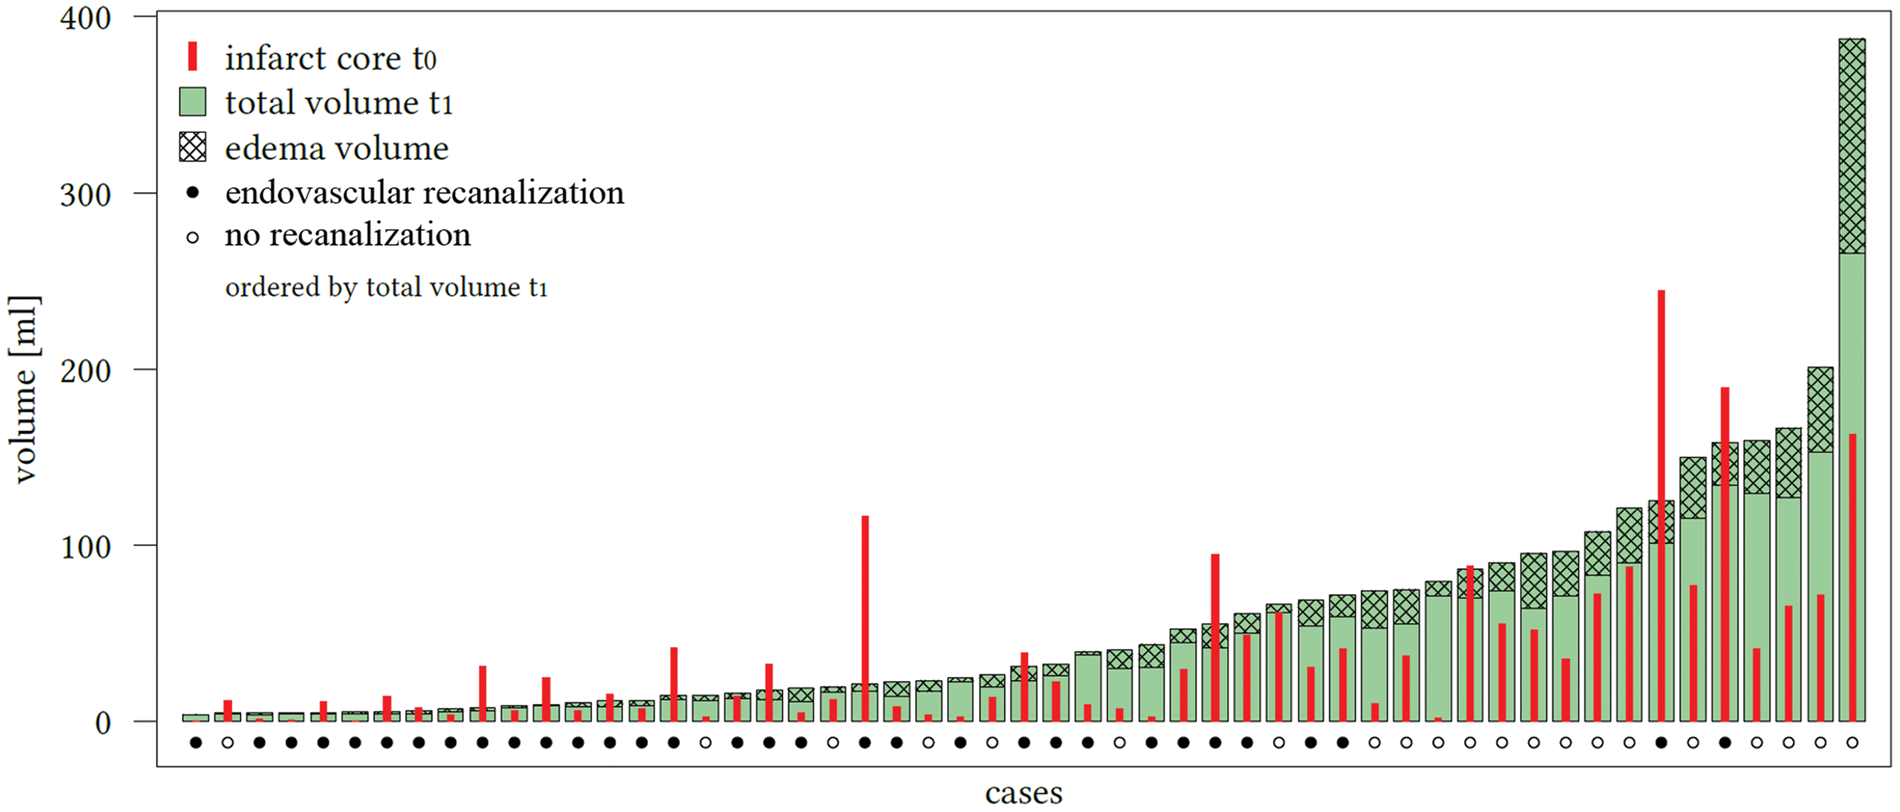
Sixty-two patients met all inclusion criteria and were analyzed. Comparing edema-corrected net infarct growth to uncorrected lesion growth, a significant difference was observed among all patients (p < 0.0001, 95% CI: 7.7–18.3) (Figure 2). The mean total lesion growth from the initial ischemic core to the LV in FCT was 20.4 mL (95%CI: 8.2–32.5 mL) and the mean net infarct growth after edema subtraction was 7.3 mL (95%CI: −2.1–16.7 mL). In 18 patients, the early infarct volume (i.e. ischemic core) as defined by rCBF threshold was overestimated: the infarct volume in FCT was apparently smaller than the ischemic core volume (referred as partly “reversible” ischemic core lesions). In these patients, the median initial ischemic core (Table 1) volume was 28.2mL (IQR: 14.2–88.2 mL), which was not different than in patients with infarct growth (p ¼ 0.08). The median total infarct volume in the FCT was 16.9mL (IQR: 7.5–31.2 mL) and the mean (SD) net water uptake in this group was 19.5% (8.1). In all other 44 patients, the total LV in FCT was higher compared to the initial ischemic core volume. Figure 3 shows all patients with individually plotted volumes of total LV, edema and initial ischemic core.
Impact of edema correction on the estimation of lesion growth. The first boxplot (left side) represents the mean volume of lesion growth from the early ischemic core (t0) to the total lesion volume in the follow-up computed tomography (t1) with confidence interval of the mean (red brackets). The second boxplot represents the mean net infarct growth after edema correction again with confidence interval of the mean. The difference between both quantities was significant (p < 0.0001). Proportions of the total lesion infarct volume in the included patients. All patients ordered ascending according to the individual total lesion volume (LV) measured in follow-up computed tomography (FCT, t1). The checked area on top is defined as total edema volume contributing to the total LV. The initial (t0) volume of early ischemic core is diagramed using the enclosed bar (red). The dots below the bars display whether the patient received successful endovascular recanalization based on thrombolysis in cerebral infarctions score 2 b and 3 (black dot: yes; white dot: no). Patients assembled into two groups according to lesion growth.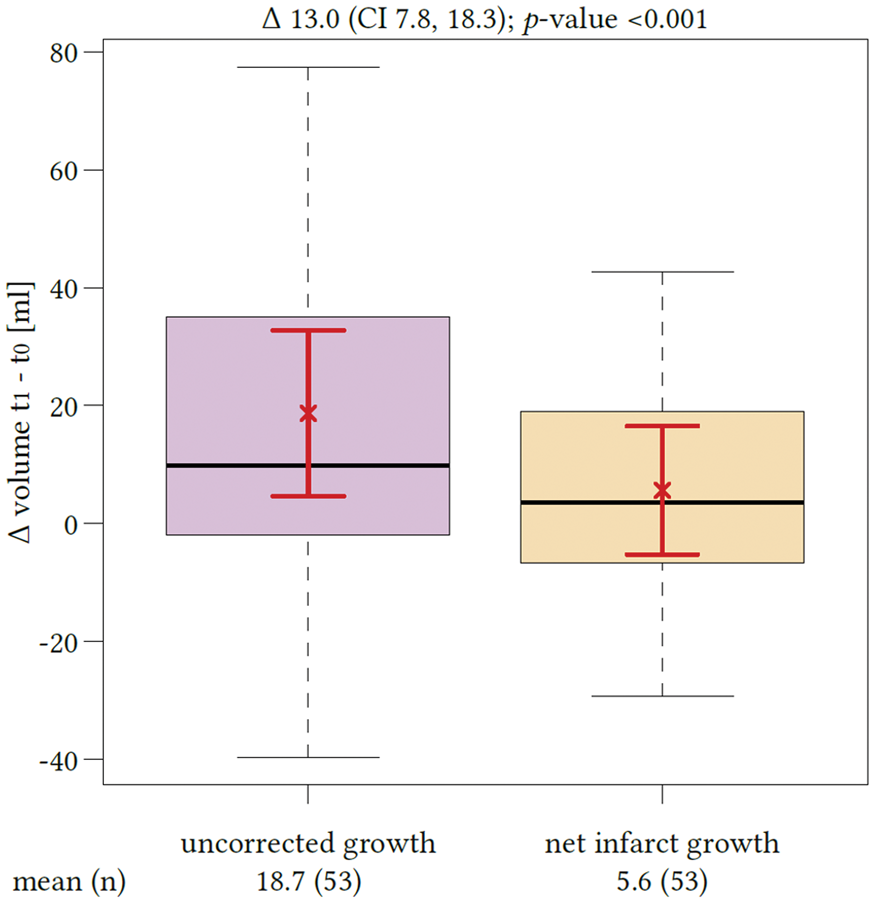
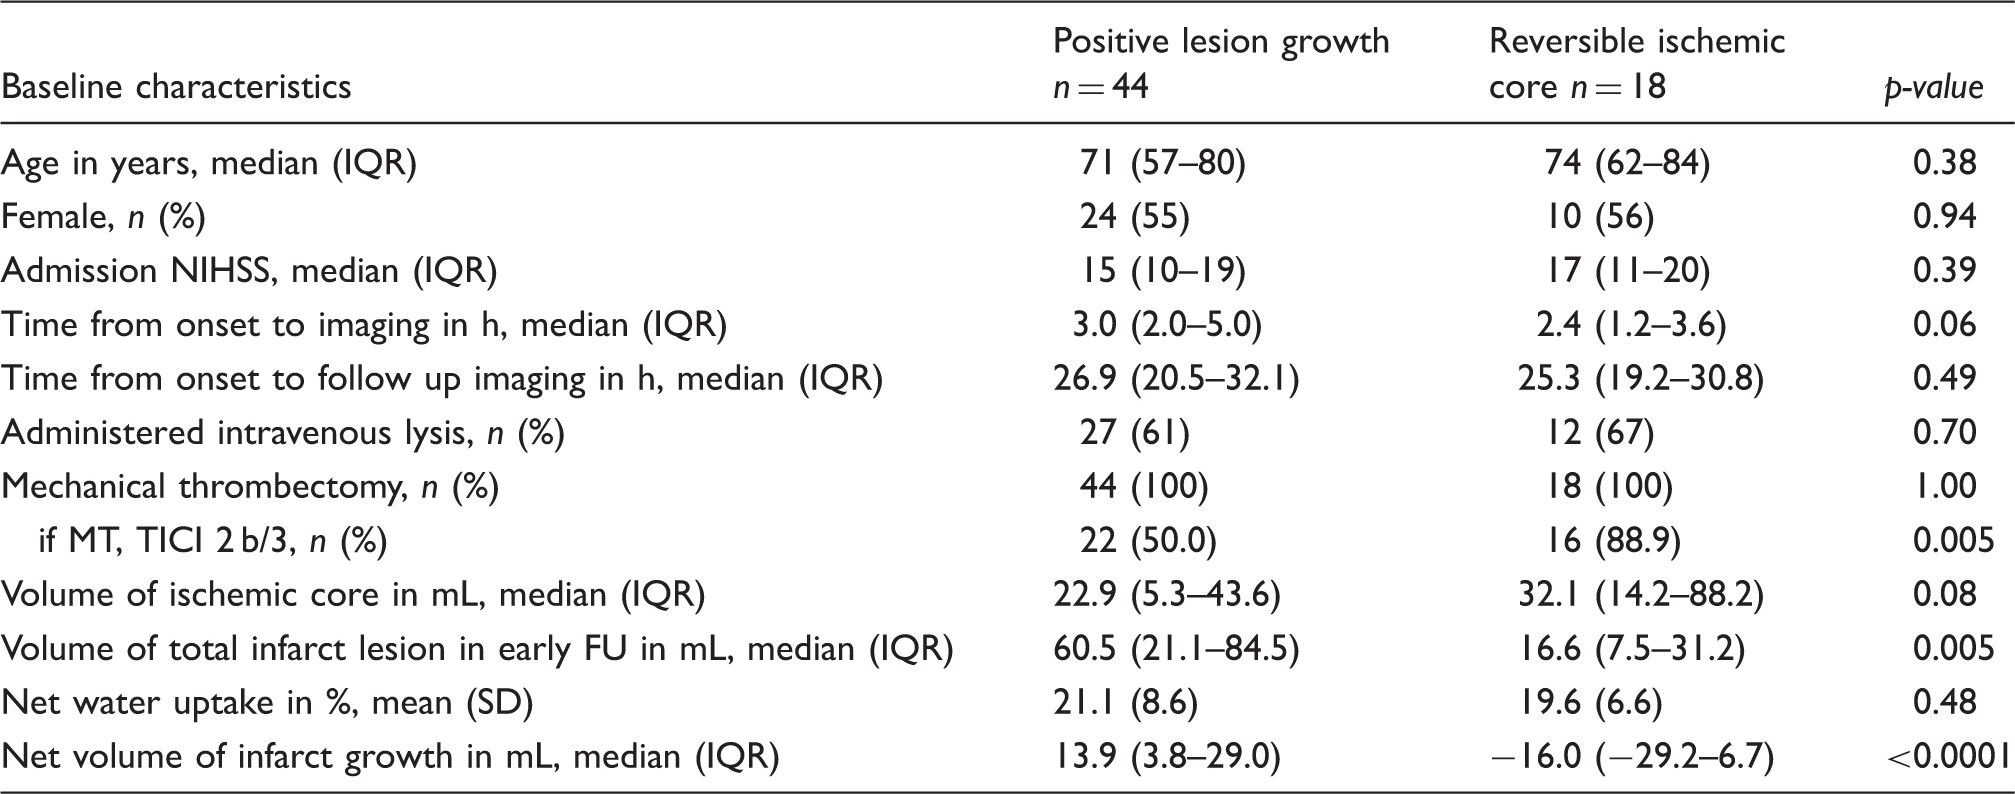
In patients with a positive lesion growth, the median initial ischemic core volume was 22.9 mL (IQR: 5.3–43.6 mL) measured after a mean (SD) time from symptom onset to admission of 3.5 h (2.1). In these patients, the median total infarct volume in the FCT was 60.4 mL (IQR: 21.1–84.5 mL) measured after a mean (SD) of 27.7 (10.0) h. The mean (SD) corresponding water uptake of the ischemic lesion was 21.1% (8.6). After edema correction (= subtraction of ischemic core volume and EV), the median-corrected net infarct growth was 13.9 mL (IQR: 3.8–29.0 mL). In comparison, the median lesion growth from the initial ischemic core to total follow-up lesion without edema correction was 30.3 mL (IQR: 11.2–42.5 mL; p < 0.0001).
Figure 3 displays the proportions of the total lesion volume in the FCT in patients with positive lesion growth versus patients with partly reversible ischemic core.
All patients underwent endovascular thrombectomy. However, the rate of successful recanalization (TICI scale 2b and 3) was different: 50.0% in patients with lesion growth versus 88.9% in patients with a partly “reversible” ischemic core volume (p = 0.005). Moreover, this group of patients showed a shorter median time window from symptom onset to imaging by trend of 2.4 h (IQR: 1.2–3.6 h) versus 3.1 h (IQR: 2.1–5.0 h) in patients with positive lesion growth (p = 0.06). Age, sex, initial NIHSS, and time to follow-up imaging did not differ between the patient groups.
Comparing all patients with successful recanalization to those without, we found a significant difference in the median volume of lesion growth with and without edema correction. The mean uncorrected lesion growth for patients without successful recanalization was 52.8 mL (95%CI: 31.1–74.4 mL) and differed from lesion growth in recanalized patients, which was −0.1 mL (95%CI: −10.7–10.5 mL; p = 0.001). The resulting difference of the mean lesion growth volume differentiating both groups was 52.7 mL. The mean lesion growth after edema correction also differed significantly depending on the recanalization status and was −6.6 mL in patients with TICI scale 2b or 3 recanalization (95%CI: −17.7–4.5 mL) and 29.3 mL in patients without successful recanalization (95%CI: 16.1–42.6 mL; p = 0.0001) (Figure 4). However, the resulting volume difference of lesion growth distinguishing patients according to their recanalization status after edema correction was only 22.7 mL.
Impact of recanalization on lesion growth. The difference of lesion growth between patients with (“yes”) or without (“no”) successful endovascular recanalization (based on thrombolysis in cerebral infarctions score 2 b and 3) without edema correction is displayed on the left side. The difference of edema-corrected infarct growth between patients with or without successful endovascular recanalization is displayed on the right side. The red brackets indicate the arithmetic mean and its 95% confidence interval.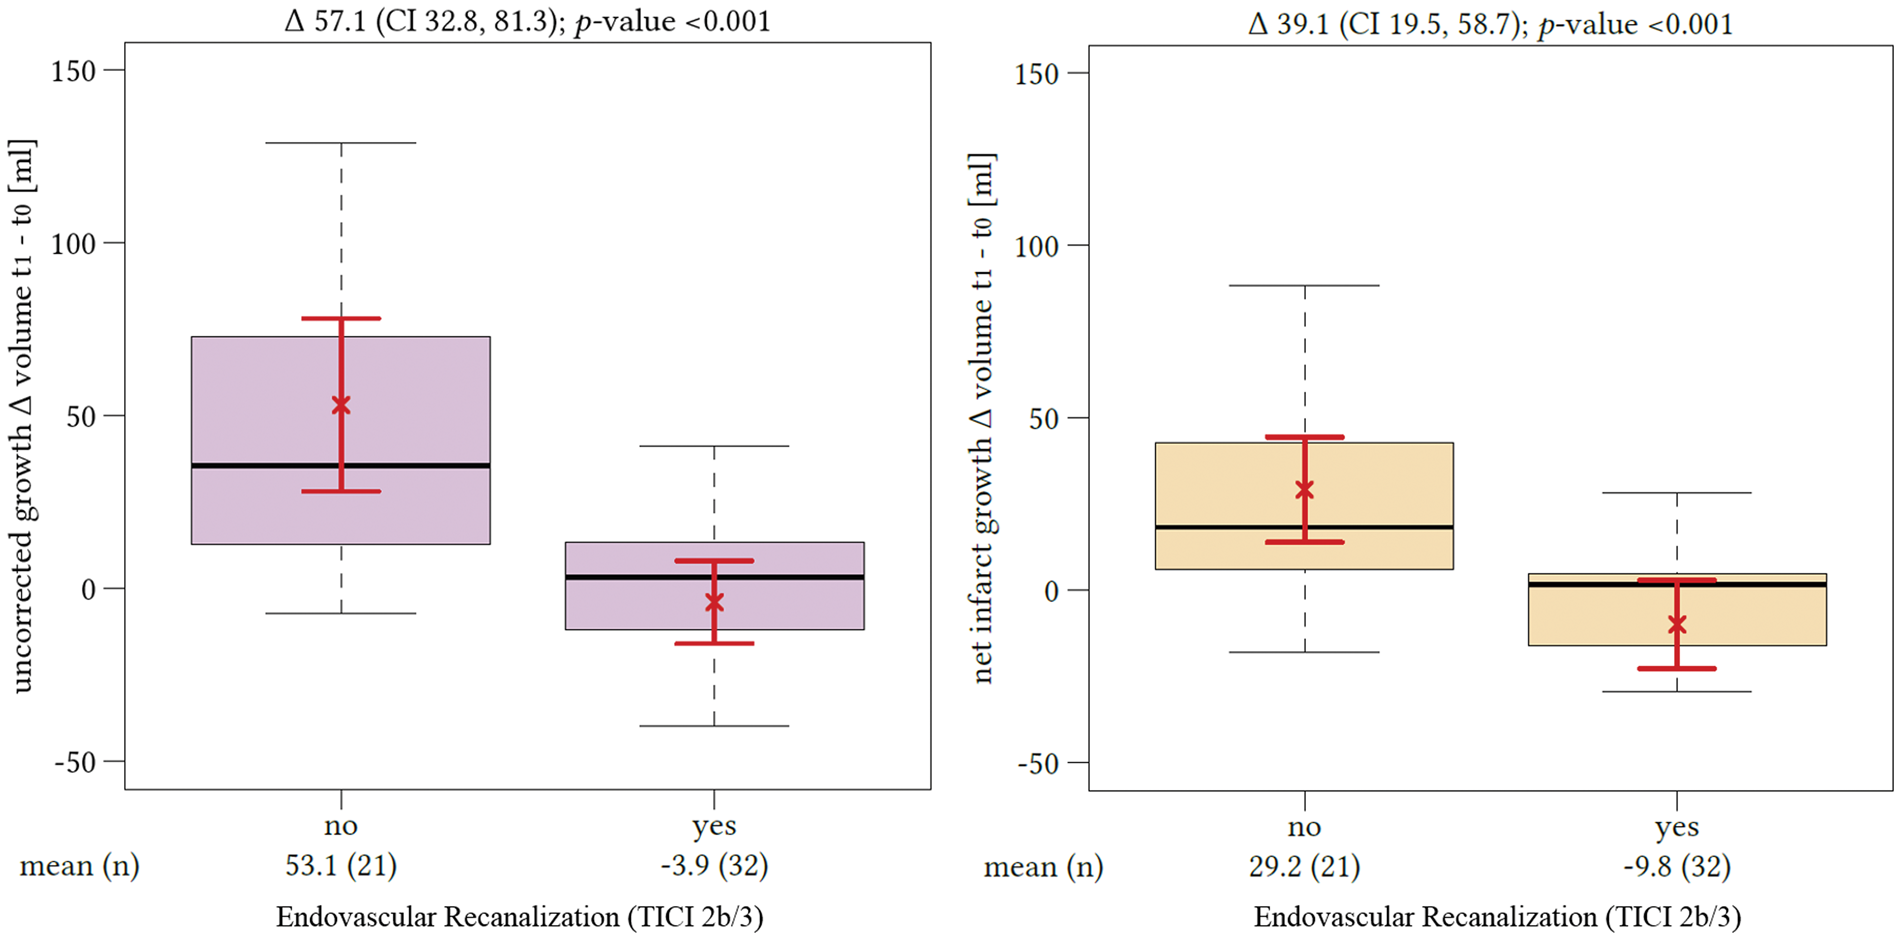
To test the influence of time from onset to imaging, NIHSS, recanalization status, and lesion water uptake on net infarct growth in a multivariate model, we performed a regression analysis (R2 = 0.28). The independent variables contributing significantly to the prediction of net infarct growth as part of the regression model (besides volumes of ischemic core and LV) were net water uptake (p < 0.0001) and time from symptom onset to admission imaging (p = 0.009).
The odds ratios for dichotomized net infarct growth were 0.09 (95% CI: 0.01–0.39; p = 0.005) for successful recanalization and 1.61 (95%CI: 1.07–2.65; p = 0.037) for every additional hour elapsed time from symptom onset to admission imaging. Figure 5 displays the influence of the time window on net infarct growth.
Impact of time from onset to admission on net infarct growth. The x-axis shows the time window in hours and net infarct growth in mL is displayed at the y-axis. The left side represents patients without endovascular recanalization (“no”) and the right side with successful recanalization (“yes”; based on thrombolysis in cerebral infarctions score 2 b and 3).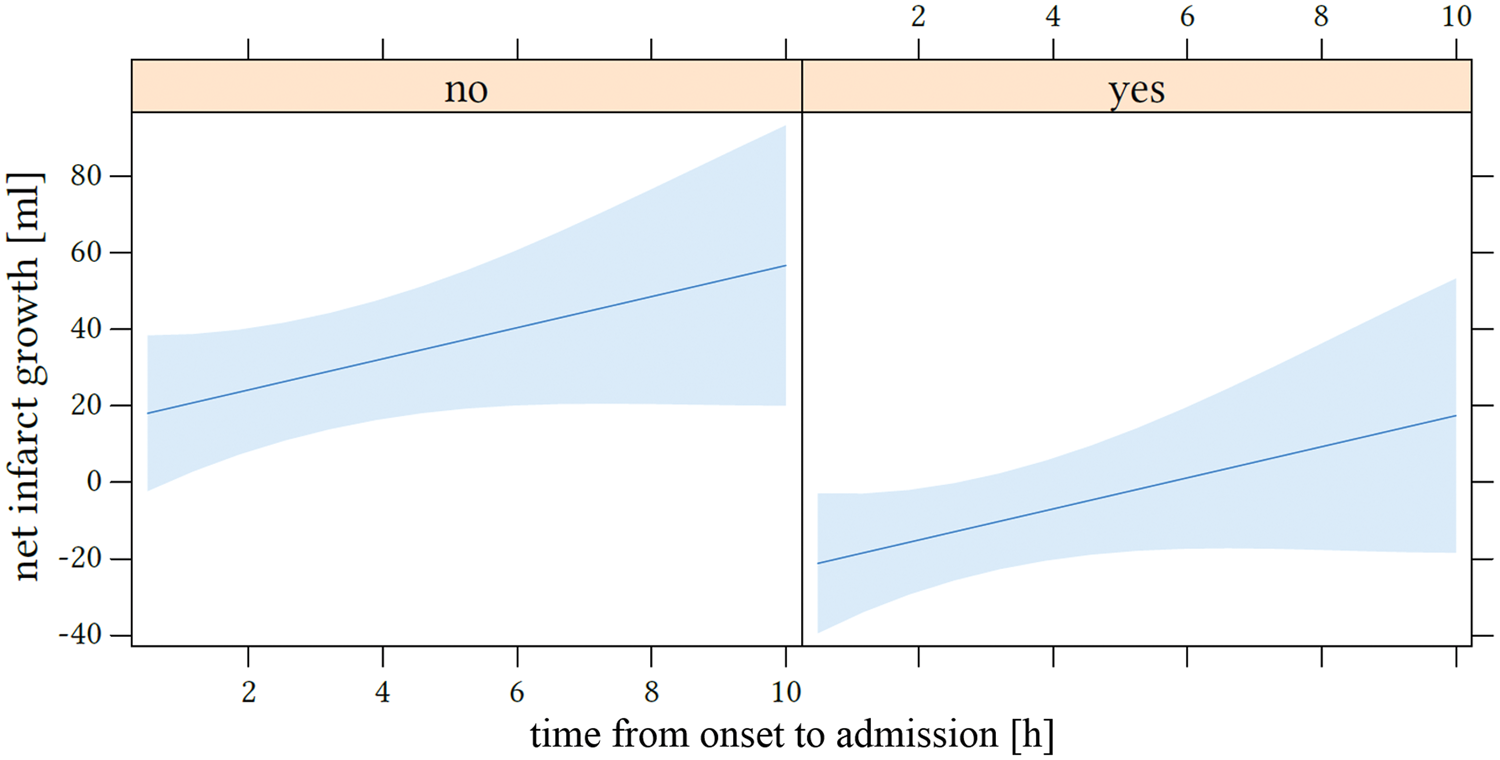
Discussion
The aim of this study was to investigate the dynamics of apparent lesion growth of early brain infarction by distinguishing between real tissue infarct growth and transient growth by ischemic lesion water uptake using a recently described CT-based imaging biomarker.15–17 The main finding of our study is that early lesion growth is significantly overestimated without correcting for ischemic edema. The most significant parameters affecting edema-corrected “real” infarct tissue growth were recanalization status and time window from onset to admission. Uncorrected lesion growth as well as edema corrected lesion growth was significantly lower in patients with successful endovascular recanalization. Our results emphasize that recanalization directly reduces the growth of true brain infarct corrected by ischemic edema. 29
In patients with successful recanalization, we did not observe infarct growth in the mean, regardless if uncorrected or edema-corrected. Furthermore, the difference of lesion growth between patients with versus without vessel recanalization was smaller when correcting for EV (lesion growth difference of 52.7 mL without versus 22.7 mL with edema correction). This effect demonstrates the significant contribution of ischemic edema on total lesion growth between the early ischemic core and the total subacute lesion volume in FCT, and might directly influence the comparability of therapy effects in clinical trials. The total lesion volume in FCT is an established pivotal biomarker after intra-arterial treatment for clinical outcome. 7 Therefore, it is relevant to capture the precise volume of brain tissue lost to infarction between admission and early FU imaging which is overestimated by transient edema. Nevertheless, capturing pronounced levels of transient EV in follow-up imaging after treatment may have important clinical implications and has recently been described as indicator of futile recanalization with poor functional outcome. 30
Edema correction might be a helpful and easy-applicable method in clinical use and in study protocols to increase comparability of tissue outcome at different time points. Furthermore, differentiating both dimensions of lesion growth (i.e. edema by water inflow and progressive tissue infarct) may be used to monitor treatment effects of endovascular recanalization, intravenous lysis with alteplase, but also novel adjuvant neuroprotectants or antiedematous medication.29,31 Lately, quantitative lesion water uptake has been used to determine changes in edema formation after application of glibenclamide as antiedematous drug. 32
In the present study, the mean total infarct volume was 58.2 mL with a mean % water uptake of 20.6%. Net water uptake varied interindividually between 2.2% and 39.9%, which is in accordance with a previous MRI-based study. 13 Therefore, quantitative edema imaging is needed to account for the heterogenous degree of edema formation. In clinical trials such as MR CLEAN, lesion assessment in FCT varies between three and 9 days after admission. The resulting variation of edema proportion on total lesion volumes could be corrected to improve the evaluation of therapy effects.
In 18 of 62 patients, the total infarct volume in the early FCT was lower than the volume of acute early infarct at admission as defined by rCBF threshold, which in the past has been claimed as an established method of defining the ischemic core lesion.10,24,25,33 Thus, in our study, ischemic core volume measurements significantly overestimated the true ischemic core volume which emphasizes that the dogmatic application of perfusion thresholds to identify early infarct is likely incorrect when applied in patients with rapid endovascular recanalization as recently described by Bivard et al.18,34,35 Similarly, Schaefer et al. described that in only 11/148 patients with acute ischemic stroke, infarct volume in FCT was smaller than the initial CTP-derived infarct core using cerebral blood volume. In our study, the effect of apparent overestimated core lesion by rCBF threshold was further aggravated when using edema-corrected infarct volume in early FCT (overestimated core lesion in 13/62 patients before and in 16/62 patients after edema correction, respectively). A recent study further discussed effects of treatment time suggesting that thresholds should be adjusted in patients with rapid recanalization to optimize the estimation of the ischemic core volume: apparently smaller 24-h infarct volumes compared to admission CTP ischemic core volume using an rCBF <30% threshold occurred in patients with rapid vessel recanalization. 18
Thus, defining the size of “infarct core” solely using perfusion threshold methods at admission imaging may be problematic concerning treatment decisions of thrombolytic or endovascular recanalization. Despite efforts to standardize core lesion imaging, it will lastly remain impossible to directly validate the correct volume of “infarct core” by perfusion imaging due to lack of histopathological correlation at this point in time. Nevertheless, the operational definition of a favorable perfusion pattern in CTP regardless of histopathological reality is encouraging and regularly used in the clinical context and in prospective stroke trials as a tool to select patients for endovascular treatment. 36
Our study has strengths and limitations. CT-based water uptake quantification has been described as a precise method to determine the individual volume of edema contributing to the ischemic lesion. 16 The reported error between the actual water uptake and CT-based lesion water quantification was 1.79% in comparison to a volumetric reference method in vivo. 16 Quantitative lesion water uptake by CT density can be directly related to histopathological measurements of volume of water uptake. 37
Limitations arise from the relatively small number of patients due to strict inclusion and exclusion criteria. The quantification of net infarct growth relied on the initial ischemic core, which was operationally defined using established rCBF threshold.18,24,25 Previously validated thresholds for ischemic core in CTP may not be optimal in the setting of early and complete reperfusion. Future studies could use threshold-free algorithms for CTP analysis and improve measurement of infarct growth by edema-corrected lesion analysis. 38
A further limitation is that water uptake was not determined in the ischemic core lesion at admission CT imaging; however, the relative volume of edema is thought to be very low at this point. Based on a previously study of stroke patients with time from onset <4.5 h and non-malignant MCA infarctions, the average water uptake in admission CT was 4.8%. 15 Thus, the resulting EV based on a median ischemic core volume of 35.1 mL in our study would equal 1.68 mL, which would not significantly change the estimation of edema corrected lesion growth.
In conclusion, CT-based edema correction significantly adjusts growth estimation of early ischemic infarct lesions. Lesion growth between admission and early follow-up was overestimated due to ischemic edema both significantly and heterogeneously. The individual contribution of edema on infarct volume may directly impair the comparability of imaging endpoints in clinical trials and should therefore be used to correct volume of brain infarct growth. Furthermore, measurement of lesion growth relying on CTP is prone to error. The dogmatic use of perfusion thresholds to identify early infarct is likely incorrect when applied in patients with rapid endovascular recanalization.
Footnotes
Funding
The author(s) received no financial support for the research, authorship, and/or publication of this article.
Declaration of conflicting interests
The author(s) declared the following potential conflicts of interest with respect to the research, authorship, and/or publication of this article: JF: Consultant for Acandis, Boehringer Ingelheim, Codman, Microvention, Sequent, Stryker. Speaker for Bayer Healthcare, Bracco, Covidien/ev3, Penumbra, Philips, Siemens. Grants from Bundesministeriums für Wirtschaft und Energie (BMWi), Bundesministerium für Bildung und Forschung (BMBF), Deutsche Forschungsgemeinschaft (DFG), European Union (EU), Covidien, Stryker (THRILL study), Microvention (ERASER study), Philips. AK: research collaboration agreement: Siemens Healthcare. All other authors: None.
Authors’ contributions
GB: Study design. Acquisition of data. Image processing. Data analysis. Statistical analysis. Drafting the manuscript and revising it critically. UH: Data analysis. Statistical analysis. Drafting the manuscript and revising it critically. TD: Data analysis. Drafting the manuscript and revising it critically. AS: Data analysis. Acquisition of data. Image processing. Drafting the manuscript and revising it critically. JN: Acquisition of data. Drafting the manuscript and revising it critically. GS: Data analysis. Statistical analysis. Drafting the manuscript and revising it critically. NF: Image processing. Drafting the manuscript and revising it critically. SL: Acquisition of data. Drafting the manuscript and revising it critically. JF: Study design. Data analysis. Drafting the manuscript and revising it critically. SG: Study design. Image analysis. Data analysis. Drafting the manuscript and revising it critically. AK: Study design. Acquisition of data. Image analysis. Data analysis. Drafting the manuscript and revising it critically.
*These authors contributed equally to the work.