
Abstract
Previous studies showed changes in mRNA levels in whole blood of rats and humans, and in miRNA in whole blood of rats following intracerebral hemorrhage (ICH). Thus, this study assessed miRNA and their putative mRNA targets in whole blood of humans following ICH. Whole transcriptome profiling identified altered miRNA and mRNA levels in ICH patients compared to matched controls. Target mRNAs of the differentially expressed miRNAs were identified, and functional analysis of the miRNA-mRNA targets was performed. Twenty-nine miRNAs (22 down, 7 up) and 250 target mRNAs (136 up, 114 down), and 7 small nucleolar RNA changed expression after ICH compared to controls (FDR < 0.05, and fold change ≥ |1.2|). These included Let7i, miR-146a-5p, miR210-5p, miR-93-5p, miR-221, miR-874, miR-17-3p, miR-378a-5p, miR-532-5p, mir-4707, miR-4450, mir-1183, Let-7d-3p, miR-3937, miR-4288, miR-4741, miR-92a-1-3p, miR-4514, mir-4658, mir-3689d-1, miR-4760-3p, and mir-3183. Pathway analysis showed regulated miRNAs/mRNAs were associated with toll-like receptor, natural killer cell, focal adhesion, TGF-β, phagosome, JAK-STAT, cytokine–cytokine receptor, chemokine, apoptosis, vascular smooth muscle, and RNA degradation signaling. Many of these pathways have been implicated in ICH. The differentially expressed miRNA and their putative mRNA targets and associated pathways may provide diagnostic biomarkers as well as point to therapeutic targets for ICH treatments in humans.
Introduction
Intracerebral hemorrhage (ICH) has a high morbidity and mortality rate.1,2 ICH evokes local and systemic inflammation, in which blood cells form leukocyte-platelet aggregates, adhere to brain endothelial cells, and infiltrate brain, resulting in blood–brain barrier (BBB) disruption, brain edema and parenchymal brain injury that worsen outcomes. 3
To assess the peripheral inflammatory response to ICH, we first showed that the expression of a group of mRNA transcripts in whole blood of rats with experimental ICH was different from controls and ischemic stroke. 4 To address one mechanism for these mRNA changes, we studied microRNA (miRNA) because they are short non-coding RNA that bind to complementary sequences in the 3′ untranslated region (3′UTR) of mRNA of hundreds of target genes, resulting in transcript degradation and post-translational suppression of target genes.5–7 We found miRNA expression changed in whole blood of rats following ICH, and the changes differed from ischemic stroke and controls. 8 These data provide a new way to understand the immunological mechanisms relevant to ICH and stroke on a genome-wide scale.9,10
To extend these animal studies, we have recently described changes of mRNA expression in whole blood of humans related to inflammation, immune responses, clotting and other pathways after ICH.11,12 As in the case of the animal studies, the mechanisms for these mRNA changes were not known. Thus, in this study we examine miRNA in whole blood of ICH patients and identify their potential mRNA target genes. Although there are less than 3000 annotated miRNAs in the human genome, 13 it is estimated that they modulate over 60% of the ∼20,000 human protein-coding genes.14,15
It is important to note that miRNA have been examined in serum and plasma in many studies of ICH and subarachnoid hemorrhage.16–25 However, the miRNA identified in those serum/plasma studies are extracellular, and likely associated with exosomes and/or bound to Argonaute 26 and have uncertain mRNA/gene targets. For the current study, we chose to study whole blood, where the miRNA and mRNA would be primarily intracellular within leukocytes, red cells, platelets and other blood cells. Thus, these data add to a growing literature on the expression of miRNA and their putative mRNA targets change in human whole blood following ICH. They could provide diagnostic biomarkers as well as therapeutic targets for future study.
Materials and methods
Study subjects
Demographic variables for ICH patients compared to VRF controls.
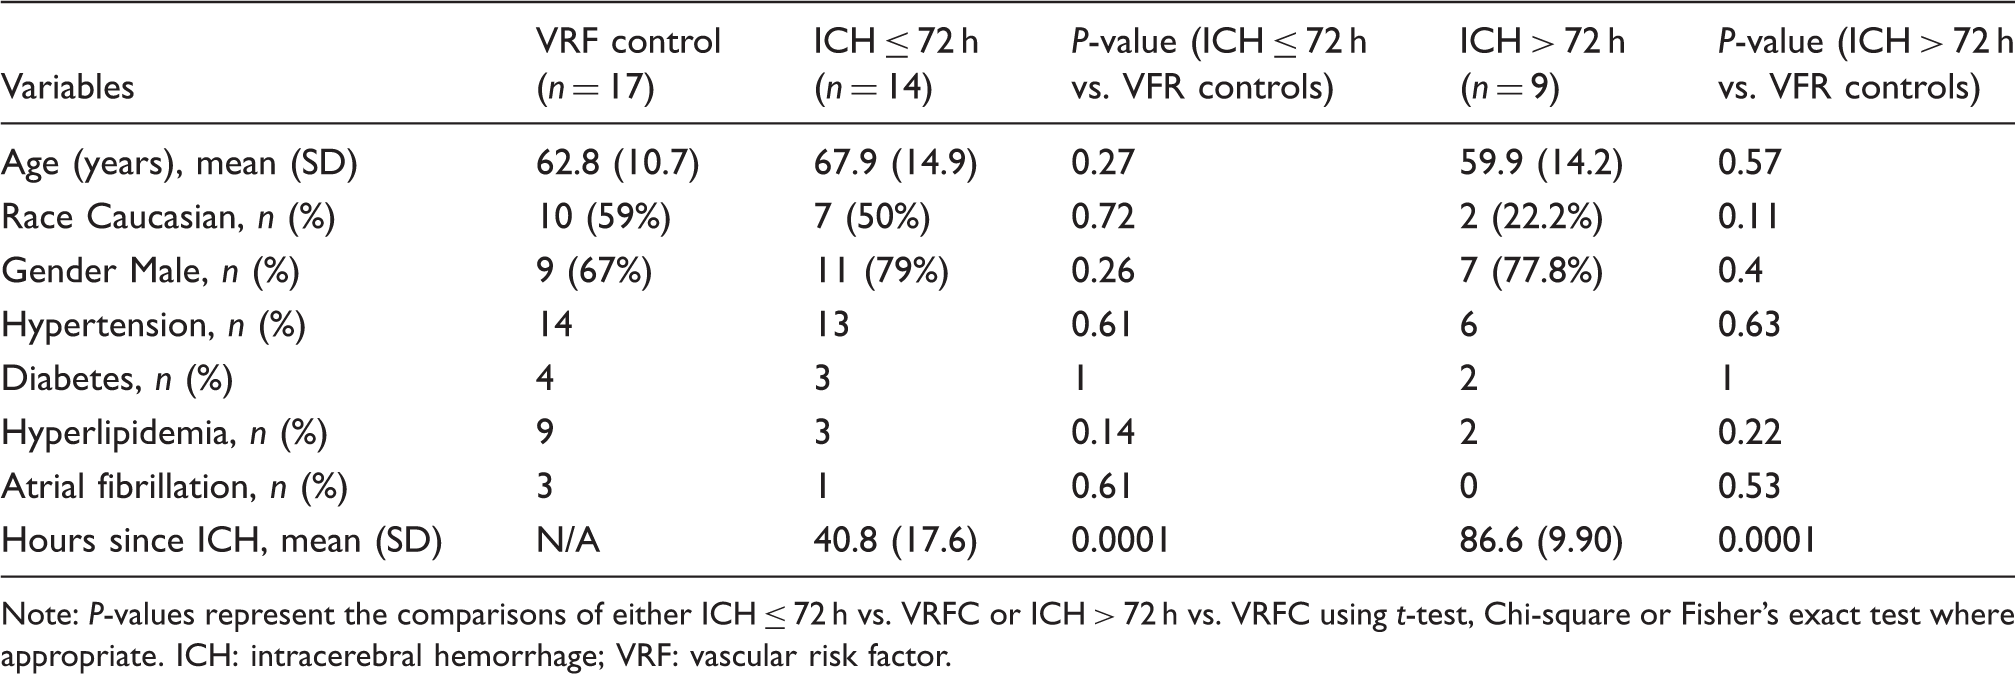
Note: P-values represent the comparisons of either ICH ≤ 72 h vs. VRFC or ICH > 72 h vs. VRFC using t-test, Chi-square or Fisher's exact test where appropriate. ICH: intracerebral hemorrhage; VRF: vascular risk factor.
One blood sample was obtained from each ICH subject after brain hemorrhage onset which varied from 4.2 to 101.3 h. PAXgene tubes (Qiagen) were used to collect and lyse all blood cells and to stabilize RNA immediately in blood. The tubes were left at room temperature for 2 h, and then stored frozen at −80℃ until processed.
Total RNA isolation
Total RNA was isolated according to the manufacturer's protocol (PAXgene blood miRNA kit; Pre-AnalytiX). RNA quantity and quality were determined using a Nano-Drop (Thermo Fisher) and Agilent 2100 Bioanalyzer, respectively. Samples required A260/A280 absorbance ratios ≥ 1.8, a 28S/18S rRNA ratio ≥ 1.8, and an RNA integrity number (RIN) ≥ 8. Of the total RNA isolated, half was used for miRNA arrays, and the other half was used for mRNA arrays. This ensures the miRNA and their target mRNAs are being assessed from the same batch of total RNA for each subject.
mRNA microarrays
Total RNA (80 ng each sample) was converted to cDNA and amplified using the ApplauseWT-Amp Plus ST System (NuGEN, San Carlos, CA) and labeled using the FL-Ovation cDNA Biotin Module V2 (NuGEN). The product was then hybridized to Affymetrix HTA 2.0 Gene Chip microarrays (Affymetrix, Santa Clara, CA) to profile gene expression of mRNAs according to the manufacturer protocol. Though exons are included on the HTA 2.0 arrays, the data here were analyzed at the “whole gene” level, which entailed using the average expression of the exon and junction probe-sets for each gene.
miRNA arrays
Isolated total RNA was processed on Affymetrix Gene Chip miRNA 3.0 Arrays (Affymetrix, Santa Clara, CA). For each subject, 200 ng of total RNA was used per microarray. RNA was labeled using FlashTag Biotin HSR labeling kits (Affymetrix, CA) with no amplification, hybridized to microarrays, and scanned using an Affymetrix GCS3000 Gene Array Scanner according to the manufacturer's protocol.
Statistical analysis of mRNA and miRNA data
Raw gene expression data were normalized using robust multichip averaging (RMA) using Partek Flow and Partek Genomics Suite version 7 (Partek Inc., St. Louis, MO). Statistical analyses were performed on mRNA or miRNA data with two comparisons dependent on time of blood draw following stroke: (1) ICH ≤ 72 h (n = 14) vs. VRFC (n = 17); (2) ICH > 72 h (n = 9) vs. VRFC (n = 17). We used 72 h as a cutoff in order to characterize acute (≤72 h) and subacute/chronic changes (>72 h). Univariate analysis (t-test, Chi-square or Fisher's exact test) was performed to identify potential confounding factors, including gender, age, race, and VRFs that differ between ICH groups and VRFC to avoid RNA expression differences due to unmatched samples. Since no factor had a P < 0.05, none of these were included in the ANOVA model. An ANOVA model that included diagnosis and technical variation (array batch) was employed with a False discovery rate (FDR) to correct for multiple-comparisons. miRNA or mRNA with a FDR<0.05 and fold change ≥ |1.2| were considered significant.
Integrated mRNA–miRNA functional analyses and cross-validation analysis
The integrated mRNA–miRNA functional network analyses were performed as previously described with minor modifications. 27 Briefly, the lists of regulated miRNAs and regulated mRNAs in blood of ICH patients were loaded into the functional network analyses software: Exploratory Gene Association Networks (EGAN). 28 After identifying miRNA-mRNA pairs using EGAN built-in miRNA-targets database, including TargetScan Human 7.0, 29 and miRTarBase,30,31 we performed functional analysis of the paired miRNAs and mRNAs using Kyoto Encyclopedia of Genes and Genomes (KEGG). Cross-validation of identified miRNAs or mRNAs was performed to determine prediction accuracy of the optimal model using forward selection k-nearest neighbor algorithm (k=1,3,5,7,9,11,13) in Partek Genomics Suite version 7. 32 Sensitivity and specificity of the best classifier were calculated.
Results
Demographic and clinical characteristics
Of the 40 subjects in the study, the average age (years, ± SD) was 63.9 ± 13.1, and 27 (67.5%) were male. The study was racially/ethnically mixed with 19 (47.5%) Caucasian, 8 (20%) Hispanic, 2 (5%) African American, 5 (12.5%) Asian, and 6 (15%) other races. Demographic and clinical characteristics are listed in Table 1 and are broken down into the two comparison subgroups: ICH ≤ 72 h vs. VRFC and ICH > 72 h vs. VRFC. There were no significant differences in subjects' demographics including age, gender, race, hypertension, hyperlipidemia, diabetes, and atrial fibrillation between the two ICH groups and VRFC (Table 1).
Of the total ICH patients (n = 23), hypertension was the cause of ICH in 78.3% of patients (deep location with hypertension), 17.45% were due to amyloid angiopathy (lobar/cortical with microbleeds) and 4.35% were cryptogenic. There were no significant differences in causes of ICH (P-value = 0.34) between ICH ≤ 72 h and ICH > 72 h in terms of hypertension and non-hypertension. In the ICH ≤ 72 h group (n = 14), 71.4% of patients had hemorrhage in deep area and 28.6% in lobar area. In ICH > 72 h group (n = 9), 55.6% of patients had hemorrhage in deep area and 44.4% in lobar area. There were no significant differences in ICH location (P-value = 0.66) between ICH ≤ 72 h and ICH > 72 h in terms of deep and lobar area; 21 out of 23 ICH patients received anti-hypertensive drugs including the β-blocker labetalol and/or several different calcium-channel blocker drugs within 72 h of hospital admission. The hypertensive controls were on similar classes of anti-hypertensive drugs.
Differentially expressed miRNAs and mRNAs
The altered miRNAs in blood at ≤ 72 h of ICH patients compared to vascular risk factor controls.
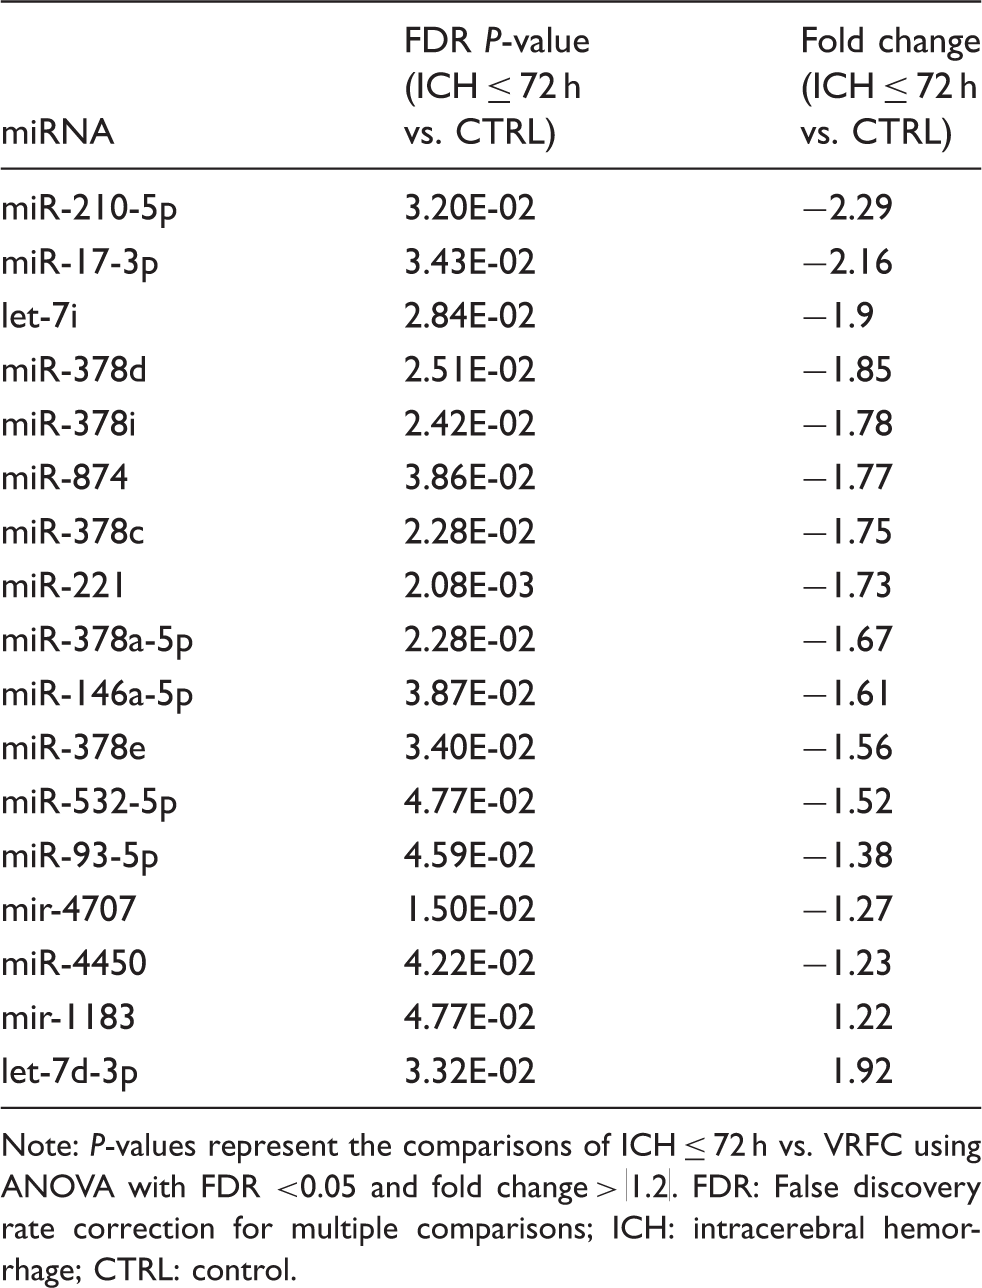
Note: P-values represent the comparisons of ICH ≤ 72 h vs. VRFC using ANOVA with FDR <0.05 and fold change > |1.2|. FDR: False discovery rate correction for multiple comparisons; ICH: intracerebral hemorrhage; CTRL: control.
The altered miRNAs in blood at >72 h of ICH patients compared to vascular risk factor controls.
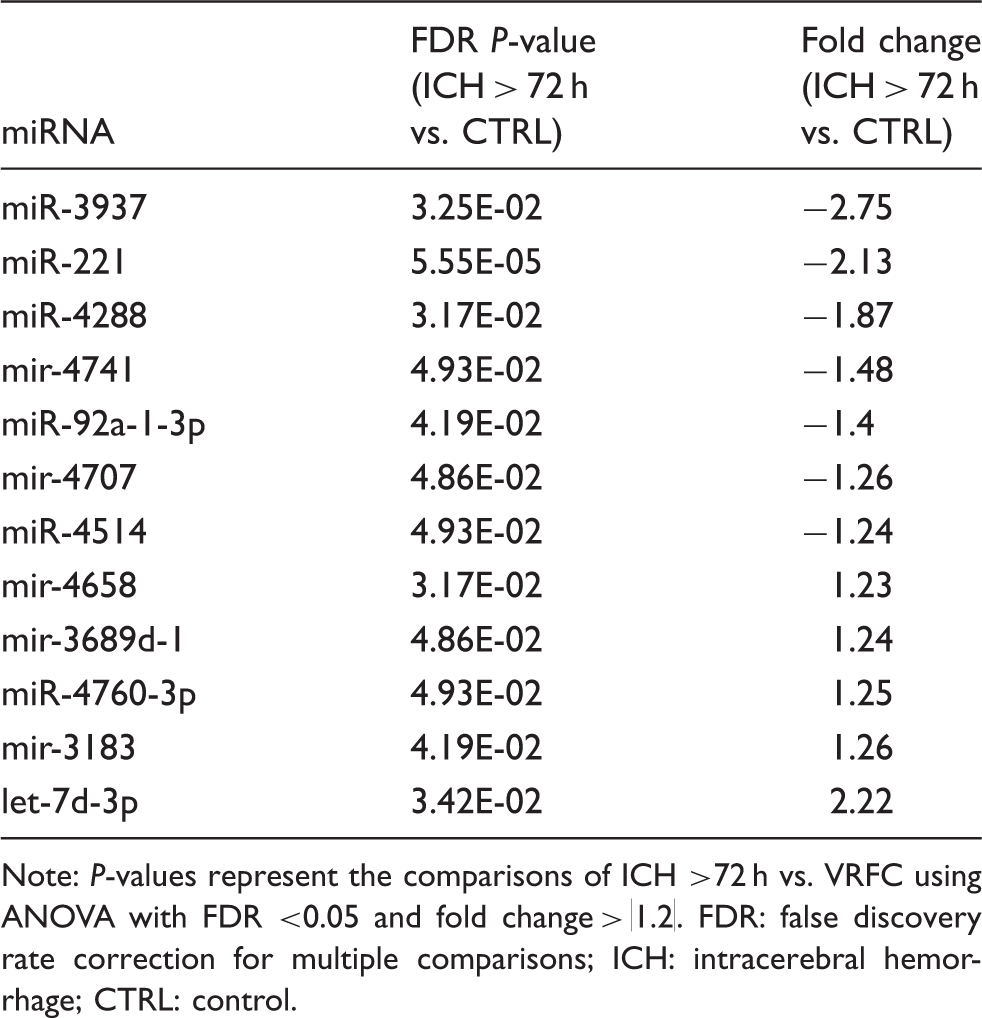
Note: P-values represent the comparisons of ICH >72 h vs. VRFC using ANOVA with FDR <0.05 and fold change > |1.2|. FDR: false discovery rate correction for multiple comparisons; ICH: intracerebral hemorrhage; CTRL: control.
The 15 down-regulated miRNAs at ≤ 72 h included: miR-146a-5p, miR-210-5p, miR-93-5p, miR-17-3p, miR-378a-5p, miR-221, let-7i, miR-378c, miR-378d, miR-378e, miR-378i, miR-532-5p, miR-874, miR-4450, and mir-4707 (Table 2, Figure 1(a)). The two up-regulated miRNAs at ≤72 h were mir-1183 and let-7d-3p (Table 2, Figure 1(a)). In addition, three small nucleolar RNAs (snoRNA) were differentially expressed at ≤72 h, including SNORA31B (P-value =5.68E-05, fold change=1.25), SNORD45 (P-value =1.36E-04, fold change = 1.29), and SNORA15 (P-value = 3.54E-04, fold change = 1.38).
(a) A total of 17 (2 up-regulated, 15 down-regulated) microRNAs (miRNAs) are significantly altered at ≤ 72 h in whole blood of intracerebral hemorrhage (ICH) patients versus vascular risk factor control patients (VRFC) (FDR < 0.05, fold change ≥ |1.2|). Patients are on the Y axis (Red = ICH ≤ 72 h; Blue = VRFC), and the miRNA are on the X axis (Red = up-regulation; black = no change; green = down-regulation). (b) A total of 12 (5 up-regulated, 7 down-regulated) miRNAs are significantly altered at >72 h in whole blood of ICH patients versus VRFC (FDR < 0.05, fold change ≥ |1.2|). Patients are on the Y axis (Red = ICH > 72 h; Blue = VRFC), and the miRNA are on the X axis (Red = up-regulation; black = no change; green = down-regulation).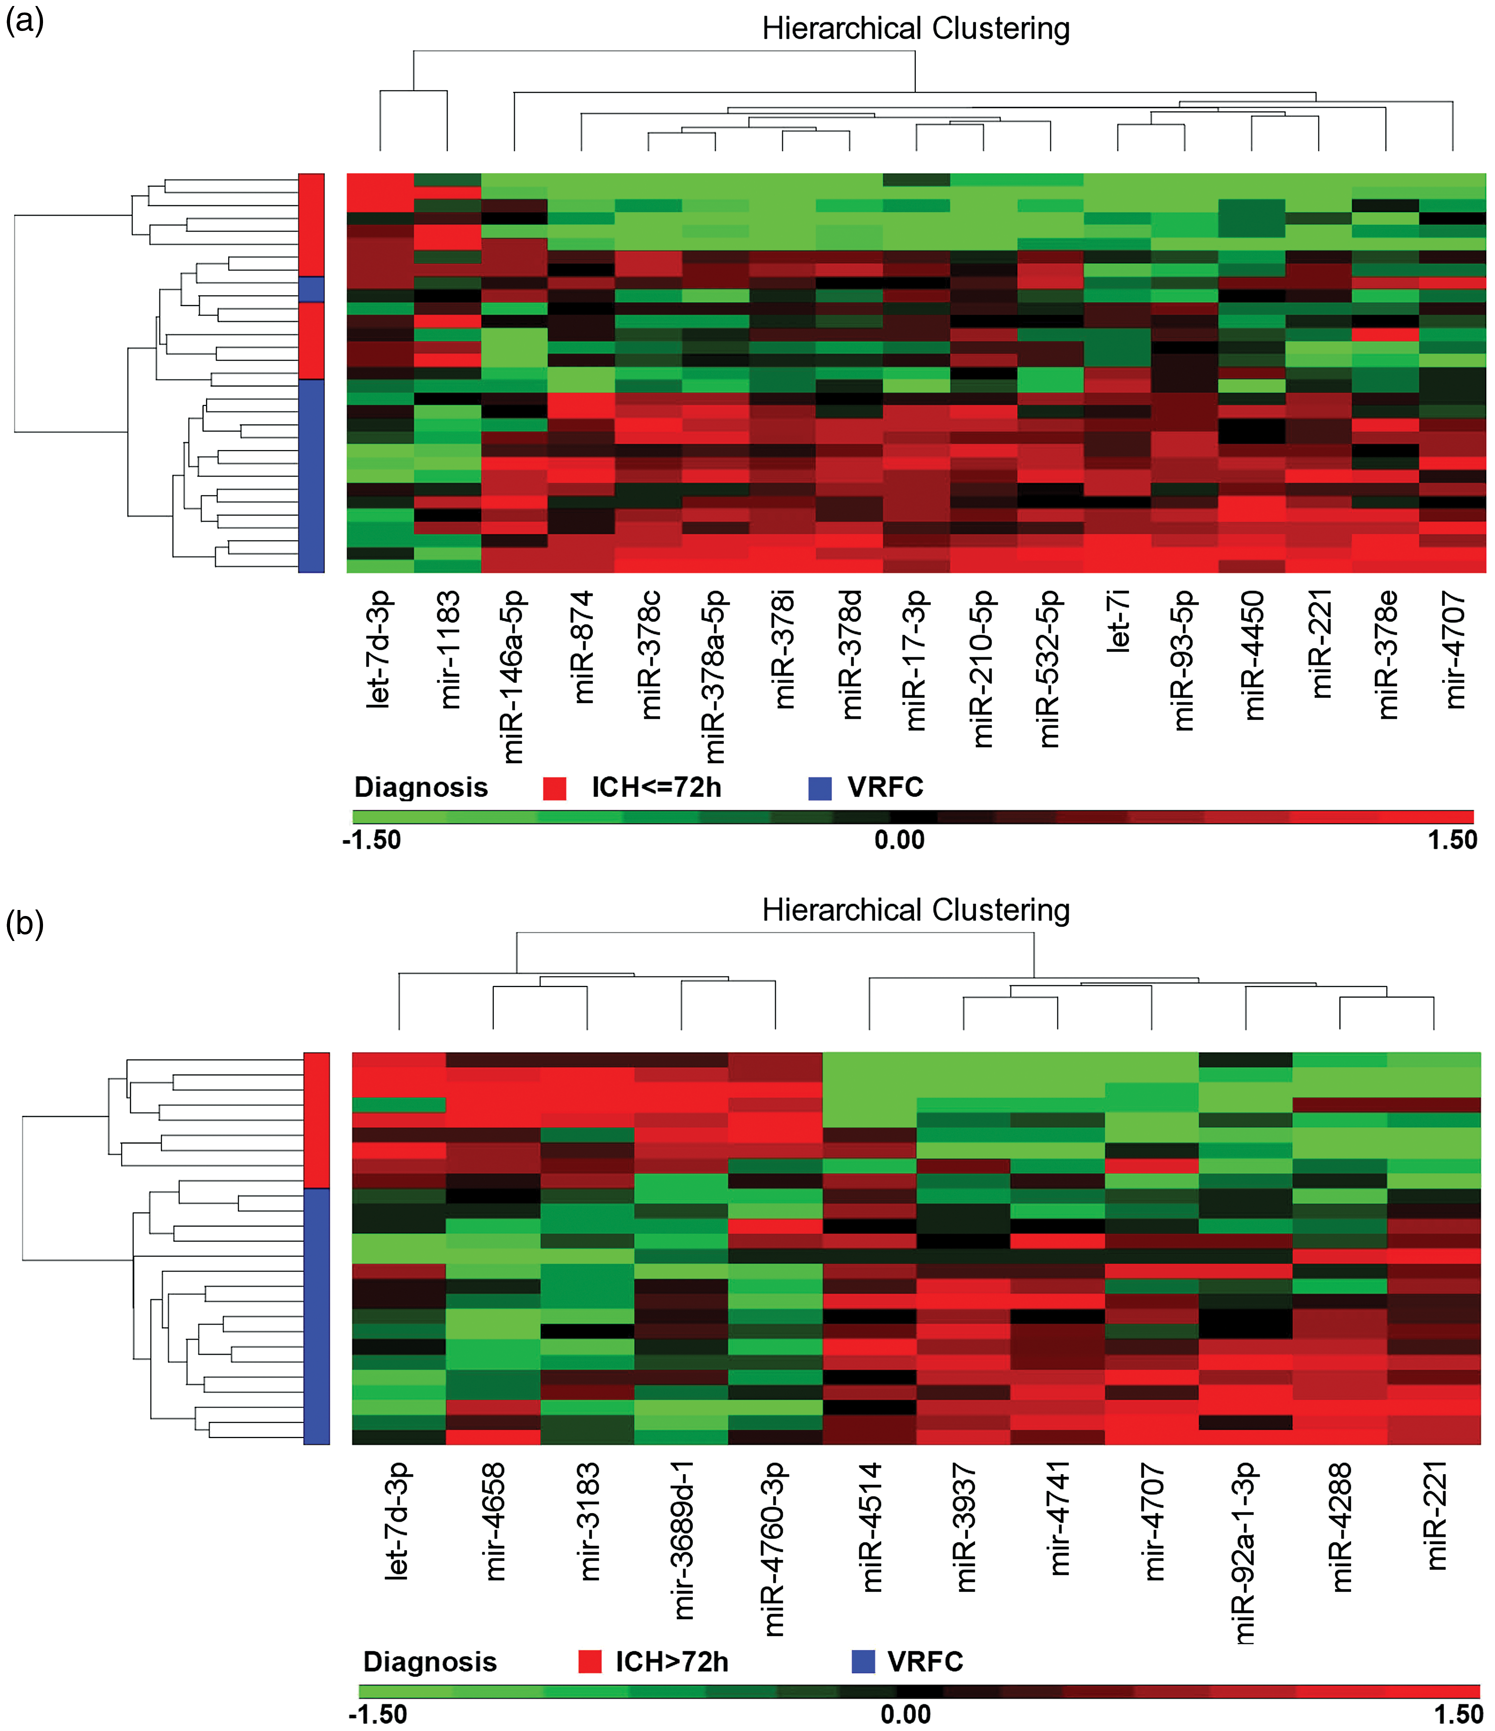
The seven down-regulated miRNA at > 72 h included: miR-92a-1-3p, miR-221, miR-3937, miR-4288, miR-4514, mir-4707 and mir-4741 (Table 3, Figure 1(b)). The five up-regulated miRNA at > 72 h were mir-4658, mir-3689d-1, miR-4760-3p, mir-3183, and let-7d-3p (Table3, Figure 1(b)). Four snoRNA that were differentially expressed at >72 h included: SNORD115-13 (P-value = 1.75E-04, fold change = 1.20), and three snoU13 paralogs on chromosome 12 (P-value = 5.42E-05, fold change = 1.21), chromosome 9 (P-value = 1.82E-04, fold change = 1.22), and chromosome 15 (P-value = 6.12E-05, fold change = 1.23). One scaRNA was elevated at >72 h, mgU2-19/30 (P-value = 1.76E-04, fold change = 1.21).
We also measured mRNA expression using the same blood samples on Affymetrix HTA 2.0 Gene Chip microarrays. There were 250 mRNAs (136 up and 114 down) that significantly changed expression at ≤72 h following ICH compared to VRFC (FDR < 0.05, fold change ≥ |1.2|) (Figure 2, Supplementary Table 1). No mRNAs were significantly regulated at >72 h after ICH compared to VRFC (FDR < 0.05, fold change ≥ |1.2|), likely because of stringent statistics and small numbers of subjects (see below).
A total of 250 (136 up-regulated, 114 down-regulated) mRNAs changed expression at ≤ 72 h (FDR<0.05; fold change ≥ |1.2|). Patients are on the Y axis (Red = ICH ≤ 72 h; Blue = VRFC), and the miRNA are on the X axis (Red = up-regulation; black = no change; green = down-regulation).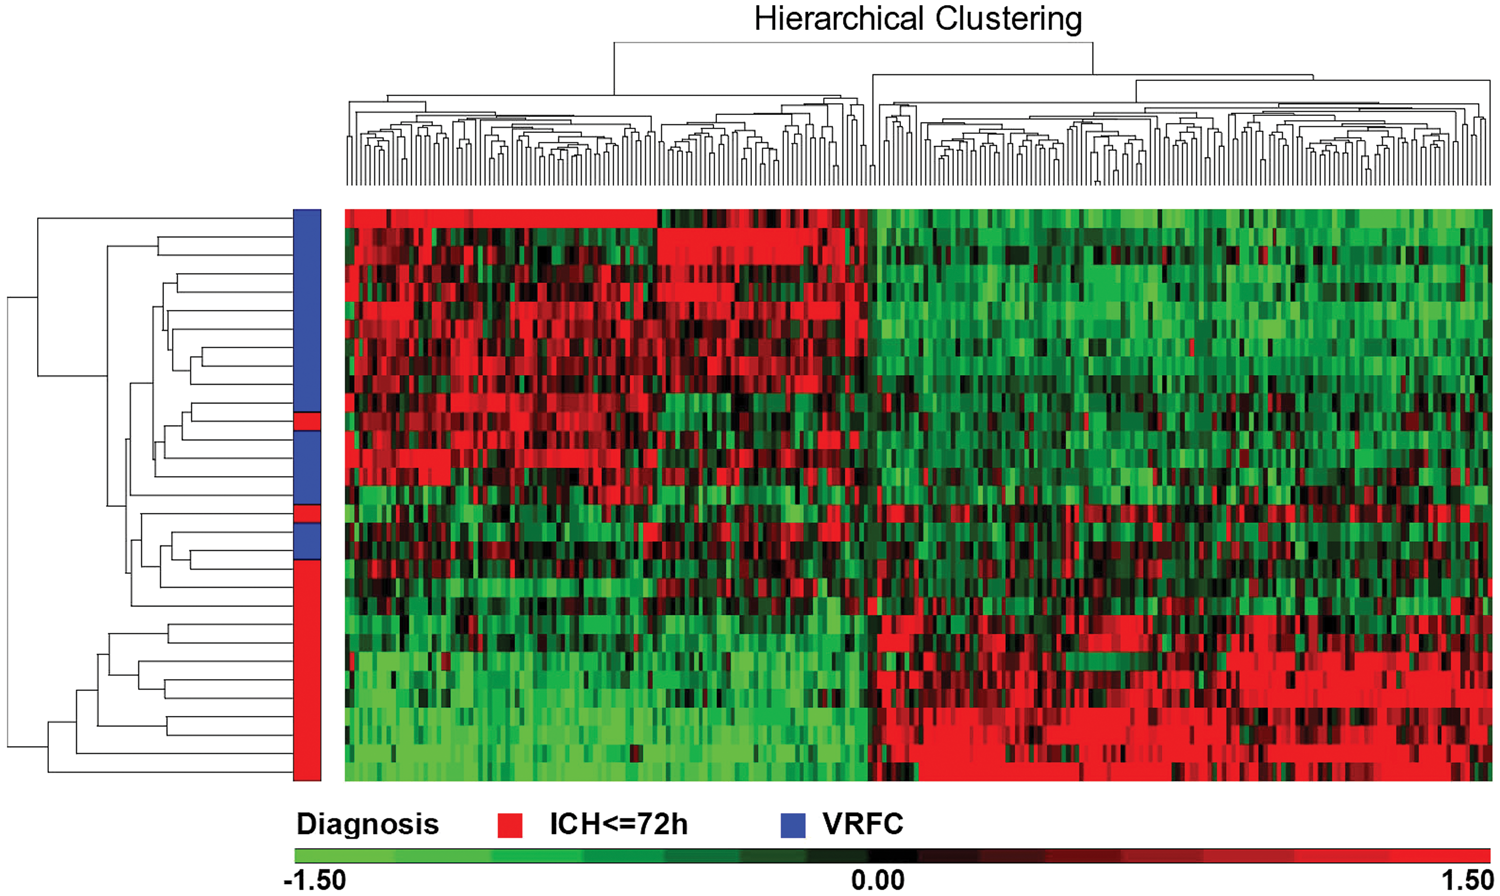
Functional analysis of down-regulated mRNAs and up-regulated miRNAs for ICH at ≤ 72 h compared to VRFC
Five down-regulated miRNAs (miR-146a-5p, miR-210-5p, miR-93-5p, miR-17-3p, and miR-378a-5p) were paired with up-regulated mRNA that are putative targets of these down-regulated miRNAs in whole blood at ≤72 h after ICH using EGAN built-in miRNA-targets database. The integrated mRNA–miRNA functional analyses showed the signaling networks between the five down-regulated miRNAs and up-regulated mRNAs (BCL2A1, TNFRSF10A, ROCK1, TLR2, TLR6, SPTLC2, ZNF143, CAPZA2, SH3GLB1, ACSL4, SERINC1, KIAA0232, SPOPL, STK17B, RAB8B, ZNF33A, ZBTB34, DCP2, TLR1, TLR5, JAK2, IFNGR1, and others) (Figure 3). The top functional pathways included: toll-like receptor, natural killer cell, focal adhesion, TGF-beta, adipocytokine, fatty acid metabolism, cytokine–cytokine receptor, chemokine, apoptosis, vascular smooth muscle, phagosome, JAK-STAT, and RNA degradation signaling (Figure 3, Supplementary Table 2). An unexpected and unexplained finding was the many pathways for infectious diseases including bacteria, viruses and parasites (Supplementary Table 2).
Top functional pathways for the 15 down-regulated miRNAs and the 136 up-regulated mRNAs in blood at ≤ 72 h in ICH patients. Green edges represent interaction of miRNA and mRNA/proteins. Red edges represent known protein–protein interactions. Blue edges connect the mRNA/proteins to enriched KEGG pathways.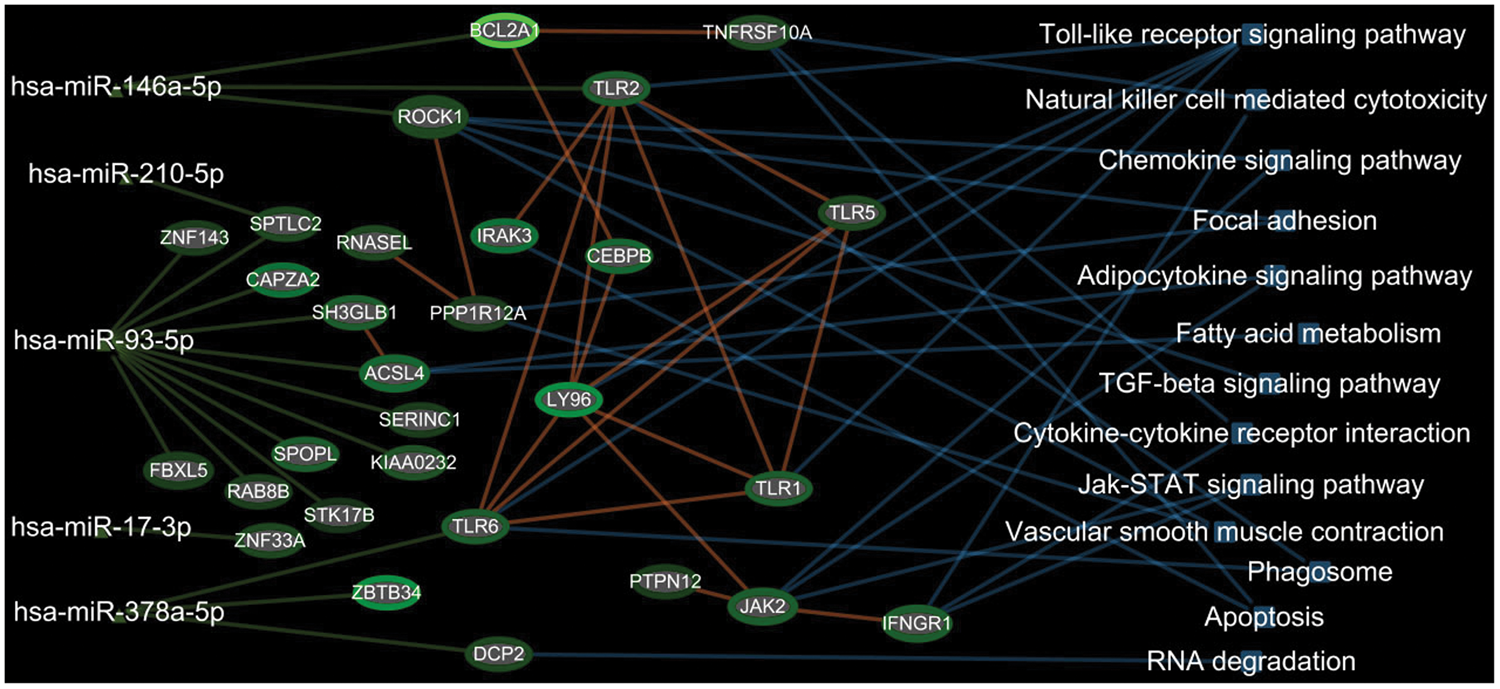
Cross-validation used all 17 miRNAs differentially expressed at ICH ≤72 h to build a predictive model. The best model was able to discriminate ICH at ≤72 h from VRFC with a normalized correct rate of 83.4% using forward selection with the k-nearest neighbor algorithm (k=3). The sensitivity was 78.6% and specificity was 88.2% for ICH at ≤ 72 h. Eight miRNAs were identified for the best predictive model, including mir-1183, mir-4707, let-7d-3p, let-7i, miR146a-5p, miR-17-3p, miR-210-5p and miR-221. The mRNA predictive model that was able to best discriminate ICH at ≤72 h from VRFC was generated using a k-nearest neighbor algorithm (k=13) with a normalized correct rate of 83.4% using 43 genes. The sensitivity was 88.2% and specificity was 88.2% for ICH at ≤ 72 h. Future studies will need to perform predictions on independent cohorts as a function of time after ICH.
Discussion
There are several important findings from this study. First, of the 17 miRNA regulated at ≤72h following ICH, 15 were down-regulated and 2 were up-regulated. However, of the 12 different miRNA regulated at >72 h following ICH, 7 were down-regulated and 5 were up-regulated. This shows a change of the differentially expressed miRNA in two different groups (at ≤ 72 h and at > 72 h), which means their target genes may change expression accordingly. In addition, there is a shift in down-regulated miRNA (in the ≤ 72 h group) to more up-regulated miRNA (in the > 72 h group). This is important because miRNA usually reciprocally regulate their target mRNA. That is, if a miRNA is down-regulated, this generally results in increased transcription/translation of its target genes, and the opposite if the miRNA is up-regulated.33,34 A second significant finding in this study was that the miRNA–mRNA targets were regulated in a large number of inflammatory/immune/cell death pathways including TLR, NK cell, focal adhesion, TGF-beta, adipocytokine, phagosome, JAK-STAT, cytokine–cytokine receptor, chemokine and apoptosis signaling which supports a number of our previous ICH findings (discussed below).11,12
To the best of our knowledge, this is the first study of miRNA in whole blood following ICH in humans. There are several advantages of using whole blood compared to serum/plasma: (1) whole blood can be processed using the PAXgene blood collection technology that stabilizes all RNA immediately against degradation and environmental disturbance effect 35 ; (2) whole blood miRNA would be mostly intracellular and derived from white blood cells, red blood cells, platelets and other cells in whole blood, and those miRNA are relevant to ICH pathophysiology; (3) the concentration of miRNA in whole blood is high making them easier to detect. Though there have been several miRNAs described in serum or plasma following ICH, their amounts could be affected by blood processing, by cell lysis, and variability due to their low levels.36–38 These serum and plasma miRNAs would be extracellular and associated with exosomes, Argonaute or other molecules that protect against RNAases16–25 and thus could be important in long-distance communication. There are only a few common miRNA between our whole blood ICH study and the serum/plasma studies, however. miR-146a decreased in serum/plasma following ICH16,18–20 and in whole blood in this study. miR-92a-1-5p was elevated in CSF and plasma following ICH in one study, 21 but miR-92a-1-3p decreased at > 72 h in whole blood in our current study. There was no overlap of the miRNA regulated in whole blood in this ICH study compared to miRNA regulated in serum/plasma in several other studies following ICH.17,22,23 The lack of overlap of the intracellular miRNA regulated in this whole blood study and the extracellular miRNA regulated in serum/plasma following ICH may be due at least in part to the extracellular miRNA being derived from other organs including liver, kidney, heart and others.
Few of the miRNA identified in human whole blood here were detected in our previous rat ICH study. 8 miR-146a increased in whole blood in the rat ICH blood clot model, whereas it decreased in whole blood in this human ICH study. miR-221 decreased in the rat ICH and rat thrombin model, and miR-92a decreased in the rat ICH thrombin model; and both miR-221 and miR-92a-1-3p decreased in whole blood in this human ICH study. Thus, at least as far as the peripheral blood miRNA response in rodent ICH models, it produces relatively few of the miRNA changes seen in human ICH. The reasons for this are uncertain but could suggest that intracerebral blood injections in rodents do not adequately model the miRNA response seen in blood in human ICH.
It is notable that let-7i was decreased at less than 72 h following ICH in this study, and let-7i is similarly decreased in blood of humans with ischemic stroke where it is postulated to play an important role in modulating the leukocyte response to ischemic stroke. 39 Thus, let-7i could play a similar role in ICH. The let-7d miRNA was up-regulated in whole blood by ICH both before and after 72 h in this study. In contrast, let-7d miRNA did not change in plasma following ICH or ischemic stroke. 40
In previous ICH studies, we studied mRNA that showed differential expression of alternatively spliced transcripts in ICH versus VRFC controls.11,12 In contrast, the present study examined gene-level expression of mRNA which represents the average expression of all of the alternatively spliced transcripts for each gene. Thus, the current study used a different measure of “mRNA expression” than the previous study, though it is plausible to expect some overlap. Indeed, of the 250 mRNA identified as regulated in this ICH miRNA study, and of the 394 alternatively spliced mRNA identified as being differentially expressed in our previous ICH study, 11 a total of 47 overlapped by gene symbol, which is highly significant using a hypergeometric probability test (P < 1 × 10⁻¹⁶). Upregulated mRNA, which would be associated with decreases of miRNA, common between the two studies included: KLHL2, FBXL5, RNU6-226P, RBMS1, SOS2, LMNB1, HK3, GAS7, FAM126B, NFIL3, IRAK3, JAK2, STX3, DCP2, ZNF267, COL4A3BP, CAPZA2, SLC38A2, SLC8A1, S100A9, IFNGR1, ACSL4, NQO2, MCTP1, TLR2, UBE2J1, PGM2, OSBPL8, RP2, AGTPBP1, FAR1P1, EXOC6, MEF2A and HIPK3. Down-regulated mRNA, which would be associated with up-regulated miRNA, in both studies included: ANKH, GRAP2, NOMO2, FUBP3, FAM102A, NELL2, DDI2, LARP1, SPTAN1, WNK1, RP11-423H2.1, PDK2 and TRAJ7.
Using the EGAN built-in miRNA-targets database, we paired each of the down-regulated miRNAs to its putative target genes that were up-regulated in blood of ICH patients. The pairs of down-regulated miRNA and up-regulated mRNA in blood of ICH patients included: miR-146a-5p–TLR2 (Toll-like receptor 2, fold change = 2.17), miR-146a-5p–ROCK1 (rho-associated protein kinase 1, fold change = 1.62), miR-146a-5p–BCL2A1 (Bcl-2-related protein A1, fold change = 5.61), miR-210-5p–SPTLC2 (Serine Palmitoyl transferase Long Chain Base Subunit 2, fold change = 1.62), miR-93-5p–ACSL4 (fatty acid-CoA ligase 4, fold change = 2.42), miR-93-5p–CAPZA2 (Capping Actin Protein Of Muscle Z-Line Subunit Alpha 2, fold change = 2.62), miR-93-5p–STK17B (Serine/Threonine Kinase 17b, fold change = 1.33), miR-93-5p–SPOPL (Speckle Type BTB/POZ Protein Like, fold change = 2.04), miR-93-5p–SH3GLB1 (SH3 Domain Containing GRB2 Like, Endophilin B1, fold change = 2.07), miR-17-3p–ZNF33A (Zinc Finger Protein 33A, fold change = 1.62), miR-378a-5p–TLR6 (Toll-like receptor 6, fold change = 2.05), miR-378a-5p–DCP2 (Decapping mRNA 2, fold change = 1.75), miR-378a-5p–ZBTB34 (Zinc Finger And BTB Domain Containing 34, fold change = 3.22) and others.
Based on the mRNA fold change varying from 1.33 to 5.61, we defined three ranges of target gene fold change (low range:1.2–2, middle range:2–3, top range: ≥ 3). Among the changed target genes, 11 genes (ROCK1, STK17B, RAB8B, FBXL5, and others) fell into the low range, 6 genes (TLR2, ACSL4, CAPZA2, SPOPL, SH3GLB1, TLR6) fell into the middle range and 2 genes (BCL2A1, ZBTB34) fell into the top range. Some genes (BCL2A1, TLR2 and TLR6 ) up-regulated at higher level were consistent with our previous ICH blood genomic study. 11
The TargetScan miRNA-target prediction algorithm incorporates current biological knowledge of miRNA-target rules, such as including a seed-match model, evolutionary conservation, and free binding energy.29,34,41 The binding affinity of a predicted miRNA-target pair is scored using cumulative weighted context score (CWCS), a regression model that is trained on sequence and contextual features of the predicted miRNA::mRNA duplex. 29 Lower CWCS score (negative number) indicates higher binding affinity of a miRNA to its target gene. For example, CWCS of miR-93-5p-FBXL5, miR-93-5p-STK17B, miR-93-5p-SPOPL, and miR-93-5p-RAB8B are −0.46, −0.41, −0.32 and −0.18, respectively (TargetScan 7.0). These data suggest the binding affinity of miR-93-5p to its target genes is decreased orderly (miR-93-5p-FBXL5 > miR-93-5p-STK17B > miR-93-5p-SPOPL > miR-93-5p-RAB8B). Our data showed that fold change of target genes may not be consistent with the affinity between miRNA and its target gene, because the affinity is mainly determined by complementary base pairing, 3′-UTR length and other factors. 29 Generally, the cut-off value of CWCS is −0.3, with a CWCS value lower than −0.3 indicating high binding affinity of the miRNA-target pair.34,42,43 However, CWCS score (even lower than −0.3) is insufficient to ensure a miRNA does bind to its predicted target gene, as all algorithm-predicted miRNA-target pairs are putative.
Previous studies demonstrated the binding of miR-146a-5p to 3'UTR of ROCK1 and the binding of miR-146a-5p to 3′UTR of TLR2, using 3′UTR clone-based luciferase reporter assay,44,45 and have been collected in the miRTarBase that contains 360,000 experimentally validated miRNA-target interactions.30,31 These data strongly support our findings of miR-146a-5p-ROCK1 and miR-146a-5p-TLR2 interactions in blood of ICH patients, as the reporter assay provides direct evidence of the binding between a miRNA to 3′UTR of its target gene.
Note that there were three miRNAs consistently regulated in ICH at ≤72 h and ICH at >72 h (down-regulated: miR-221 and mir-4707, and up-regulated let-7d-3p). According to TargetScan 7.0, miR-221 and let-7d-3p have common predicted target genes with high binding affinity (CWSC score < −0.3), such as ABCA8 (ATP Binding Cassette Subfamily A Member 8) and BEND6 (BEN Domain Containing 6). However, neither ABCA8 nor BEND6 mRNA was significantly altered in blood of ICH patients. This is possibly because the effect of down-regulated miR-221 may be counteracted by up-regulated let-7d-3p on their common target genes (ABCA8 and BEND6) after ICH.
Among these miRNA–mRNA pairs, the miR-146a target gene, TLR2, has been extensively studied in inflammation-related diseases including ICH.11,46 We and others previously reported that TLR2 mRNA along with TLR4 mRNA were increased in blood of ICH patients. 11 Wang et al. 46 demonstrated that TLR2 participated in the hemoglobin-induced inflammation via assembly of TLR2 and TLR4 heterodimers in an experimental ICH model. 46
Our data also showed that other miR-146a target mRNAs (ROCK1 and ZNF292) were increased in blood of ICH patients. Although ROCK1 or ZNF292 have not previously been reported to be increased in blood of ICH patients, they have been associated with inflammatory processes which produced BBB disruption in subarachnoid hemorrhage (SAH), ischemic stroke and Alzheimer's disease (AD).47–49 In addition, ROCK1 inhibitors improved outcomes in experimental traumatic brain injury (TBI), stroke, subarachnoid hemorrhage and Alzheimer's Disease models.48–51
A recent study showed that miR-210 decreased in blood of ischemic stroke patients 52 as it did here following ICH. miR-210 was significantly down-regulated in human plasma in patients with unstable carotid stenosis 53 and modulating miR-210 in mice attenuated the infarct size by up-regulating Wnt signaling via APC 53 and suppressing cytokines. 54 miR-210 also modulates neurogenesis and angiogenesis following experimental ischemic stroke,55,56 and might have similar effects in ICH.
The miR-17-92 cluster, related to miR-17, regulates neurogenesis and angiogenesis during development and following ischemic stroke, 57 but has not been studied following ICH. miRNA from the miR-17-92 cluster in exosomes enhances neuroplasticity and improves outcomes following experimental rodent strokes. 58 miR-17 family members down-regulate mitochondrial anti-oxidant enzymes, 59 modulate NF-κB signaling, 60 and play a role in neuronal apoptosis in hypoxic–ischemic rats. 61 A miR-17 family member is elevated in blood of patients with unstable angina and ST-segment elevated myocardial infarction. 62
miR-221 increases in CSF following SAH in patients 63 and decreased in whole blood following ICH in this study both at ≤72 h and at > 72 h. miR-4514 which decreased at > 72 h following ICH, targets the NF-κB inhibitor beta gene which suppresses inflammation. 64 Thus, decreased miR-4514 might promote inflammation following ICH. miR-378 which was also down-regulated following ICH, also regulates inflammatory/ NF-κB pathways.65,66 miR-378 decreases ischemic neuronal injury by down-regulating caspase 367 and modulates neural stem cell proliferation. 68 miR-378 also promotes autophagy and inhibits apoptosis 69 which are important in ICH.
miR-874, decreased at ≤ 72 h in ICH, can regulate angiogenesis via the STAT-3/ VEGF pathways. 70 miR-874 can also modulate cell death via caspase 8. 71 miR-146 regulates B and T cells 72 and has other effects on the immune system, 73 which likely play a role in ICH. miR-532 regulates hypoxia-induced apoptosis 74 and regulates nitric oxide (NO) release. 75 miR-93 targets ULK1, Nrf2, 76 TLR477 and calpain 278 and is down-regulated in blood following ICH.
Though not the focus of this study, seven snoRNA (small nucleolar RNA) were shown to change expression in whole blood following ICH. snoRNAs mainly guide methylation and pseudouridylation of ribosomal RNAs, transfer RNAs and small nuclear RNAs, and can sometimes function as miRNAs. One of the regulated snoRNAs in this study (upregulated in ICH > 72 h vs VRFC) HBII-52-13 (aka SNORD115-13) is downregulated in cerebral cavernous malformations 79 (CCM) which are a cause of ICH, and is also involved in alternative splicing, 80 which we have shown is dysregulated in blood following ICH.11,12
There are several limitations of the study. First, there were no mRNA that were significantly different between ICH and controls at >72 h. This contrasts with our previous study showing many regulated mRNA at times past 48 h following ICH. 11 However, in this study, the sample size for ICH subjects >72 h was smaller, and stringent statistical criteria were applied which resulted in no mRNA being detected. Relaxation of the FDR statistical threshold results in many mRNA regulated after 72 h as previously reported. 11 Though the miRNA–mRNA pairings are theoretically correct (exact base matches in miRNA and mRNA), there are a variety of factors which may act to prevent the regulation of the mRNA by a miRNA, including alternative polyadenylation sites and alternative splicing which can alter or eliminate binding of a miRNA. Thus, direct proof of miRNA regulation of specific mRNA would be needed in future studies. Moreover, future studies will need to examine which cell type(s) in blood express which miRNA, the gene expression-time response, and the impact of hemorrhage size on expression of various miRNAs/mRNAs. Though we performed cross-validation to evaluate the prediction accuracy of the differentially expressed miRNAs and mRNAs, future studies that use qRT-PCR for identified miRNA and mRNA in an independent validation cohort are needed to evaluate sensitivity and specificity of these diagnostic biomarkers.
Supplemental Material
Supplemental Material1 - Supplemental material for MicroRNA and their target mRNAs change expression in whole blood of patients after intracerebral hemorrhage
Supplemental material, Supplemental Material1 for MicroRNA and their target mRNAs change expression in whole blood of patients after intracerebral hemorrhage by Xiyuan Cheng, Bradley P Ander, Glen C Jickling, Xinhua Zhan, Heather Hull, Frank R Sharp and Boryana Stamova in Journal of Cerebral Blood Flow & Metabolism
Supplemental Material
Supplemental Material2 - Supplemental material for MicroRNA and their target mRNAs change expression in whole blood of patients after intracerebral hemorrhage
Supplemental material, Supplemental Material2 for MicroRNA and their target mRNAs change expression in whole blood of patients after intracerebral hemorrhage by Xiyuan Cheng, Bradley P Ander, Glen C Jickling, Xinhua Zhan, Heather Hull, Frank R Sharp and Boryana Stamova in Journal of Cerebral Blood Flow & Metabolism
Footnotes
Funding
The author(s) disclosed receipt of the following financial support for the research, authorship, and/or publication of this article: This study was supported by NIH grants (NS079153, NS101718, NS106950-FRS, BS, BPA) and American Heart Association grants (BGIA27250263-BS, FTF17150006-GCJ).
Acknowledgements
We thank the patients who gave their consent to enter this study.
Declaration of conflicting interests
The author(s) declared no potential conflicts of interest with respect to the research, authorship, and/or publication of this article.
Authors' contributions
Xiyuan Cheng performed the studies, analyzed the data, and wrote the manuscript. Bradley P Ander performed the studies, analyzed data and obtained funding. Glen Jickling designed the study, analyzed the data, and reviewed the manuscript. Xinhua Zhan reviewed the manuscript. Heather Hull performed the studies and analyzed data. Frank Sharp designed the study, analyzed the data, wrote the manuscript and obtained funding. Boryana Stamova analyzed the data, wrote the manuscript and obtained funding.
*These authors contributed equally to this work.
References
Supplementary Material
Please find the following supplemental material available below.
For Open Access articles published under a Creative Commons License, all supplemental material carries the same license as the article it is associated with.
For non-Open Access articles published, all supplemental material carries a non-exclusive license, and permission requests for re-use of supplemental material or any part of supplemental material shall be sent directly to the copyright owner as specified in the copyright notice associated with the article.