
Abstract
Striatal dopamine transporter (DAT) deficiency and abnormal expression of Parkinson's disease (PD)-related pattern (PDRP) have been observed in patients with idiopathic REM sleep behavior disorder (IRBD). This study aimed to investigate the correlations between these two measures with comparison to PD using a dual tracer imaging design. Age-matched 37 IRBD patients, 86 PD patients, and 15 control subjects underwent concurrent PET scans with 11C-CFT to quantify dopaminergic dysfunction and 18F-FDG to quantify PDRP expression. IRBD patients were divided into two subgroups: those with relatively normal (IRBD-RN) or abnormal (IRBD-AB) striatal DAT binding. Significantly decreased DAT binding and increased PDRP scores were present in all patient groups, except for IRBD-RN, relative to the controls. There was a significant effect of hemisphere and hemisphere × group interaction for DAT binding but not for PDRP expression. Significant correlations were observed between DAT binding and PDRP expression in the IRBD-AB and PD groups but not in the IRBD-RN group. IRBD patients present with an intermediate state in striatal DAT distribution and PDRP activity between PD and normal controls. The modest correlations between the two measures in both IRBD and PD suggest that differences in network activity cannot be fully explained by nigrostriatal dopaminergic denervation.
Keywords
Introduction
Parkinson's disease (PD) is now considered a Lewy body disorder that has a prodromal period of years or even decades. During this phase of the disease, neuropathological changes are thought to exist before typical motor symptoms occur. Several features including olfactory loss, constipation, depression and rapid-eye-movement (REM) sleep behavior disorder (RBD) have been shown in previous studies to antedate typical motor symptoms of PD by several years.1,2 Apart from RBD, these features are common in the general population and are often associated with non-neurological disorders, not PD.
The idiopathic type of RBD (IRBD) is a parasomnia characterized by dream enactment behaviors during REM sleep and is associated with the absence of normal muscle atonia. 3 Previous cohort studies showed that most patients with IRBD developed Lewy body disorders including PD, dementia with Lewy bodies and less frequently, multiple system atrophy.4,5 However, the period of conversion from estimated RBD onset to a diagnosis of defined neurodegenerative disorder can vary greatly.2,4,6 This result might be caused by the heterogeneity of the IRBD, the pathogenesis of which remains unclear. Thus, the detection of biomarkers showing any early pathological changes in this special prodromal stage is a high priority.
One of the most important pathological hallmarks of PD is the progressive loss of nigral dopaminergic neurons and their input to the striatum. Functional neuroimaging of dopamine transporter (DAT) to evaluate presynaptic nigrostriatal function has consistently shown that striatal tracer uptake decreased with disease progression.7,8 However, brain dysfunction in PD is not limited to dopamine loss in the nigrostriatal pathway. Spatial covariance analysis of resting-state glucose metabolic images has been used to identify specific large-scale brain network patterns associated with motor and cognitive symptoms in PD patients.9,10 A PD-related pattern (PDRP), which exhibits significantly elevated expression in PD patients relative to normal controls as well as a consistent linear relationship with standardized motor ratings in multiple patients cohorts, has been identified in our previous study. 11 Both dopaminergic and metabolic imaging approaches have also been applied in patients with IRBD. Of note, impaired integrity of the dopaminergic nigrostriatal pathway has been observed by DAT imaging in IRBD patients, which indicates increased short-term risk for development of synucleinopathies.12,13 Moreover, abnormal changes in PDRP expression have been reported in IRBD patients,14–16 which shows that higher baseline expression is associated with a greater likelihood of developing PD or dementia with Lewy bodies.
As for the relationship between DAT binding and PDRP expression in the same individuals with IRBD, one recent study reported no significant correlation between the two measures. 15 However, due to the relatively small sample size of the study, the result was inclusive. With larger sample sizes, we investigated the abnormalities in striatal DAT distribution and PDRP activity as well as the correlations between the two measures in the same IRBD patients in comparison to PD patients. DAT imaging using 11C-CFT with positron emission tomography (PET) and network analysis using 18F-FDG PET imaging were performed in this dual tracer imaging study.
Materials and methods
Participants
Demographics of the subjects.
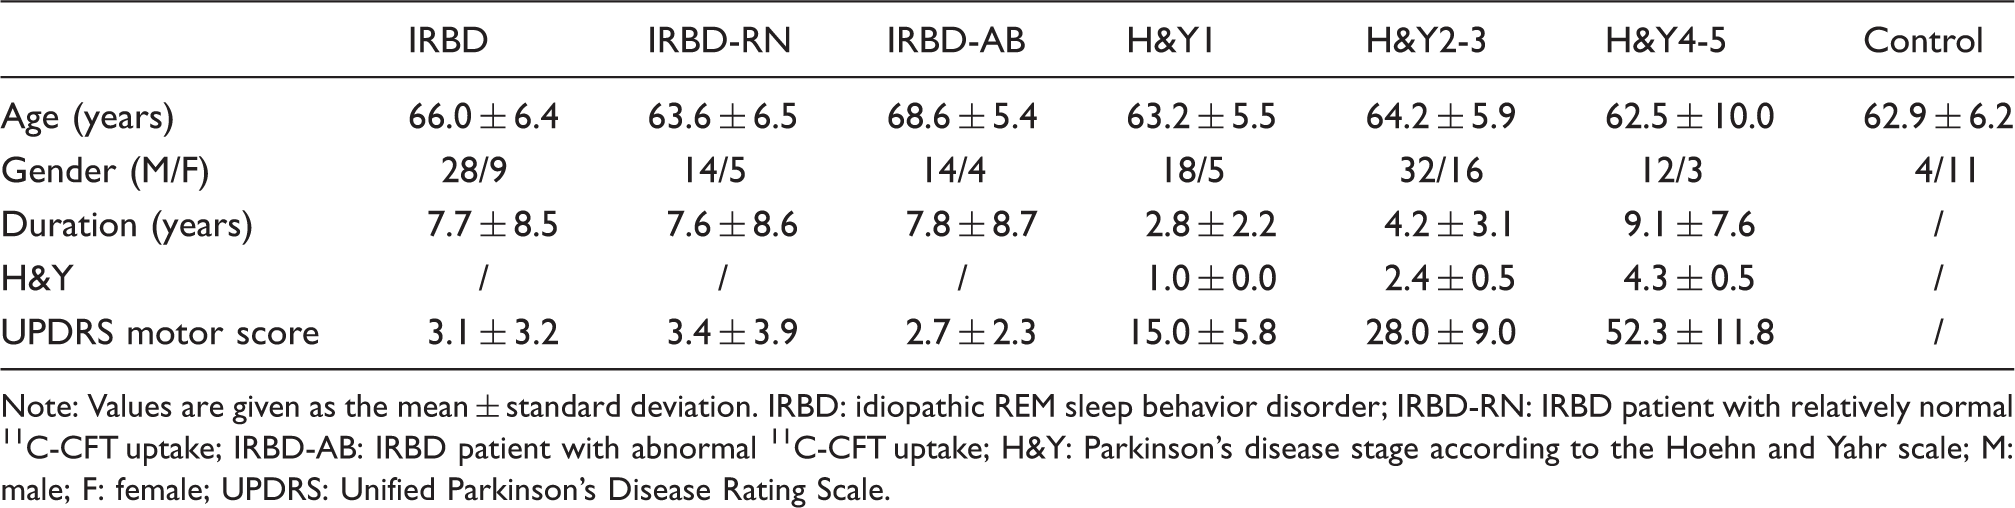
Note: Values are given as the mean ± standard deviation. IRBD: idiopathic REM sleep behavior disorder; IRBD-RN: IRBD patient with relatively normal 11C-CFT uptake; IRBD-AB: IRBD patient with abnormal 11C-CFT uptake; H&Y: Parkinson's disease stage according to the Hoehn and Yahr scale; M: male; F: female; UPDRS: Unified Parkinson's Disease Rating Scale.
All IRBD patients performed overnight video-polysomnographic recordings in our sleep laboratory as described in our previous study. 17 The diagnosis of IRBD was made according to the criteria of the Third Edition of the International Classification of Sleep Disorders. 18 All IRBD patients underwent the Unified Parkinson's Disease Rating Scale (UPDRS) motor examination (items 18–31), which was used as an index of parkinsonian signs. The examination was performed within 2 h before a 18F-FDG PET scan and over 36 h after cessation of clonazepam (if used). These patients had no evident parkinsonism (UPDRS motor score 3.1 ± 3.2) and took no psychotropic medications, including antidepressants and anxiolytics.
The diagnosis of PD was made based on the UK Brain Bank criteria 19 and was reconfirmed according to the Movement Disorder Society clinical diagnostic criteria. 20 The UPDRS motor rating and Hoehn and Yahr scale (H&Y) were assessed within 2 h before the 18F-FDG PET scan and over 12 h after cessation of oral anti-parkinsonian medications (if used). PD patients were further divided into three subgroups according to their disease severity as mild (H&Y stage 1, H&Y1, 23 patients), moderate (H&Y2-3, 48 patients) and advanced (H&Y4-5, 15 patients) stages. Among all PD patients, 50% (43/86) tested positive for the RBD Single-Question Screen, 21 which was consistent with a previous study. 22
The normal controls tested negative for the RBD Single-Question Screen 21 and underwent the same clinical screening procedures as the IRBD patients. The following exclusion criteria were used: (1) a history of neurological or psychiatric illness; (2) prior exposure to neuroleptic agents or drug use; (3) an abnormal neurological examination.
The study was approved by the Ethics Committee of Huashan Hospital in Shanghai, China. All procedures performed in this study were in accordance with the ethical standards of the institutional research committee and with the Helsinki Declaration of 1975 and its later amendments. All subjects or a legally responsible relative gave written informed consent before the study.
PET imaging
PET images were acquired using a Siemens Biograph 64 PET/CT scanner (Siemens, Munich, Germany) in 3D mode. All subjects were asked to fast for at least 6 h before tracer injection. A CT transmission scan was first performed for attenuation correction. For dopaminergic imaging, the distribution of DAT was measured 60 min after the intravenous injection of 370 MBq of 11C-CFT and lasted for 15 min. For metabolic imaging, cerebral glucose metabolism at rest was measured 60 min after the injection of 185 MBq of 18F-FDG and lasted for 10 min. Only relative glucose metabolism was measured in our study given that arterial blood sampling was not performed for quantitative measurement. All subjects lay comfortably in a supine position in a room with dimmed lighting and low background noise during the scanning procedure. PET scans were registered on consecutive days with a delay of no longer than two weeks between scans.
Image analysis
All images were analyzed by experienced nuclear medicine physicians blinded to the clinical diagnosis and were preprocessed using SPM5 software (Wellcome Department of Imaging Neuroscience, Institute of Neurology, London, UK) and then processed using ScanVP software Version 5.9.1 (Centre for Neuroscience, the Feinstein Institute for Medical Research, Manhasset, NY) 23 implemented in Matlab7.4 (Mathworks Inc., Sherborn, MA, USA).
For DAT imaging, a template for spatial normalization was created by using 11C-CFT PET and corresponding MR T1 images of another group of 16 normal controls. The detailed procedure was described in our previous study. 24 All 11C-CFT PET images in the current study were spatially normalized with the template and then smoothed. Anatomically based regions-of-interest for the caudate nucleus, anterior putamen, and posterior putamen along the longitudinal axis and for the occipital cortex were placed on the mean image summed over the central striatal slices and were individually adjusted for each subject.10,25 For each 11C-CFT PET scan, caudate and putamen DAT binding was estimated for each hemisphere by the striatal-to-occipital ratio (SOR), defined as (striatum-occipital)/occipital counts, and these values were also averaged across hemispheres. 10 For the patients, those with a SOR value in any subregion of the striatum on each hemisphere below two or more standard deviations from the corresponding mean value of the control group were considered abnormal.26,27 To perform the investigations further on a hemispheric basis, according to the UPDRS motor scores and reconfirmed with DAT binding obtained above, scans from the PD patients with predominantly right-sided symptoms were flipped before a second analysis so that all hemispheres contralateral to the clinically more affected limbs appeared on the right side of the brain. Scans from the IRBD patients with abnormal DAT binding were also flipped accordingly based on the DAT binding of the posterior putamen. For scans from normal controls and IRBD patients with relatively normal DAT binding, randomized flips were performed.
The detailed preprocessing of 18F-FDG images was as described previously. 11 The scans of 18F-FDG were flipped accordingly with the corresponding DAT scans. Based on the PDRP we identified, 11 the network expression in individual subjects was quantified prospectively on a hemispheric basis using a voxel-based topographic profile rating algorithm. 23 The hemispheric network expression in each PET scan was represented by a Z-transformed score by using the averaged subject scores of the left and right hemispheres of the normal controls.
Statistical analysis
Differences in regional 11C-CFT uptake and PDPR values among patient groups and normal controls were assessed by using one-way ANOVA with post hoc Bonferroni tests. The effect of the hemispheres and hemisphere × group interaction was evaluated by two-way ANOVA using a general linear model with repeated measures. Correlations between regional 11C-CFT uptake, network expression and UPDRS motor ratings (PD only) were evaluated using Pearson correlation coefficients while correlations of imaging markers with H&Y stages (PD only) were assessed using Spearman's rho correlation coefficient. All analyses were performed using SPSS software (SPSS, Chicago, IL, USA) and considered significant at p < 0.05.
Results
Dopaminergic integrity
Based on the DAT binding, IRBD patients were divided into two subgroups: IRBD with relatively normal 11C-CFT uptake (IRBD-RN, n = 19) and IRBD with abnormal 11C-CFT uptake (IRBD-AB, n = 18). For the IRBD-AB group, the mean age was slightly higher than the other groups but no significant difference was observed across groups (p = 0.065, one-way ANOVA). Of the patients with IRBD-AB, 10 subjects showed reduced SOR values in the caudate nucleus, 11 in the anterior putamen and all in the posterior putamen. All subjects with reduction of DAT binding in the caudate nucleus exhibited concurrent reduction in the anterior putamen.
Group differences were observed in the averaged SOR values of DAT binding in the caudate nucleus (p < 0.001, one-way ANOVA). Compared with the control group, significant decreases were present in all patient groups (p < 0.001, post hoc Bonferroni tests) except for IRBD-RN. There was a significant effect of hemisphere (p < 0.001, two-way RMANOVA) and hemisphere × group interactions (p = 0.02). Caudate DAT binding was significantly lower in the more affected hemisphere (p < 0.01, paired t-tests) in each PD group but no asymmetry was found in the control and IRBD groups. The SOR values (both averaged and hemispheric) in the caudate decreased gradually from IRBD-RN to PD H&Y4-5 (Figure 1 and Table 2).
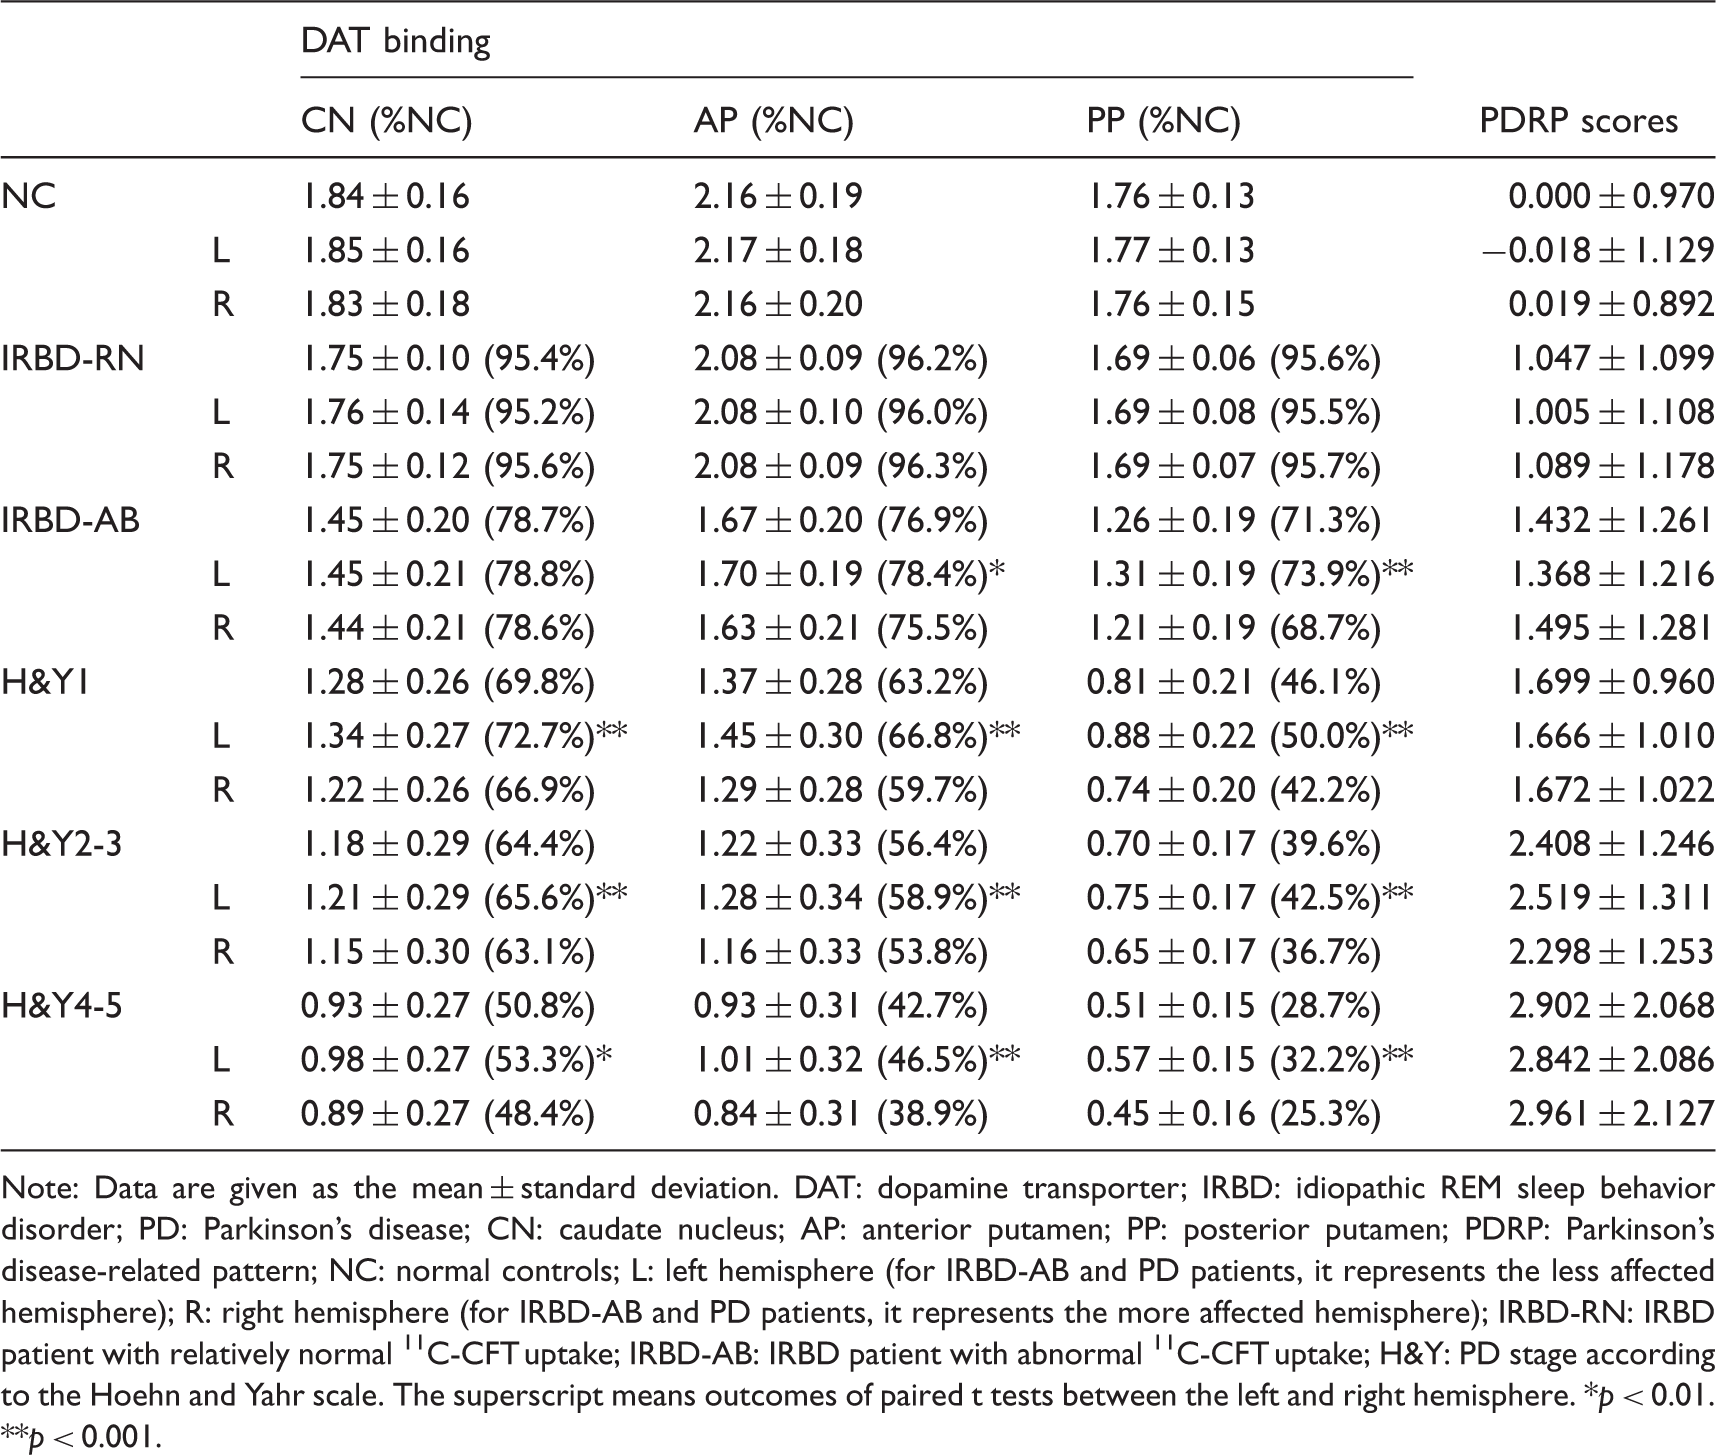
DAT binding in different patient groups and normal controls: Gradual decrease of DAT binding was present in each subregion of the striatum (A1–A3) (B1–B3) (C1–C3). The error bars represent the standard deviation. DAT: dopamine transporter; NC: normal controls; IRBD: idiopathic REM sleep behavior disorder; IRBD-RN: IRBD patient with relatively normal 11C-CFT uptake; IRBD-AB: IRBD patient with abnormal 11C-CFT uptake; H&Y: PD stage according to the Hoehn and Yahr scale; CN: caudate nucleus; AP: anterior putamen; PP: posterior putamen; L: left hemisphere (for IRBD-AB and PD patients, it represents the less affected hemisphere); R: right hemisphere (for IRBD-AB and PD patients, it represents the more affected hemisphere). DAT binding and network expression in normal controls and patients with IRBD or PD. Note: Data are given as the mean ± standard deviation. DAT: dopamine transporter; IRBD: idiopathic REM sleep behavior disorder; PD: Parkinson's disease; CN: caudate nucleus; AP: anterior putamen; PP: posterior putamen; PDRP: Parkinson's disease-related pattern; NC: normal controls; L: left hemisphere (for IRBD-AB and PD patients, it represents the less affected hemisphere); R: right hemisphere (for IRBD-AB and PD patients, it represents the more affected hemisphere); IRBD-RN: IRBD patient with relatively normal 11C-CFT uptake; IRBD-AB: IRBD patient with abnormal 11C-CFT uptake; H&Y: PD stage according to the Hoehn and Yahr scale. The superscript means outcomes of paired t tests between the left and right hemisphere. *p < 0.01. **p < 0.001.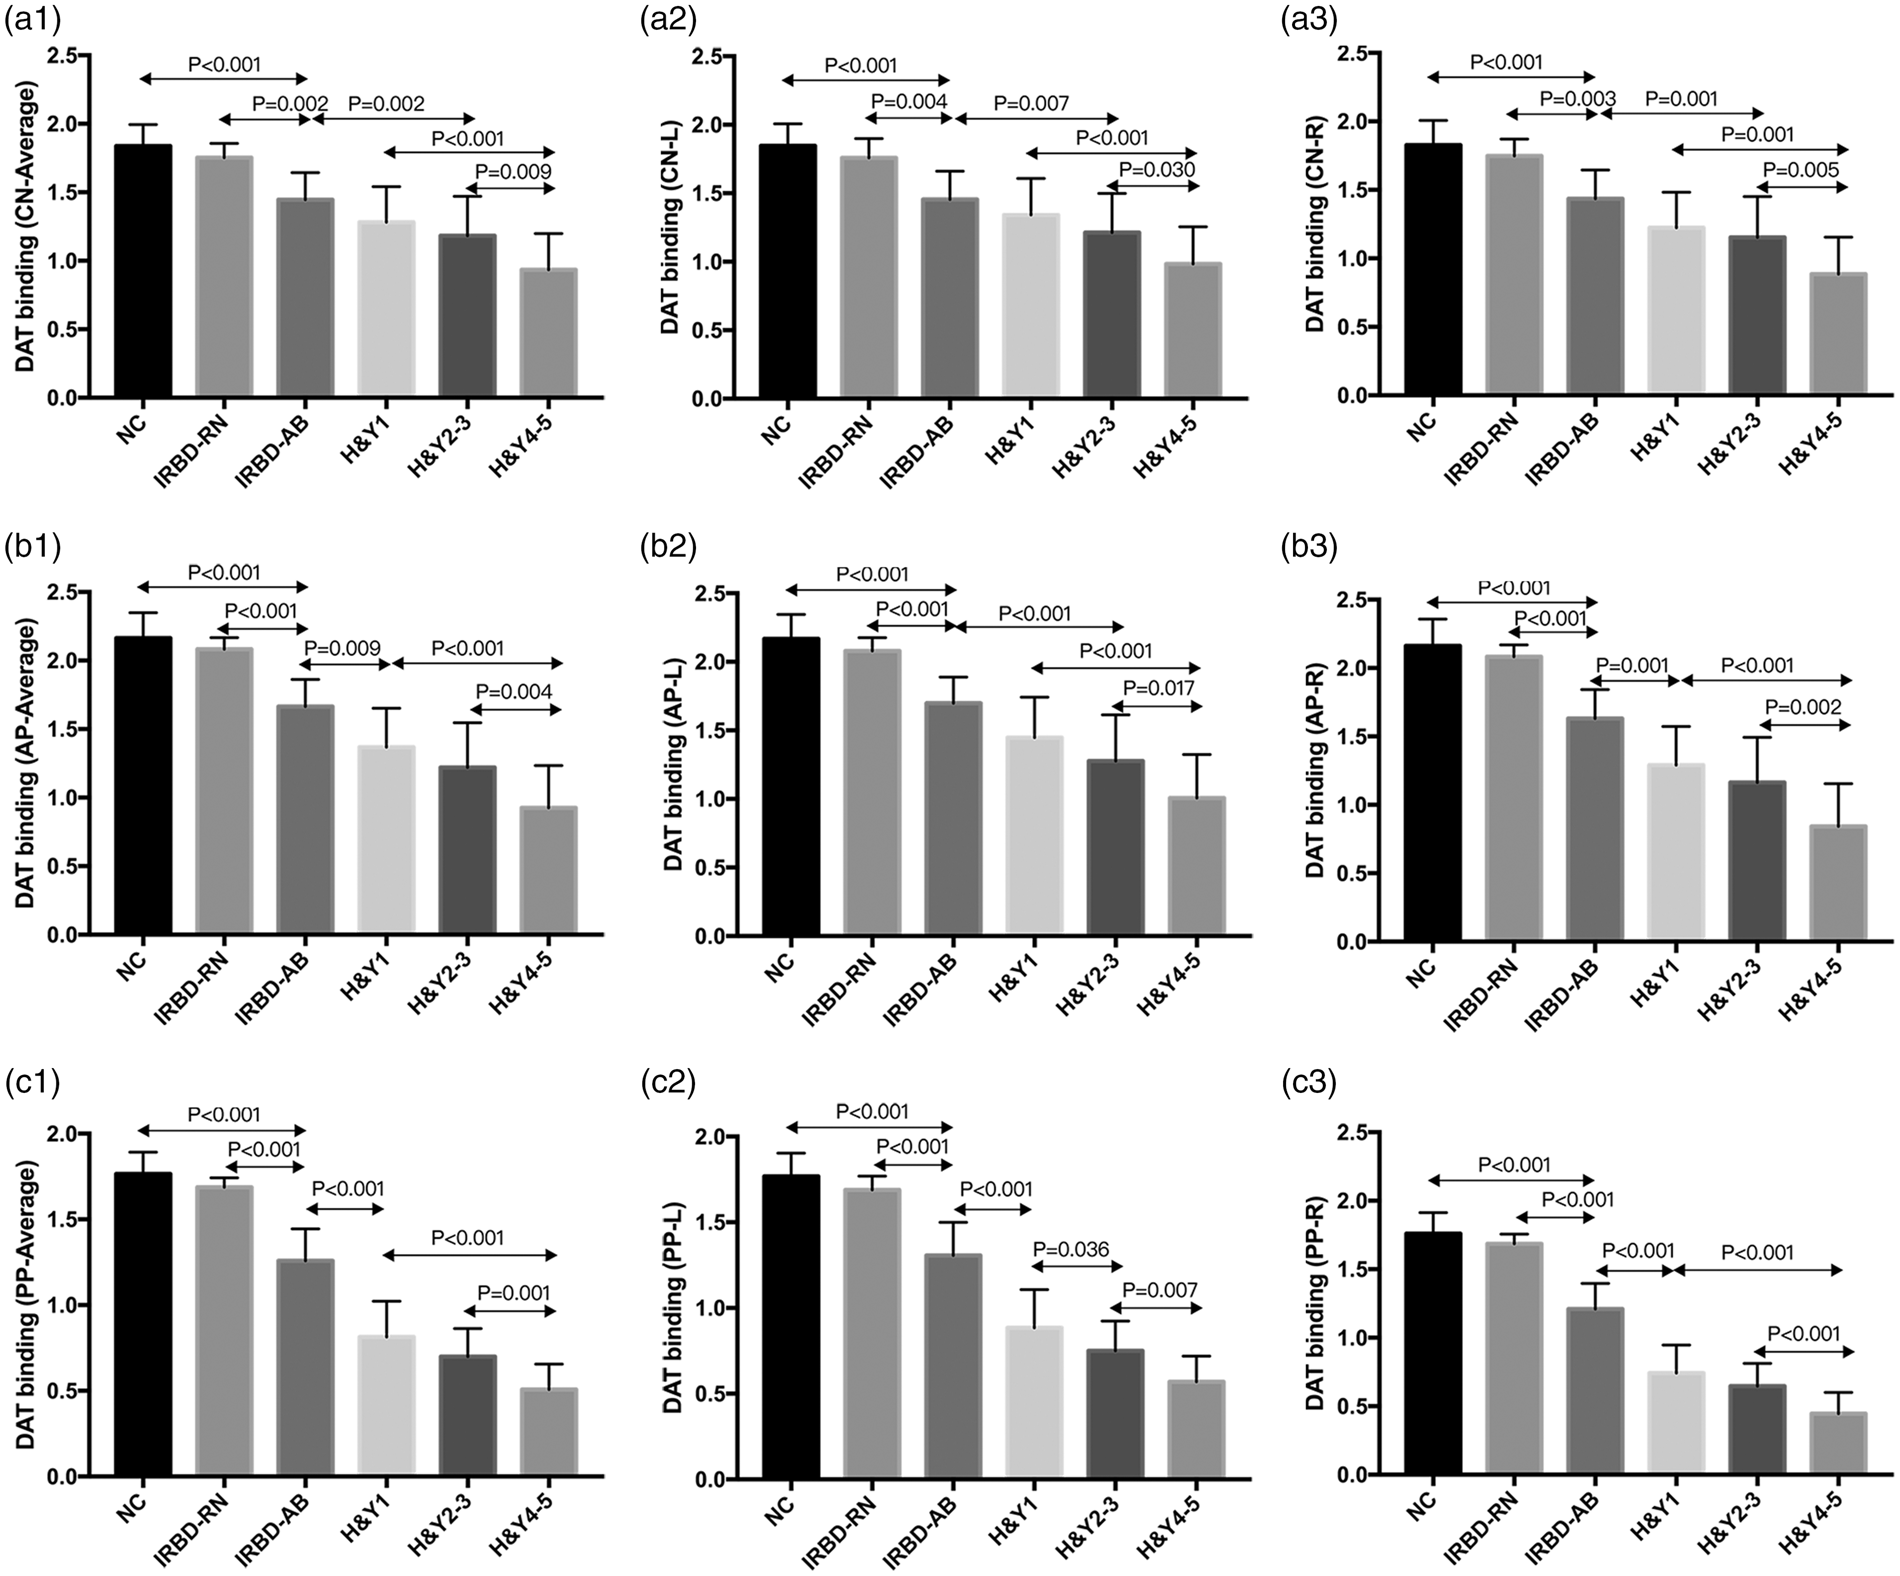
Group differences were also observed in the averaged SOR values of DAT binding in both the anterior and posterior putamen (p < 0.001, one-way ANOVA). Compared with the control group, a significant decrease was present in all patient groups (p < 0.001, post hoc Bonferroni tests) except for the IRBD-RN. There was also a significant effect of hemisphere (p < 0.001, two-way RMANOVA) and hemisphere × group interaction (p < 0.001). DAT binding in the putamen was significantly lower in the more affected hemisphere in each PD group (p < 0.001, paired t-tests) and the IRBD-AB group (p = 0.002 for the anterior putamen, p < 0.001 for the posterior putamen) but no asymmetry was found in the control and IRBD-RN groups. The SOR values (both averaged and hemispheric) in the putamen also decreased gradually from IRBD-RN to PD H&Y4-5 (Figure 1 and Table 2).
The percentages of DAT binding of all patient groups compared to the normal controls are shown in Table 2. Regardless of hemispheric or averaged SOR values, dopaminergic depletion was most pronounced in the posterior putamen relative to the caudate and anterior putamen in the IRBD stage. In cases of averaged SOR values from IRBD-RN to PD H&Y1, the percentage decreased by 25.6% in the caudate nucleus, 33.0% in the anterior putamen and 49.5% in the posterior putamen. In contrast, the percentage decreased by 19.0% in the caudate nucleus, 20.5% in the anterior putamen and 17.4% in the posterior putamen from PD H&Y1 to H&Y4-5.
Network expression
PDRP expression in different groups is presented in Figure 2 and Table 2. The averaged network scores differed significantly across groups (p < 0.001, one-way ANOVA). Compared with the control group, a significant increase was present in all patient groups (p < 0.05, post hoc Bonferroni tests) except for the IRBD-RN. No significant effect of hemisphere (p = 0.668, two-way RMANOVA) or hemisphere × group interaction (p = 0.229) was observed. The network scores (both averaged and hemispheric) increased gradually from IRBD-RN to PD H&Y4-5.
The network expression in different patient groups and normal controls: Gradual increase of the network expression was present from group IRBD-N to PD H&Y4-5. A, B, and C represent averaged, left and right hemispheric PDRP scores, respectively. The error bars represent the standard deviation. NC: normal controls; IRBD: idiopathic REM sleep behavior disorder; IRBD-RN: IRBD patient with relatively normal 11C-CFT uptake; IRBD-AB: IRBD patient with abnormal 11C-CFT uptake; H&Y: PD stage according to the Hoehn and Yahr scale; PDRP: Parkinson's disease-related pattern; L: left hemisphere (for IRBD-AB and PD patients, it represents the less affected hemisphere); R: right hemisphere (for IRBD-AB and PD patients, it represents the more affected hemisphere).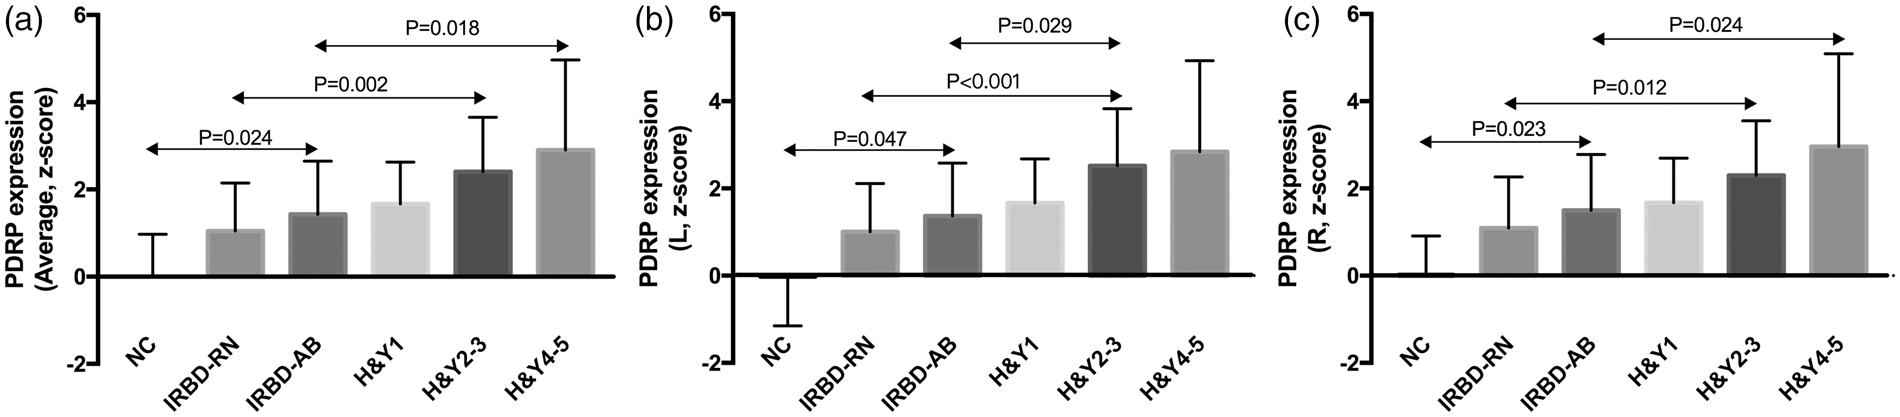
Relationships between striatal DAT binding and network expression
Correlation between DAT binding and network activity in the whole IRBD group.
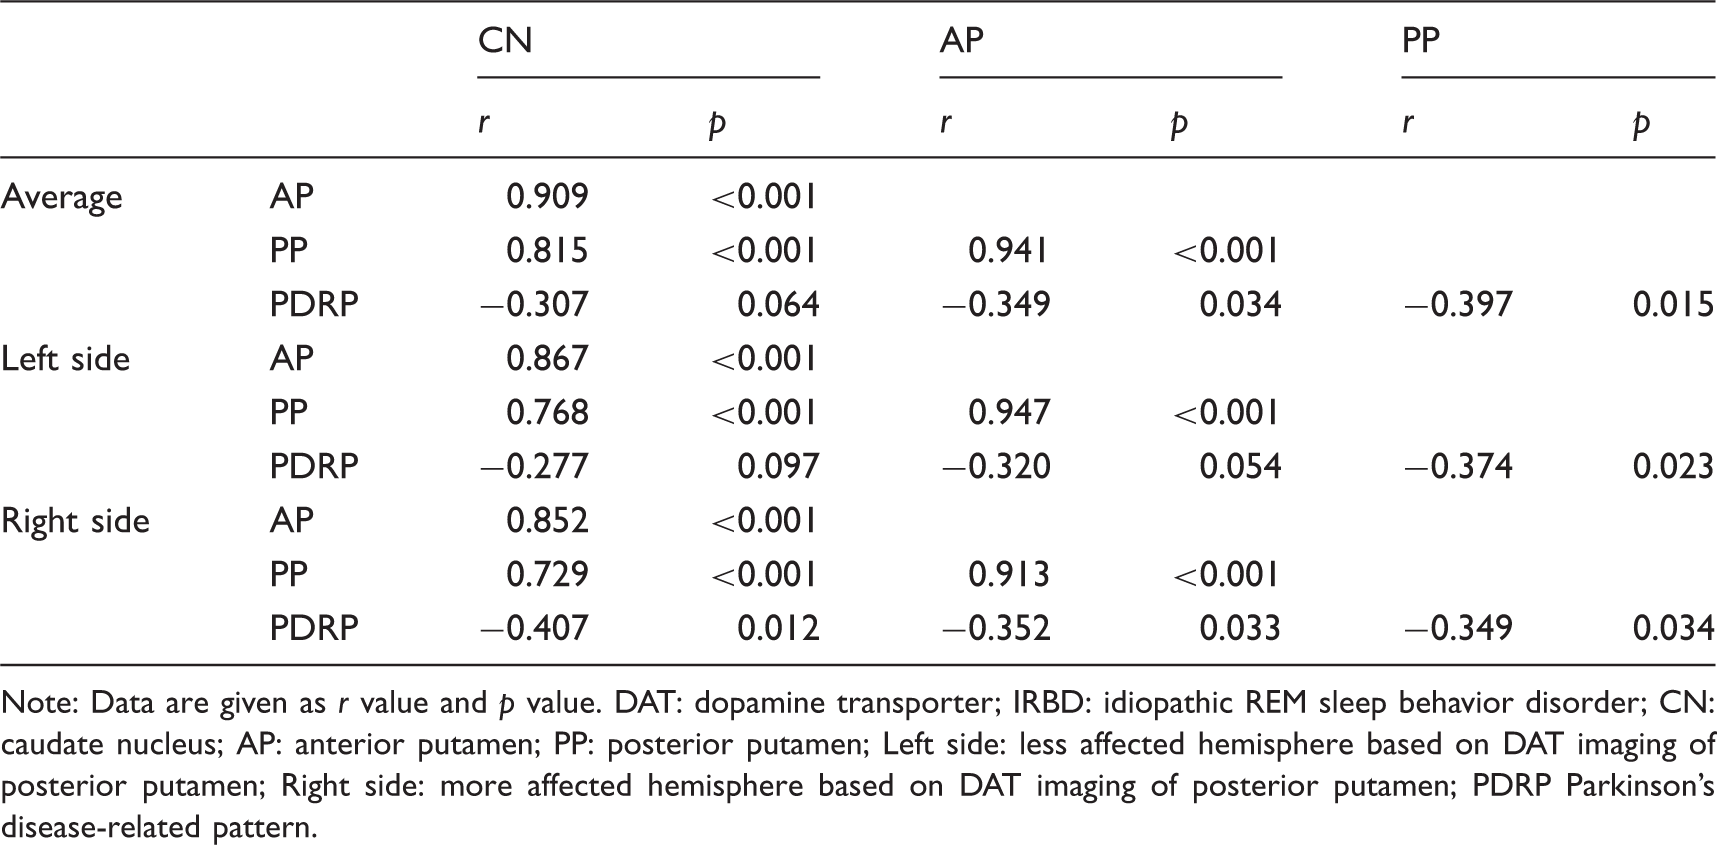
Note: Data are given as r value and p value. DAT: dopamine transporter; IRBD: idiopathic REM sleep behavior disorder; CN: caudate nucleus; AP: anterior putamen; PP: posterior putamen; Left side: less affected hemisphere based on DAT imaging of posterior putamen; Right side: more affected hemisphere based on DAT imaging of posterior putamen; PDRP Parkinson's disease-related pattern.
Correlation between DAT binding and network activity in the IRBD-AB group.
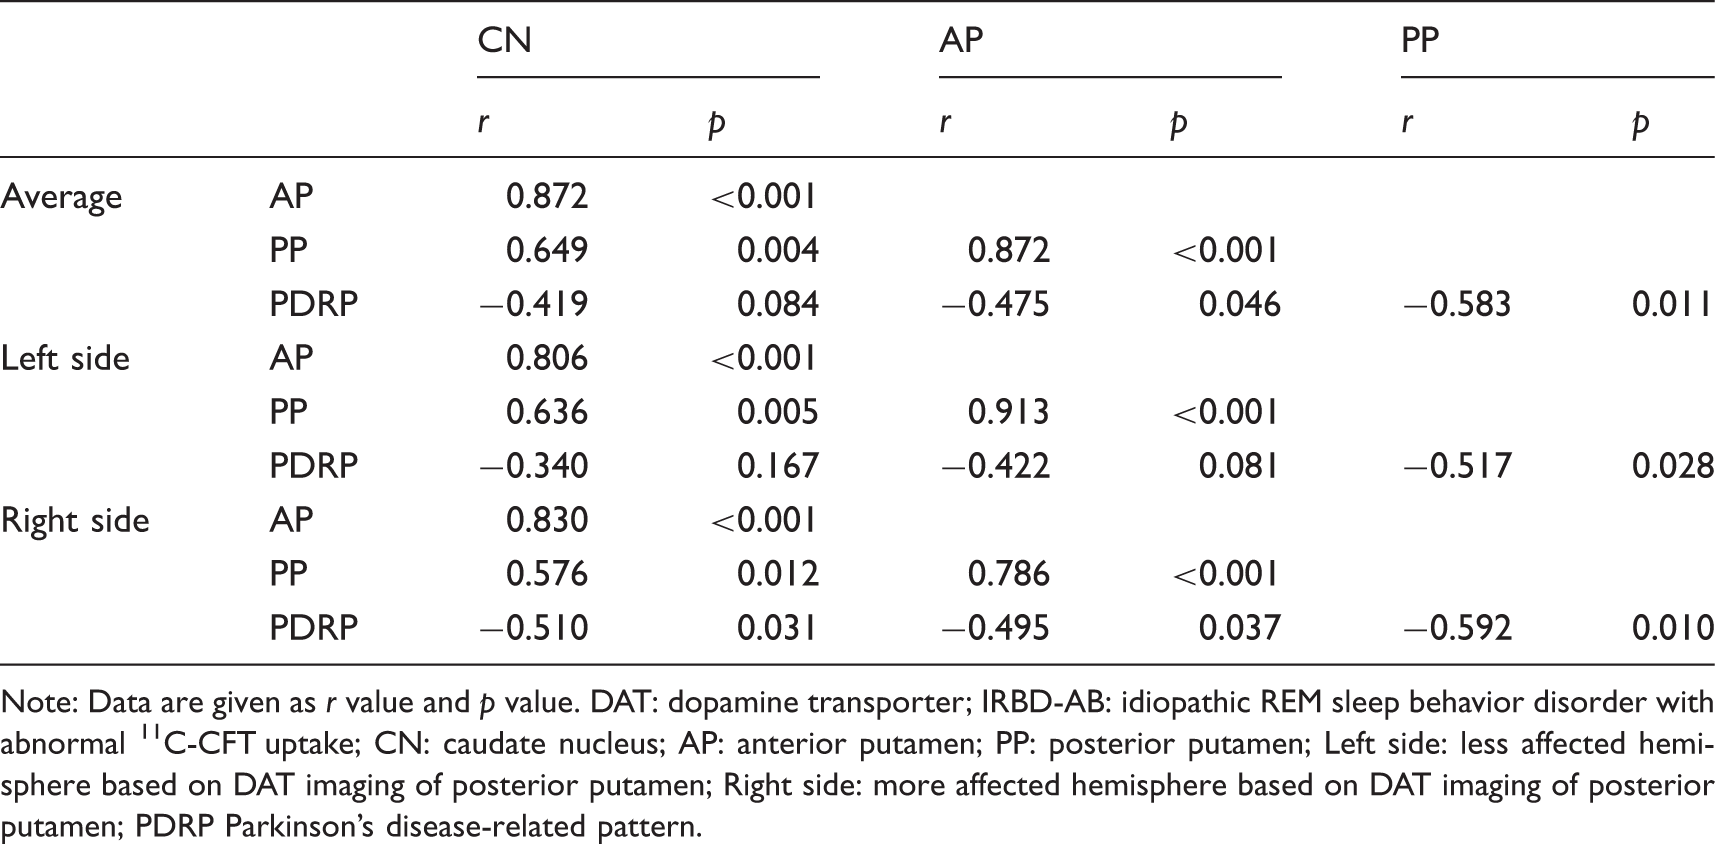
Note: Data are given as r value and p value. DAT: dopamine transporter; IRBD-AB: idiopathic REM sleep behavior disorder with abnormal 11C-CFT uptake; CN: caudate nucleus; AP: anterior putamen; PP: posterior putamen; Left side: less affected hemisphere based on DAT imaging of posterior putamen; Right side: more affected hemisphere based on DAT imaging of posterior putamen; PDRP Parkinson's disease-related pattern.
Correlation between DAT binding and network activity in the whole PD group.
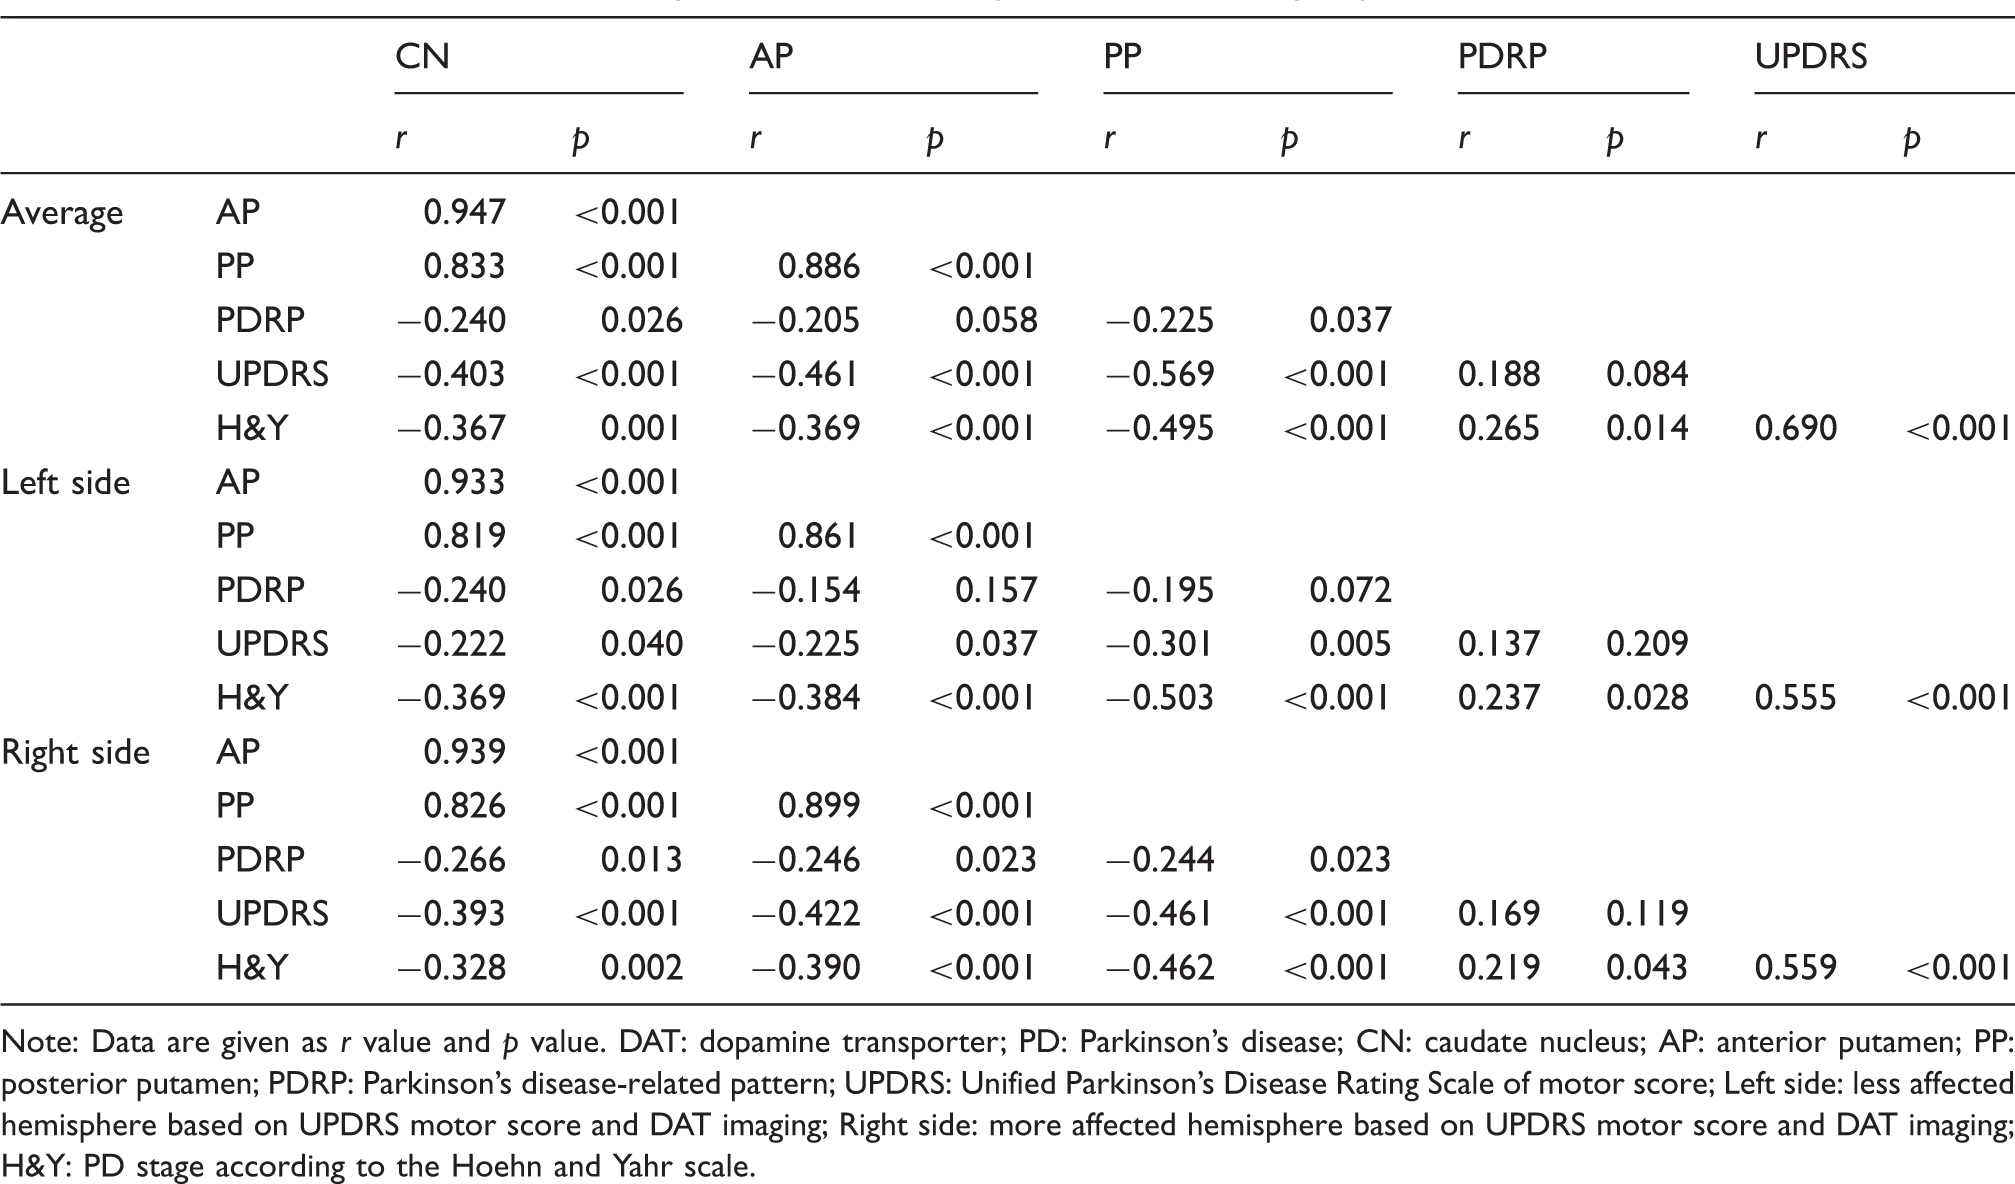
Note: Data are given as r value and p value. DAT: dopamine transporter; PD: Parkinson's disease; CN: caudate nucleus; AP: anterior putamen; PP: posterior putamen; PDRP: Parkinson's disease-related pattern; UPDRS: Unified Parkinson's Disease Rating Scale of motor score; Left side: less affected hemisphere based on UPDRS motor score and DAT imaging; Right side: more affected hemisphere based on UPDRS motor score and DAT imaging; H&Y: PD stage according to the Hoehn and Yahr scale.
Discussion
In the current study, we provided important data on the relationship between abnormal metabolic network expression and dopaminergic dysfunction in the same IRBD patients using a dual tracer imaging design.
In our study, the IRBD patients were divided into two subgroups based on their dopaminergic integrity. We found that 48.6% (18/37) of the patients presented with significantly decreased 11C-CFT uptake. This percentage was slightly higher than a previous report of 20–40% with DAT-SPECT imaging,13,27,28 which might be explained by the application of PET imaging with higher resolution and better delineation of regions-of-interest. 27 Consistent with previous studies, our study showed an overall gradual rostral-caudal reduction of 11C-CFT uptake in both IRBD and PD patients.26,28–30 Similar to that typically observed in PD, the reduction of DAT binding in IRBD (mainly in patients with IRBD-AB) was most severe in the posterior putamen, indicating that it can be a more sensitive area than the caudate nucleus and anterior putamen in measuring the progression of dopaminergic dysfunction in IRBD patients. A previous study showed that IRBD patients with decreased DAT binding in the striatum were at increased risk for development of synucleinopathies. 13 Thus, we could speculate that for patients with IRBD, different subtypes or stages exist and lead to the variable conversion periods among them. Longitudinal follow-up of our IRBD patients will be needed to reveal whether a greater reduction in 11C-CFT uptake in the striatum, especially in the posterior putamen, is a marker for short-term conversion to a specific type of synucleinopathy.
The mean decrease of DAT binding in IRBD patients compared with controls was 13.3% in the anterior putamen and 16.2% in the posterior putamen. This result is lower than a previous study that showed 24.6% putaminal decrease. 27 The difference may be due to the patient selection because 90% of the IRBD patients in the previous study showed abnormally decreased 18F-DOPA uptake, which was closer to the findings from the IRBD-AB subgroup (23.1% in the anterior putamen and 28.7% in the posterior putamen) in our study. The percentage of decrease in 11C-CFT uptake compared to the normal controls in the posterior putamen was most significant (49.5%) from the IRBD-RN group to the PD H&Y1 group for the emergence of PD motor symptoms, while the decrease across all of the PD groups was only 17.4%. These results accord well with the incipient floor effect in the putamen observed in PD patients with presynaptic dopaminergic tracers.10,31 Our results suggested that the most DAT loss happens in the RBD stage and thus IRBD patients would be the ideal targets for clinical trials to test new therapeutic strategies aiming to halt or delay disease progression in its earliest stage.
Like PD, apart from the dopaminergic dysfunction, widely distributed metabolic abnormalities may exist in IRBD as previously indicated.16.32 In our study, PDRP expression values were abnormally elevated in both IRBD (p = 0.007, one-way ANOVA, post hoc Bonferroni tests) and PD patients (p < 0.001) compared to normal controls and a gradual increase of PDRP expression was observed from IRBD to PD and with the disease progression of PD, which was in line with previous studies.14–16 However, no significant difference was observed between the RBD subgroups and the H&Y1 group, which is in good agreement with a previous finding that the elevation of PDRP expression in IRBD was slightly lower or comparable to patients with early PD. 16 It is notable that, compared with the control group, the significant changes of DAT binding and PDRP expression both happened in the IRBD-AB group but not in the IRBD-RN group. The simultaneous shift of the two measures in our study indicated that the increase of network expression could be an early prognostic factor similar to the decrease of DAT binding. Further study with increased sample sizes may reveal which one has better diagnostic value.
Our study showed a significant effect of hemisphere and hemisphere × group interaction for striatal DAT binding but not for PDRP expression. These results are consistent with a previous longitudinal study performed in a group of hemiparkinsonian patients who underwent serial metabolic and dopaminergic imaging with 18F-FDG PET and 18F-FPCIT PET, respectively. 31 Similar interhemispheric asymmetry was present in the IRBD-AB and PD groups in our study, which also suggested that IRBD-AB is on the spectrum of PD development.
In the PD patients, significant but weak correlations were observed between PDRP expression and DAT binding in the striatum, which is in accordance with previous studies.33,34 For patients with IRBD, a recent study has shown no significant correlation between PDRP expression and DAT binding, but a trend was observed. 15 However, in our study, with more detailed region of interests (ROIs) and further subgroup analysis, significant correlations between the two measures were observed in the anterior and posterior putamen in the whole IRBD and IRBD-AB group, especially in the posterior putamen on the more affected hemisphere (r = −0.592, p = 0.01), which was even stronger than in PD. In contrast, no significant correlation was found in IRBD-RN patients. Such a difference between the two studies might exist because of the higher resolution of PET than SPECT in DAT imaging and more information could be provided due to the more detailed ROIs in our study. In addition, with a larger sample of patients, subgroup analysis could be performed in our study that can provide extra information. In addition, the differences in the correlation between dopaminergic dysfunction and network expression might partly result from the course of disease progression. For the IRBD-RN group, the insignificant correlation could be caused by the insignificant decrease of DAT binding along with the insignificant increase of PDRP expression. For the IRBD-AB group, the greatest amount of decrease in 11C-CFT uptake was correlated with a significant increase of PDRP scores, which explained their strongest correlation among all patient groups. When the trend in a decrease in DAT binding slowed down across the PD groups, while the PDRP scores kept increasing, the correlation weakened accordingly. However, the overall weak correlations between the two measures may indicate that they indeed represent different pathophysiological aspects of disease. A previous study 35 indicated, in contrast to the striatal dopaminergic input exhibited by DAT imaging, that abnormal elevations of PDRP expression were more indicative of disease-related alterations in basal ganglia efferent activity modulated by the subthalamic nucleus. 36 Moreover, the cortical metabolism changes in PDRP topography may reflect the abnormal accumulation of α-synuclein in key network regions. 37 Taken together, PDRP networks may incorporate more pathophysiological factors that are not captured by only DAT imaging. 38 Moreover, the significant negative correlations between the striatal DAT binding and UPDRS motor scores in the PD patients in our study were also consistent with previous studies28,39 and suggest that DAT imaging can be a feasible biomarker for assessing motor dysfunction in PD.
A prospective study showed that almost all IRBD patients would eventually develop synucleinopathies over time, 4 indicating that IRBD is an intermediate stage of a defined neurodegenerative syndrome in most cases, which could be supported to a certain extent by our cross-sectional data on IRBD patients with comparison to PD. The different changes of dopaminergic dysfunction and network expression in the IRBD group might also be helpful to predict the conversion of the disease. For IRBD patients with decreased DAT binding, the continual increase of PDRP scores may indicate a higher possibility of PD while lower network expression might be associated with multiple system atrophy.14,40 We speculated that the IRBD patients with significant decreased striatal DAT binding along with elevated PDRP scores might be at short-term risk for developing symptomatic PD, and thus should be the best target for potential neuroprotective therapies to take the greatest effect.41,42 This could be validated by prospective follow-up of the IRBD-AB patients.
There were limitations to our study. First, this was a cross-sectional study. A longitudinal follow-up of our IRBD cohort is ongoing. Second, the proportion of female to male subjects in the control group was larger compared to other groups. To verify the impact of gender differences, an additional two groups of normal subjects were analyzed with only one scan performed (either 18F-FDG or 11C-CFT). No significant difference in either PDRP scores or DAT bindings was found between genders when age matched as shown in the Supplementary Table 1. This result is consistent with a previous study. 15 Lastly, our study mainly concentrated on the relationship between IRBD and PD, while IRBD can develop into other synucleinopathies such as dementia with Lewy bodies and multiple system atrophy. These diseases should be included in the analysis in a future study with long-term follow-up and a larger sample size.
To sum up, IRBD patients could be divided into two subgroups based on DAT binding: IRBD-RN and IRBD-AB. DAT binding values in the striatum gradually decreased from IRBD-RN to advanced PD along with the gradual increase in PDRP expression. The overall modest correlations between dopaminergic dysfunction and abnormal PDRP expression suggests that differences in network activity cannot be explained solely by nigrostriatal dopaminergic denervation. Dysfunction in other transmitter systems may also play a role. The findings in this dual tracer PET imaging study extend our knowledge about the relationship of dopaminergic and metabolic brain function in IRBD.
Supplemental Material
Supplemental material for Correlations between dopaminergic dysfunction and abnormal metabolic network activity in REM sleep behavior disorder
Supplemental Material for Correlations between dopaminergic dysfunction and abnormal metabolic network activity in REM sleep behavior disorder by Zhemin Huang, Chengfeng Jiang, Ling Li, Qian Xu, Jingjie Ge, Ming Li, Yihui Guan, Jianjun Wu, Jian Wang, Chuantao Zuo, Huan Yu and Ping Wu in Journal of Cerebral Blood Flow & Metabolism
Footnotes
Acknowledgement
We are very grateful to all of the patients and participants as control subjects who took part in this study.
Authors' contributions
CZ, HY and PW were involved in the conception and design of the study; ZH, CJ, LL, QX, JG, ML, YG, JW, JW, CZ, and PW took part in the acquisition and analysis of data; ZH and CJ wrote the first draft of the manuscript; ZH and LL revised the manuscript.
Funding
The author(s) disclosed receipt of the following financial support for the research, authorship, and/or publication of this article: This study was funded by the National Natural Science Foundation of China [grant numbers 81771483, 81671239, 81401135, 81571232, 81371413, 81361120393] and the Natural Science Foundation of Shanghai Science and Technology Committee [grant number 18ZR1405400].
Declaration of conflicting interests
The author(s) declared no potential conflicts of interest with respect to the research, authorship, and/or publication of this article.
*These authors contributed equally to this work.
References
Supplementary Material
Please find the following supplemental material available below.
For Open Access articles published under a Creative Commons License, all supplemental material carries the same license as the article it is associated with.
For non-Open Access articles published, all supplemental material carries a non-exclusive license, and permission requests for re-use of supplemental material or any part of supplemental material shall be sent directly to the copyright owner as specified in the copyright notice associated with the article.