
Abstract
[11C]PE2I is a novel positron emission tomography (PET) radiotracer for the dopamine transporter (DAT). The reproducibility and reliability of [11C]PE2I measurements, especially in the small DAT-rich brain regions, is unknown and of critical importance to the interpretation of the data. Five healthy volunteers were scanned twice during the same day using [11C]PE2I and the HRRT PET scanner. Methods based on metabolite-corrected arterial plasma curve and reference region were used to estimate distribution volumes (VT) and binding potential (BP). Within-subject and between-subject variabilities were compared. [11C]PE2I accumulated in the DAT-rich striatum and the midbrain. Equilibrium of specific binding appeared late in the striatum, whereas it was reached earlier in the midbrain. Plasma metabolite analysis showed that the potentially brain-penetrant 4-hydroxymethyl metabolite represented 15% to 20% of total plasma radioactivity. VT and BP measurements were associated with low within-subject variability. Measurement of DAT binding in small brain regions, including the substantia nigra, is reproducible and reliable using [11C]PE2I and high-resolution research tomograph. A scanning time of more than 70 mins is required for the striatum, while less is sufficient for DAT quantification in the midbrain. The previously suggested involvement of the potentially brain-penetrant radioactive metabolite in the quantification should be further studied.
Introduction
N-(3-iodoprop-2E-enyl)-2β-carbomethoxy-3β-(4-methylphenyl)nortropane (PE2I) is a recently developed cocaine analog having nanomolar affinity for dopamine transporter (DAT) in vitro (Emond et al, 1997; Chalon et al, 1999; Guilloteau et al, 1998; Page et al, 2002). The main advantage of PE21 when compared with previous DAT ligands is the high (over 30-fold) selectivity for DAT over the norepinephrine transporter and serotonin transporter. This molecule has been successfully labeled with carbon-11 to yield [11C]PE2I, a radiotracer that has been shown to provide high-contrast positron emission tomographic (PET) images of DAT binding in humans (Halldin et al, 2003; Jucaite et al, 2006; Leroy et al, 2007). The high contrast is advantageous as it allows for examination of DAT binding in the midbrain (Jucaite et al, 2005).
In human studies, a high interindividual variability has been reported in DAT measurements using [11C]PE2I (Jucaite et al, 2006; Leroy et al, 2007). To what extent this variability reflects true biologic variability in DAT density as opposed to methodological error variance is not known. In addition, there is an unresolved issue in the quantification of this tracer: there appears to be an additional tissue compartment in the cerebellum that is used as the reference tissue (Jucaite et al, 2006). From rodent work, it has been suggested that this compartment may represent an active radiometabolite of [11C]PE2I that penetrates the blood-brain barrier (Shetty et al, 2007).
Positron emission tomography imaging of small brain structures has been limited by partial volume effects (PVE) induced by low spatial resolution (5 to 6 mm). The recently developed high-resolution research tomograph (HRRT) is a brain-dedicated PET scanner that shows significantly better spatial resolution compared with previous PET scanners (in the range of 2.5 mm) (Sossi et al, 2005; de Jong et al, 2007). The HRRT holds great promise for imaging small brain structures (Heiss et al, 2004; Willeit et al, 2006), such as the DAT-enriched nuclei in the midbrain where the dopaminergic cell bodies are located (Jucaite et al, 2005; Leroy et al, 2007). These include the substantia nigra, from which dopaminergic neurons projecting to the dorsal striatum originate, and the ventral tegmental area, from where neurons project to limbic regions and the cerebral cortex. Another region of special interest is the ventral striatum, which is a small region and is susceptible to PVE (Mawlawi et al, 2001). Therefore, the reproducibility and reliability of HRRT PET measurements in these small brain regions are of interest.
In this study, we investigated the test-retest reproducibility and reliability of [11C]PE2I PET measurements of DAT availability using the HRRT. Five healthy male volunteers underwent two [11C]PE2I scans during the same day. Arterial blood samples were obtained, and the metabolite-corrected plasma curve was used as an input function for modeling and was compared with reference region methods.
Materials and methods
The study protocol was approved by the Joint Ethical Committee of the University of Turku and the Turku University Central Hospital. After receiving all the relevant information in written form from the investigators, all study subjects gave the ethical committee-approved written consents. This study followed the ethical guidelines of the Declaration of Helsinki.
Subjects
Five healthy male volunteers were recruited for the study. All the subjects were right-handed and non-smoking. The control subjects were free of any somatic or psychiatric illness, illicit drug abuse, and alcoholism, as confirmed by blood and urine tests, somatic assessment, and a structured clinical interview for DSM-IV Axis I disorders conducted by a psychiatrist. The age, height, and weight of the subjects were 22.2 years (0.5; 22 to 23), 178.2 cm (6.2; 172 to 187), and 73.8 kg (4; 67 to 77), respectively (mean, s.d.; range). To rule out structural brain abnormalities and to obtain an anatomic reference for quantification of PET images, all subjects underwent T1-weighted magnetic resonance imaging at 1.5 T.
Preparation of [11C]PE2I
The precursor PE2I carboxylic acid and PE2I were obtained from PharmaSynth AS, Tartu, Estonia. [11C]Methane was produced at the Accelerator Laboratory (Turku, Finland) of Åbo Akademi with a 103-cm isochronous Efremov cyclotron using the 14N(p,α)11C reaction. High specific radioactivity [11C]methyl iodide was prepared from [11C]methane (Larsen et al, 1997; Någren et al, 2003). The preparation of [11C]PE2I from [11C]methyl triflate was performed according to a published procedure (Halldin et al, 2003) with minor modifications. [11C]Methyl triflate, prepared online from [11C]methyl iodide, was reacted with 0.5 to 0.7 mg of PE2I carboxylic acid and 3.5 to 4.0 μL of 0.4 mol/L tetrabutylammonium hydroxide (aq) in 150 to 200 μL acetone. The crude product was purified using high-performance liquid chromatography (HPLC) on a μBondapak column (Waters, Milford, MA, USA) using 37% acetonitrile in 10 mmol/L phosphoric acid. After the addition of 0.3 mL of sterile propylene glycol/ethanol (7:3 v/v), the fraction containing the product was evaporated and redissolved in 8 mL of physiologic phosphate buffer (0.1 mol/L, pH 7.4) and 1.5 mL of sterile propylene glycol/ethanol (7:3 v/v) and filtered through a 0.2 μm Gelman Acrodisc 4192 sterile filter. The radiochemical purity and the specific radioactivity of the product were determined using HPLC and UV-detection at 218 nm. The volume of the final product solution was calculated by weighing the sterile product vessel before and after sterile filtration and dividing with the density of the sterile solvent.
Positron Emission Tomography Procedures
Positron emission tomography imaging was performed using a brain-dedicated, high-resolution PET scanner (ECAT HRRT, Siemens Medical Solutions, Knoxville, TN) (Sossi et al, 2005). It has been shown in a clinical setting that this 3D-only PET scanner allows more accurate quantification of DAT binding compared with conventional PET scanners (Leroy et al, 2007).
Attenuation correction coefficients were obtained by forward projecting the tissue attenuation map images derived from preinjection cesium-137 point source transmission measurements. Emission data were acquired in list mode and histogrammed using axial compression of span 9, yielding noise -equivalent counts in the range of 3 × 10⁶ to 2.5 × 10⁷, except in the first frame. Image estimates with isotropic voxel dimensions of 1.22 × 1.22 × 1.22 mm3 were generated using speed-optimized version of OP-OSEM-3D (Ordinary Poisson-OSEM in full 3D) reconstruction (Comtat et al, 2004; Hong et al, 2007) with 16 subsets and 8 full iterations.
Head fixation was achieved by using an individually molded thermoplastic mask. External motion data showed movements within the spatial resolusion of the scanner but no corrections were made according to it.
The right antecubital vein was cannulated and [11C]PE2I was administered as an intravenous rapid bolus flushed with saline. Injected dose, mass, and the specific radioactivity for the test and retest scans were 496 ± 17 versus 499 ± 9MBq, 1.01 ± 0.7 versus 0.67 ± 0.6 μg, and 430 ± 393 versus 542 ± 351 MBq/nmol, respectively (mean ± s.d.). There were no statistically significant differences in these parameters between test and retest scans (paired t-test P = 0.09 to 0.79). Radiochemical purity was always >99.5%.
Arterial Blood Sampling and Plasma Analysis
The left radial artery was cannulated for blood sampling, and total radioactivity concentration, metabolism, and binding to plasma proteins were measured. An automated blood sampling system was used for the first 3.5 mins, and manual samples were obtained thereafter at 4.5, 7.5, 11, 14, 18, 24, 30, 36, 42, 48, 54, 60, and 69 mins after injection. Plasma proteins were precipitated with acetonitrile containing cold PE2I as an internal standard. The supernatant obtained after centrifugation was analyzed by HPLC with an online radioactivity detector (Radiomatic 150TR, Flow Scintillation Analyzer; Packard, Meriden, CT, USA). The radio-HPLC was performed on a μBondapak C-18 column (Waters) eluted with a gradient of acetonitrile and 50 mmol/L phosphoric acid. The peaks of radioactivity were integrated, and unchanged [11C]PE2I was identified by comparing the retention time of the cold PE2I at 220 nmol/L wavelength. A Hill-type function was fitted to the parent fraction data, and parameters for this function were used to correct the total plasma curve for radiometabolites. To calculate the plasma fraction during the automated phase of blood sampling, RBC-to-plasma ratios were calculated from all scans as a function of time using hematocrit values, and a sigmoidal increasing function was fitted to these data. This function was then used together with individual hematocrit values to calculate the early plasma curve from the measured whole blood curve.
Plasma protein binding was determined by an ultrafiltration method as previously described by Montgomery et al (2007). Peripheral clearance (CL) of unchanged [11C]PE2I was calculated by dividing the injected dose with the area under the curve of the plasma concentration of the parent compound, and expressed as L/h.
Image Analysis and Regional Tissue Time-Activity Curves
Preprocessing of [11C]PE2I images involved (1) frame-to-frame realignment, (2) PET-to-PET coregistration, and (3) magnetic resonance imaging-to-PET coregistration. All these steps utilized algorithms implemented in SPM2 (Friston et al, 1995), with in-house modification. In each transformation step, the parameters were estimated from PET images that had been smoothed with a 2.5 mm Gaussian kernel, and these parameters were used to transform the native HRRT images from which the quantification was also performed. (1) Frame-to-frame realignment. To correct for frame misalignment caused by head motion during the emission scan, frames within a dynamic emission scan were realigned to a reference frame, which was calculated as an average of the first 1 to 7 frames, the exact frames being selected individually based on the external motion data. (2) PET-to-PET coregistration. This procedure corrects for differences in head positioning between the two PET scans as previously described (Hirvonen et al, 2007). (3) Magnetic resonance imaging-to-PET coregistration. T1-weighted 3D magnetic resonance images were coregistered to an average image of frame-to-frame corrected, PET-to-PET coregistered summated PET images using SPM2 and the normalized mutual information algorithm as the cost function.
Regions of interest (ROIs) were drawn on T1-weighted transaxial magnetic resonance images that had been coregistered with the PET images. Regions of interest were drawn using Imadeus (version 1.20, Forima Inc., Turku, Finland). The striatum was divided into ventral striatum (VST) and dorsal parts of caudate (DCA) and putamen (DPU), following the guidelines of Mawlawi et al (2001) and Drevets et al (2001). Here, the VST includes the nucleus accumbens and ventral parts of caudate and ventral precommissural putamen. Standard-sized cylindrical ROIs were applied bilaterally in the midbrain based on summated PET images. Thalamus (THA) and frontal cortex ROIs were manually delineated following the gray matter contours. Cerebellar ROIs were drawn onto gray matter in cerebellar hemispheres. Regions of interest were drawn on 6 to 12 transaxial slices. No correction for PVE or segmentation of white and gray matter was applied.
Automated Region of Interest Analysis
Positron emission tomography images were analyzed using an automated ROI analysis based on spatial normalization of dynamic PET images into a common stereotactic space and an ROI template (Hirvonen et al, 2006). No spatial smoothing was applied to dynamic PET images to retain the spatial resolution. First, a ligand-specific template was created (Meyer et al, 1999). Then, spatial normalization parameters for the automated ROI analysis were estimated from the mean images of test and retest summed and preprocessed (see above) PET images and the ligand-specific template, and dynamic PET images were transformed frame by frame into the standard space using in-house software. A common ROI set in the standard space was created and regional tissue time-activity curves were calculated from spatially normalized dynamic PET images using Imadeus.
Modeling of [11C]PE2I Kinetics
Before modeling based on arterial input, the contribution of total blood radioactivity to regional tissue time-activity curves (i.e., the vascular component) was eliminated by subtracting it directly from regional radioactivity. This component was estimated to represent only the arterial fraction, as a high first-pass extraction fraction has been shown for [123I]PE2I (Pinborg et al, 2002), and a fixed value of 1.5% was set for all brain regions.
Total tissue distribution volume [VT) was estimated using the metabolite-corrected arterial plasma curve as the input function. VT was estimated directly without division, using a linearized method based on nonnegative least squares optimization (Zhou et al, 2002, 2004) for the two-tissue compartmental model (2TM) and the one-tissue compartmental model (1TM) (Innis et al, 2007).
Akaike information criteria were used to evaluate and compare the goodness of fit between the 1TM and 2TM. Finally, VT was estimated using the multiple-time graphical analysis for reversible radioligand (MTGA, or the Logan plot) (Logan et al, 1990; Logan, 2000): these values are termed V
To estimate the specific binding to receptors, binding potential (BP) values were calculated. In principle, BP represents the ratio of concentration of specific binding and a reference concentration at equilibrium (Innis et al, 2007). There are three commonly used BP estimates that differ in terms of the reference concentration used: BPF, BPp, and BPND are the ratios of concentration of specific binding to free radioligand in plasma, total radioligand in plasma, and nondisplaceable (free plus nonspecifically bound) radiotracer in tissue. These were calculated indirectly from regional VT values, assuming that VT in the cerebellum is an estimate of VND (distribution volume of the nondisplaceable tissue compartment) (Innis et al, 2007). BP
Statistical Analyses
Statistical analyses were performed using SPSS for Windows (Release 12.0.1, SPSS Inc., 1989 to 2003) and Microsoft Office Excel 2003 (SP2, Microsoft Corporation, 1985 to 2003). Test-retest variability (reproducibility) and intraclass correlation coefficients (ICC) (reliability) were calculated, as described previously (Hirvonen et al, 2007). ICC can have values between −1 and 1; values close to 1 indicate that most variance is because of between-subject rather than within-subject variance (good reliability), whereas values below 0 imply greater within-subject than between-subject variance (poor reliability). Differences in parameters of interest between test and retest scans were tested with paired samples t-test, and a P-value of 0.05 was considered a threshold criterion of statistical significance. Values represent mean ± s.d., unless stated otherwise.
Results
Plasma Analysis
After intravenous injection of [11C]PE2I, there was a rapid increase in the radioactivity concentration in arterial plasma. The radioactivity concentration reached a peak within the first minute and decreased rapidly thereafter, and then continued to decrease at a lower rate.
[11C]PE2I was rapidly metabolized (Table 1, Figure 1). A typical radio-HPLC chromatogram is shown in Figure 1A at 10 mins after injection. Besides unmetabolized [11C]PE2I (parent) the chromatogram shows three different metabolites, more polar than the parent compound. Fractions of unchanged [11C]PE2I show low variability in the 4 mins time point but higher in later time points. ICC values were high for the 4 and 50 mins time points, whereas other time points showed poorer reliability. Thus, measurement consistency was highest at the beginning of data acquisition, whereas true within-subject differences were evident at the beginning and end of the experiment.
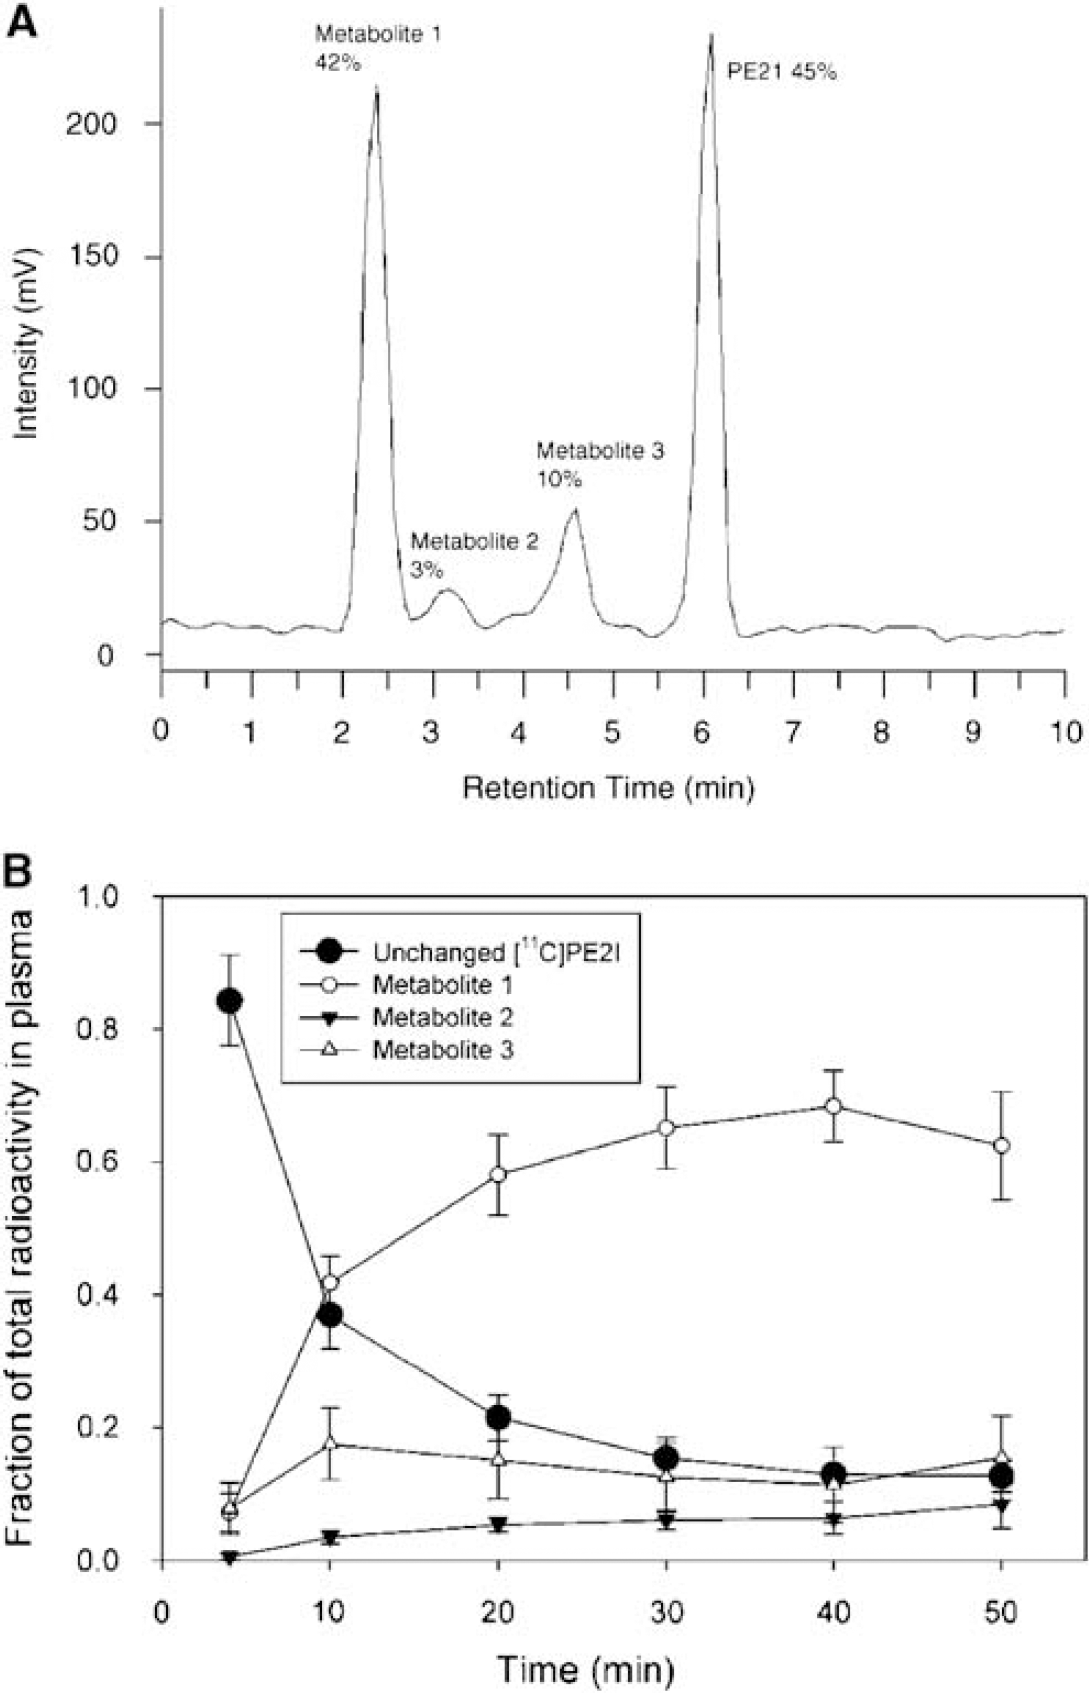
Metabolism of [11C]PE2I, as illustrated by a typical radio-HPLC chromatogram from one subject at 10 mins (
Test-retest characteristic of the plasma analysis: fractions and peripheral clearance (CL, L/h) of unchanged (nonmetabolized) [11C]PE2I in plasma as well its free fraction (fP, non-protein bound)
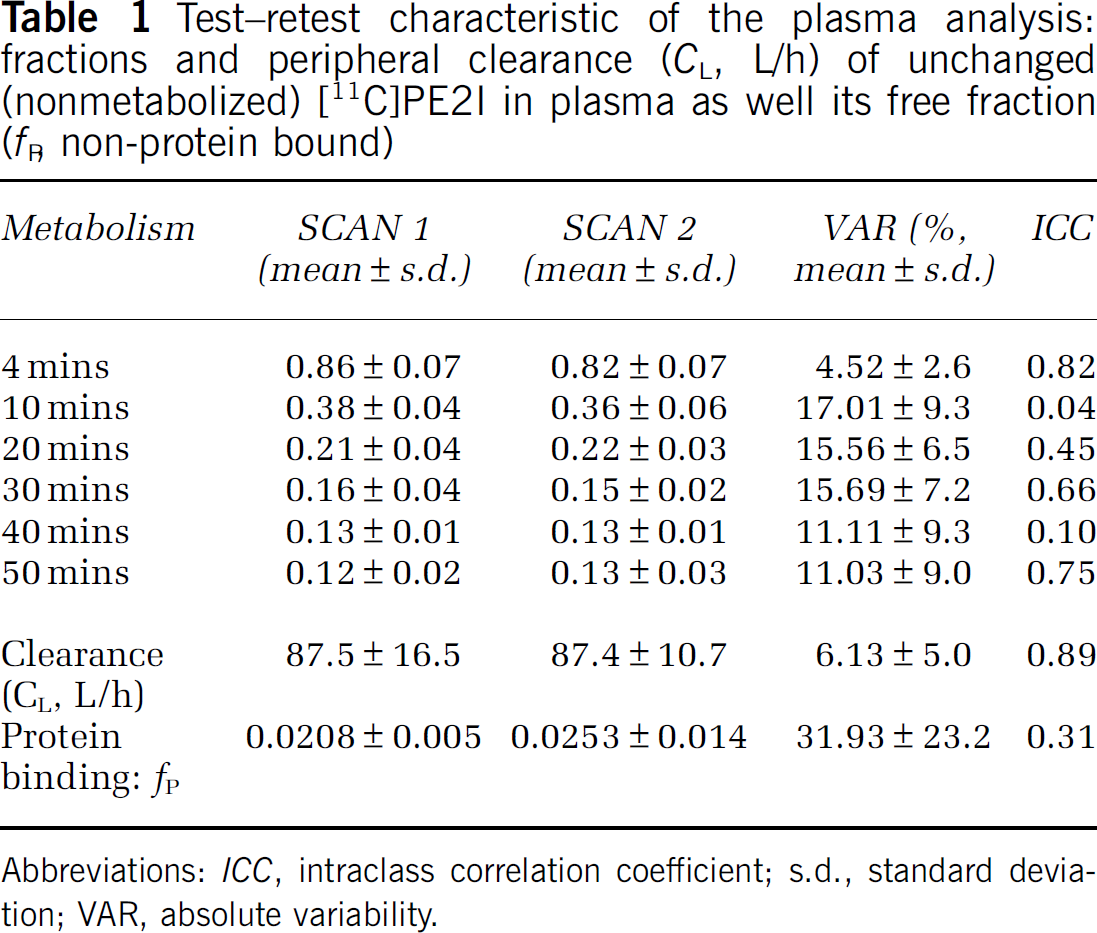
Abbreviations: ICC, intraclass correlation coefficient; s.d., standard deviation; VAR, absolute variability.
[11C]PE2I was bound to plasma proteins to high extent (Table 1). On average (N = 10), plasma protein binding was 97.7%, corresponding to a plasma free fraction fP of 0.023. Determination of fP was associated with high within-subject variability (31.9% ± 23.2%) and low reliability (ICC 0.31). Thus, BPF was not calculated as fP appears as a numerator in the BPF equation and thereby propagates additional variance in the parameter. [11C]PE2I was also rapidly cleared from plasma (Table 1). CL showed excellent reproducibility and reliability.
Brain Uptake
After intravenous injection of [11C]PE2I, there was a rapid accumulation of radioactivity in brain regions known to contain high densities of DAT. The rank order of radioactivity was as follows: caudate = putamen > ventral striatum > midbrain > thalamus > frontal cortex = cerebellum. Especially the midbrain, known to contain the dopaminergic cell bodies, was clearly visualized as two distinct regions of intense uptake in the PET images (Figure 2). Average regional time-activity curves are shown in Figure 3.
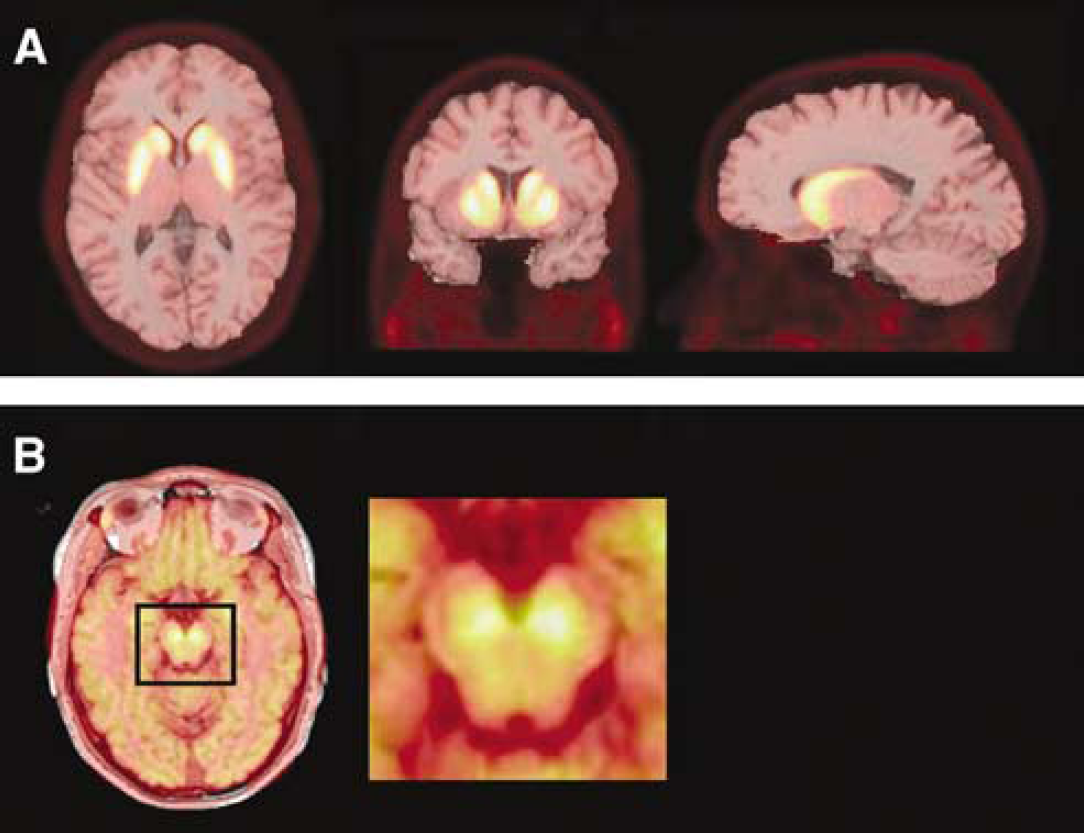
Visualization of [11C]PE2I images. A mean image of PET-to-PET coregistered summed PET images is overlaid on a T1-weighted MR image of one subject at the level of the striatum (
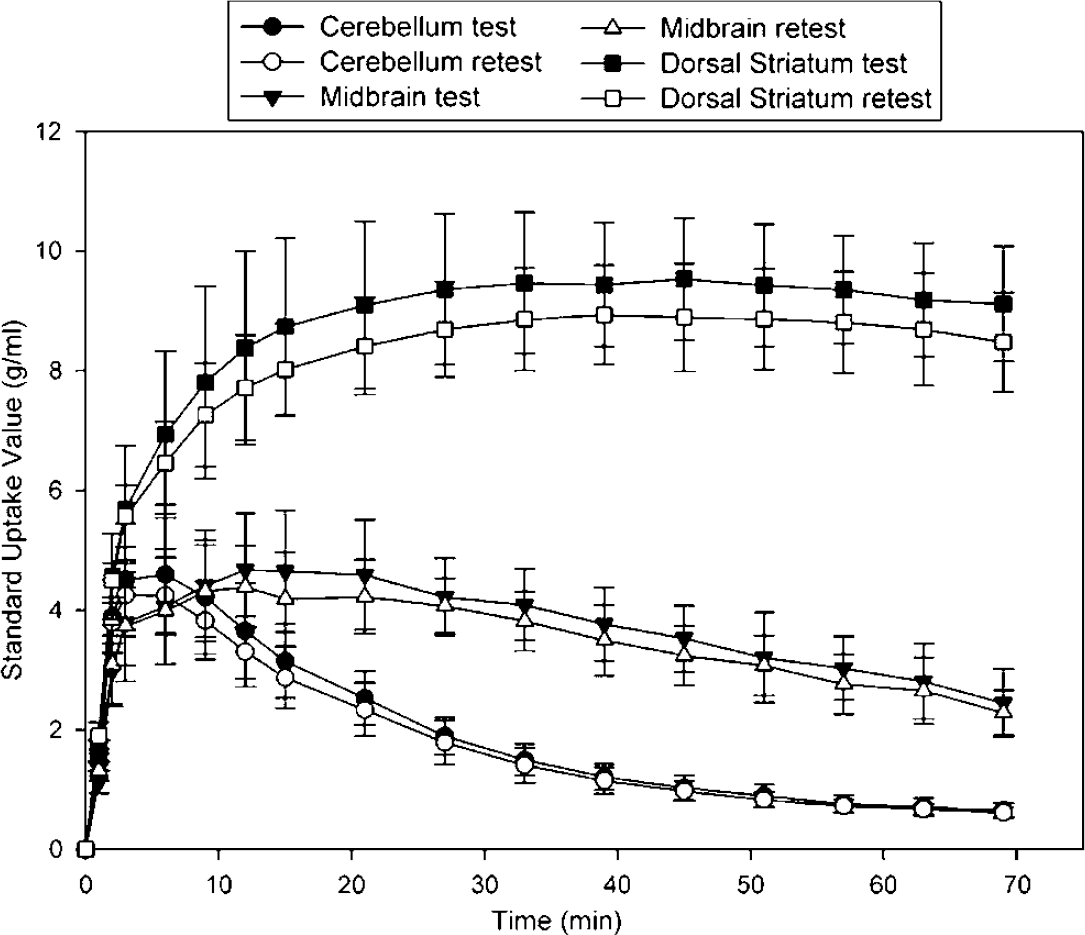
Regional radioactivity concentration, expressed as the standard uptake value (radioactivity concentration (kBq/mL)/injected dose (kBq)/body mass (g)) plotted against time in test (N = 5) and retest (N = 5) scans. Error bars denote standard deviation.
Tissue-to-plasma ratios were calculated by dividing the regional radioactivity concentration (kBq/mL) with the plasma concentration of unchanged [11C]PE2I in each time point (Figure 4). Cerebellar ratios started to decline during the acquisition time but ratios in the high-density striatal regions tended to increase during the whole scanning time. Ratios in the midbrain appeared to reach a steady state.
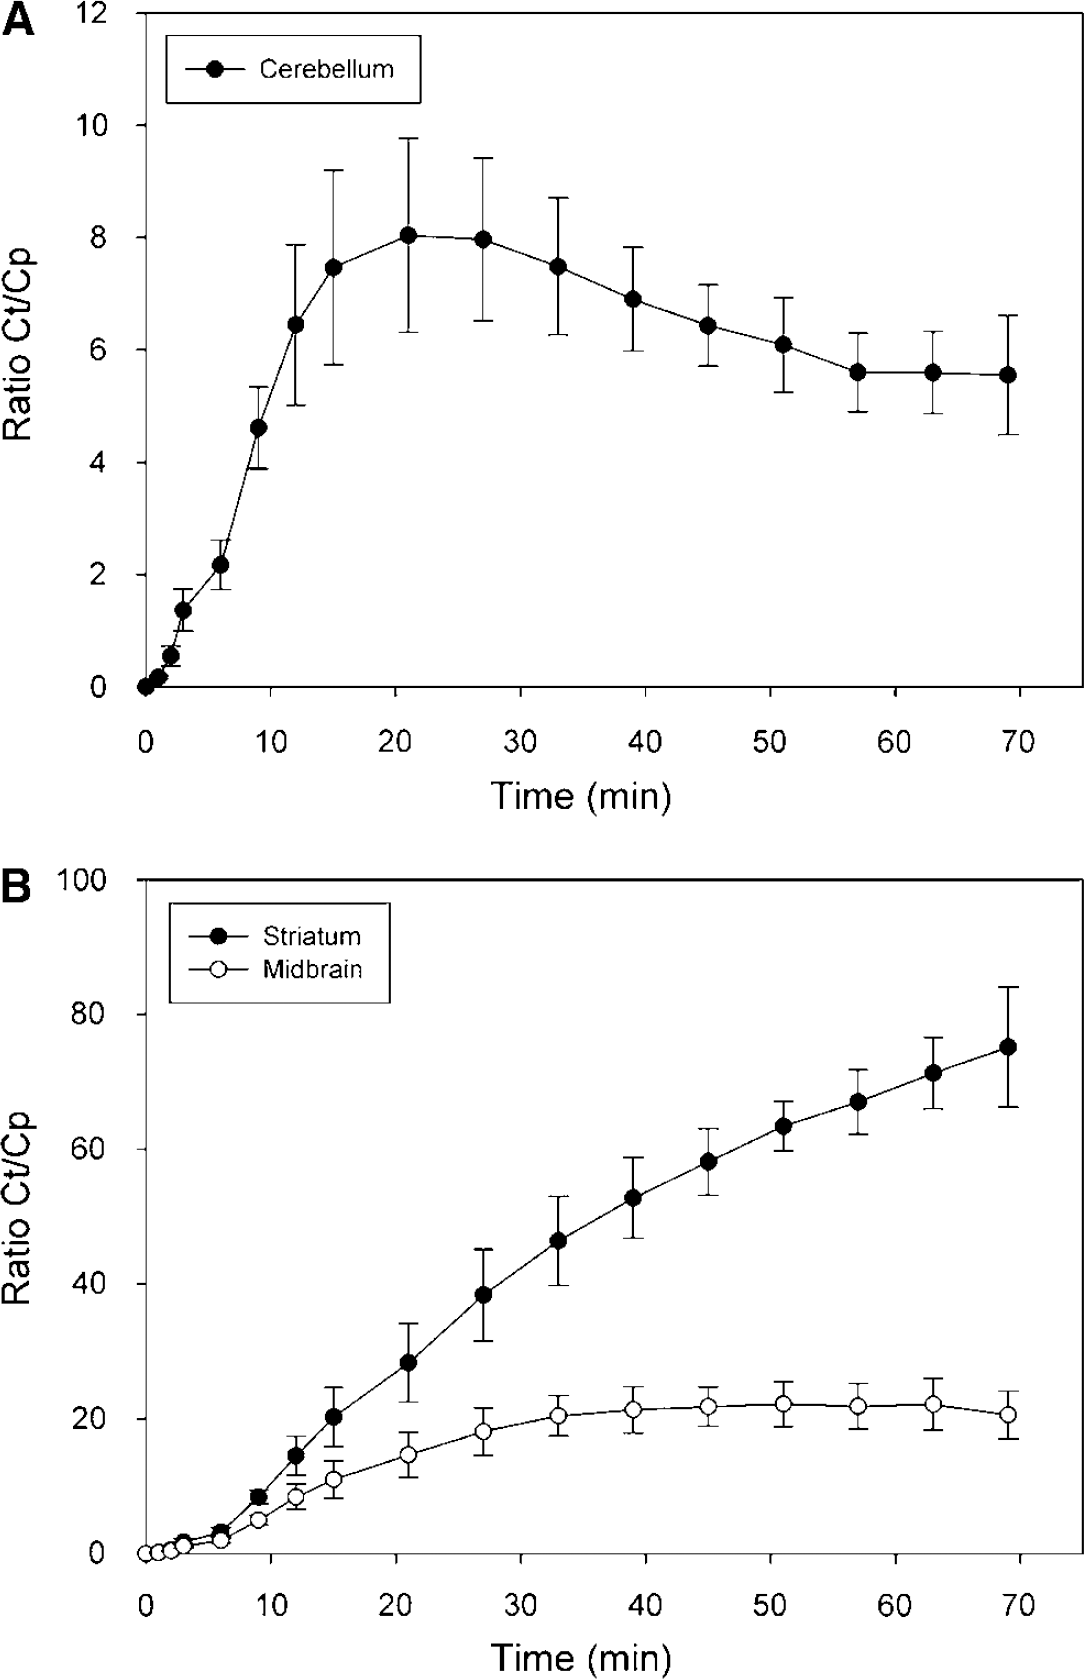
Tissue-to-plasma radioactivity ratios, calculated by diving regional radioactivity concentrations (CT) with the plasma concentration of unchanged [11C]PE2I (CP), in cerebellum (
Total tissue VT values were estimated according to the 1TM and 2TM configurations (Tables 2 and 3). Analysis of the Akaike information criteria values revealed that the 2TM provided better fits than 1TM in CER and THA, but no differences were seen in other regions. Generally, the two approaches gave similar data: VT values were high for striatal high-density regions (50 to 75), intermediate for midbrain (8 to 9) and thalamus (4 to 5), and low for cerebellum (˜3) and frontal cortex (3 to 4). VT from the frontal cortex was practically similar to cerebellar VT, and this region was omitted from further analysis.
Regional [11C]PE2I VT-1TM values and their test-retest characteristics
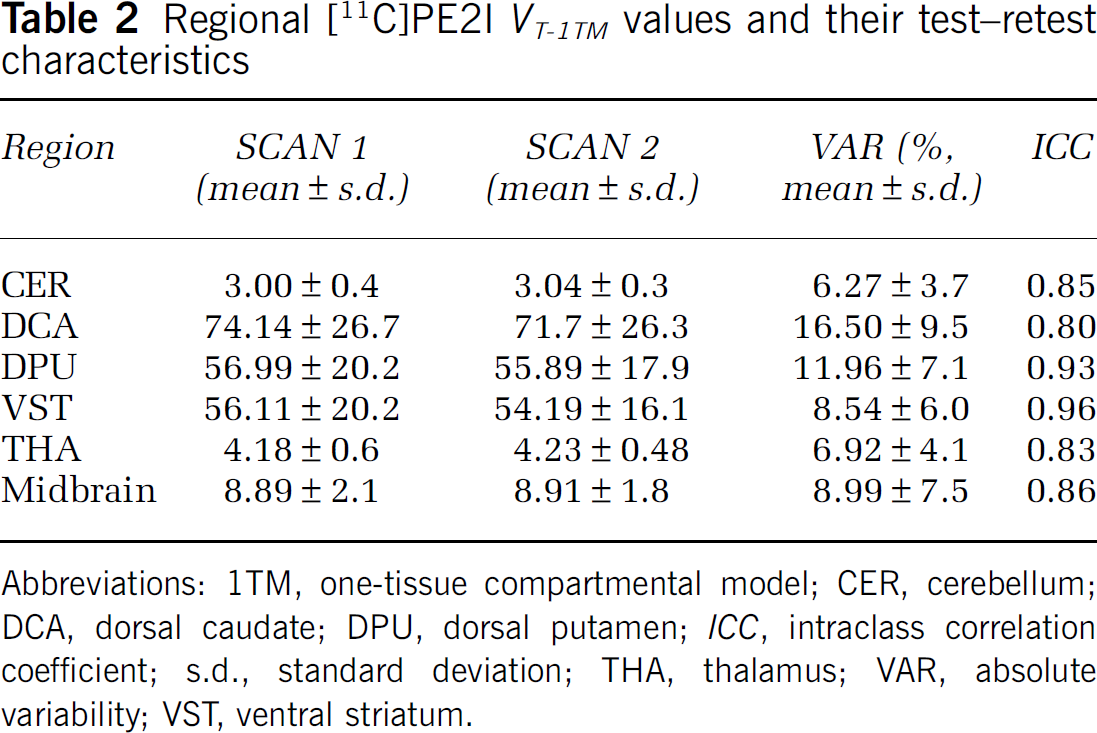
Abbreviations: 1TM, one-tissue compartmental model; CER, cerebellum; DCA, dorsal caudate; DPU, dorsal putamen; ICC, intraclass correlation coefficient; s.d., standard deviation; THA, thalamus; VAR, absolute variability; VST, ventral striatum.
Regional [11C]PE2I VT-2TM values and their test-retest characteristics
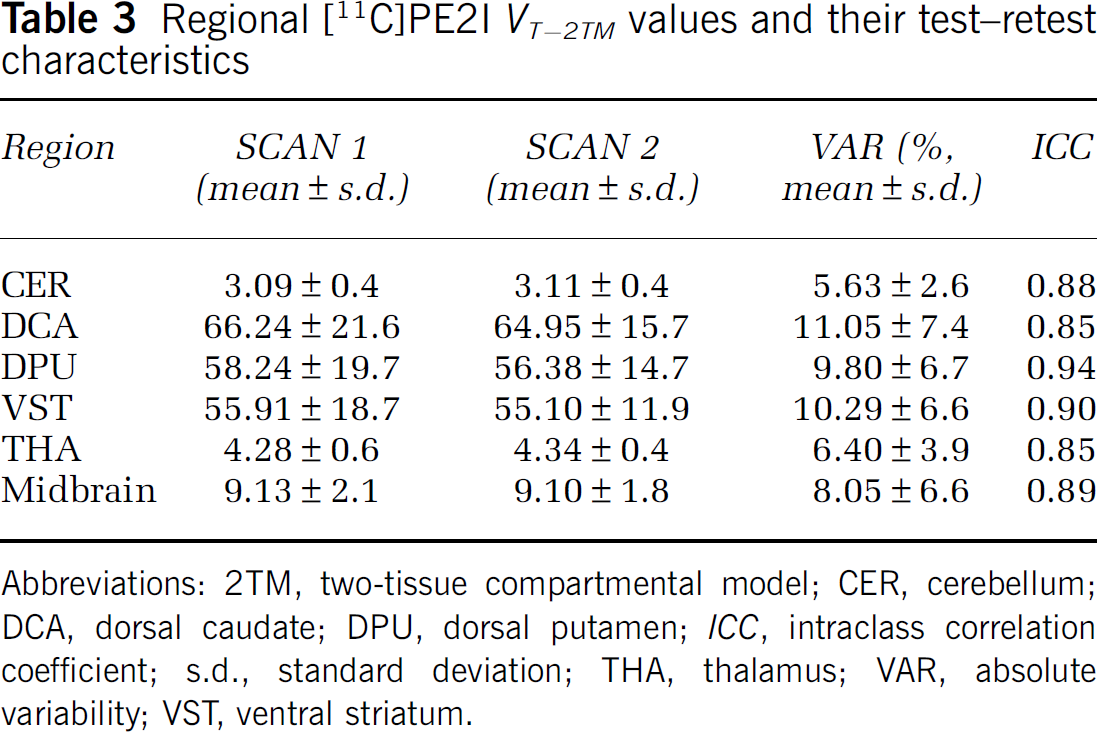
Abbreviations: 2TM, two-tissue compartmental model; CER, cerebellum; DCA, dorsal caudate; DPU, dorsal putamen; ICC, intraclass correlation coefficient; s.d., standard deviation; THA, thalamus; VAR, absolute variability; VST, ventral striatum.
VTwas also estimated based on the MTGA (Logan plot). However, a linear part of the Logan plot could not be determined in high-density regions: VT-MTGA estimates were dependent on the start time of the integral up to 45 mins. Therefore, MTGA analysis was not continued.
Time stability was evaluated for VT-2TM values by progressively truncating the data in terms of fit end time, each 6 mins frame at a time, and mean VT=2TM values in each time point were expressed as percentage of the terminal (69 mins) value (Figure 5). In the striatum, V T-2TM was found to be overestimated in shorter time points, and at 63 mins they were within ± 10% of the terminal value. In contrast, VT-2TM values in the midbrain and cerebellum were well within these limits even in the 33 mins time point.
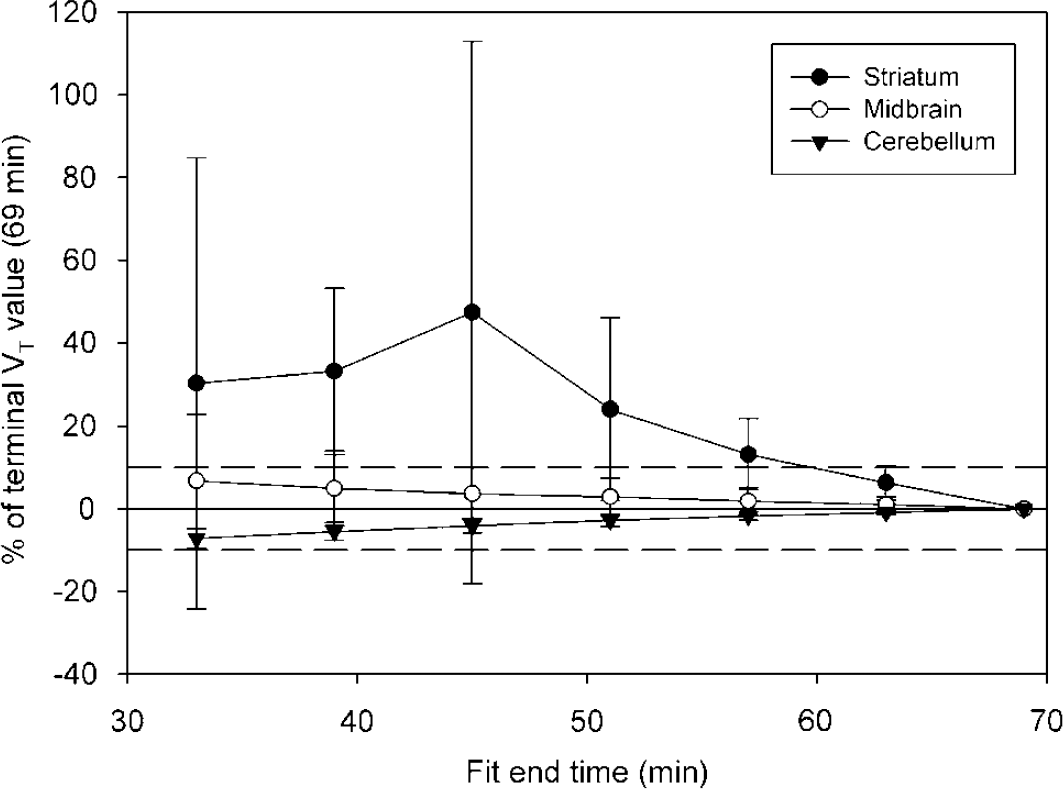
Time stability of VT-2TM measurements. Mean (N = 10) values for each time point is given as percentage of the terminal VT-2TM value acquired using whole data (69 mins). Dashed reference lines represent ± 10% of terminal value and error bars denote s.d.
The free fraction of the nondisplaceable tissue compartment, fND, was on average 0.75% (N=10), indicating that most of the radioligand is nonspecifically bound in the nondisplaceable tissue compartment and only a small fraction is available for specific binding. As expected from the poor reliability of fP, the variability of fND was high (32.4% ± 25.2%) and that of ICC low (0.29).
VT values from all compartmental settings (1TM, 2TM) were generally highly reproducible with low variability values and high ICC values. Regarding reproducibility and reliability, VT-2TM outperformed VT-1TM, although the differences were of modest magnitude and did not reach statistical significance in this small sample. Noteworthy is the excellent reproducibility and reliability of cerebellar VT-2TM which is prerequisite for using this parameter as an input for obtaining estimates for specific binding (i.e., the BP derivatives).
Metabolite 3 likely represents the 4-hydroxymethyl analog of [11C]PE2I that has been shown to enter the brain in rats (Shetty et al, 2007). Unexpectedly, the fractions of metabolite 3 in most time points (excluding 50 mins) were negatively correlated with VT-2TM values in all ROIs except VST: for example, at 20 mins, correlations were seen in CER (R=−0.90, P < 0.001), DPU (R=−0.76, P = 0.010), midbrain (R=−0.83, P = 0.003), and THA (R=−0.88, P = 0.001). This was not because of lower amount of the parent compound, as parent fractions did not generally correlate with VT-2TM The mean (N = 10) fractions of metabolite 3 were 0.08 at 4 mins, 0.18 at 10 mins, 0.15 at 20 mins, 0.13 at 30 mins, 0.11 at 40 mins, and 0.15 at 50 mins. The fractions showed large within-subject variability (mean 25.6%, 16.2% to 40.9%) but ICC values were considerably higher (mean 0.74, 0.32% to 0.89%) than for the fractions of the parent compound, indicating significant interindividual variability despite measurement error.
Estimation of Specific Binding
Two estimates of specific binding were considered here, BPP and BPND (but not BPF: see above) (Tables 4 and 5). VT values according to the 2TM were chosen for BP estimations, as the 2TM provided better fits in the cerebellum as well as in some of the ROIs and had generally better reproducibility compared with 1TM.
Regional [11C]PE2I BPP values and their test-retest characteristics
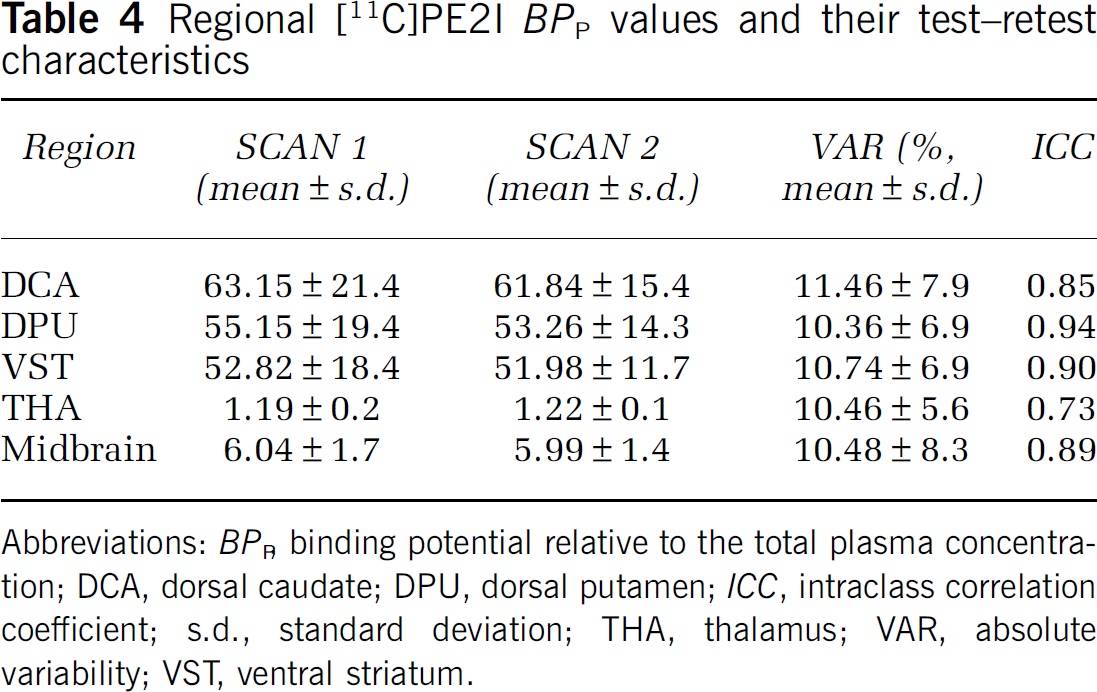
Abbreviations: BPP, binding potential relative to the total plasma concentration; DCA, dorsal caudate; DPU, dorsal putamen; ICC, intraclass correlation coefficient; s.d., standard deviation; THA, thalamus; VAR, absolute variability; VST, ventral striatum.
Regional [11C]PE2I BPND values and their test-retest characteristics
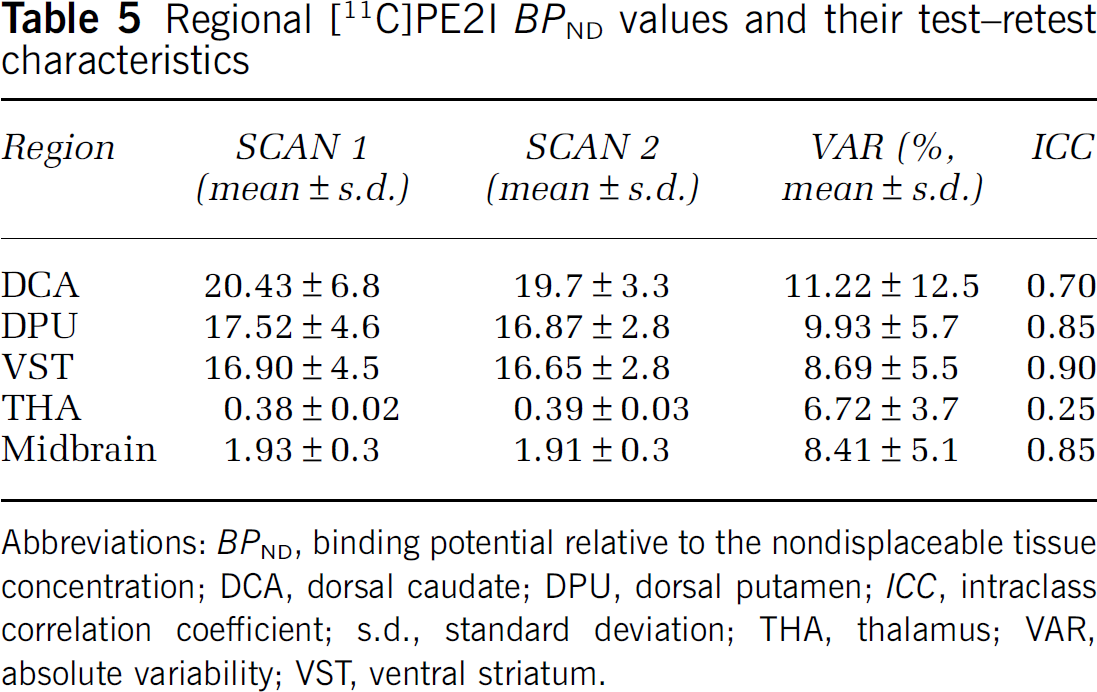
Abbreviations: BPND, binding potential relative to the nondisplaceable tissue concentration; DCA, dorsal caudate; DPU, dorsal putamen; ICC, intraclass correlation coefficient; s.d., standard deviation; THA, thalamus; VAR, absolute variability; VST, ventral striatum.
BPP values ranged from 62.5 in the DCA to 1.2 in the THA, being 6.0 in the midbrain. BPP values were well reproducible and reliable as indicated by low variability (ranging from 10.4% in the DPU to 11.5% in the DCA) and high ICC values (ranging from 0.73 in the THA to 0.94 in the DPU). BPND values ranged from 0.39 in the THA to 20.1 in the DCA, being 1.92 in the midbrain. The absolute variability was somewhat lower than for BPP (ranging from 6.7% in the THA to 11.2% in the DCA). However, ICC values were somewhat lower than those for BPP; they were 0.70 for DCA, 0.85 for DPU, 0.90 for VST, 0.85 for midbrain, and 0.25 for thalamus. This indicates less between-subject variability in the face of roughly similar measurement variability compared with BPP
BPND-SRTM values are presented in Table 6. Simplified reference tissue model tended to give lower estimates of BPND than when using arterial input. BPND-SRTM measurements showed excellent reproducibility with low absolute variability values (ranging from 4.8% in the DPU to 8.9% in the DCA), but ICC values were clearly lower than for other outcome measures: 0.48 for DCA, 0.48 for DPU, 0.81 for VST, 0.83 for midbrain, and 0.55 for thalamus. This indicates even less between-subject variability than for BPND measurements using the arterial input function.
Regional [11C]PE2I BPND-SRTM values and their test-retest characteristics
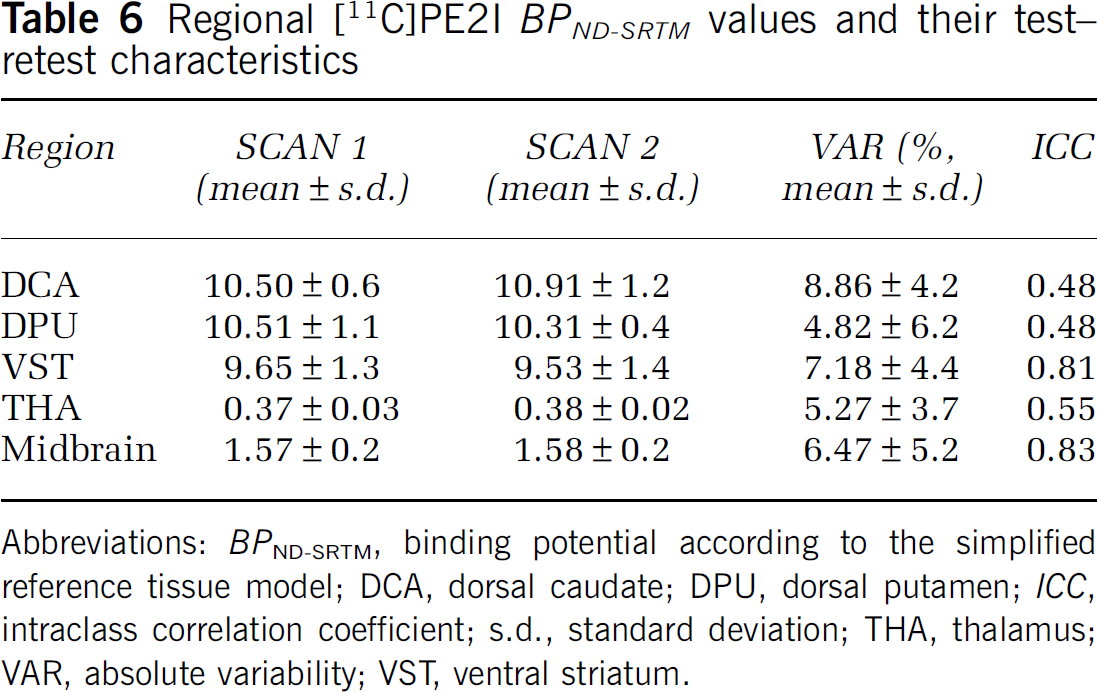
Abbreviations: BPND-SRTM, binding potential according to the simplified reference tissue model; DCA, dorsal caudate; DPU, dorsal putamen; ICC, intraclass correlation coefficient; s.d., standard deviation; THA, thalamus; VAR, absolute variability; VST, ventral striatum.
For the ratio analysis, an integration start time of 15 mins was chosen because this results in best overall reproducibility (lowest average absolute variability) and reliability (highest average ICC) (data not shown). BPND-RATIO estimates are given in Table 7. This method tended to give considerable lower estimates of BPND, except in the midbrain, where values were more similar to those from other methods. This is probably because equilibrium was reached in this low-density region earlier than in high-density regions. Moreover, BPND-RATIO estimates were dependent on the integration start time from 0 to 60 mins (data not shown). BPND-RATIO showed high reproducibility (absolute variability ranging from 3.4% in THA to 5.2% in VST) and reliability (ICC ranging from 0.72 in THA to 0.91 in VST).
Regional [11C]PE2I BPND-RATIO values and their-test-retest characteristics
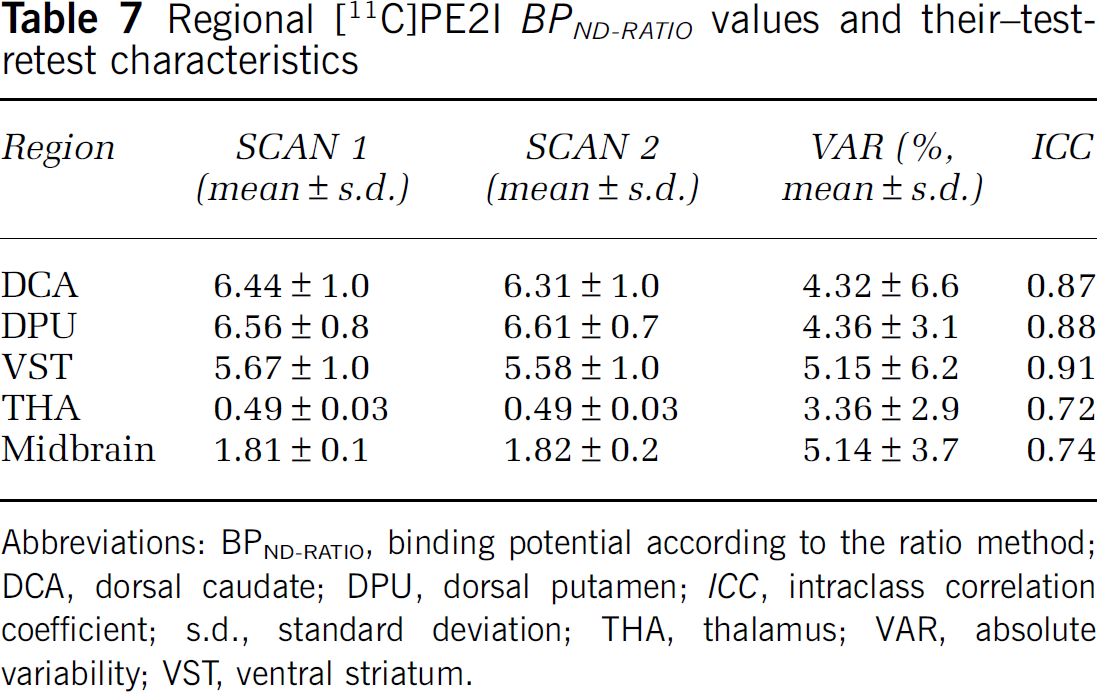
Abbreviations: BPND-RATIO, binding potential according to the ratio method; DCA, dorsal caudate; DPU, dorsal putamen; ICC, intraclass correlation coefficient; s.d., standard deviation; THA, thalamus; VAR, absolute variability; VST, ventral striatum.
The mass of the injected radioligand (μg) did not correlate with VT-2TM or BPP in any region, but a positive association was seen with BPND in the DPU (R = 0.64, P = 0.045) but not in other regions. Lack of negative associations indicates no significant pharmacological mass effects in this mass range (0.2 to 1.9 μg, average 0.8 μg).
Automated Region of Interest Analysis
VT-2TM values from the automated ROI analysis are given in Table 8. Generally, the agreement between the analyses was good as indicated by correlation coefficients close to unity: 0.99 for CER, DPU, and THA, 0.95 for midbrain, 0.93 for VST, and 0.84 for DCA. Automated ROI analysis gave higher estimates of VT-2TM in CER (+ 2.2%, paired t-test P = 0.001) and THA (+0.53%, P = 0.426) and lower in the DCA (−11.5%, P = 0.035), DPU (−10.4%, P<0.001), VST (−4.9%, P = 0.185), and midbrain (−13.2%, P<0.001). Correspondingly, excluding CER, the slopes of the regression equations predicting automated values with manual values were less than unity (0.72 to 0.77) and intercepts were positive (0.91 to 11.1), indicating that this method gave lower estimates of VT-2TM in a nonscalar fashion. However, the reproducibility and reliability of VT-2TM from the automated ROI analysis were comparable or even slightly better than that from the manual ROI analysis, encouraging the application of the automated method in clinical settings.
Regional [11C]PE2I VT values according to the 2TM model from the automated ROI analysis and their test-retest characteristics
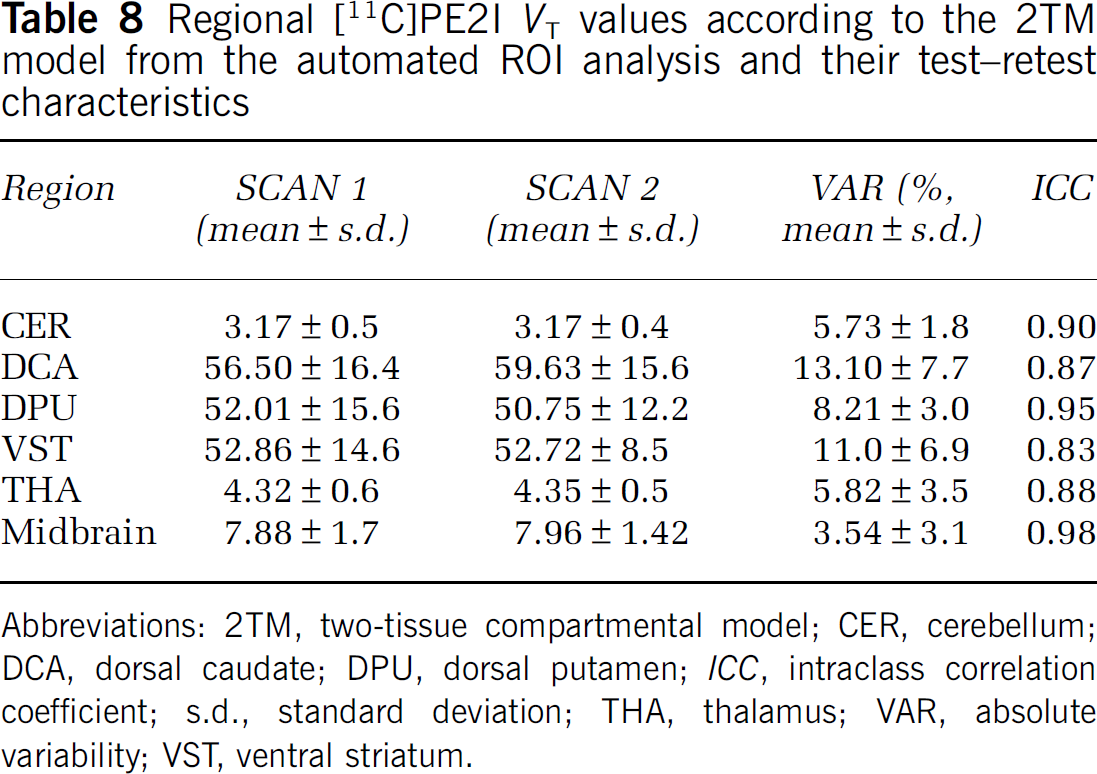
Abbreviations: 2TM, two-tissue compartmental model; CER, cerebellum; DCA, dorsal caudate; DPU, dorsal putamen; ICC, intraclass correlation coefficient; s.d., standard deviation; THA, thalamus; VAR, absolute variability; VST, ventral striatum.
Discussion
This study explored the utility of imaging DAT using the novel PET tracer [11C]PE2I and the high-resolution PET scanner HRRT. Regional tissue distribution volumes in the high-density regions were dependent on the integration interval throughout the scanning time, and tissue-to-plasma ratios did not reach late-time equilibrium. Our results suggest that a scanning time of more than 70 mins is required for a reliable quantification of DAT binding in the striatum with this tracer, but shorter scanning times may be sufficient for imaging extrastriatal DAT. Despite the time instability of these outcome measures based on arterial input function, they were well reproducible and reliable in repeated PET scanning as indicated by low within-subject variability in the face of large interindividual variability. Thus, the results of this study encourage the use of high-resolution PET in the study of in vivo dopaminergic markers in humans.
The distribution of [11C]PE2I in brain was consistent with a previous whole-hemisphere autoradiography study with [125I]PE2I in humans (Hall et al, 1999), with high accumulation in the caudate, putamen, and ventral striatum; low uptake in the midbrain; and very low uptake in the cerebral cortex and cerebellum. The rank order of [11C]PE2I binding paralleled roughly that seen in autoradiography (Hall et al, 1999); for instance, VT in the VST was ˜10% lower than in the caudate-putamen. The HRRT was able to quantify DAT reliably in the thalamus, where the density is very low (Hall et al, 1999). In midbrain, where DAT density is ˜50% of that in the striatum (Hall et al, 1999), our method yielded lower estimates of DAT binding, likely because of PVE: binding was ˜20% of that in the striatum.
Binding of [11C]PE2I in the human brain as assessed with HRRT was also consistent with previous PET studies in healthy humans using this radioligand (Halldin et al, 2003; Jucaite et al, 2005, 2006; Leroy et al, 2007). Jucaite et al (2006) reported arterial input-based VT-2TM values of 69.2 in caudate, 62.1 in putamen, 12.1 in midbrain, and 3.9 in cerebellum using the ECAT EXACT HR camera; these are roughly comparable to those observed in the current study. Leroy et al (2007) presented BPND-SRTM values of 8.1 in DCA, 9.7 in DPU, and 2.2 in midbrain and evidence for a gain in signal because of lower PVE of + 30% in the striatum and + 90% in the midbrain when using the HRRT versus HR+. The BPND-SRTM values in the current study correspond well with those of Leroy et al (2007) despite the small difference in midbrain, which is probably because of different definition of the ROI. We used standard-sized cylindrical ROIs, which inherently predispose to PVE on the one hand, but protect against motion-related artifact in this small structure on the other hand. In summary, we confirm the gain on specific [11C]PE2I signal of HRRT PET, which is likely because of higher spatial resolution and lower PVE.
Arterial cannulation and blood sampling is an invasive procedure that ideally should be avoided in clinical study settings, and models based on reference tissue input that are devoid of the need of arterial blood sampling are preferable. In the current study, the SRTM gave ˜50% lower estimates of BPND than the method based on arterial input in high-density regions and ˜20% in low-density regions. This resembles the situation with other PET radiotracers as well, such as [carbonyl-11C] WAY-100635 for serotonin 5-HT1A receptors (Farde et al, 1998; Parsey et al, 2000; Hirvonen et al, 2007), and may be partially because of the violation of the assumption of 1TM kinetics in the cerebellum inherent in the SRTM. In any case, BPND-SRTM values were very well reproducible as indicated by low absolute variability values (4% to 9%), which indicates good measurement consistency. However, ICC values were considerably lower than for BPND based on arterial input (except in VST and midbrain), which may be a natural consequence of BPND-SRTM giving lower estimates of the true interindividual variability in DAT density, especially in high-density regions. The second tissue compartment in the cerebellum could theoretically represent specific binding, which would result in lower estimates of regional BPND values and have little effect on BPP values. Whether [11C]PE2I or any of its metabolites have specific binding in the cerebellum in humans remains to be investigated, but a recent study in monkies did not show altered cerebellar [11C]PE2I uptake after a DAT inhibitor challenge (Halldin et al, 2003). BPND-RATIO values were associated with highest ICC values. However, since these values are dependent on the peripheral clearance of the parent compound, the large between-subject variance may include a component of the latter variable in addition to receptor availability.
Distribution volume values (VT) in the high-density regions were not stable during the scanning period of 69 mins; they were dependent on the analysis time interval throughout the scanning period. Moreover, we were not able to detect a linear phase in the Logan plot in high-density regions. These observations suggest that 69 mins may not be sufficient for [11C]PE2I to reach an equilibrium of specific binding in high-density regions. In low-density regions, a shorter scanning time was sufficient, consistent with the notion that equilibrium is reached earlier in low- than high-density regions (Olsson and Farde, 2001). The metabolism of [11C]PE2I has recently been evaluated in more detail in rats by Shetty et al (2007). [11C]PE2I was found to have two radioactive metabolites that were characterized as the 4-hydroxymethyl and 4-carboxyl analogs of [11C]PE2I. Although less lipophilic than the parent compound, the 4-hydroxymethyl analog has sufficient lipophilicity (cLogD 2.70) to cross the rat blood-brain barrier and accumulate in the rat striatum (Shetty et al, 2007). In rats, the striatum-to-cerebellum activity concentration ratio of this radiometabolite was 3.7, indicating a selective striatal uptake because of specific binding to DAT (Shetty et al, 2007), although the affinity seems lower than that of the parent tracer (ratio 6.1). In this study, the fractions of metabolite 3, but not the parent compound, were tightly correlated with VT-2TM values, which is surprising as VT-2TM was estimated based on the parent plasma curve. Whether this radiometabolite crosses the blood-brain barrier and accumulates in the striatum in humans would be revealed only by evaluating the distribution of this molecule with a 11C label; its role in the biomathematical modeling of [11C]PE2I kinetics remains unknown.
The nature of metabolite 2, which has not been reported in earlier [11C]PE2I studies (Jucaite et al, 2006; Shetty et al, 2007), has not been identified. Shetty et al (2007) proposed N-dealkylation and ester group hydrolysis as expected metabolic routes, but they were not able to identify metabolites generated by these routes. Ester group hydrolysis would generate two labeled metabolites in plasma, as is the case with [11C]metomidate (Minn et al, 2004). These two labeled metabolites correspond to [11C]formaldehyde and [11C]methanol. Metabolite 2 could thus correspond to [11C]formaldehyde, while [11C]methanol would coelute with metabolite 1. Still, until metabolite 2 has been identified, we can only speculate about its nature.
Automated ROI analysis provides an alternative to manual delineation of ROIs onto individual MR images, which is labor-intensive, especially with HRRT images. This study showed good agreement between VT-2TM values from automated and manual methods, although the former gave slightly lower estimates than the latter. This phenomenon, seen in high-density regions, probably reflects minor mismatches between automated and manual ROIs, which reflect large differences in the kinetics of [11C]PE2I and may be unstable when using a scanning time of 69 mins.
Conclusions
In this study, the reproducibility, reliability, and validity of DAT measurements with [11C]PE2I and the high-resolution PET scanner HRRT were evaluated in humans. DAT binding was reliably quantified even in the midbrain, which contains very small DAT-rich nuclei. Good reproducibility and reliability of both automated and manual measurements were shown, encouraging the use of HRRT in the exploration of the dopaminergic system in the living human brain. Methods based on reference tissue input gave lower estimates of the binding potential and showed somewhat lower interindividual variability than methods based on arterial input function. Our results suggest that a scanning time of more than 70 mins is required for imaging striatal DAT with [11C]PE2I, whereas a shorter scanning time appears to be sufficient for extrastriatal imaging, for example, in the midbrain. Previous studies have raised a possibility of a pharmacologically active radiometabolite accumulating in the brain, and the blood-brain barrier penetrance of radioactive metabolites of [11C]PE2I in humans should be further characterized.
Disclosures/conflicts of interest
The authors declare no conflicts of interest.