
Abstract
Inflammation-induced blood–brain barrier (BBB) dysfunction and microvascular leakage are associated with a host of neurological disorders. The tight junction protein claudin-5 (CLDN5) is a crucial protein necessary for BBB integrity and maintenance. CLDN5 is negatively regulated by the transcriptional repressor FOXO1, whose activity increases during impaired insulin/AKT signaling. Owing to an incomplete understanding of the mechanisms that regulate CLDN5 expression in BBB maintenance and dysfunction, therapeutic interventions remain underdeveloped. Here, we show a novel isoform-specific function for AKT2 in maintenance of BBB integrity. We identified that AKT2 during homeostasis specifically regulates CLDN5-dependent barrier integrity in brain microvascular endothelial cells (BMVECs) and that intervention with a selective insulin-receptor (IR) agonist, demethylasterriquinone B1 (DMAQ-B1), rescued IL-1β-induced AKT2 inactivation, FOXO1 nuclear accumulation, and loss of CLDN5-dependent barrier integrity. Moreover, DMAQ-B1 attenuated preclinical CLDN5-dependent BBB dysfunction in mice subjected to experimental autoimmune encephalomyelitis. Taken together, the data suggest a regulatory role for IR/AKT2/FOXO1-signaling in CLDN5 expression and BBB integrity during neuroinflammation.
Introduction
Blood–brain barrier (BBB) dysfunction is a pathological hallmark in inflammation-associated diseases of the central nervous system (CNS), including multiple sclerosis, stroke, dementia, traumatic brain injuries, encephalopathies, and brain metastases.1 –4 Under homeostasis, local cues promote BBB maintenance by fostering highly restrictive brain endothelial cell–cell contacts.5–7 During an aberrant inflammatory response, however, BBB dysfunction can be triggered by mediators from circulation or the CNS, which act upon endothelial cells (ECs) to reduce their cell–cell adhesive forces. Loss of this adhesion results in barrier hyperpermeability, leading to edema, poor nutrient exchange, neuronal toxicity, and CNS dysfunction.8,9
This compromise in BBB integrity is a direct result of inflammatory-mediated disruption of the adherens and tight junction complexes at endothelial cell–cell contacts.10,11 Although the establishment of the BBB interface requires the involvement of various junctional proteins, the tight junction protein claudin-5 (CLDN5) is known to play an indispensable role in restricting small molecule flux through paracellular passageways.12–14 In vitro BBB models have demonstrated that CLDN5 is a common target of inflammatory mediators such as interleukin-1β (IL-1β), 15 homocysteine,16,17 and tumor necrosis factor alpha, 18 while multiple animal models of CNS diseases have shown loss of CLDN5 is a common phenomenon associated with BBB dysfunction.16,18–23
Maturation of endothelial tight junctions produced by high levels of CLDN5 is known to require AKT-dependent inactivation and dissociation of the transcription factor FOXO1 from a silencer region within the Cldn5 promoter.13,15 Under certain proinflammatory conditions, FOXO1 can re-occupy this silencer, resulting in CLDN5 downregulation and endothelial barrier dysfunction.15,24,25 Moreover, we have shown in vitro that siRNA-mediated knockdown of FoxO1 prevents loss of CLDN5 during IL-1β-mediated barrier dysfunction, 15 suggesting that targeting FOXO1 inactivation directly or through upstream regulators, such as AKT, could be an effective means for therapeutic preservation of CLDN5 during inflammation.
Given the complexity and extensiveness of the AKT signaling network, it is not surprising that the outcome of AKT signaling on endothelial barrier maintenance appears to be highly context-dependent. This convolution is, in part, due to AKT isoforms that can have both overlapping and distinct functions, 26 of which both AKT1 and AKT2 have been shown to have unique regulatory roles in vascular endothelium. While much remains undetermined about these isoform-specific functions, AKT1 is known to be involved in the proinflammatory-mediated loss of endothelial barrier integrity, while its deficiency protects against endothelial hyperpermeability in a λ-carrageenan-induced edema model. 27 By way of contrast, AKT2 is known to distinctly regulate endothelial insulin signaling, 28 but it remains largely unknown whether AKT2 is involved in any modulation of barrier integrity.
The role of vascular insulin signaling in endothelial barrier maintenance is even more complicated, as some groups have shown insulin-mediated barrier enhancement, while others have shown negligible effects.29–31 Although vascular insulin signaling canonically acts through the insulin receptor (IR), insulin is well-known to be cross-reactive with the insulin-like growth factor 1 receptor (IGF1R) and vice versa with insulin-like growth factors (IGFs) cross-reacting with the IR. Despite a high degree of homology between these two receptors, knockout studies have demonstrated that these pathways mediate very distinct cellular and physiological processes. Namely, the IGF1R primarily mediates mitogenic pathways, while the IR regulates metabolic effects. Due to insulin’s receptor promiscuity and conflicting information regarding the effects of insulin on BBB integrity, identifying selective agonists would undoubtedly aid in clarifying the role for IR-specific signaling in endothelial barrier modulation.
Given that FOXO1 inactivation is a known metabolic target for IR signaling, 32 we explored a novel role for IR/AKT/FOXO1-signaling to regulate CLDN5-dependent BBB integrity. First, we establish a pathophysiological relevance for studying this pathway by analyzing brain microvessels isolated from mice with neuroinflammation-induced BBB disruption and demonstrate increased FOXO1 concurrent with decreased CLDN5. We next show that AKT-mediated regulation of CLDN5 and brain microvascular endothelial cell (BMVEC) integrity is distinct to the AKT2 isoform. Furthermore, the selective IR agonist demethylasterriquinone B1 (DMAQ-B1), unlike insulin or IGF-1, preferentially induces IR signaling, decreases FOXO1 nuclear accumulation, upregulates CLDN5, and enhances barrier function in cultured BMVECs. Finally, and most importantly, we demonstrate that DMAQ-B1-dependent IR/AKT2/FOXO1-signaling reverses inflammation-mediated CLDN5 loss and BBB dysfunction. The results from these experiments establish that selective activation of the IR can reverse the aberrant loss of BBB integrity during inflammation. We suggest targeting the IR/AKT2/FOXO1/CLDN5-axis as a potential therapy in CNS diseases associated with BBB dysfunction.
Material and methods
Reagents and supplies
A complete list of reagents and supplies including purchasing information can be found in Supplementary Tables 1 and 2.
Animal use
Mice used in these studies were C57BL/6 J purchased from Jackson Laboratory. Animals were maintained under a 12-h light/dark schedule with food and water ad libitum. All animal use was approved by the Institutional Animal Care and Use Committees at the University of South Florida and Boise State University and was performed in accordance with the Guide for the Care and Use of Laboratory Animals. All experiments have been reported in compliance with the ARRIVE guidelines.
Experimental autoimmune encephalomyelitis and DMAQ-B1 pharmacotherapy
Ten-week-old male mice were immunized with experimental autoimmune encephalomyelitis (EAE)-inducing kits per the manufacturer’s instructions (Hooke Labs, MA) and standardized protocols.33,34 All analyses and treatments were performed during the preclinical stage at seven to eight days post-induction (d.p.i.), which is a time frame well-established for the onset of EAE-induced BBB dysfunction. 35 For pharmacologic studies, EAE mice (7 d.p.i.) or controls were randomly assigned to receive a single dose of DMAQ-B1 (5 mg/kg) or vehicle (0.5% methylcellulose). 36 Methylcellulose and DMAQ-B1 were prepared fresh daily and administered via oral-gavage with a stainless-steel curved gavage needle (18 G, 5 cm length, 2.4 mm tip; Kent Scientific). Mice were monitored for signs of distress or hypoglycemia for 24 h. Pilot studies revealed that a single-dose of 5 mg/kg did not result in any hypoglycemic episodes.
Analyses of BBB integrity
As previously described with minor modifications, Evans blue (EB) extravasation assays were used to determine EAE-induced BBB dysfunction.37,38 Briefly, for EB leakage studies in Figure 1(a), animals (n = 3; EAE – 7 d.p.i.) were injected I.P. with 100 µL of 2% EB in PBS, or PBS alone as a ‘no EB’ control for autofluorescence, 24 h prior to Lactated Ringer’s (LR) flushes via transcardial perfusion and perfusion fixation with 4% paraformaldehyde (PFA). Brains were excised and sectioned into 1 mm slices from rostral to caudal using a coronal Adult Mouse Brain Slicer (Zivic Instruments). Slices were arranged and imaged at 700 and 800 nm with a near-infrared imaging system (Odyssey CLx; LI-COR Biosciences). For EB leakage studies in Figure 7(e) and (f) (n = 5–6), blood was collected via cardiac puncture and brains were removed after LR flushes and divided into right and left halves. The right half was post-fixed for 24 h in 4% PFA and a sagittal image was obtained with the Odyssey CLx, as shown in Figure 1(a). The left half was homogenized in 1 mL of PBS. EB from the homogenates and plasma was extracted into formamide (2 mL at 60 ℃ for 24 h) and supernatants (5000 × g for 30 min) were compared against an EB standard curve. As an indicator of BBB protein leakage, brain/serum EB concentrations were normalized per brain weight (mg), and values are represented as fold change from control.
Brain microvessels from mice with EAE-induced BBB dysfunction have increased nuclear FOXO1 and decreased tight junctional expression of CLDN5. EAE or mock-EAE (Ctrl) were induced per standard protocols and analyzed for BBB dysfunction eight days post-induction (d.p.i.). (a) Proof-of-principle that EAE mice 8 d.p.i. have BBB dysfunction. Qualitative plasma protein leakage into the mouse brains was determined by imaging Evans blue (EB) extravasation. Representative images of 1 mm coronal brain slices (olfactory bulbs not included) showing EB leakage captured at 700 nm (pseudo-colored blue) and brain autofluorescence at 800 nm (pseudo-colored grayscale) with a near-infrared imaging scanner. (b) Representative confocal micrographs of isolated brain microvessels (those ≤ 30 µm in diameter) immunostained for either FOXO1, ZO-1, and/or CLDN5, then counterstained with DAPI to demarcate nuclei. In total, 27 mice per group were used and microvessel pellets were pooled together from 3 mice each for a total of 9 pools per group. (c–f) Imaris 3D visualization software was used to analyze confocal micrographs and quantify: (c) total FOXO1 (tFOXO1) density; (d) nuclear-localized FOXO1 (nFOXO1) per uniform spherical volume of interest (VOI) centered within each nucleus; and 3D density of ZO-1 (e) and CLDN5 (f) at endothelial cell–cell contacts. Data are represented as aligned dot plots, where each dot represents a microvessel pool. (g–h) Representative Western blots and densitometry analysis for tFOXO1 (g) and CLDN5 (h). In total, nine mice per group were used and microvessel pellets were pooled together from three mice each for a total of three pools per group. Data are represented as scatter dot plots overlaid with mean fold change compared to control group plus corresponding p-value reported above each comparison.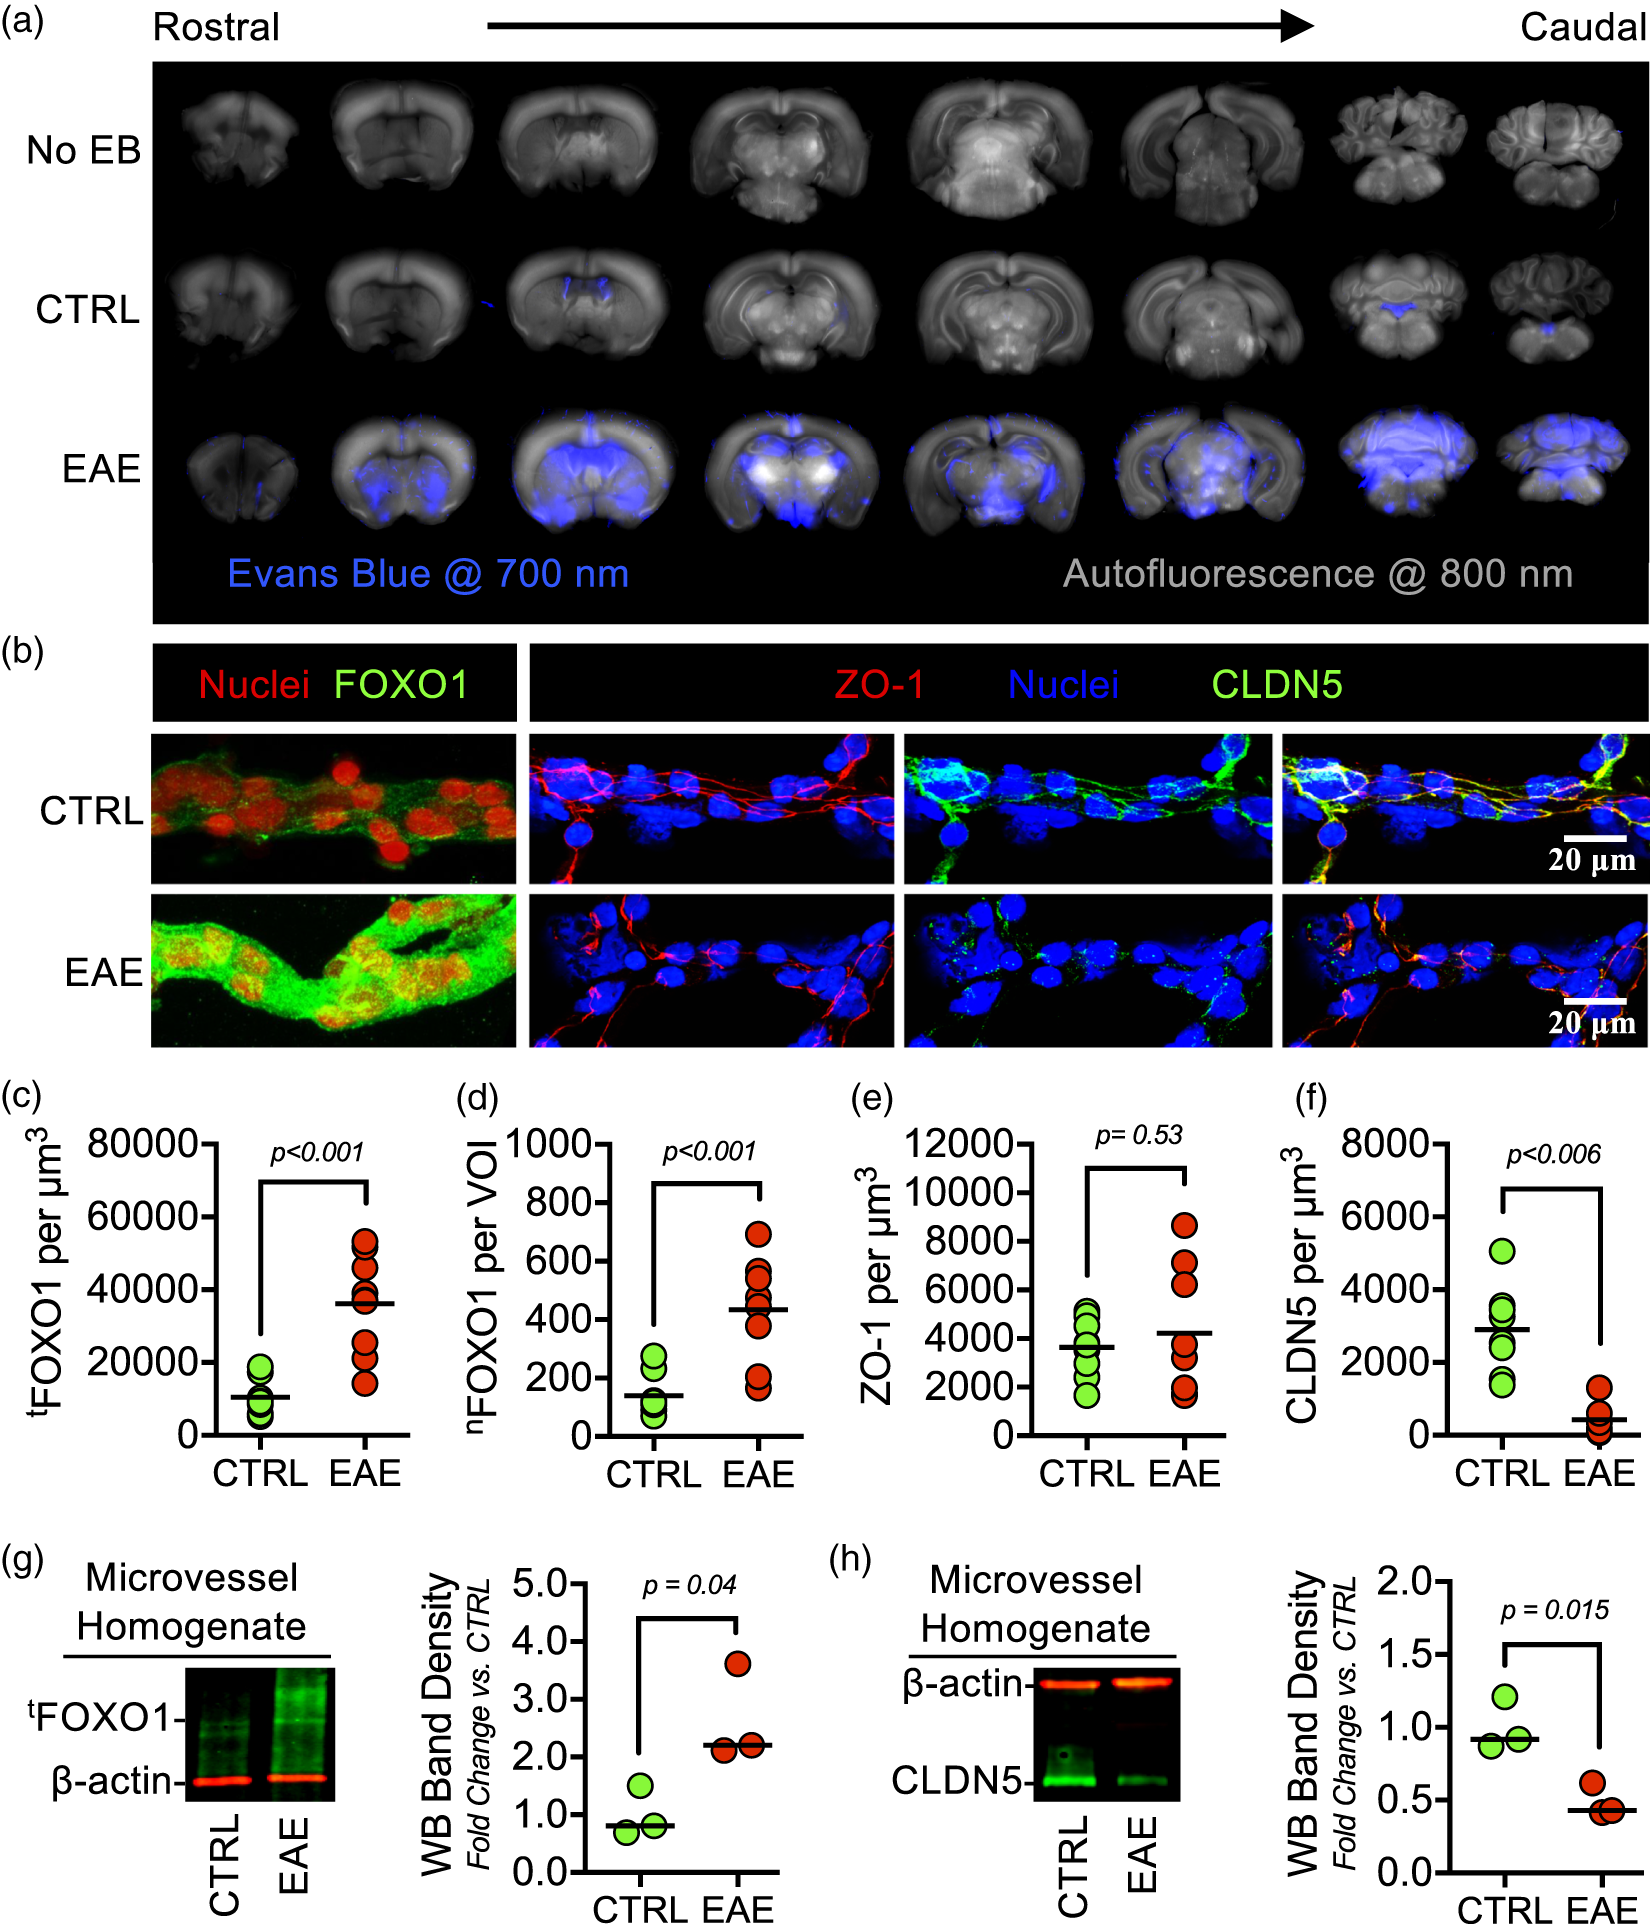
In an additional set of experiments (Figure 7(g)), sodium fluorescein extravasation assays were used as an indicator of small solute (376 Da; Stokes' radius ≈ 0.45 nm) leakage.16,39 Mice (n = 3; EAE – 8 d.p.i) were injected I.P. with 5 µL/g of 10% sodium fluorescein in saline solution. After 2 h, blood was collected by cardiac puncture, the remaining blood in the cerebrovasculature was flushed with LR, and brains were rapidly excised. Diluted blood-serum (1:10 in PBS) and supernatants (12,000 × g for 15 min at 4℃) from brain homogenates (6 strokes with loose-fitting Dounce homogenizer) were diluted 1:10 in 20% trichloroacetic acid (TCA). After incubation at 4℃ for 24 h, supernatants (12,000 × g for 15 min) were removed and diluted with equal volumes of borate buffer (0.05 M, pH 10). Fluorescence (ex. 480 nm, em. 538 nm) from sample supernatants containing solubilized sodium fluorescein in 10% TCA and 0.025 M borate buffer was quantified, brain/serum sodium fluorescein concentration values were normalized per brain weight (mg), and values are represented as fold change from control.
Microvessel isolation and characterization
Microvessel isolations were performed as previously described. 40 Whole brains were excised, meninges and pial vessels were carefully removed, and the remaining tissue was homogenized (six strokes with a loose-fitting Dounce homogenizer) in phenol-free DMEM + 2% FBS (DMEM-S). Homogenates were then mixed 1:1 with 36% dextran (∼70 kDa; Sigma), and centrifuged for 10 min at 10,000 × g. Pellets were resuspended in DMEM-S and sieved through a 70 µm strainer to retain large vessels and allow microvessels to pass through. To reduce RBC contamination, microvessel pellets were layered over Percoll and centrifuged at 1700 × g for 10 min. The microvessel enriched pellet was rinsed twice with DMEM and used for further analyses.
For immunostaining and confocal fluorescence microscopy experiments, isolated microvessels from three mice were pooled (n = 27; 9 pools of 3), fixed with 4% PFA and permeabilized with 10% donkey serum containing 0.05% Triton X-100. Microvessels were immunostained per standard protocols with appropriate primary and secondary antibodies in microfuge tubes with end-over-end rotation (see Supplementary Table 2). Stained vessels were adhered to slides via cytocentrifugation (Cytospin, Thermo Shandon), then mounted in Vectashield containing DAPI to coverslips. Confocal micrographs were taken with an Olympus FLUOVIEW FV1000 confocal laser scanning microscope (Olympus), and image stacks were analyzed and processed with Imaris (Bitplane). For Figure 1(b) to (f), Imaris ‘Surface’ rendering (thresholding) was used to define regions showing positive fluorescence intensity and then the average intensity per voxel in those regions, or volumes of interest (VOI), was determined. For Figure 1(d), nuclei were defined by thresholding and FOXO1 intensities only within these nuclear VOIs were measured.
For Western blotting, microvessels were isolated as above, except that mice were perfused (transcardial) with PBS containing protease and phosphatase inhibitors before excising the brain. Microvessel pellets from three mice were pooled (n = 9; 3 pools of 3), resuspended in ice-cold RIPA with protease and phosphatase inhibitors, homogenized (20 strokes with tight-fitting Dounce homogenizer) and incubated on ice for 20 min. Samples were centrifuged at 12,000 × g for 10 min at 4℃, supernatants were collected, protein concentrations were determined by BCA assay, and sample protein was normalized in Laemmli sample buffer.
Primary BMVEC isolation
As we have previously described, 15 primary BMVECs were obtained from isolated microvessels (described above) of C57BL/6 J pups between P7 and P10 (∼10 pups for a confluent 25 cm2 monolayer). The resultant microvessel pellets were resuspended in HBSS with collagenase/dispase, DNase I, and Na-tosyl-L-lysine chloromethyl ketone (TLCK) for 40 min at 37℃. BMVECs were pelleted, washed with DMEM-S, seeded at confluence, and grown on collagen type IV-coated plates in endothelial growth medium (Cell Biologics) at 37℃ with 5% CO2 in a humidified incubator. Unless otherwise stated in figure legends, only initially plated cells (P0) or cells passaged once (P1) at a 1:1 ratio were used in these experiments. Additionally, before use in experiments, BMVECs were grown for two to seven days post-confluence (P.C.) to allow for proper maturation of tight junctions.
BMVEC barrier function assays
Endothelial cell barrier functional assays were conducted as we have previously demonstrated. 15 For solute permeability and transwell transendothelial electrical resistance (TEER) assays, BMVEC monolayers were grown seven days P.C. in collagen type IV-coated, 0.4 µm PTFE transwell inserts prior to inflammatory injury and/or treatment with pharmacologic and molecular interventions. Before adding sodium fluorescein (0.5 mg/mL) to the luminal chamber, stable measurements of TEER (Ω × cm2) were obtained with a Millicell-ERS voltohmmeter (EMD Millipore). Then, 30 min after luminal addition of sodium fluorescein, samples were collected from both the upper (luminal) and lower (abluminal) chambers for fluorescence analyses. Sodium fluorescein concentrations were determined using a standard curve and the sodium fluorescein permeability coefficient (Ps) was calculated as follows: PS = [A]/t×1/A×V/[L] where [A] is the abluminal concentration; t is the time in seconds; A is the area of the membrane in cm2; V is the volume of the abluminal chamber; and [L] is the luminal concentration. For electric cell-substrate impedance (ECIS)-based TEER assays, an indicator of cell-cell adhesive barrier resistance, the barrier function of cultured BMVEC monolayers was determined by measuring real-time TEER using an ECIS sensor (ECIS Zθ, Applied BioPhysics). ECIS tracings are presented as normalized TEER, and peak changes are quantified for statistical analyses.
Gene silencing
Introduction of siRNA duplexes was achieved using a Nucleofector® Kit from Amaxa Biosystems (MD, USA), as we have previously described. 15 BMVECs (1 × 10⁶) were resuspended in 100 µL of transfection solution, mixed to final concentration of 2 μM siRNA, and transfected with program T-011 on the Nucleofector IIb™ device. Cells were plated onto collagen type IV-coated ECIS arrays, transwell inserts and/or culture flasks.
BMVEC immunocytochemistry
Tight junction proteins were immunostained in BMVEC monolayers per standard immunohistochemistry (ICC) protocols and as we have shown before.15,41,42 BMVECs were grown to 48 h P.C. on glass coverslips and treated with various doses of DMAQ-B1 for 6 h. Cell monolayers were fixed with 4% PFA, permeabilized with 0.05% Triton X-100, blocked with 2% BSA in PBS, and probed with anti-CLDN5 (AF 488) and anti-ZO-1 (AF 594) primary conjugated antibodies overnight at 4℃. Coverslips were mounted with Vectashield containing DAPI, confocal micrographs were obtained with Olympus FLUOVIEW FV1000 confocal laser-scanning microscope, and images were analyzed and processed with Imaris (Bitplane). For Figure 5, ZO-1+ areas at endothelial cell–cell borders were defined by thresholding with Surface rendering in Imaris software. Then the total CLDN5 intensity in these ZO-1+ areas was measured and divided by ZO-1+ areas to provide average CLDN5. For representative 3D images, a 3D-colocalization channel (yellow) was used to highlight the increased density of CLDN5 in tight junction complexes.
Sandwich FLISAs
Three separate sandwich fluorescent-linked immunosorbent assays (FLISAs) were used per standard protocols and adapted for detection with the Odyssey CLx. Briefly, microtiter plates were coated with capture antibodies (5 µg/mL) in carbonate/bicarbonate buffer (pH 9.6) overnight at 4℃, and blocked at RT for 1 h. Protein concentrations of BMVEC lysates were normalized (BCA assay) and incubated in capture antibody-coated wells for 90 min at 37℃. Plates were washed with TBS + 0.05% Tween-20 (TBST) and then incubated with detection antibodies for 2 h at RT. Plates were either imaged immediately on Odyssey CLx (IRDye® 800CW-conjugated primary antibodies) or incubated with IRDye® 800CW-conjugated secondary antibody for 1 h at RT before imaging. As an indicator of IR and IGFR1 activity, a sandwich FLISA was developed to determine tyrosine phosphorylation on insulin receptor substrate 1 (IRS-1). A mouse anti-IRS-1 antibody was used as the capture antibody, and a primary rabbit anti-phosphotyrosine followed by a secondary IRDye® 800CW-conjugated donkey anti-rabbit was used as the detection antibody. In order to identify the isoform-specificity of AKT activation loop phosphorylation at T308 (pT308 on AKT), isoform-specific rabbit monoclonal antibodies against either AKT1 or AKT2 were used as capture antibodies and an IRDye® 800CW-conjugated rabbit anti-pAKT(T308) was used as the detection antibody. An IRDye® 800CW Labeling Kit (LI-COR Biosciences) was used for primary conjugation to the rabbit anti-pAKT(T308), as per the manufacturer’s instructions.
High-salt nuclear extraction
Nuclear isolation and protein extraction was performed as previously described. 15 Following treatments, BMVECs were collected into non-nuclear extraction buffer (Buffer A: 10 mM HEPES, 1.5 mM MgCl2, 10 mM KCl, 0.5 mM DTT, 0.05% NP40, pH 7.9) with protease and phosphatase inhibitors. Nuclei were pelleted and washed. Pellets were resuspended in Buffer B (5 mM HEPES, 1.5 mM MgCl2, 0.2 mM EDTA, 0.5 mM DTT, 26% glycerol (v/v), 300 mM NaCl, pH 7.9). Samples were homogenized (20 strokes tight-fitting Dounce homogenizer), incubated on ice for 30 min, centrifuged at 24,000 × g for 20 min at 4℃, and the supernatant was collected as nuclear extract. Protein from nuclear extract was quantified (BCA assay) and normalized in Laemmli sample buffer.
mRNA and protein analyses
For real-time quantitative PCR (qPCR) assays, mRNA was isolated from BMVEC monolayers with RNAzol® following manufacturer’s procedures. RNA was normalized, and reverse transcription was completed with iScript™ cDNA Synthesis Kit according to the manufacturer’s procedures. Quantification cycle (Cq) values were determined with quantitative real-time PCR in accordance with the PrimePCR™ assay. The 2−ΔΔCq method was used as a relative quantification strategy with the results presented as the fold change of target gene expression in a target sample relative to a control sample, normalized to β-actin as the reference gene. For Western blotting, two-color near-finrared immunoblotting was completed per standardized protocols and imaged with an Odyssey CLx scanner.
Statistical analyses
All statistical analyses were performed with Prism (Version 7.0 e; Graphpad Software, Inc.). α was set at 0.05 a priori for statistical significance. No specific blinding was performed in these studies. A detailed list of statistical analyses is provided in Supplementary Table 3.
Results
Endothelial FOXO1 is activated and CLDN5 is downregulated during neuroinflammation
EAE-induced BBB dysfunction precedes the onset of CNS damage, demyelination, and paralysis. 43 Accordingly, CLDN5 loss from BBB has also been reported during EAE.20,35,45 Using this model, we analyzed EB leakage to confirm neuroinflammatory-mediated BBB dysfunction (Figure 1(a)). Given the knowledge, albeit primarily based on cell culture studies, that CLDN5 is regulated by FOXO1-mediated transcriptional repression,13,15,25 we then sought out evidence for this mechanism in microvessels isolated from mice with EAE-induced BBB dysfunction. As hypothesized, microvessels from EAE mice have significantly total and nuclear-localized FOXO1 (tFOXO1 and nFOXO1, respectively) staining (Figure 1(b) to (d)). At BBB tight junctions, ZO-1 expression remained unchanged and served as a volume of interest (VOI) to analyze changes in CLDN5 density (Figure 1(b), (e) and (f)). Expressional changes were also confirmed by immunoblotting microvessel homogenates (Figure 1(g) and (h)).
BMVEC regulation of CLDN5 by AKT is isoform-specific
Next, we investigated AKT isoform-specific regulation of CLDN5-dependent BMVEC barrier function. We tested several conditions where CLDN5 expression is known to change and evaluated relative differences in the most likely AKT isoforms to be involved in CLDN5 regulation, AKT1 and AKT2 (Figure 2). BBB endothelial cells are known to lose their barrier properties in culture, especially with subsequent passaging. Here we demonstrate by immunoblotting BMVEC lysates that CLDN5 and AKT2, but not AKT1, are significantly decreased after passaging freshly isolated BMVECs (P0) (Figure 2(a)). Knowing that BMVEC CLDN5 expression levels continue to incrementally increase for several days after confluence, we compared the daily changes in expression levels of Akt1, Akt2, and Cldn5 in BMVEC monolayers relative to the levels in subconfluent BMVECs (Figure 2(b)). While relative mRNA for all of these genes increased after confluence (1 day P.C.), only Akt2 and Cldn5 continued over the following days. To determine the direct isoform-specific effect of AKT on CLDN5, we silenced Akt1 and Akt2 with siRNA and evaluated CLDN5 expression and TEER. Knockdown efficiency was ∼50% for both AKT1 and AKT2. However, immunoblotting the same lysates for CLDN5 revealed that only knockdown of AKT2 had any detectable effect on CLDN5 expression (Figure 2(c) and (d)). Simultaneously, the effects of Akt1 and Akt2 silencing on BMVEC monolayers revealed that loss of AKT2 causes significant barrier dysfunction (Figure 2(e)). Interestingly, AKT1 knockdown produced a nominal increase in barrier integrity, which is consistent with the findings that suggest AKT1 activation may be involved in hyperpermeability.
27
The AKT2 isoform is distinctly correlated with primary BMVEC barrier integrity and changes in CLDN5 expression. (a) Freshly isolated BMVECs were seeded at confluence in cultureware (P0). Additional cells were passaged three times (P1–P3). BMVECs from each passage were allowed to mature for two days post-confluence (P.C.). Lysates were collected and expression levels of AKT1, AKT2, and CLDN5 were determined by Western blotting. Bar graphs are divided into individual datasets for each protein target and represent the mean ± S.D. Groups with the same symbol within each individual dataset are not significant from each other (p ≥ 0.05). (b) Conversely, total mRNA from P3 BMVECs was collected from sub-confluent (SC) cells and confluent monolayers each day through seven days P.C. Relative mRNA expression (ΔΔCq; fold change relative to SC samples normalized to β-actin as the reference gene) for Akt1, Akt2, and Cldn5 was determined by qRT-PCR. Bar graphs are divided into individual datasets for each mRNA target and represent the mean ± S.D. Asterisks indicate p < 0.05 versus 1 day P.C. for each target mRNA. (c–e) AKT1 and AKT2 were silenced in BMVECs by siRNA (siAkt1 or siAkt2). Confirmation of knockdown and the effect on CLDN5 expression was determined by Western blotting (c–d). Bar graphs are divided into individual datasets for each protein target and are represented as mean fold change compared to the siCtrl group plus corresponding p-value reported above each comparison. (e) Representative ECIS tracings demonstrating the impact of AKT1 or AKT2 knockdown on BMVEC barrier integrity from 24 to 120 h post-transfection. At least three independent experiments for each transfection were performed with cells from three separate BMVEC isolations. Each tracing was normalized to the first time point and the peak change in TEER was determined. Embedded bar graphs represent mean normalized peak change ± S.D. and groups with the same symbol are not significant from each other (p ≥ 0.05). (f–g) Comparison of inflammatory-mediated changes in AKT isoform expression levels in vitro and in vivo. (f) In vitro, mature BMVECs (P1; 7 days P.C.) were stimulated with IL-1β [100 ng/mL] or vehicle control (−) for 24 h and expression levels of AKT1 and AKT2 were compared by Western blotting. Bar graphs are divided into individual datasets for each protein target and are represented as mean fold change compared to the control group plus corresponding p-value reported above each comparison. (g) In vivo, EAE was induced in mice and compared to mock controls. After 8 d.p.i., brain microvessels were isolated from both groups and AKT1-2 expression was determined by Western blotting. Bar graphs are divided into individual datasets for each protein target and are represented as mean fold change compared to the control group plus corresponding p-value reported above each comparison.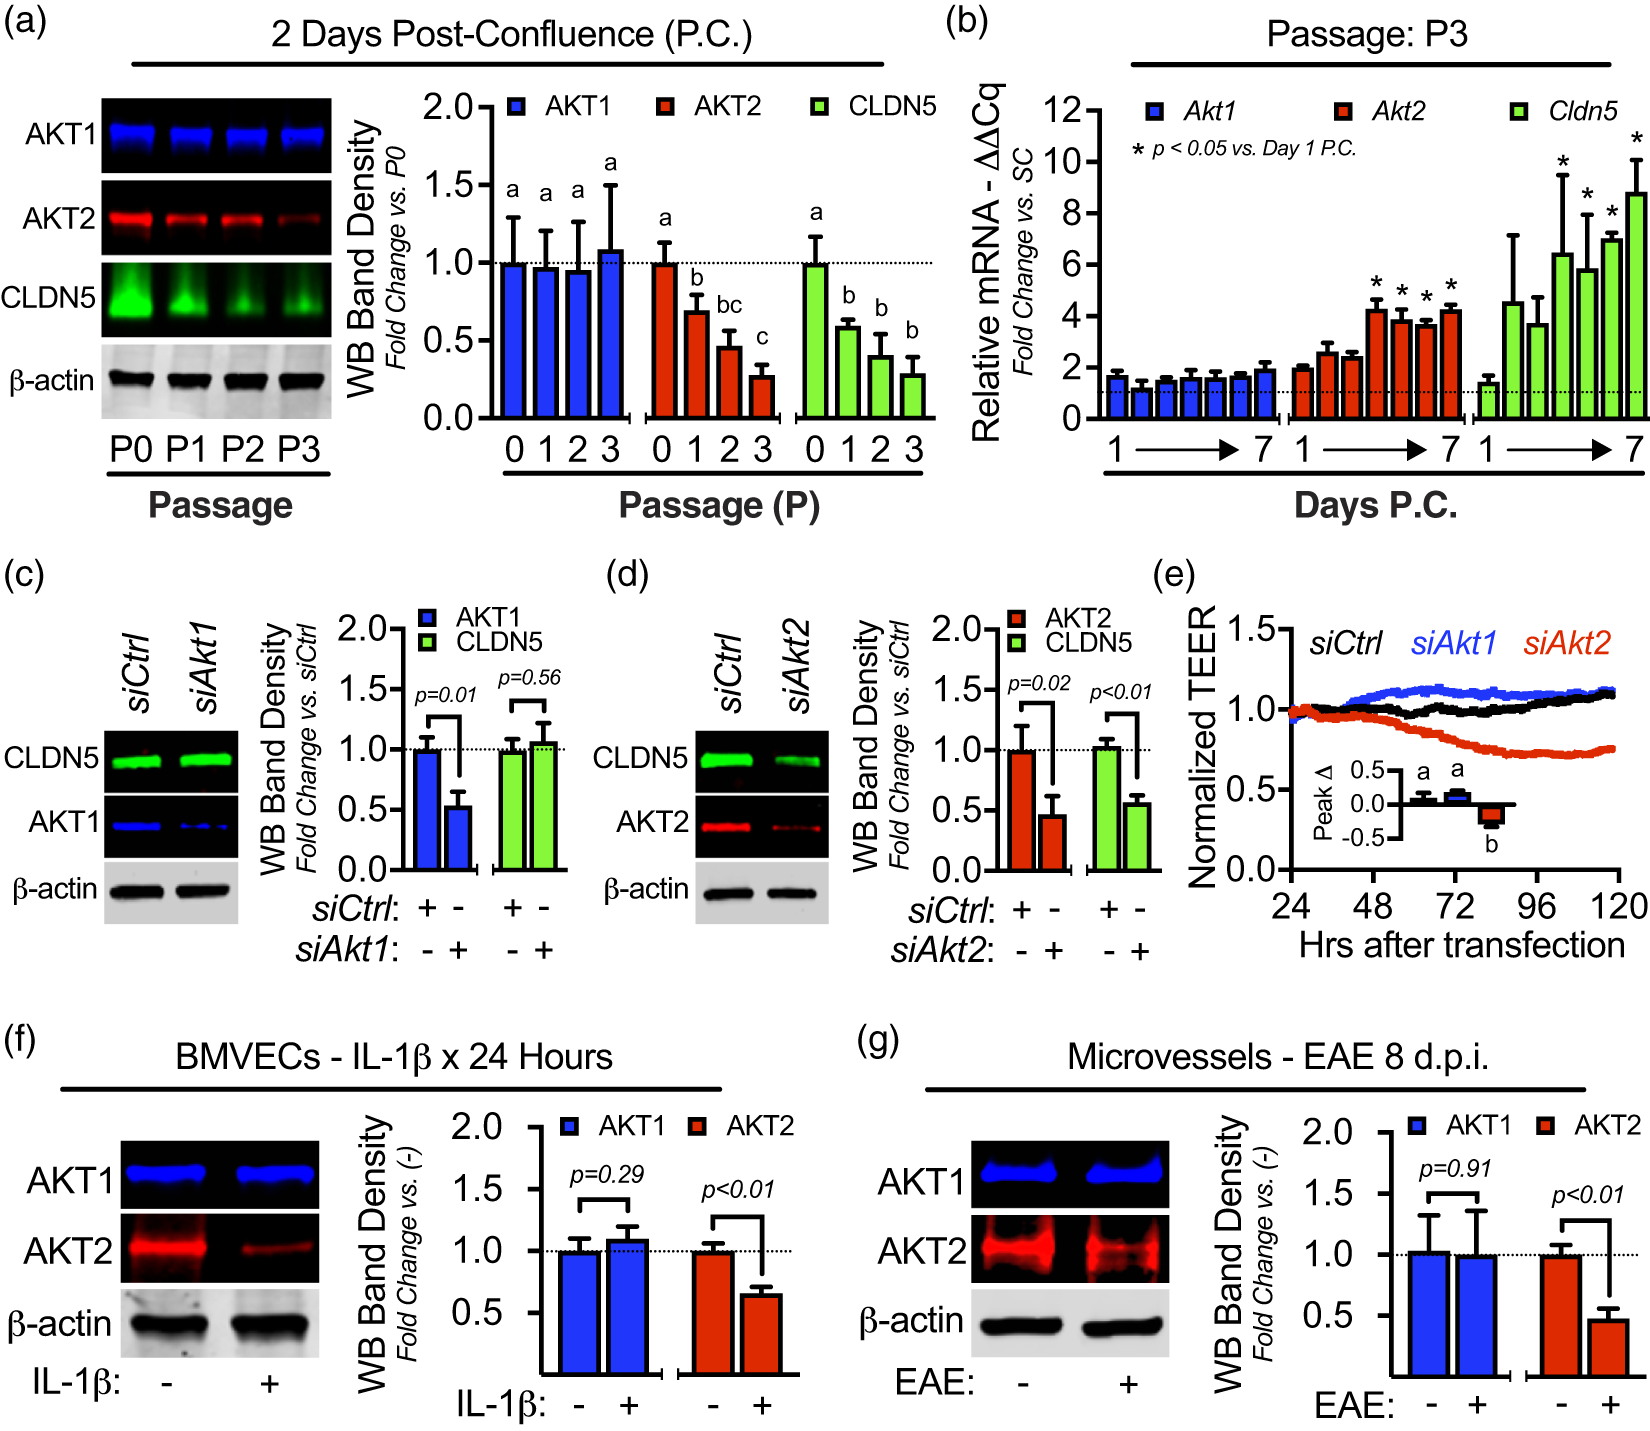
We previously reported that exposing BMVECs to elevated IL-1β for 1.5 h causes AKT inactivation (decreased pT308 on AKT), FOXO1 activation (increased pT24 on FOXO1, nuclear accumulation, and occupancy on Cldn5 silencer), and CLDN5 loss (decreased mRNA and protein) sustained for at least 24 h. 15 Here, we found that exposing BMVECs to IL-1β for 24 h also leads to loss of AKT2 expression, but not AKT1 (Figure 2(f)). Since we have shown in this work that nuclear accumulation of FOXO1 and downregulation of CLDN5 are present in brain microvessels of EAE mice (Figure 1), we immunoblotted those same lysates for expression levels of AKT1 and AKT2 (Figure 2(g)). As with IL-1β-mediated loss of AKT2, microvessels from EAE mice have decreased AKT2 with no loss of AKT1.
Selective activation of IR signaling in BMVECs enhances barrier integrity
While the role of AKT1 in endothelial cells has been well-studied, the only known function in endothelium for which AKT2 may be the predominant mediator is insulin signaling. Although the insulin signaling pathway is well-known to regulate FOXO transcription factors,
46
there is a scarcity of knowledge regarding insulin signaling in the regulation of CLDN5-dependent BBB integrity. This lack of information is likely because of multiple confounders that make it difficult to study insulin-receptor signaling, such as receptor promiscuity and overlapping functions of insulin and IGFs, heterogeneous IR and IGFR expression, heterodimerization of the IR and IGFR subunits, insulin resistance, and multiple intracellular targets. Thus, in these studies, we used the IR-selective agonist DMAQ-B1 and compared it to insulin- and IGF-signaling in BMVECs. Since IRS-1 can be a common substrate for both IR and IGFR tyrosine kinases
47
and may be upstream of AKT2/FOXO1-signaling,
46
we used sandwich FLISAs to identify the EC50 of insulin (Figure 3(a)), IGF-1 (Figure 3(b)), and DMAQ-B1 (Figure 3(c)), on tyrosine phosphorylation of IRS-1. The EC50 for insulin and IGF-1 was within the physiological response ranges,
48
and the EC50 for DMAQ-B1 was similar to previous reports.
36
The IR agonist DMAQ-B1 selectively triggers the IR/AKT/FOXO1/CLDN5 signaling axis and enhances BMVEC barrier function. BMVECs were allowed to mature for 48 h P.C. and then treated with varying concentrations of insulin, IGF-1, or DMAQ-B1. (a–c) After 45 min, cell lysates were analyzed with a sandwich FLISA (capture Ab = anti-IRS-1, detection Ab = anti-pY) to determine total tyrosine phosphorylation on IRS-1 (pY IRS-1). Dots represent median percentage of maximal dose-response ± IQR and EC50 values were obtained from dose-response curves. (d–e) Representative Western blots and densitometry analyses for active AKT (pT308), active Erk1/2 (pT202/pY204), and nFOXO1 (blotting nuclear lysates for FOXO1) were determined after treating BMVECs for 45 min with insulin [2 nM], IGF-1 [20 nM], or DMAQ-B1 [5 μM]. Subsequent changes in CLDN5 expression 6 hours after treatment were also determined by Western blotting and densitometry (e). Data for each protein target are represented as mean fold change compared to the no treatment group ± S.D. Within each individual protein target dataset, groups with the same symbol are not significant from each other (p ≥ 0.05). Target proteins were not compared against each other. (f–h) Changes in BMVEC barrier resistance to insulin, IGF-1, or DMAQ-B1 were evaluated for 6 h after treatment. At least three independent ECIS experiments were performed with cells from three separate BMVEC isolations. Each tracing was normalized to its baseline and peak change in TEER was determined. Representative tracings for treatment groups are depicted by colored lines and untreated controls are depicted by black lines. Embedded bar graphs represent mean normalized peak changes in TEER ± S.D. Asterisks indicate p < 0.05 versus untreated controls and n.s. indicates no significance.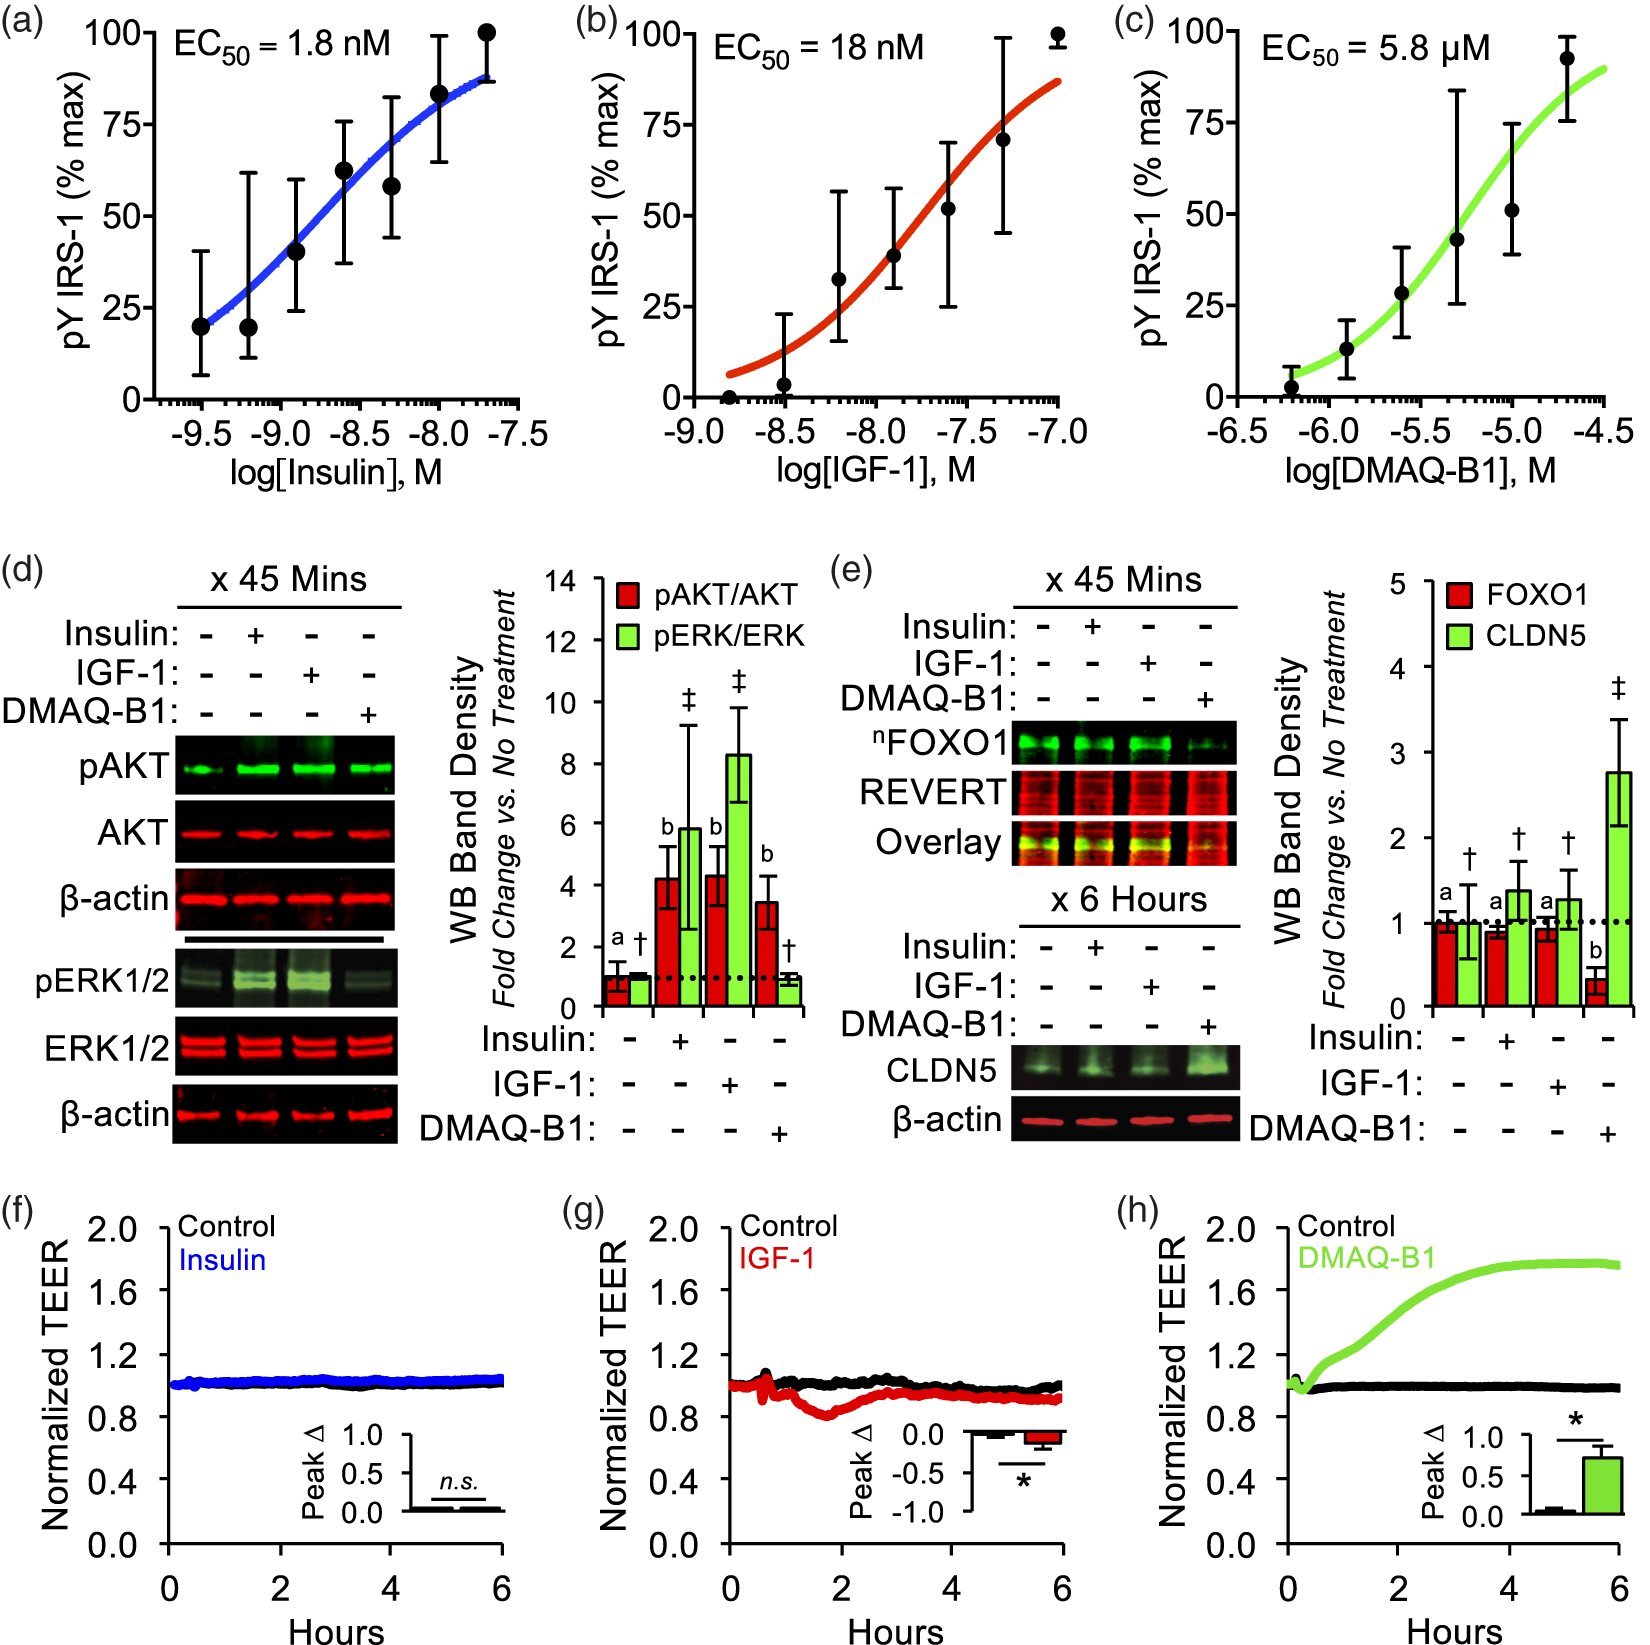
As one of several small-molecule IR agonists that have been tested for their utility as oral anti-diabetics, DMAQ-B1 was discovered to preferentially trigger IR-dependent activation of PI3K/AKT signaling at low concentrations, without activating the IGF1R or its canonical downstream ERK1/2 pathway. 53 Using the EC50 for pIRS-1, we found that treating BMVECs with insulin [2 nM], IGF-1 [20 nM], and DMAQ-B1 [5 μM] all led to a similar increase in active AKT; however, only insulin and IGF-1 increased ERK activity (Figure 3(d)). Interestingly, even though all three agonists induced comparable phosphorylation of IRS-1 and AKT phosphorylation, only DMAQ-B1 led to decreased nuclear localization of FOXO1, upregulation of CLDN5, and enhancement of BMVEC barrier function (Figure 3(e) to (h)). To confirm that the presence of DMAQ-B1 had no confounding impact on BMVEC proliferation or viability in our cell culture studies, a stain-based cell cycle assay (DAPI) and a stain-based viability assay (calcein AM and propidium iodide) were conducted on BMVEC monolayers (P3; two days P.C.) following 6 h of incubation with DMAQ-B1 [5 μM] or a vehicle control and no differences were observed in either cell cycle distribution or ratio of viable to nonviable cells (Figure S1).
DMAQ-B1 promotes AKT2/FOXO1-signaling and increases Cldn5 mRNA upregulation
Further analyses of DMAQ-B1 revealed that DMAQ-B1 dose-dependently promotes AKT2-specific activation (pT308 on AKT2; Figure 4(a) and (b)), FOXO1 inactivation (decreased nuclear accumulation; Figure 4(c)), and transcriptional-mediated upregulation of Cldn5 (qRT-PCR/mRNA – Figure 4(d); ICC/protein – Figure 5; and WB/protein – Figure S2). Compared to vehicle (0 μM), treating BMVECs with 2.5, 5, and 10 μM of DMAQ-B1 increased total active AKT (pT308) after 45 min. However, sandwich FLISAs revealed that DMAQ-B1 [10 μM] significantly increased pT308 on AKT2, but not AKT1 (Figure 4(b)). Additionally, we found that Cldn5 mRNA is increased concurrently with decreased nFOXO1 following 45 min of treatment with DMAQ-B1. DMAQ-B1 also dose-dependently increased CLDN5 protein levels after 6 h (WB – Figure S1; ICC – Figure 5). Confocal analysis of fixed BMVECs demonstrated that increased CLDN5 levels were indeed localized to the EC–EC tight junctions demarcated by ZO-1, which was unchanged with DMAQ-B1 treatment. Furthermore, 3D rendering of a CLDN5 at ZO-1 colocalization channel highlights how upregulation of CLDN5 does not just increase its turnover, but significantly increases its density at EC–EC junctions (Figure 5).
DMAQ-B1 dose-dependently increases AKT2 activity, decreases FOXO1 nuclear accumulation, and upregulates Cldn5 mRNA. (a–d) BMVECs (P3; two days P.C.) were treated with DMAQ-B1 [0, 2.5, 5, or 10 μM] for 45 min and lysates were analyzed for AKT2 activity, nFOXO1 levels, and Cldn5 mRNA levels. (a) AKT activity was determined by Western blotting for pT308 on AKT (pAKT; not isoform-specific) and normalizing against total AKT (tAKT; not isoform-specific). Data are represented as mean fold change compared to the no treatment group ± S.D. Groups with the same symbol are not significant from each other (p ≥ 0.05). (b) AKT isoform-specific phosphorylation in response to DMAQ-B1 was determined by FLISAs using AKT1- or AKT2-specific antibodies as capture antibodies and pT308-AKT as the detection antibody. Bar graphs are divided into individual datasets for each protein target and are represented as mean fold change compared to the vehicle control (−) group ± S.D. and corresponding p-values reported above each comparison. (c) FOXO1 levels in BMVEC nuclear lysates were determined by Western blotting with lamin A/C used as a nuclear loading control. Data are represented as mean fold change compared to the vehicle control (0 μM) group ± S.D. Groups with the same symbol are not significant from each other (p ≥ 0.05). (d) Relative Cldn5 mRNA was determined by qRT-PCR. Data are represented as mean fold change compared to the no treatment group ± S.D. Groups with the same symbol are not significant from each other (p ≥ 0.05).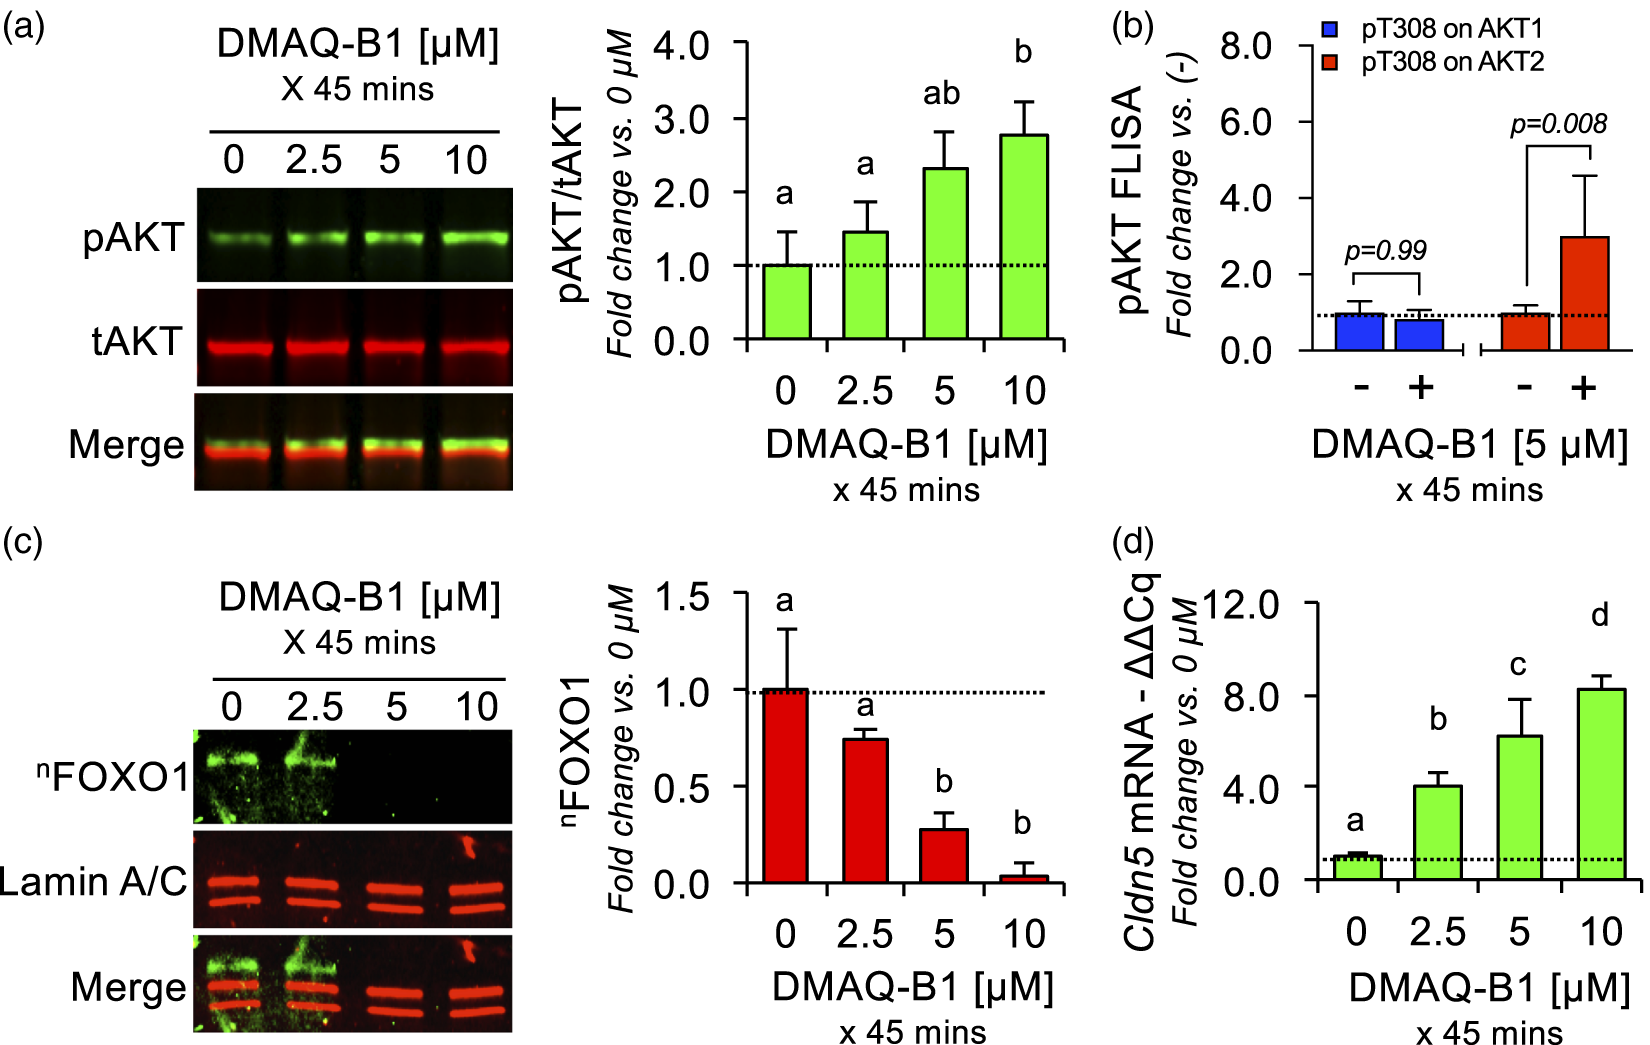
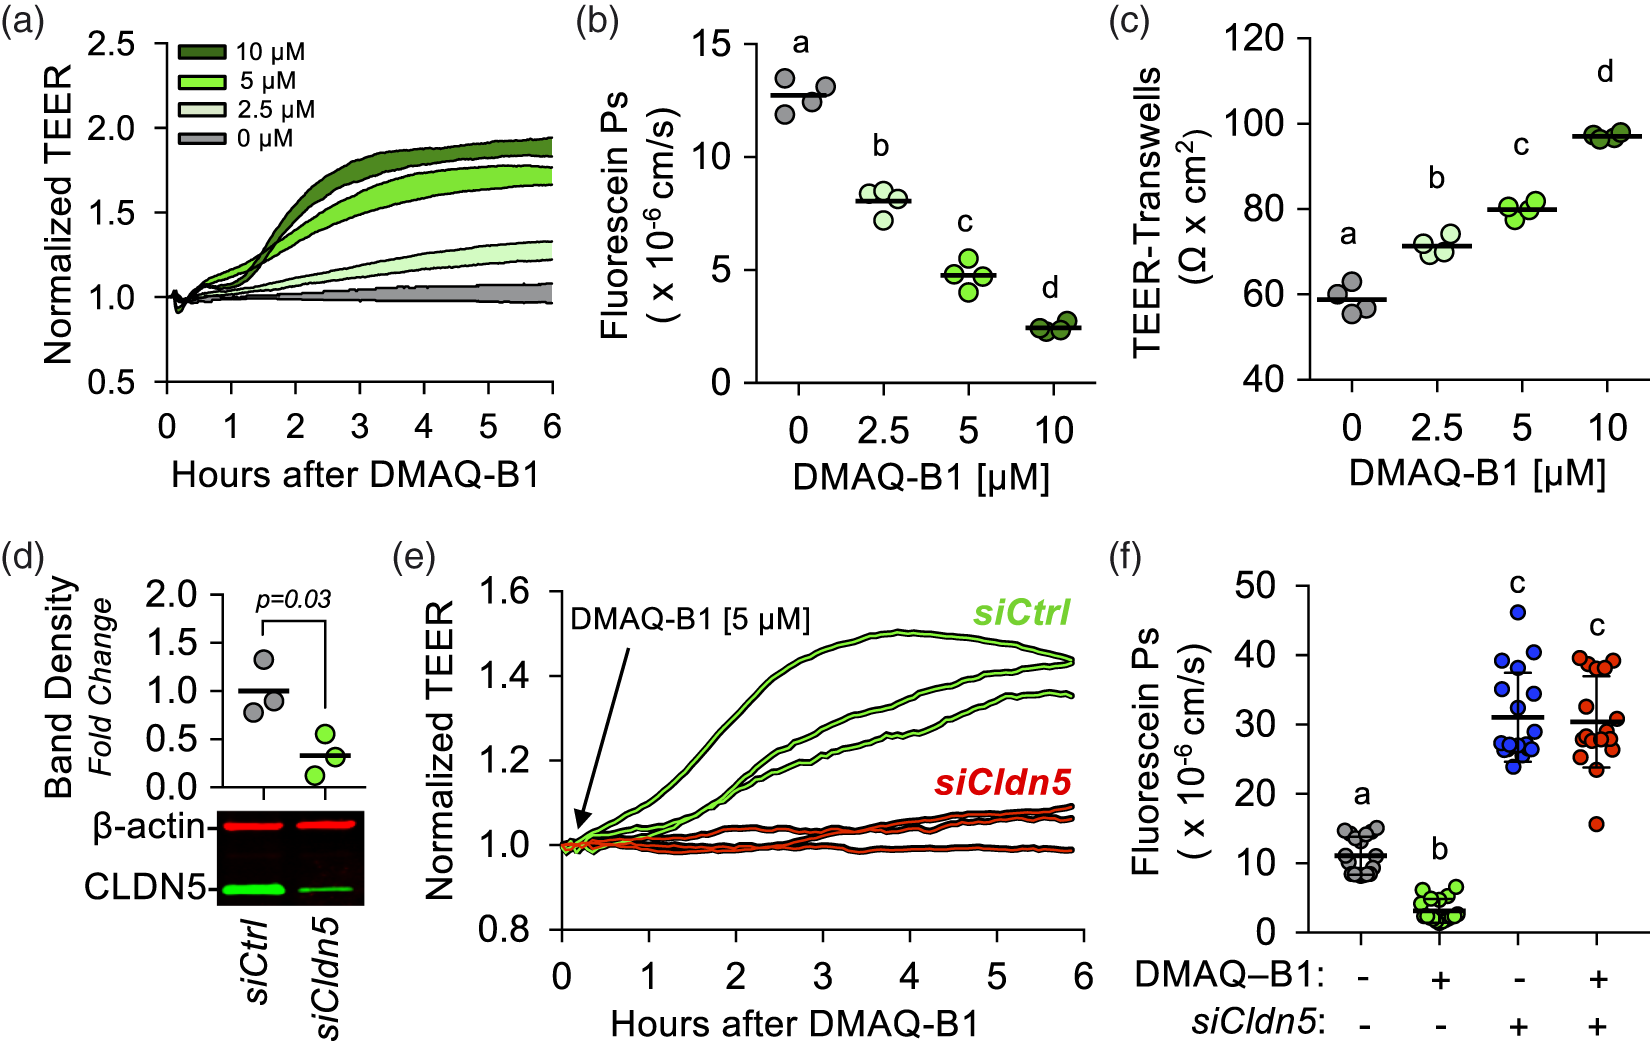
DMAQ-B1-mediated BMVEC barrier enhancement is dependent upon CLDN5 upregulation
Using three separate techniques to measure BMVEC barrier function, we found in all cases that DMAQ-B1 dose-dependently increases ECIS-TEER (Figure 6(a)), transwell-fluorescein permeability (Figure 6(b)), and transwell-TEER (Figure 6(c)). To determine a causal role for CLDN5 in DMAQ-B1-mediated BMVEC barrier enhancement, we silenced Cldn5 with siRNA (Figure 6(d)) and analyzed TEER (Figure 6(e)) or transwell permeability assays (Figure 6(f)). Efficiency of CLDN5 knockdown was determined by immunoblotting 24 h after transfection (Figure 6(d)). Cldn5-silenced monolayers abrogated the barrier-enhancing effects of DMAQ-B1 [5 μM; 6 h] compared to controls (Figure 6(e) and (f)).
DMAQ-B1-mediated upregulation of CLDN5 increases the density of CLDN5 protein at BMVEC tight junctions. BMVECs (P3; two days P.C.) were grown on glass coverslips and treated with DMAQ-B1 [0, 2.5, 5, or 10 μM] for 6 h. BMVEC monolayers (n = 5) were fixed and immunostained for ZO-1 and CLDN5, then counterstained with DAPI to demarcate nuclei (Blue). Confocal micrographs were obtained and Imaris software was used for image analyses and 3D rendering. Representative 2D images of ZO-1 (Red) and CLDN5 (Green) and corresponding graphs of intensity analyses are displayed in the top two rows. ZO-1 at BMVEC cell–cell contacts was used to establish a VOI at tight junctions and a 3D colocalization channel (Yellow; ZO-1+ and CLDN5+ voxels) was established for visual evaluation of CLDN5 expression at BMVEC tight junctions. Representative 2D merged images with 3D rendering of the colocalization channel displayed en face, and graph of CLDN5 intensity per VOI are displayed in the third row. The last row is the same 3D image area as those shown for 0 and 10 μM DMAQ-B1, but expanded and tilted to enhance visual representation. All graphs are represented as aligned dot plots overlaid with mean value (black line) and groups with the same symbol within each plot are not significant from each other (p ≥ 0.05). CLDN5 upregulation is necessary for DMAQ-B1-mediated BMVEC barrier enhancement. (a–c) DMAQ-B1 dose-dependently enhances BMVEC barrier function. (a) Representative ECIS tracings in response to DMAQ-B1 [0, 2.5, 5, or 10 μM]. At least three independent experiments for each treatment were performed with cells from three separate BMVEC isolations. Each tracing was normalized to the first time point and the filled area for each group represents mean change in TEER ± S.D. Alternatively, after 6 h of treating BMVEC monolayers grown in transwell inserts (P3; two days P.C.) with DMAQ-B1, sodium fluorescein permeability coefficients (Ps) were obtained (b) and transwell-TEER was measured (c). Data are represented as scatter dot plots overlaid with mean value (black line) and groups with the same symbol within each plot are not significant from each other (p ≥ 0.05). (d–f) The effects of CLDN5 knockdown on DMAQ-B1-mediated BMVEC barrier enhancement were determined with ECIS and transwell permeability assays. (d) Knockdown efficiency of CLDN5 in BMVECs as verified by Western blotting. Data are represented as scatter dot plots overlaid with mean value (black line) plus corresponding p-value reported above. (e) Representative spaghetti plots of individual ECIS tracings of BMVECs transfected with siCldn5 or siCtrl and then treated 24 h later with DMAQ-B1 [5 μM]. Each tracing was normalized to the first time point. (f) The effects of CLDN5 knockdown on BMVEC monolayer permeability to sodium fluorescein with or without DMAQ-B1 were measured. DMAQ-B1 [5 μM] was applied to BMVEC monolayers for 6 h, and permeability was calculated based on sodium fluorescein transendothelial diffusion rate. Data are represented as scatter dot plots overlaid with mean ± S.D. lines. Groups with the same symbol are not significant from each other (p ≥ 0.05). DMAQ-B1 reverses inflammation-mediated brain endothelial barrier dysfunction in vitro and in vivo. (a-d) BMVEC monolayers (P3; two days P.C.) were divided into four groups: (1) vehicle control (Ctrl), (2) IL-1β [100 ng/mL], (3) DMAQ-B1 [5 μM], or (4) DMAQ-B1 + IL-1β. (a) The ability of DMAQ-B1 to attenuate IL-1β-mediated AKT inactivation, FOXO1 nuclear accumulation, and CLDN5 downregulation was determined by Western blotting. Representative Western blots from three independent experiments are shown (b–d) The ability of DMAQ-B1 to reverse IL-1β-mediated BMVEC barrier dysfunction was tested with ECIS-TEER measurements or transwell permeability assays. DMAQ-B1 was added 1 h after IL-1β challenge. (b) Representative normalized ECIS tracings, (c) normalized peak TEER changes, and (d) sodium fluorescein permeability coefficients. All values were obtained from at least 3 independent experiments. Data for (c) and (d) are represented as scatter dot plots overlaid with mean value (black line) and groups with the same symbol within each plot are not significant from each other (p ≥ 0.05). (e–h) EAE or mock-EAE (Ctrl) were induced and analyzed 8 d.p.i. for BBB dysfunction and CLDN5 expression changes. 24 h prior to harvest (7 d.p.i.), mice from each group were split into two additional groups that received DMAQ-B1 [5 mg/kg] or vehicle (0.5% methylcellulose) via oral gavage. In total, 8–10 mice per group were used and harvested brains were split by hemisphere to allow for simultaneous determination of BBB dysfunction and CLDN5 expression. (e–g) Plasma protein and solute leakage into the mouse brains were determined by EB (n = 5–6) and sodium fluorescein (n = 3–4) extravasation assays. (e) Representative images from EB extravasation assay showing plasma protein leakage into the right hemisphere. Images were captured at 700 nm (pseudo-colored blue) and brain autofluorescence at 800 nm (pseudo-colored grayscale). Quantitative results from EB (f) and sodium fluorescein (g) permeability assays. (h) CLDN5 expression from left hemisphere brain homogenates was determined by Western blotting. All in vivo values were normalized to the vehicle-treated group subjected to mock EAE (Ctrl) and graphs are represented as dot plots or bar graphs overlaid with mean ± S.D. lines. Groups with the same symbol within each graph are not significant from each other (p ≥ 0.05).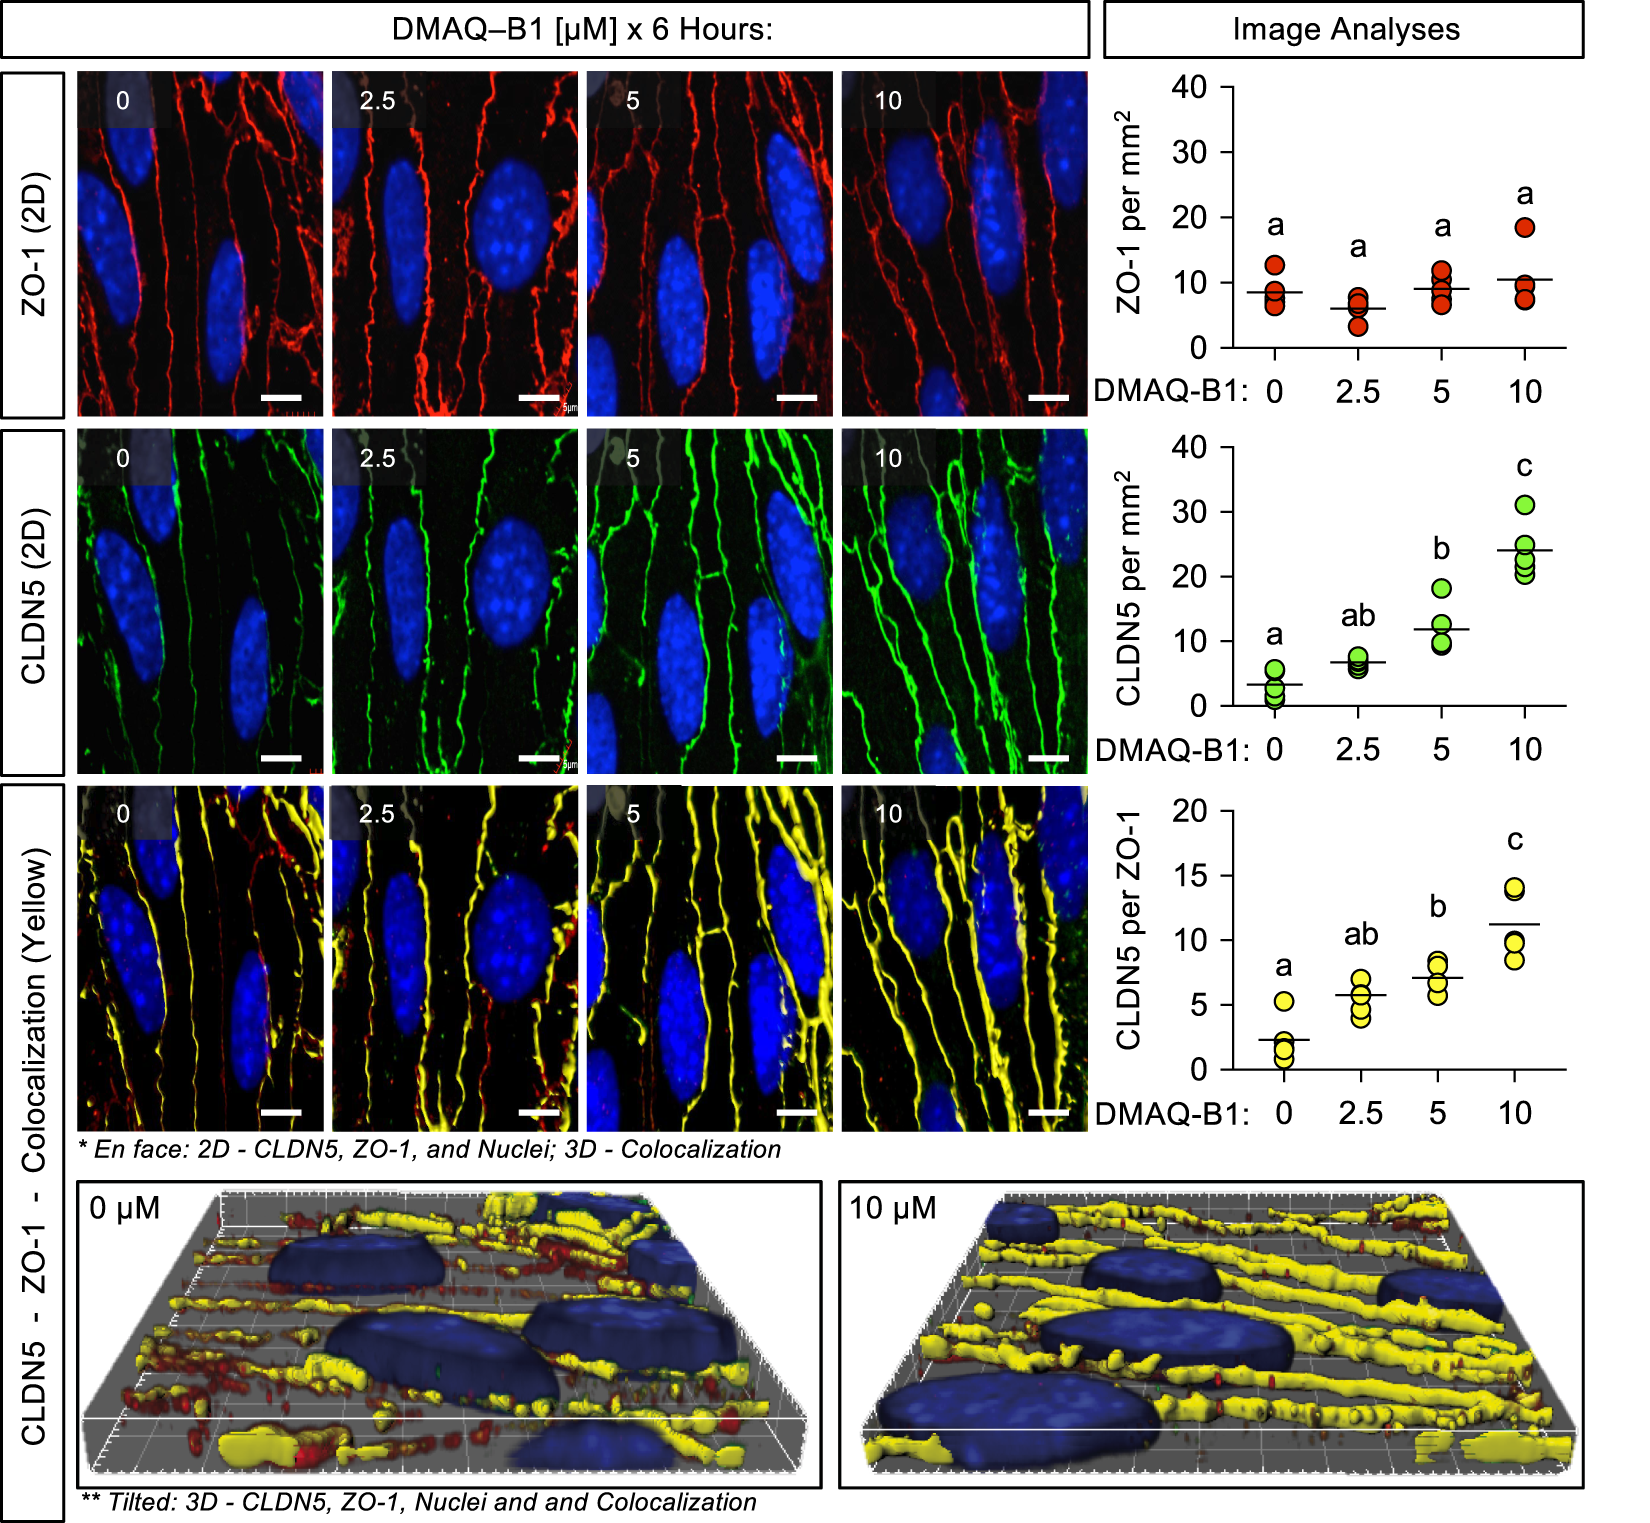
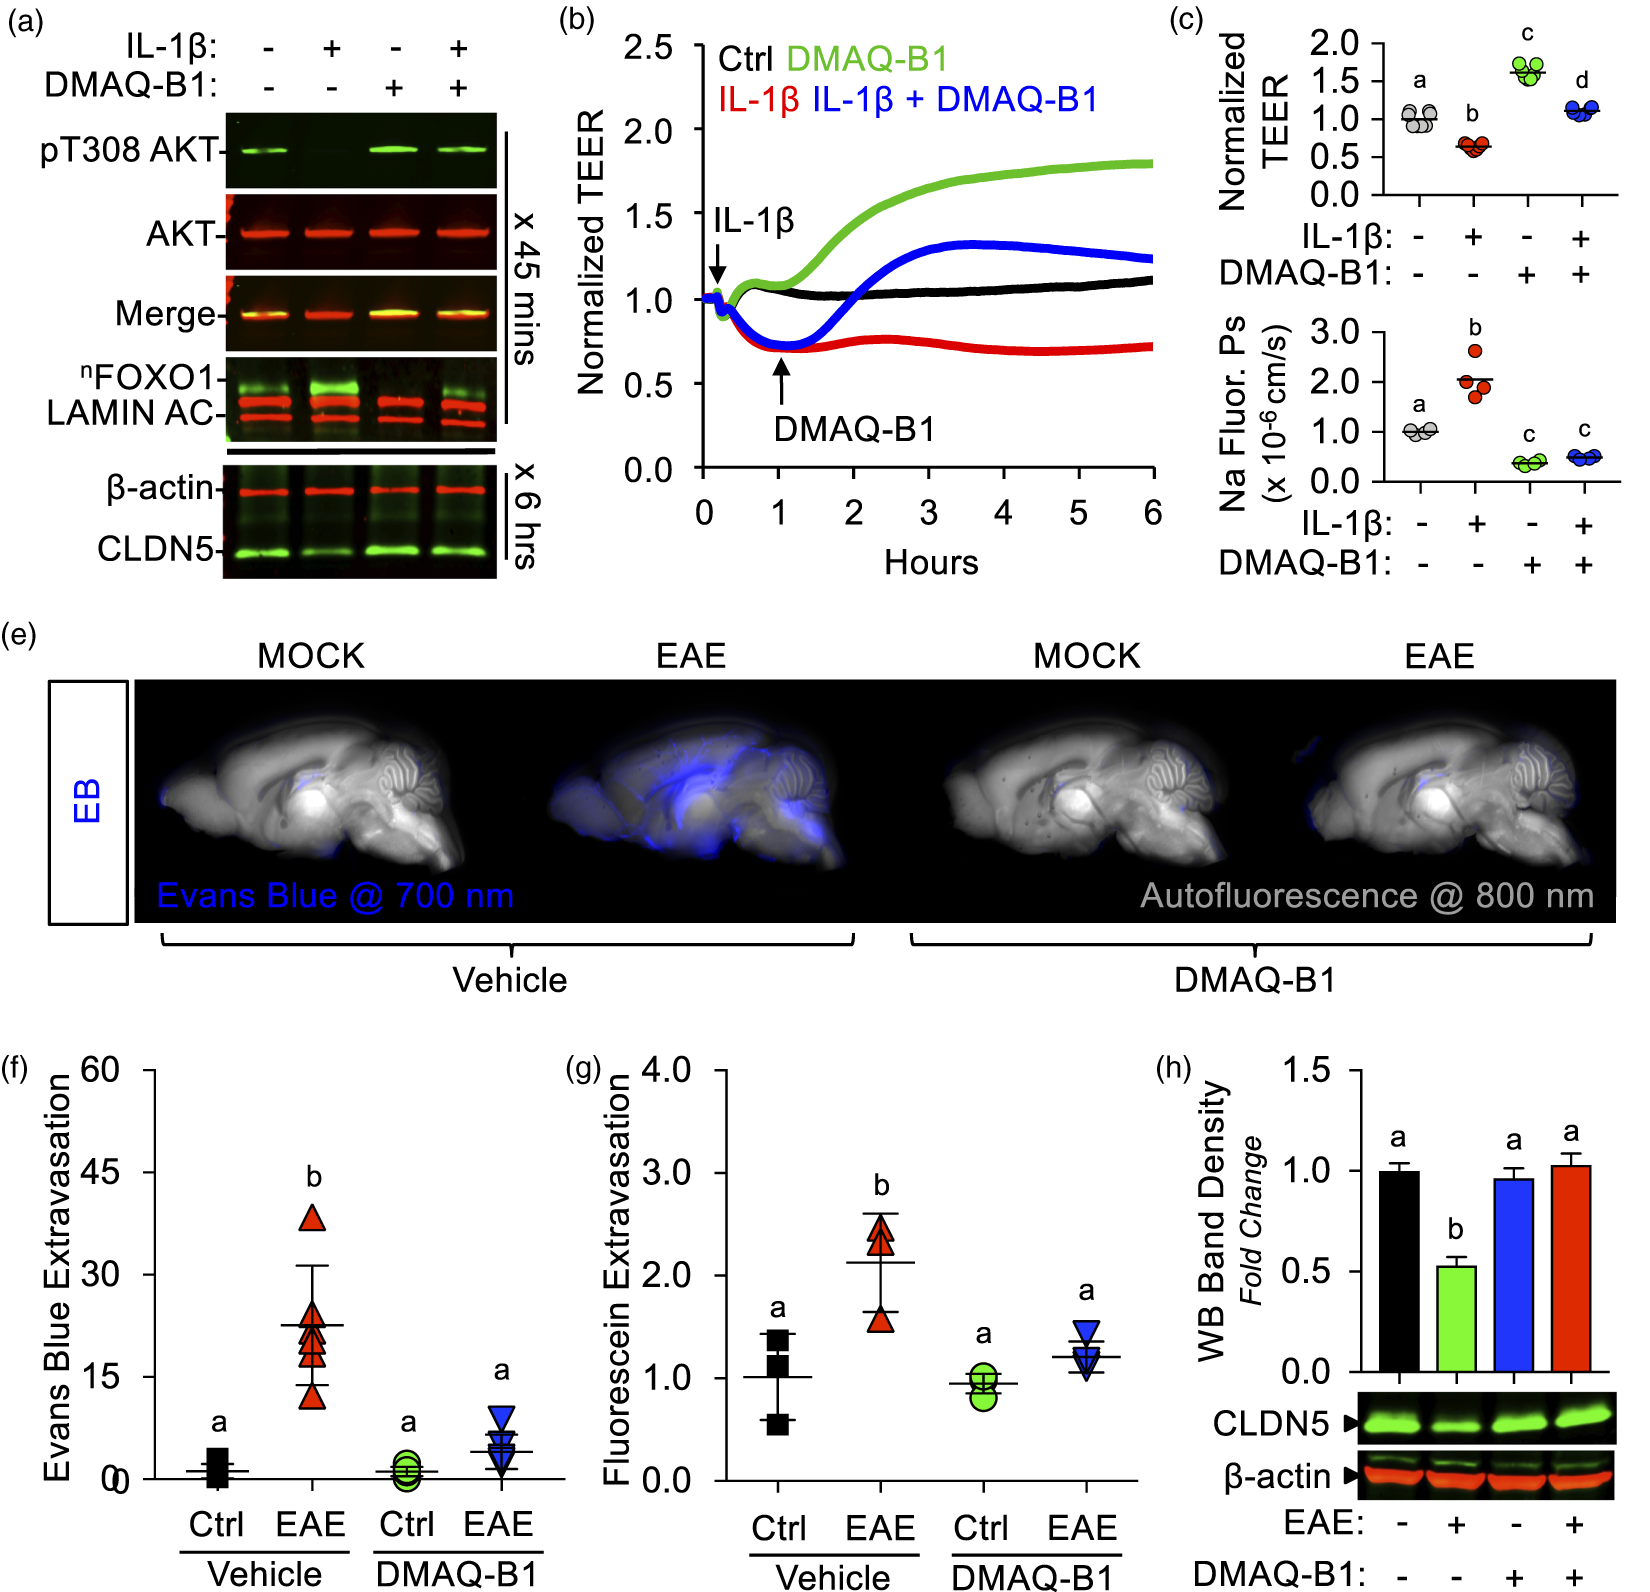
DMAQ-B1 reverses inflammation-induced BMVEC barrier disruption in vitro and in vivo
Given that inflammation is well known to mediate insulin resistance,49,71 we sought to determine if DMAQ-B1 could attenuate inflammation-mediated BMVEC barrier dysfunction in vitro and in vivo. We first found that DMAQ-B1 can attenuate IL-1β-mediated AKT activation, FOXO1 inactivation, and CLDN5 downregulation (Figure 7(a)). Next, we treated IL-1β-stimulated [100 ng/mL] BMVECs on ECIS after 1 h with DMAQ-B1 and followed TEER tracings for an additional 5 h. DMAQ-B1 [5 μM] not only increased baseline TEER, but also increased TEER of IL-1β-treated BMVECs (Figure 7(b) and (c)). Additionally, IL-1β-mediated sodium fluorescein hyperpermeability was rescued with co-treatment of DMAQ-B1 (Figure 7(d)). Since we have observed significant BBB dysfunction eight days post-induction of EAE mice, 24 h prior (7 d.p.i.) we gave one single dose of DMAQ-B1 [5 mg/kg; via oral gavage] to both control and EAE mice. Both EB and sodium fluorescein extravasation assays revealed significantly less leakage from brain microvessels in EAE mice treated with DMAQ-B1 compared to those untreated (Fig. 7F-G). Concomitantly, EAE-induced loss of CLDN5 was abrogated with DMAQ-B1 (Figure 7(h)).
Discussion
The key finding presented in this study is that isoform-specific activation of AKT2 by the selective IR agonist, DMAQ-B1, rescued loss of CLDN5-dependent BBB integrity. We applied a step-wise approach to demonstrate the involvement of the AKT2/FOXO1-signaling pathway in maintaining high CLDN5 expression, and determined the potential of DMAQ-B1 to reverse diminished CLDN5 levels. First, we detected significant nuclear accumulation of FOXO1 and loss of CLDN5 in microvessels isolated from mice with EAE-induced BBB dysfunction. Second, by determining the correlation of AKT2 and CLDN5 expression and conducting AKT2-specific knockdown experiments, we identified the importance of AKT2 in maintaining high levels of CLDN5. Third, by evaluating the canonical IR/AKT2/FOXO1 signaling pathway, we determined the novel capacity of DMAQ-B1 to reduce FOXO1 nuclear accumulation, increase CLDN5 density at tight junctions, and strengthen barrier function of primary BMVEC monolayers. Fourth, siRNA-mediated silencing of BMVEC Cldn5 confirmed that CLDN5 is necessary for enhanced barrier function induced by DMAQ-B1. Lastly, DMAQ-B1 reversed BMVEC barrier dysfunction in vitro and in vivo following inflammatory challenge.
Contemporaneous with inflammation-induced microvascular leakage, a quantitative loss of CLDN5 from the BBB has been reported in multiple neurological diseases, which at least in part suggests that CLDN5 is transcriptionally downregulated. Hence, preventing or reversing this downregulation is key to therapeutic preservation of BBB integrity. FOXO1-mediated transcriptional repression of Cldn5 was first identified in cell culture studies for its role in AJ-dependent upregulation of CLDN5 following endothelial confluency, 13 and Morini et al. 25 recently extended their findings to include that FOXO1 also recruits a polycomb repressor complex to the same Cldn5 silencer occupied by FOXO1 in subconfluent endothelial cells. We recapitulate this data as a proof-of-principle for our culture model, but also demonstrate that Cldn5 mRNA levels continue to increase beyond endothelial confluency. Elevated levels of FOXO1, along with the loss of CLDN5, were also observed in an acrolein-induced lung injury model. 24 Our results here extend our previous in vitro findings to an in vivo model of neuroinflammatory-mediated CNS injury. In this model, BBB dysfunction precedes EAE-induced paralysis,and CLDN5 downregulation concomitant with BBB dysfunction has been reported multiple times.20,35,45 However, the precise onset and regulatory mechanisms governing CLDN5 downregulation during EAE was not well-resolved, and to the best of our knowledge, this is the first report of EAE-induced FOXO1 activation in brain microvessels associated with a loss of CLDN5-dependent BBB integrity.
Most literature devoted to FOXO1 in endothelial cells has been focused on angiogenesis and postnatal neovascularization.31,50–53 However, the role of FOXO1 in highly mature endothelial cells, such as those of the BBB, remains unclear. Our studies, therefore, were intentionally conducted on adult mice in vivo (> 90 d.p.n.), and mature BMVEC monolayers. In addition to our previous FOXO1 knockdown studies, 15 we found enhanced barrier properties of BMVEC monolayers with no signs of overgrowth or apparent problems. Similarly, Park et al. 54 demonstrated inactive FOXO1 in the blood–retinal barrier (BRB) of adult mice, which was reactivated in diabetic retinopathy leading to loss of BRB integrity. 54 Our finding of inflammation-mediated FOXO1 activation and diminished endothelial cell–cell integrity is in line with this finding, as well as another in vivo study demonstrating the atheroprotective effects of endothelial-specific FOXO1 depletion from aortic endothelial cells. 55 Interestingly, this study also reported that upregulation of ICAM-1 and increased monocyte-endothelial adhesion is dependent on FOXO1 activation. Taken as a whole, it would appear that FOXO1 lies dormant in mature endothelium, especially at the BBB, yet serves as an inflammatory response element that may couple leukocyte transmigration with disassembly of endothelial cell–cell junctional complexes.
FOXO1 inactivation by AKT is a canonical target of insulin signaling in endothelial cells, which is well-known to be impaired during inflammation. 56 Nevertheless, tightly controlled insulin therapy to maintain normoglycemia has been shown to counteract inflammation-mediated endothelial dysfunction,57–59 suggesting that at least some level of IR activation is intact. A role for insulin-signaling in BBB function remains controversial, as some have shown insulin-mediated barrier enhancement and others have shown no effect.29–31,60–63 Our results demonstrate that exposing BMVECs to physiologically relevant concentrations of insulin and IGF-1 produced equal levels of IRS-1 phosphorylation compared with DMAQ-B1, but unlike DMAQ-B1-mediated IR agonism they did not reduce nuclear accumulation of FOXO1, alter CLDN5 expression, or enhance BMVEC barrier function. How then do we explain the barrier-enhancing effects of DMAQ-B1, given that all three agonists produced equal levels of not just IRS-1, but AKT phosphorylation too? AKT is well-known to simultaneously both proangiogenic and antiangiogenic, which may be related to isoform-specificity. Thus, one plausible explanation is that insulin and IGF-1 trigger IRS-1 and AKT1 phosphorylation through the IGF1R or hybrid IR/IGF1R receptors, 63 whereas DMAQ-B1 is selective for IR agonism that is known to result in phosphorylation of AKT2. This is additionally supported by our finding that insulin and IGF-1 uniquely trigger the canonical IGF1R target, ERK1/2, which is also known for its proangiogenic and hyperpermeability-inducing roles in microvessels. Indeed, we did find a nominal decrease in barrier function following IGF-1, but we did not observe the same for insulin. This discrepancy may be due to insulin promiscuity counterbalancing both the positive and negative effects on barrier regulation.
While certain aspects of endothelial AKT remain poorly elucidated, there is consensus that specificity of these isozymes is highly context-dependent owing to factors such as tissue distribution, cellular localization, temporal regulation, and different signaling pathways.64–67 Based upon gene ablation studies, only AKT1 and AKT2 appear to have physiological relevance in endothelial cells, although their roles appear to be markedly different with minor functional compensations. For example, deletion of endothelial Akt1 in Akt2−/− mice displays either impaired proliferation and aberrant angiogenesis if excised during development, 65 or loss of mural cell coverage and organ failure if deleted in adult mice. 68 Conversely, AKT2 function is known to promote cell cycle exit through p21 binding 69 and is the primary isoform responsible for endothelial IR-signaling,28,65 which is consistent with our work supporting an isoform-specific role of AKT2-activity to maintain barrier function of highly quiescent BBB endothelial cells.
It is well-known that the BBB requires additional establishment and maintenance of TJ proteins to maintain the highly restrictive paracellular clefts of BBB endothelial cells. Our observation of passaging-induced loss of AKT2 and CLDN5 may partially explain why elevated TJ protein expression and BMVEC integrity are diminished in cultured ECs.70,71 It is also well-described that TJ expression continues to increase following monolayer formation of brain endothelial cells, and a major step in endothelial barrier formation requires AKT1-dependent inactivation of FOXO1 and increased Cldn5 transcriptional upregulation.13,25 Consistently, peripheral vessels of Akt1-null mice have baseline vascular leakage. 66 Until now, a role for AKT2 in endothelial barrier regulation had not been established. Recently, however, Zhang et al. showed Akt2 upregulation was a target of β-catenin/Tcf transcriptional regulation, 72 which is known to be necessary for development and maintenance of the BBB.38,73–76 Additionally, Frisa et al. have demonstrated in aortic endothelial cells an AKT1-to-AKT2 switch model which was Notch-induced and dependent upon AKT2 upregulation, inhibition of GSK-3β phosphorylation, and FOXO1 inactivation. Our work agrees with all these observations, suggesting that AKT1 drives initial barrier development and that AKT2 expression regulates barrier maintenance. Interestingly, it was recently shown in brain endothelial cells that inhibition of GSK-3β increases the half-life of Cldn5 protein. 77 Thus, coupled with our findings, this places AKT2 upstream of both maximal transcriptional regulation and protein stabilization of CLDN5.
Significant progress has been made in the past decade to understand the contributions of isoform-specific AKT activity during various diseases. 78 In accordance with AKT-mediated regulation of FOXO1, reports defining a role of AKT isoforms in vascular disease are largely limited to aberrant vascular remodeling and macrovascular disease. 79 Consistent with the angiogenic role of endothelial AKT1, several reports have described pro-inflammatory roles for AKT1 in endothelial cells. Though global AKT1 deletion was shown to increase baseline vascular permeability, AKT1-deficient mice are resistant to acute histamine- and λ-carrageenan-induced microvascular leakage, as well as infiltration of neutrophils and monocytes.27,65 Much less is known about the contribution of AKT activity to BBB function and neuroinflammatory disease, especially as it pertains to isoform-specificity. Several reports show that loss of BBB integrity involves impairment of AKT signaling80–82; however, to the best of our ability, we were unable to find any reports describing a role for AKT2 in BBB endothelial cells. Here, we have identified a novel isoform-specific role for AKT2 in the maintenance of CLDN5-dependent endothelial barrier integrity, which is impaired following inflammatory insult. In similar samples used to obtain our results of brain endothelial cell FOXO1 activation by IL-1β in vitro, 15 and EAE in vivo, we identified a significant decrease in expression of AKT2 concomitant with CLDN5, but no changes in AKT1. Similarly, inflammation-mediated changes in AKT2 expression have been reported in other insulin-sensitive tissues, such as the liver and muscles. 83 We never observed complete loss of AKT2 in the inflammatory models employed here and our results show that activating the remaining AKT2 with DMAQ-B1 to promote restoration of CLDN5 is still possible.
Given the complexity of insulin signaling during inflammation, and the mixed results pertaining to insulin therapy for endothelial dysfunction, we were unsure if DMAQ-B1 could attenuate or reverse inflammatory-mediated BBB integrity. Coupled with our in vitro findings, however, a model of sepsis-induced insulin resistance and brain injury was attenuated with metformin administration. While this rescue was associated with increased global AKT phosphorylation and diminished edema, the cellular origin of this AKT-dependent neuroprotective effect was not addressed as only whole tissue homogenates were analyzed. 84 Therefore, we chose the primary focus of our culminating in vivo work to be whether DMAQ-B1 could rescue CLDN5 expression and CLDN5-dependent barrier integrity. For the underlying intracellular signaling mechanisms, we tested the IR/AKT2/FOXO1/CLDN5 pathway in endothelial monolayers and while it would have been ideal to quantitatively measure the signaling activity of these proteins in vivo or within intact microvessels, such experiments were hindered by several technical limitations. In particular, the abundance of AKT2 and FOXO1 expressed within brain microvessels is very low and there exist no commercially available pAKT2 isoform-specific antibodies, thereby making it challenging to quantitatively compare the levels of their expression or isoform-specific AKT2 activity under basal and EAE conditions following administration of DMAQ-B1. Nevertheless, the profound rescue in BBB integrity we observed following DMAQ-B1 treatment, suggests that during neuroinflammation the AKT2/FOXO1/CLDN5 signaling axis remains responsive to pharmacologic intervention and, therefore, might be a viable therapeutic strategy for restoration of BBB function.
In summary, our current findings define a regulatory role for IR/AKT2/FOXO1-mediated regulation of CLDN5 which can be selectively triggered by the IR agonist, DMAQ-B1, to restore submaximal CLDN5 expression and barrier integrity back to the BBB during neuroinflammation.
Supplemental Material
Supplemental material for AKT2 maintains brain endothelial claudin-5 expression and selective activation of IR/AKT2/FOXO1-signaling reverses barrier dysfunction
Supplemental Material for AKT2 maintains brain endothelial claudin-5 expression and selective activation of IR/AKT2/FOXO1-signaling reverses barrier dysfunction by Richard S Beard Jr., Brian A Hoettels, Jamie E Meegan, Travis S Wertz, Byeong J Cha, Xiaoyuan Yang, Julia T Oxford, Mack H Wu and Sarah Y Yuan in Journal of Cerebral Blood Flow & Metabolism
Footnotes
Funding
The author(s) disclosed receipt of the following financial support for the research, authorship, and/or publication of this article: This work was supported by funding from the National Institutes of Health grants GM097270 (S.Y.Y.), HL070752 (S.Y.Y.), HL126646 (S.Y.Y.), HL120954 (M.H.W.), GM109095 (J.T.O.), and a Veterans Administration Merit Review BX000799 (M.H.W.). R.S.B.J. was supported by career development funding from the National Institutes of Health (GM109095 and GM103408) and the American Heart Association (16POST27060005 and 17SDG33660381).
Acknowledgments
We thank the Advanced Microscopy and Cell Imaging core at University of South Florida and the Biomolecular Research Center at Boise State University. We acknowledge Jonathan Overstreet, Kristina Chapman, Desiree Self and Ofeira Faapouli for their technical support with animal experiments and endothelial cell isolations and Laura Bond for statistical support.
Declaration of conflicting interests
The author(s) declared no potential conflicts of interest with respect to the research, authorship, and/or publication of this article.
Authors’ contributions
RSBJ performed, analyzed and interpreted most of the experiments. BAH participated in cell culture, gene silencing, and Western blotting experiments. JEM participated in cell culture, mRNA isolation and RT-PCR. TSW participated in animal maintenance and microvessel isolations. BJC assisted with confocal imaging and analyses. JTO contributed to the design and analyses of sandwich FLISAs. XY and MHW contributed to the design and data analyses of in vivo experiments. SYY initiated, directed and sponsored the work through all levels of development. All the authors discussed the results and approved the manuscript.
References
Supplementary Material
Please find the following supplemental material available below.
For Open Access articles published under a Creative Commons License, all supplemental material carries the same license as the article it is associated with.
For non-Open Access articles published, all supplemental material carries a non-exclusive license, and permission requests for re-use of supplemental material or any part of supplemental material shall be sent directly to the copyright owner as specified in the copyright notice associated with the article.