
Abstract
Pharmacokinetic modelling on dynamic positron emission tomography (PET) data is a quantitative technique. However, the long acquisition time is prohibitive for routine clinical use. Instead, the semi-quantitative standardised uptake value ratio (SUVR) from a shorter static acquisition is used, despite its sensitivity to blood flow confounding longitudinal analysis. A method has been proposed to reduce the dynamic acquisition time for quantification by incorporating cerebral blood flow (CBF) information from arterial spin labelling (ASL) magnetic resonance imaging (MRI) into the pharmacokinetic modelling. In this work, we optimise and validate this framework for a study of ageing and preclinical Alzheimer's disease. This methodology adapts the simplified reference tissue model (SRTM) for a reduced acquisition time (RT-SRTM) and is applied to [18F]-florbetapir PET data for amyloid-β quantification. Evaluation shows that the optimised RT-SRTM can achieve amyloid burden estimation from a 30-min PET/MR acquisition which is comparable with the gold standard SRTM applied to 60 min of PET data. Conversely, SUVR showed a significantly higher error and bias, and a statistically significant correlation with tracer delivery due to the influence of blood flow. The optimised RT-SRTM produced amyloid burden estimates which were uncorrelated with tracer delivery indicating its suitability for longitudinal studies.
Keywords
Introduction
Positron emission tomography (PET) facilitates the quantification of a range of important biomarkers through the injection and detection of targeted radiotracers. To interpret the measured signal and derive the biological parameters of interest, data are collected dynamically from injection, covering radiotracer delivery to tissue, interaction with the target, and tracer washout. This provides a map of the spatio-temporal concentration of the tracer in vivo. A pharmacokinetic model which describes these processes may then be fitted to these dynamic data to estimate the biological parameters such as radiotracer target density.
Depending on the radiotracer administered, the dynamic data acquisition time required to fit the model may be 60 min or more. This is prohibitive in a clinical context due to patient discomfort, restrictions on scanner time availability, and the increased chance of subject motion which corrupts the data. Consequently, a simplified technique is commonly employed.
The standardised uptake value ratio (SUVR) is a measure of relative tracer uptake which can be calculated from a static scan lasting approximately 10 min. SUVR is calculated by dividing the tracer concentration within the tissue of interest by the concentration in a reference region. The reference region consists of tissue considered to be free of the radiotracer target and represents the non-displaceable (
However, as SUVR is calculated from a single static scan, the tracer concentration present during the acquisition will depend on the delivery of the tracer, as well as target density. Tracer delivery is intrinsically linked to blood flow, and since blood flow can change during the progression of disease, 1 and indeed fluctuate over the course of a day, 2 SUVR estimates may be confounded.
The influence of cerebral blood flow (CBF) changes on SUVR estimates has been highlighted in longitudinal Alzheimer's disease studies in which the target of interest was the protein amyloid-β. Amyloid-β is an early indicator of disease onset and a therapeutic target, hence accurately quantifying amyloid-β density is of paramount importance. Here, variation in blood flow has been shown to cause spurious changes in SUVR which are unrelated to target density.3,4 Conversely, target density estimates derived from pharmacokinetic modelling of dynamic data starting from radiotracer injection can account for blood flow, as tracer delivery is parameterised within the model.
Dynamic PET data can be divided into two phases: the early phase, in which the signal is dominated by tracer delivery to tissue, 5 and the late phase, which contains information related to tracer binding and washout, and is where SUVR is estimated. The intrinsic correlation between tracer delivery and CBF has been demonstrated for an amyloid-β tracer. 6 Therefore, if CBF can be measured independently from the PET acquisition, then the data acquisition time may be reduced such that only the late phase data are acquired to estimate the remaining parameters.
Arterial spin labelling (ASL) magnetic resonance imaging (MRI) is a non-invasive imaging technique which applies a magnetic ‘tag’ to arterial blood, such that it can be used as an endogenous contrast agent. ASL can be used to estimate CBF, as validated by comparison with the gold standard radiolabelled water PET. 7 While the accuracy of the technique is dependent on the implementation, high quantitative accuracy has been achieved when ASL data are normalised to a reference region. 8
The introduction of combined PET/MRI scanners, which facilitate simultaneous acquisition, means that ASL and late phase PET data can be acquired concurrently. By incorporating CBF information from ASL into the PET pharmacokinetic modelling to provide early phase delivery information, the total acquisition time can be significantly reduced, increasing patient comfort and throughput, without sacrificing quantitative accuracy.
In this paper, we build on the framework which combines ASL-derived CBF data with PET kinetic modelling to reduce the acquisition time from 60 to 30 min. 9 This is referred to here as the reduced acquisition time simplified reference tissue model (RT-SRTM). In the present work, the relationship between PET radiotracer delivery and ASL measured CBF is investigated with a larger group of subjects. An improved methodology for the estimation of the early phase data is proposed and compared to that used previously. 9 Finally, the timing of the late phase acquisition is optimised before applying the improved methodology to a different set of subjects. This was applied to [18F]-florbetapir amyloid PET data from a study of ageing and preclinical Alzheimer's disease.
Material and methods
PET kinetic modelling
The simplified reference tissue model (SRTM) 10 was used as the gold standard for PET pharmacokinetic modelling, as it is commonly applied in amyloid studies5,6,11,12 and has been validated against pharmacokinetic modelling with arterial sampling for [18F]-florbetapir. 13 The SRTM employs a reference region, which is considered to be devoid of the imaging target, to replace the plasma input function. Cerebellar grey matter was used as it is assumed to be devoid of amyloid-β. 14
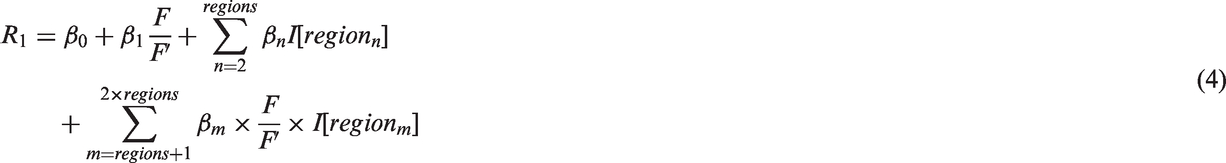
The operational equation between the tracer concentration in the target tissue

The SRTM contains three parameters: R1, which is the rate constant of tracer delivery to the target tissue relative to the reference tissue; k2, which is the rate constant from target tissue to blood; and the ND binding potential
An in-house implementation of the SRTM using the basis function method
15
was fitted to the PET data to derive regional gold standard parameter estimates, denoted by an asterisk, of
PET kinetic modelling with reduced acquisition time
Early PET signal is dominated by the delivery of the tracer to the tissue and hence is important for the estimation of R1. The later part of the signal contains information about the binding of the tracer to the target and its subsequent washout, which is essential for the estimation of k2 and
Consequently, if the blood flow information can be estimated independently from the PET data, then the acquisition time can be reduced, by recording only the late signal to allow the estimation of k2 and
Derivation of PET-R1 from ASL–CBF
R1 is defined as

The Renkin–Crone model includes a term for the net extraction of the tracer from the capillaries, E, which is dependent on the vessel permeability surface area product,

ASL can be used to measure the CBF,
In this study, linear regression between R1 and CBF was performed in a group of subjects to determine whether this approximation is valid. The slope and intercept of the linear regression,
Due to systematic errors in ASL-CBF estimates in certain regions of the brain, particularly for single inversion time ASL data,
7
multi-linear analysis was also performed, to determine whether
Here
Extrapolation of PET reference region,
To compute the convolution term in equation (1), CR must be known from injection, at
In this work, two different approaches are evaluated to estimate the whole reference input vector
The first method, referred to as the scaled mean CR method and proposed by Scott et al.,
9
scales the population average reference region curve,

The second method employs statistical shape modelling to build a model of the variation in CR within the population of subjects.
18
This requires principal component analysis (PCA) of a set of subjects to determine the M components,
The

Fitting the SRTM with CBF-derived R1 and extrapolated CR
To apply the modifications to the SRTM with reduced acquisition time, the operational equation in (1) is re-written as in equation (7). This groups the measured parameter


To solve equation (7) for a reduced acquisition time where
Data
Imaging data were collected from 60 cognitively normal subjects participating in Insight 46, a neuroimaging sub-study of the Medical Research Council National Survey of Health and Development, 19 and 4 subjects from a study of young onset Alzheimer's Disease (YOAD) with an intermediate or high certainty diagnosis. 20 These studies were conducted in line with the principles of the Declaration of Helsinki. For Insight 46, ethical approval was obtained from the National Research Ethics Service (ref 14/LO/1173), and for YOAD, approval was obtained from the London Queen Square Ethics Committee (ref 15/LO/1412). Written informed consent was obtained from all participants.
All subjects underwent 60 min of simultaneous amyloid PET and multi-modal MR imaging on a Siemens Biograph mMR PET/MR scanner. Of the 64 subjects used for analysis, mean age 69.6 years (range 61.7–70.5 years), 45 had both PET and ASL data, and for 19 the ASL data were missing, either due to repetition of other scans (4) or imaging artefacts (15).
The subjects were divided into 2 sets; an optimisation set containing 39 subjects, and a testing set containing the remaining 25 subjects, see Figure 1. The clinically diagnosed YOAD subjects were evenly split between the two sets, as were amyloid positive ( Flow chart describing data division between optimisation and testing sets, with the number of subjects defined as amyloid positive (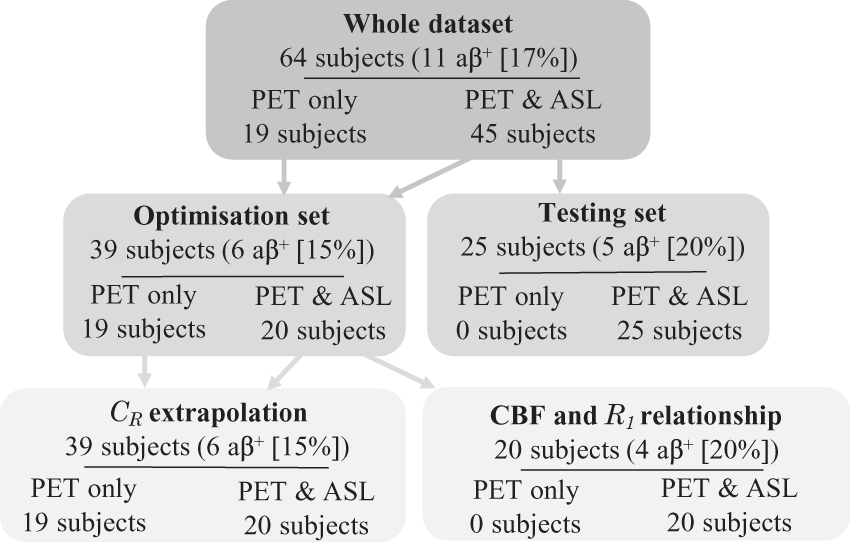
Within the optimisation set, the 20 subjects with PET and ASL data were used to derive the relationship between PET-R1 and ASL-CBF. The whole optimisation set was used to optimise the extrapolation of CR and the acquisition timing window using leave-one-out cross validation. Finally, the relationship between PET-R1 and ASL-CBF and the optimised CR method from the optimisation set was used to apply the RT-SRTM to the 25 testing set subjects, see Supplementary Materials.
CBF estimation from ASL MRI
CBF was estimated from a pseudo-continuous ASL (pCASL) acquisition with the following parameters: 3D GRASE readout
21
with 36 partitions and a reconstructed voxel size of

Dynamic PET acquisition and reconstruction
List mode PET data were acquired for 60 min following intravenous injection of [18F]-florbetapir, which targets amyloid-β. For PET image reconstruction, simultaneously acquired structural T1- and T2-weighted MR images were used to synthesise CT data and calculate the attenuation map (μ-map), 25 as validated in Ladefoged et al. 26 The μ-map was propagated into PET space by registering the T1-weighted images to a full 60-min non-attenuation-corrected reconstructed PET image.
Dynamic PET data were binned into 31 time frames (15 s ×4, 30 s × 8, 60 s ×9, 180 s ×2, 300 s ×8), and reconstructed into 2×2×2 mm voxels using the open source NiftyPET package. 27 An ordered subset expectation maximisation (OSEM) algorithm was used with 4 iterations, 14 subsets, and a 2 mm Gaussian filter, accounting for dead-time, attenuation, scatter, randoms and normalisation.
Regional analysis
T1-weighted MR images were parcellated into 17 regions: accumbens, amygdala, brainstem, caudate, cerebellum (white and grey separately), hippocampus, cerebral white matter, pallidum, putamen, thalamus and six cortical grey matter regions, with left and right hemispheres combined; 28 16 regions were used for analysis, excluding the reference region.
Analysis was performed in native space such that the T1-weighted MR image was rigidly registered to both ASL (saturation recovery image target) and PET (µ-map transformation) space, and the transformation was propagated to the parcellation. 29
Statistical analysis
To compare different techniques with the gold standard, mean square error (
Results
Relationship between ASL–CBF and PET-R1
Figure 2(a) shows the relationship between PET-R1 and ASL-CBF across the 16 regions for 20 optimisation set subjects. Linear regression shows a statistically significant correlation between the two parameters (ρ = 0.349, Correlation of PET-R1 with ASL-CBF for 20 optimisation set subjects where the regression was calculated and applied to the ASL-CBF data to show the residual error in the fit. (a) PET-R1 against ASL-CBF with single linear regression (black dashed line), (b) Residual normality plot for single linear regression R1 estimation, inset: histogram of residuals, (c) PET-R1 against ASL-CBF with multi-linear regression (black dashed lines), (d) Residual normality plot for multi-linear regression R1 estimation, inset: histogram of residuals.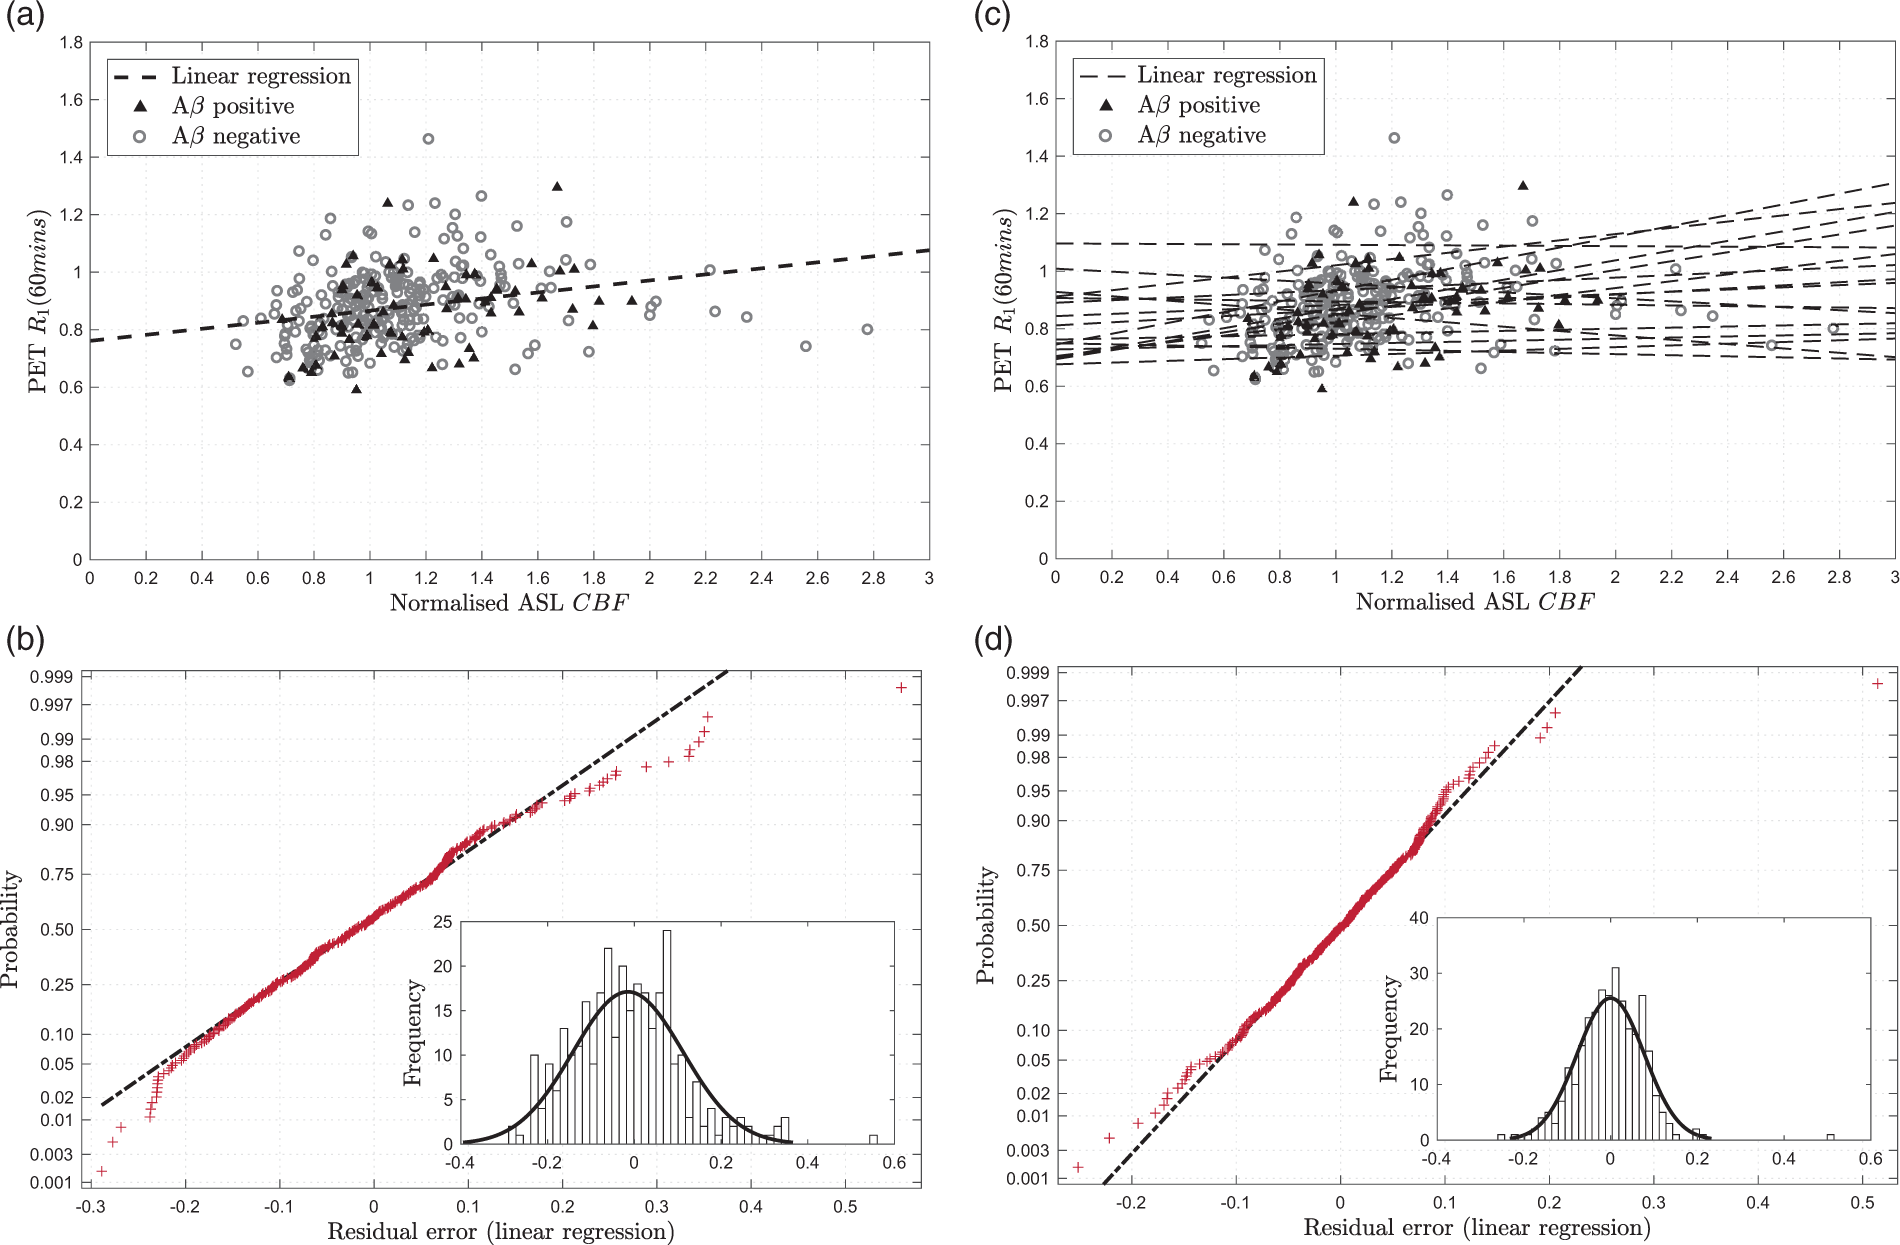
Residual analysis was performed to determine whether a non-linear model could be fitted to the data, as suggested by equation (2). The normality plot for the residual error in Figure 2(a) is shown in Figure 2(b). This demonstrates that the residuals follow an approximately normal distribution, which supports the use of a linear model. However, there is some deviation from normality at the extremes, which is illustrated by the histogram inset in Figure 2(b). This shows that there are some outlying positive residuals which skew the distribution.
To quantify the regional and subject effects, multi-linear analysis was also performed. Multi-linear regression using the region name as a covariate was found to explain much of the variation seen in the single linear regression and gives an R2 value of 0.650 (adjusted R2 = 0.613). Figure 2(d) shows that the residual error using multi-linear regression is lower and more normally distributed than single linear regression.
Figure 2(c) shows the multi-linear regression by region which demonstrates the variability in slope and intercept between regions. These differences can be attributed to two main causes: regional differences in bolus transit times meaning that the ASL label image is acquired before the bolus reaches the tissue, and regional differences in tracer extraction. Acquiring ASL data with multiple post-labelling delay times can be used to reduce some of this variability and would be particularly helpful when transit time changes are caused by pathology which cannot be modelled. However, this multi-linear regression using region as a covariate provides a good model for the data used here.
To quantify the subject specific component of the relationship between normalised ASL-CBF and PET-R1 which cannot be modelled in a new set of subjects, multi-linear regression with the subject as a covariate was performed. This gave an R2 value of 0.436 (adjusted R2 = 0.358) indicating that there is some variation between subjects, but that this accounts for less of the variation than the variation between regions. Finally, multi-linear regression using both region and subject as covariates yielded an R2 value of 0.862 (adjusted R2 = 0.824), showing that most of the variation can be explained by these two parameters.
There is insufficient evidence that the data used here could support a more complex non-linear model, which supports the linear Renkin–Crone model in equation (2) under the assumption that
Extrapolation of PET reference region, CR
Optimisation of PCA CR method
The percentage of the variation explained using increasing number of principal components following PCA on the
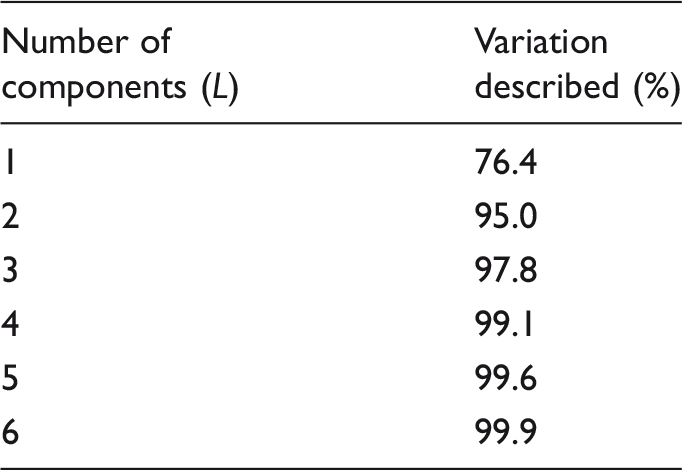
Figure 3 shows the MSE in the fit of MSE in the fit of 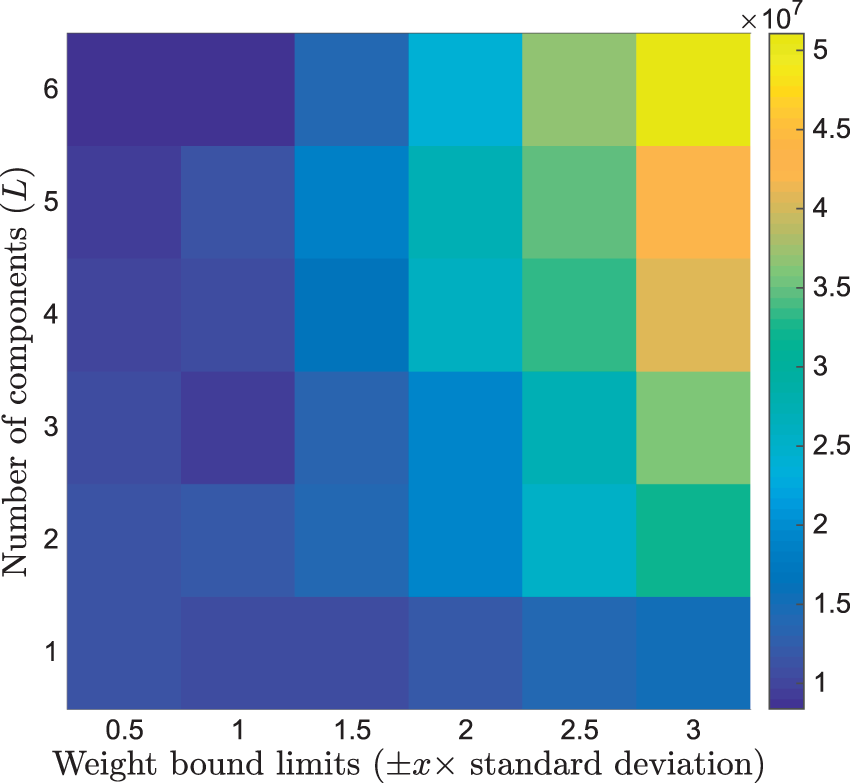
Comparison of PCA CR and scaled mean CR methods
The boxplot in Figure 4(a), which summarises across all subjects, shows that the PCA CR method performs better for Box-plots calculated using leave-one-out cross validation in 39 optimisation set subjects. (a) ME in the PCA CR method and scaled mean CR method compared to measured CR, (b) Error in 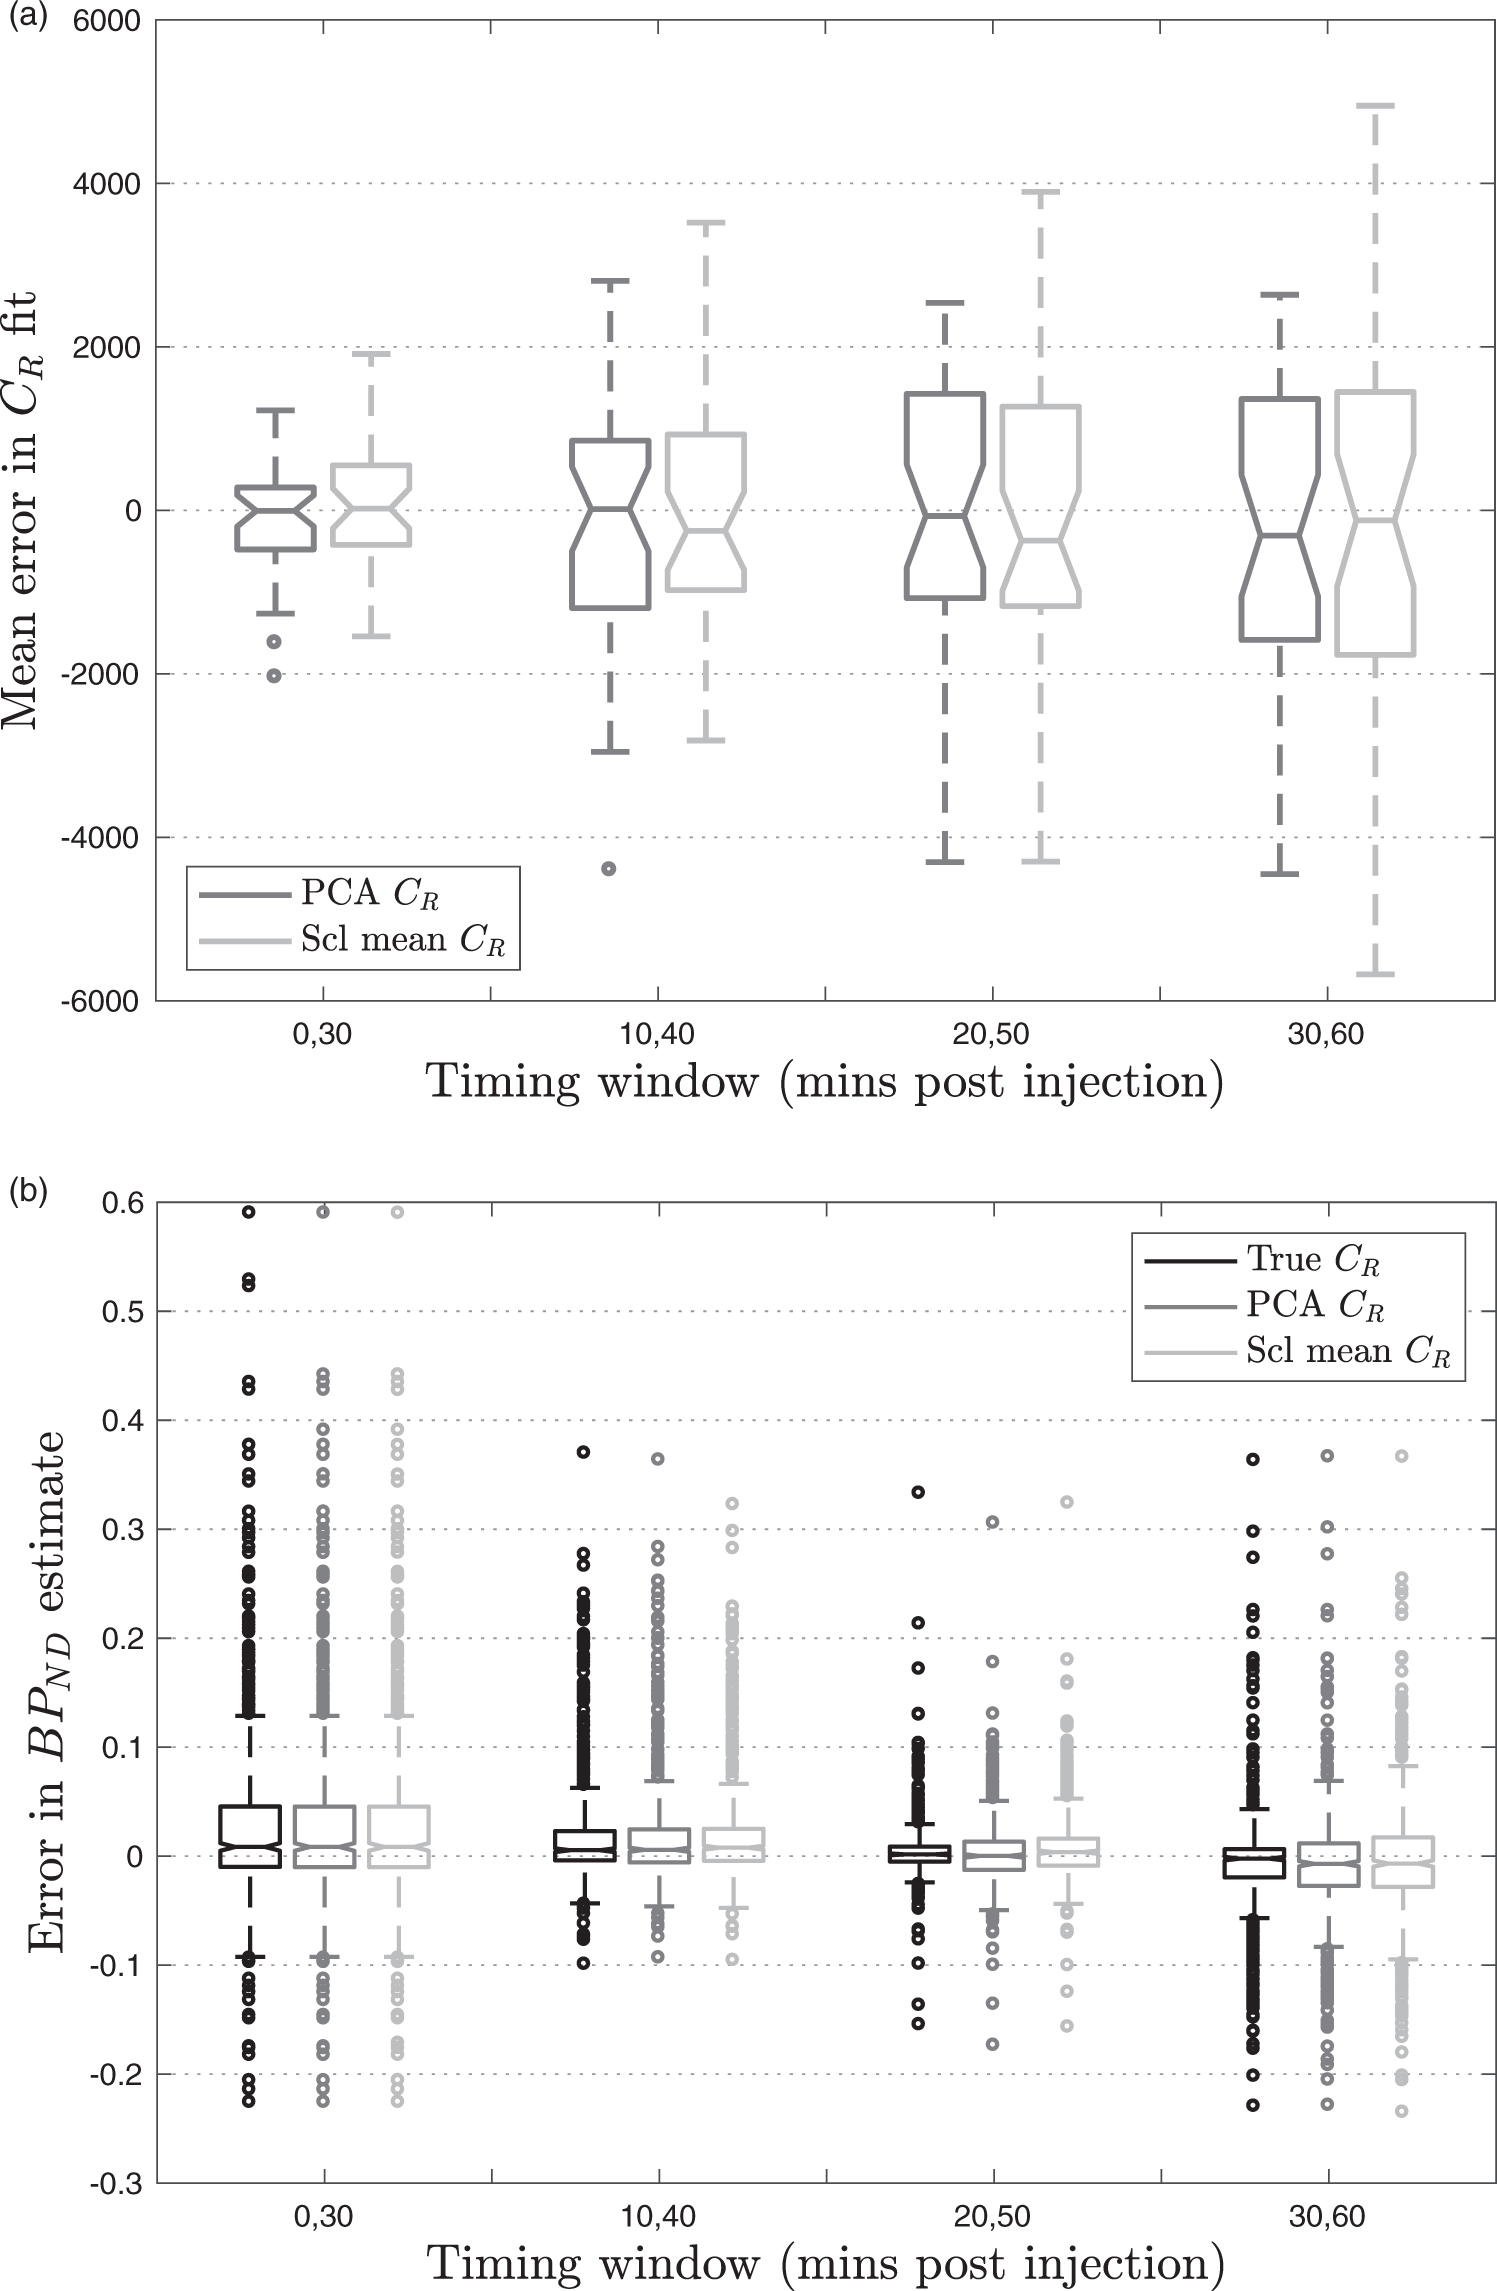
Optimisation of data acquisition window
MSE and ME between gold standard
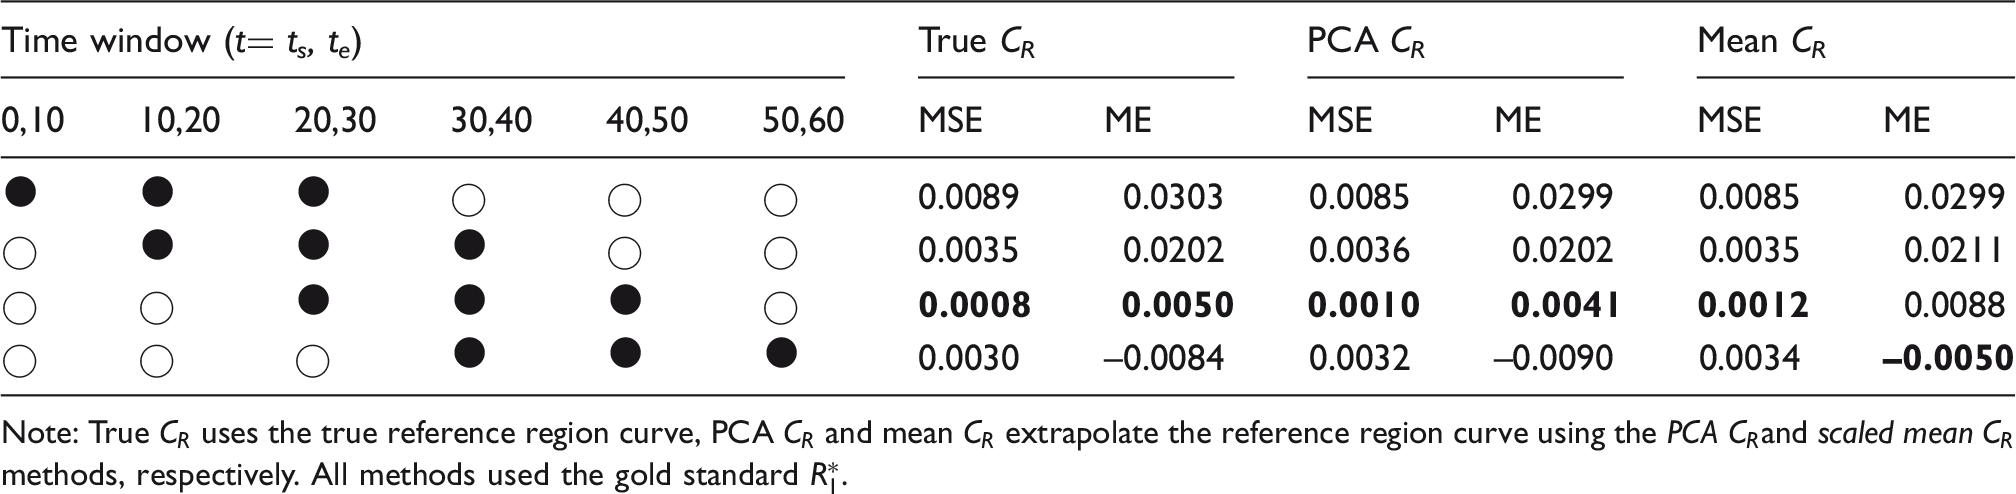
Note: True CR uses the true reference region curve, PCA CR and mean CR extrapolate the reference region curve using the PCA CRand scaled mean CR methods, respectively. All methods used the gold standard
In Table 2, the true CR column uses the full measured
However, the results in Table 2 also show that there is little to be gained by including data acquired more than 50 min post injection as the error increases. This is because the signal has plateaued by this point so, for a fixed 30-minute window, a better fit can be obtained by including some of the earlier data where the tracer concentration changes more rapidly over time. This is further illustrated in Figure 4(b), which shows the smallest distribution of errors in
For the two techniques which extrapolate CR from the available time window, additional variability is introduced into the
The PCA CR method produces a consistently lower MSE which was statistically significantly lower than that obtained using the scaled mean CR method for t = 20,50 (p = 0.002). This is due to the increased flexibility in this method which allows it to better describe the variation in unseen CR shapes. The PCA CR method also produces
Due to the lower MSE and ME, the PCA CR method with the t = 20,50 min timing window was selected for the full implementation of the RT-SRTM in subsequent sections.
Comparison of proposed RT-SRTM with gold standard
Figure 5(a) shows Estimated amyloid burden against the gold standard value calculated using full PET time series for 25 testing set subjects using 4 different methods: (a) RT-SRTM where t = 20,50 min (ASL-derived R1), (b) 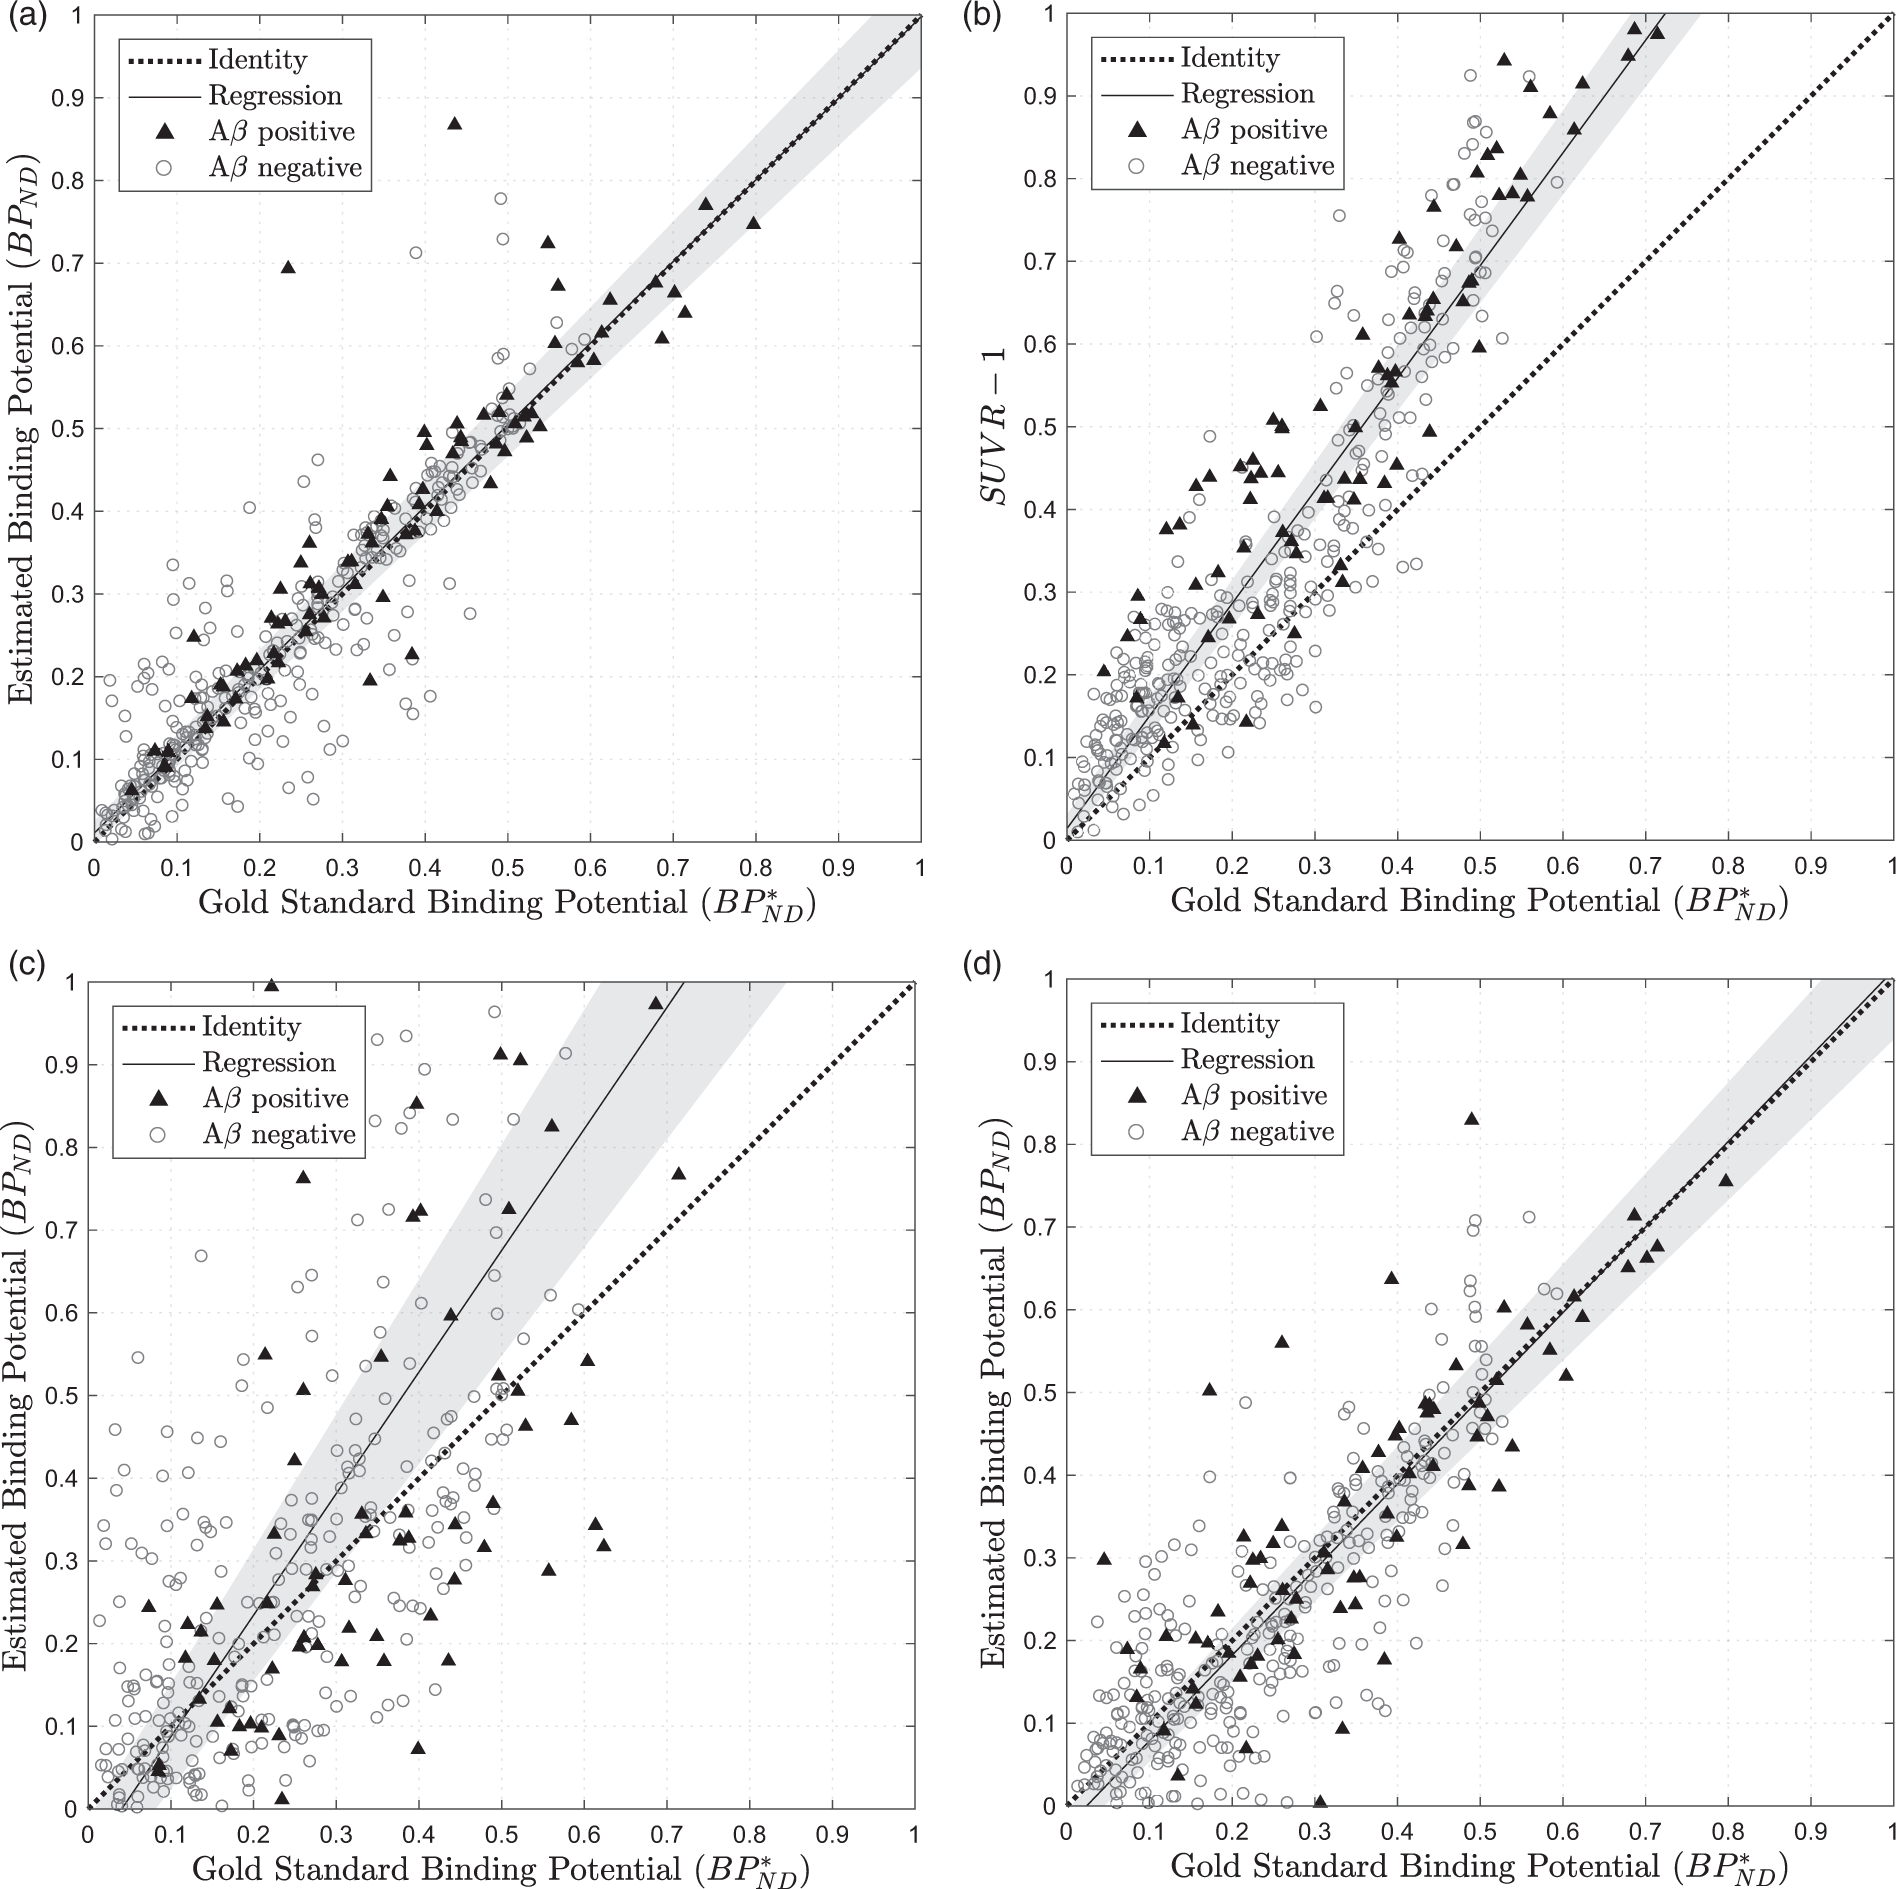
To determine the influence of CBF derived R1 errors on
Comparison of proposed RT-SRTM with
To ensure a fair comparison between RT-SRTM and SUVR,
Figure 5(b) shows the amyloid burden estimates generated for
This overestimation in
To determine the influence of blood flow on the estimation of target density, the correlation between estimated target density and tracer delivery was calculated, as in Cselényi and Farde
4
Spearman's correlation (ρ) between
Comparison of the proposed RT-SRTM with short acquisition time PET
Pharmacokinetic modelling can be applied to reduced acquisition time PET data without incorporating ASL data in several ways, e.g.: (i) fitting the first 30 min of PET data only using the standard SRTM in equation (1), (ii) extrapolating CR as in RT-SRTM, but R1 is estimated from the PET data.
For the first method, (i), Figure 5(c) compares the estimation of
Using the second method, the estimation of
Comparison of the PET only method with the proposed RT-SRTM including ASL derived R1 estimates shows that the additional CBF information improves the estimate of
Discussion
In this paper, we have presented an improved framework for quantitative PET analysis with significantly reduced acquisition time, exploiting blood flow information from simultaneously acquired ASL MRI data.
We have demonstrated that the relationship between the blood flow and tracer delivery for [18F]-florbetapir, which is described by the Renkin–Crone model, may be approximated as regionally linear and used to convert ASL relative CBF values into pseudo-R1 estimates. We have also evaluated a new technique for extrapolating the reference region time activity curve, CR, using PCA which introduces a lower error than the method used by Scott et al., 9 where the mean population is scaled. The timing of the PET acquisition was then optimised, and found to be t = 20,50 min post injection.
When the RT-SRTM estimates of
By comparison, the simplified measure,
This paper focused on the optimisation of a 30-min PET/MR acquisition. Simultaneous acquisition ensures that the CBF measured by ASL represents the flow at tracer injection, avoiding errors introduced by physiological flow changes throughout the day. 2 This assumes negligible change in blood flow between the tracer injection and the end of the scan. This can be controlled through measures used for routine clinical PET scans, such as keeping the patient lying down in an uptake room from injection to scan start. The influence of auditory stimulation, which would be present during the ASL scan but not during tracer injection, on CBF should also be considered, and if necessary the conditions in the scanner should be emulated in the uptake bay. If conditions could be adequately controlled, the technique could be extended to separate PET and MRI acquisitions. However, this would be heavily dependent on the scheduling of the scans and the acquisition time saved is reduced compared to the simultaneous PET/MRI method.
A 30-min acquisition was selected to accommodate a typical MRI neuroimaging session, while still greatly increasing patient throughput and comfort. This could be further reduced depending on the MRI data acquired, where the minimum time is determined by the acquisition of the ASL data and the images required for attenuation correction of the PET data. In this case, using the PCA CR method with fewer principal components should be considered to avoid an under-determined problem where there are more parameters to fit than datapoints available.
The ASL data used in this study were acquired for just 5.5 min over 50 min into the scan with no motion correction and no patient restraint. For this reason, approximately 30% of the ASL-CBF maps failed quality control checks, largely due to motion-induced artefacts. This represents a challenging dataset which could be significantly improved by increasing the number of acquisitions and motion correction. However, the fact that the RT-SRTM worked so well on this dataset indicates that it could be a clinically useful tool. It is worth noting that the data acquired from the four clinically diagnosed YOAD subjects all passed the quality control checks.
The limited time available within the protocol for the ASL acquisition also meant that a single delay time between blood tagging and image acquisition was used. This yields errors in CBF estimation due to different bolus transit times for different brain regions, either due to normal physiology or pathological changes. A multi-delay time ASL acquisition would make the methodology more robust as the transit time is parameterised within the model and this will be evaluated in future work.
The RT-SRTM was here applied to an amyloid-β tracer; however, the methodology could potentially be used for any tracer which can be described by the SRTM, and which has a sufficiently high extraction fraction, such as [18F]-flutametamol, another amyloid-β tracer, or tau (τ) tracers. 32 The kinetics of these tracers are slower than those of [18F]-florbetapir, and as such require longer dynamic acquisitions. Here, the RT-SRTM could potentially offer a greater reduction in acquisition time, and in future work, we intend a comparison with the dual time-window protocol, another acquisition time reduction method used on such tracers, where early and late PET data are acquired with a break in-between. 33 Furthermore, our approach could be broadened to other kinetic models which have a tracer delivery parameter that can be approximated using CBF from ASL. Reference region curve extrapolation could also be used in reference Logan analysis, 34 as an alternative to a previously proposed reduced acquisition time method which cannot account for blood flow changes. 35
The main limitation of this study is that the optimisation of the RT-SRTM has been performed on cross-sectional dynamic scans of mostly healthy volunteers. The introduction of subjects with disease may increase the variability in CR between subjects. However, some variability already exists in the dataset used as the healthy subjects undergo normal ageing and we include four clinically diagnosed subjects, which the PCA CR method can handle. Provided that the dataset used to build the model for the PCA CR method includes diseased subjects, this variability can also be accounted for.
In future work, this technique will be validated on longitudinal data including symptomatic patients, to further investigate its robustness to disease progression and local changes in blood flow. The linear relationship found between R1 and relative CBF will require verification on such datasets to ensure that the assumption of
Another limitation within the proposed technique is that tracer delivery is estimated directly from ASL-CBF using a region-dependent linear relationship. This works well for regional data as artefacts can be averaged out; however, this is not possible for voxel-wise analysis where errors will propagate through to the R1 estimate. A more robust methodology which propagates database R1 values into the subject space based on local image similarity has been proposed 36 and will be investigated in the future. This would facilitate voxel-wise analysis for quantitative parametric imaging within a clinically feasible time frame.
Supplemental Material
Supplemental material for Reduced acquisition time PET pharmacokinetic modelling using simultaneous ASL–MRI: proof of concept
Supplemental material for Reduced acquisition time PET pharmacokinetic modelling using simultaneous ASL–MRI: proof of concept by Catherine J Scott, Jieqing Jiao, Andrew Melbourne, Ninon Burgos, David M Cash, Enrico De Vita, Pawel J Markiewicz, Antoinette O'Connor, David L Thomas, Philip SJ Weston, Jonathan M Schott, Brian F Hutton and Sébastien Ourselin in Journal of Cerebral Blood Flow & Metabolism
Footnotes
Funding
The author(s) disclosed receipt of the following financial support for the research, authorship, and/or publication of this article: This work was supported by the EPSRC UCL Centre for Doctoral Training in Medical Imaging (EP/L016478/1), UCL Leonard Wolfson Experimental Neurology Centre (PR/ylr/18575), EPSRC (EP/H046410/1, EP/J020990/1, EP/K005278), MRC (MR/J01107X/1), NIHR UCLH Biomedical Research Centre (Inc. High Impact Initiative, BW.mn.BRC10269), and the Alzheimer's Society (AS-PG-15-025). The Tesla K20 used for the PET reconstruction was donated by the NVIDIA Corporation. Insight 1946 receives funding from Alzheimer's Research UK (ARUKPG2014-1946, ARUKPG2014-1946), MRC Dementia Platform UK (CSUB19166), The Wolfson Foundation, and Brain Research Trust. The Florbetapir tracer was kindly supplied by Avid Radiopharmaceuticals, a wholly owned subsidiary of Eli Lilly. This work was partly supported by the Wellcome/EPSRC Centre for Medical Engineering [WT 203148/Z/16/Z].
Acknowledgements
The 3D GRASE pCASL sequence used in this work was kindly provided by Dr Federico von Samson-Himmelstjerna and Professor Matthias Günther (Fraunhofer MEVIS, Bremen, Germany). We acknowledge Roger Gunn for providing help with the simplified reference tissue model and Kjell Erlandsson for the useful comments and discussion of the manuscript. We are grateful to the Insight 46 and YOAD participants for their involvement in this study.
Declaration of conflicting interests
The author(s) declared no potential conflicts of interest with respect to the research, authorship, and/or publication of this article.
Authors' contributions
CJS performed the analysis, data interpretation, and wrote and revised the manuscript. JJ, PJM and NB advised on PET data analysis, and AM, EDV and DLT advised on ASL analysis. JJ, AM, EDV and DLT contributed to manuscript structure. JJ, AM, EDV, DLT, AOC, PSJW, PJM, NB, DMC, JMS, BFH and SO contributed to study design, data acquisition and critically revised and approved the manuscript.
References
Supplementary Material
Please find the following supplemental material available below.
For Open Access articles published under a Creative Commons License, all supplemental material carries the same license as the article it is associated with.
For non-Open Access articles published, all supplemental material carries a non-exclusive license, and permission requests for re-use of supplemental material or any part of supplemental material shall be sent directly to the copyright owner as specified in the copyright notice associated with the article.