
Abstract
Fluctuations in blood-oxygenation level dependent (BOLD) signal and perfusion affect the quantification of changes in cerebral blood flow (CBF), coupled to neuronal activity, in arterial spin labeling (ASL). Subtraction methods for control and labeled MR images (i.e. pair-wise, surround subtraction, and subtraction of sinc-interpolated images), postulated to mitigate this interference in pseudo-continuous ASL (pCASL), were evaluated by comparison with quantitative 15O-water PET. At rest, a good agreement in the CBF values was found between PET and MRI for each of the subtraction methods. Stimulation of the visual system resulted in a regional CBF increase in the occipital lobe, which was detectable in both modalities. Bland–Altman analysis showed a systematic underestimation of the CBF values during activation in MRI. Evaluation of the relative CBF change induced by neuronal stimulation showed good inter-modality agreement for the three subtraction methods. Perfusion data obtained with each subtraction method followed the stimulation paradigm without significant differences in the correlation patterns or in the time lag between stimulation and perfusion response. Comparison to the gold standard confirmed the detectability of a neuronal stimulation pattern by pCASL. The results indicate that the combined use of background suppression and short TE reduces the BOLD-weighting in the pCASL signal.
Introduction
The cerebral blood flow (CBF) response to a neuronal task can be quantified with arterial spin labeling (ASL) techniques. 1 In ASL, CBF quantification relies on the acquisition of image pairs:2,3 in one image (label), the magnetization of the arterial blood flowing into the imaging slice is manipulated by either saturation 2 or inversion; 3 in the other image (control), both the water in the static tissue and that in arterial water are in the same magnetic state. In the ideal case, a subtraction of the two images provides a measure of the amount of the inflowing blood, i.e. a perfusion-weighted image. However, as just 1% of the magnetization of the tissue is provided by the inflowing blood 4 in the resting gray matter, the main drawback of ASL is low signal-to-noise ratio (SNR). Moreover, due to the slight temporal shift between the interleaved acquisitions of label and control images, any blood-oxygenation level dependent (BOLD) change in the T2* of the signal between two scans can result in an imperfect static signal cancelation after conventional pair-wise subtraction.5,6 If not accounted for, the BOLD modulation complicates the interpretation of the ASL-response to neuronal activation by: (i) delaying the onset and the offset of the response; 5 (ii) inducing a post-stimulus undershoot in areas of large flow changes;7,8 (iii) inducing high-frequency fluctuations of the ASL signal change; 5 (iv) inducing a lower cross-correlation to the expected response. 5
The combination of low SNR in the perfusion-weighted images, and the BOLD weighting of the acquired images, may limit the quantitative accuracy of functional ASL. SNR in ASL can be improved using pseudo-continuous ASL (pCASL), 9 which provides higher labeling efficiency. Additionally, several subtraction strategies6,8,10 of the labeled and control MR images have been proposed in order to mitigate spurious BOLD interference and fluctuations of the signal in the perfusion-weighted images. Compared to pair-wise subtraction, alternative subtraction strategies attempt a mitigation of the BOLD effect by replacing the labeled signal, sampled a TR time after the control signal, with an estimate of the label signal at the same time point. However, the value of these subtraction methods for pCASL data has not yet been evaluated.
In this study, we investigated the outcome of three subtraction methods (pair-wise subtraction, surround subtraction, and subtraction of sinc-interpolated control and labeled images) on pCASL-based quantification of the CBF response to visual stimulation in healthy volunteers by comparing the results to quantitative measurements of CBF obtained by positron emission tomography using 15O-labeled water (H215O-PET). To the best of our knowledge, this is the first study that investigates the accuracy of pCASL in detecting the CBF response to a neuronal task by providing a comparison to the gold standard.
Materials and methods
Subjects
Eight healthy volunteers (28 ± 8 years old, range: 21–45 years, all men) were included in this prospective study. The study was approved by the clinical ethics committee of the Hospital, the Swiss federal office of public health (FOPH), and the federal agency for therapeutic products (Swissmedic). The research project followed the Ethical Principles for Medical Research Involving Human Subjects adopted by the World Medical Association in Helsinki in 1964 (the Helsinki Declaration). All participants gave written informed consent to the MR and the PET examinations, and to the scientific evaluation of the data sets. Due to scanner availability logistics, PET and MRI sessions of the same volunteer were one to seven days apart.
MRI
The MR data were acquired using a 3 Tesla whole-body scanner (Ingenia, Philips, Best, The Netherlands). The MR signal was received using a 15-channel head coil (Philips, Healthcare, Best, the Netherlands), while the built-in body transmit coil was used for spin excitation.
A 3D T1-weighted gradient-echo pulse sequence (TR/TE = 9.1 ms/4.2 ms; flip angle = 8°, echo train length 137, TI = 677 ms, sensitivity encoding factor 2) was acquired for anatomical orientation.
Stimulation
Controlled stimulation of the visual cortex was performed by alternating the presentation of “rest” (gray screen with a cross-hair cue displayed in the center for visual fixation) and “activation” (8 Hz flashing polar checkerboard pattern) epochs. The pattern was generated using the software package Psychtoolbox11,12 and projected in the MR room. Each trial consisted of 4 “rest” and 4 “activation” epochs, repeated 8 times. Each epoch lasted 16 s.
Data acquisition
During each epoch, 20 oblique axial slices covering the visual cortex were acquired using a background-suppressed balanced pCASL single-shot gradient echo EPI sequence. 13 Imaging parameters were the following: voxel size 3.00 × 3.00 × 5.00 mm3, TR/ TE = 4000 ms/ 12 ms, flip angle = 40°, sensitivity encoding factor 3, post labeling delay (PLD) =1465 ms, labeling duration 1650 ms, label gap 20 mm, RF duration = 0.5 ms, pause between RF pulses =0.5 ms, labeling pulse flip angle = 18°, bandwidth =2.0 kHz, echo train length = 29, number of control/ tagged pairs = 64, spectral presaturation with inversion recovery for fat suppression, acquisition time/image pair = 8 s. A reference scan for CBF quantification was acquired using the same sequence by setting the labeling delay to 2500 ms and the TR to 10,000 ms.
H215O-PET
For each subject, CBF was also quantified using 15O-labeled water PET using a full ring PET/CT scanner (PET/CT Discovery STE, GE Healthcare, Waukesha, MI, USA).
Stimulation
Each condition (i.e. rest and active) was presented continuously for 5 min. A pause of 10 min was included between the presentations of the two conditions.
Data acquisition
Stimulation was started 1 min before the intravenous administration of 600 MBq of 15O-water. Dynamic PET images (18 × 10 s) were acquired in 3D mode with a voxel size of 2.34 × 2.34 × 3.27 mm3. The arterial input function (AIF) was acquired with 1 s temporal resolution using an automatic blood sampling device (twilite, swisstrace GmbH, Menzingen, Switzerland). All images were corrected for scatter and attenuation using the corresponding low-dose CT (120 kV, 80 mA).
Data processing
Pre-processing
MR pre-processing was performed using SPM 12 (Statistical Parametrical Mapping 12, Wellcome Trust Centre for Neuroimaging, London UK), including motion correction (realignment of the control and label volumes, co-registration of the reference volume and of the anatomical reference to the first volume of the control data set), and smoothing (FWHM 4 × 4 × 4 mm). 14
For the PET data, CBF was computed pixel-wise using a one-tissue compartment model with look-up table approach.15,16 Activation maps resulted from the subtraction of the CBF maps computed for the active and the rest condition. Relatively large FWHM Gaussian filters are recommended in PET statistics (e.g. 16 × 16 × 16 mm FWHM Gaussian recommended for H215O PET CBF maps in SPM12 PET Toolbox). In our study, the combination of short imaging protocol necessitated by the short (2 min) tracer half-life, high positron energy of [15O], filtered back projection image reconstruction and kinetic model application for parametric mapping resulted in images with substantial noise. Gaussian filtering (FWHM 10 × 10 × 10 mm) was applied to the CBF maps before subtraction. The size of the applied filter was a trade-off between SNR and image blurring.
PET image processing was performed in PMOD (PXMOD tool, version 3.5, PMOD Technologies Ltd., Zurich, Switzerland). PET-CBF maps and PET activation maps were co-registered to the anatomical MR volume using SPM 12.
Specification of functional regions of interest
For each subject, t-test maps generated from the statistical analysis of the time course of the control volume of the pCASL data
17
were overlaid onto the CBF PET subtraction images. Functional regions of interest (RoIs) were manually drawn at the level of the visual cortex to cover common areas of activations (Figure 1). To improve the identification of the areas responding to the stimuli, a threshold was applied to the t-test maps before drawing the functional RoI. For each subject, the threshold was set to 70% of the maximum t-score. RoI analysis was performed in PMOD.
RoI for one representative volunteer, over the PET subtraction image (a), the t-test map (b), and the anatomical reference (c). Both the PET subtraction image and the t-test map are overlaid onto the anatomical T1-weighted image. To improve the identification of the areas responding to the stimuli, a threshold was set on the t-test maps before drawing the functional RoI. For each subject the threshold was set to 70% of the maximum t-score.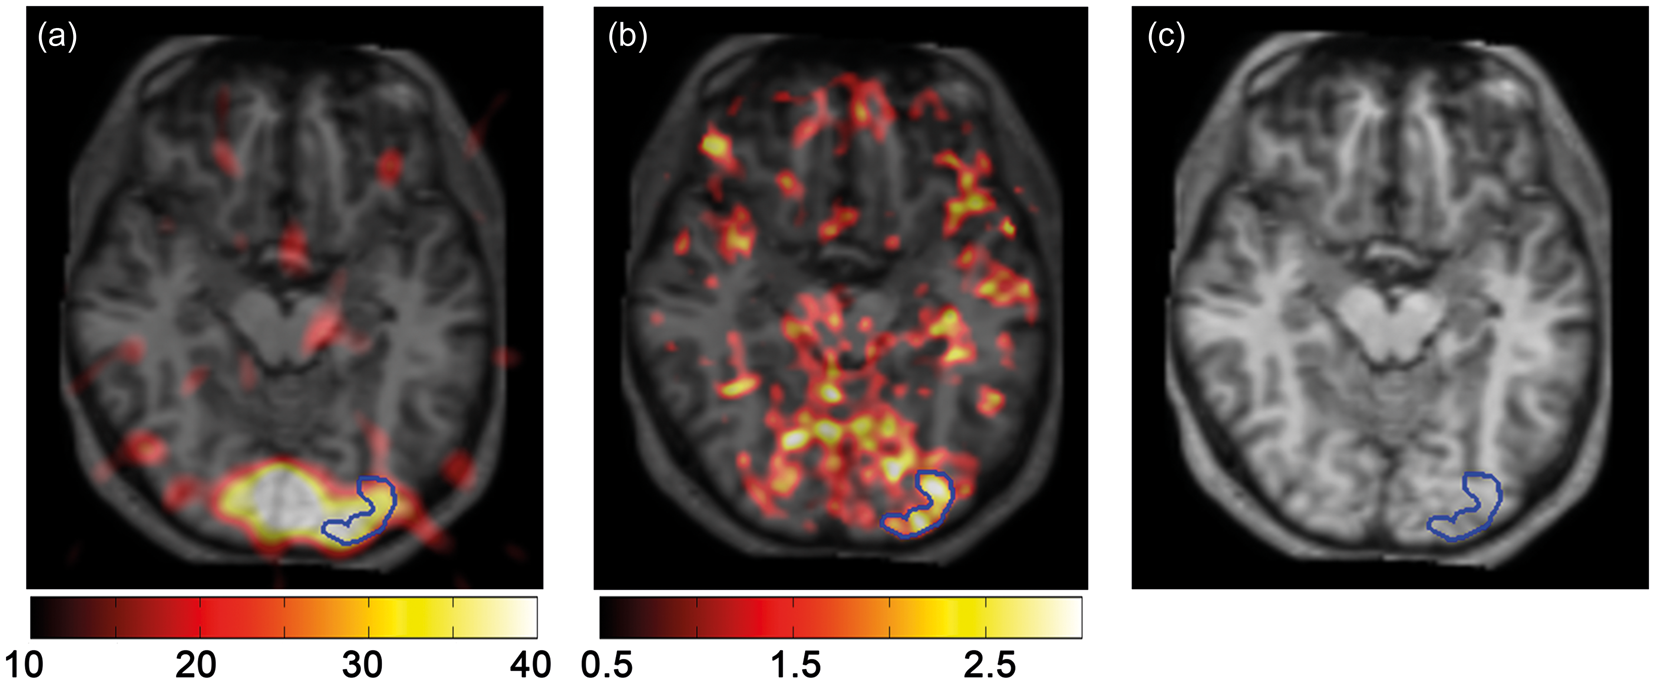
MR signal processing
The CBF response to visual stimulation was computed from the signal measured over the functional RoIs. In the following, the formalism introduced by Aguirre et al. 6 is used to describe the signal processing models. Conventional ASL methods provide a set of n images, [C1, L1, C2, L2, …, Cn/2,Ln/2] where control (C) and labeled (L) images are acquired consecutively. Perfusion-weighted information, P, can be derived from the subtraction of the acquired images mostly according to three methods: where fractional subscripts represent the time series estimated using a sinc interpolation at the time point of the acquisition of the control image.
Perfusion estimates generated by the pair-wise subtraction are expected to be affected by both signal fluctuations due to thermal noise and systematic BOLD interferences. 8 Surround subtraction is expected to mitigate the effects of high frequency signal fluctuations, while sinc-subtraction attempts a correction of the temporal shift between the images. 6
Quantitative CBF values, in units of ml/100 g/min, were computed using the equation
18

In the previous equation, the parameters represent the following: λ = 0.98 ml/g is the brain–blood partition coefficient, PLD = 1.465 s is the post labeling delay, T1,blood = 1.650 s is the T1 time of the arterial blood at 3 Tesla, 19 M0 is the signal intensity of the reference image, α = 0.86 is the labeling efficiency, 13 τ = 1.650 s is the label duration. Image subtraction, P, of the labeled signal from the control signal was performed according to the three subtraction methods described above. CBF values ranged between 0 and 130 ml/100 g/min. Negative CBF values were set to zero before performing the statistical analysis.
Signal analysis and computation of parametrical maps were performed using in-house custom software written in Matlab (MATLAB Release 2013b, The MathWorks, Inc., Natick, Massachusetts, United States).
Statistical analysis
For each of the subtraction methods, the normalized cross-correlation and the lag times between the resulting activation pattern and the expected perfusion response were computed using the xcorr function of Matlab. The perfusion response was modeled as the convolution of the hemodynamic response function (HRF) and the stimulus function.20,21 The HRF was computed as the difference of two gamma variate functions with the spm_hrf.m function of SPM12.
For comparison across subjects, maximum cross-correlation magnitudes (r) were transformed to Z-scores using the formula:
22

For each subject and each subtraction method, “rest” and “active” CBF values were computed by averaging the corresponding CBF values selected on the basis of the response corrected for temporal shift. The relative change in CBF originating from the visual stimulation was calculated as

Regional CBF values computed over the visual cortex using the three subtraction methods were compared with the results of the PET examination. Bland–Altman analysis was performed to investigate the agreement of the quantitative CBF measurements. For each subtraction method, Z-scores, ΔCBF, CBFrest, and CBFactive were statistically compared using a related samples Wilcoxon signed rank test (p < 0.05). Statistical analysis was performed in R v. 3.2.3. 23
Results
Comparison of the ASL subtraction methods
ROI based CBF values (in units of ml/100g/min) at rest and during activation of the visual cortex, and relative CBF change (ΔCBF) for PET and for each of the subtraction methods used for pCASL MRI data.
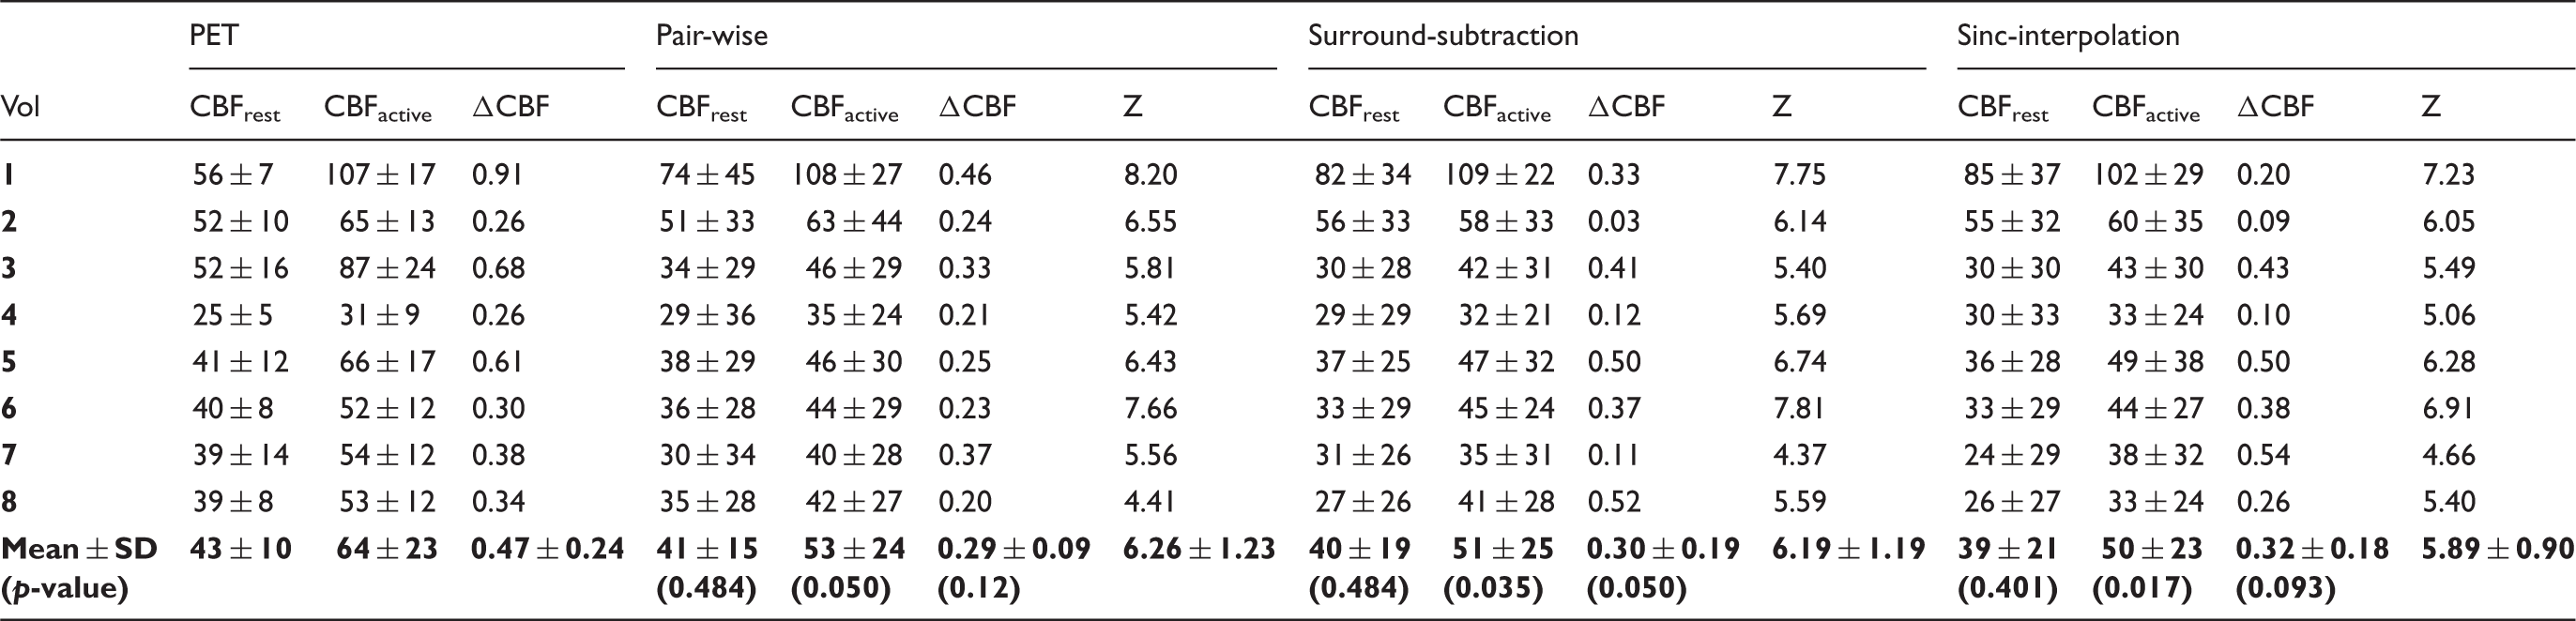
Note: For each subtraction method Z-scores are reported. The p-values for the related samples Wilcoxon signed-rank test comparing the PET with each of the subtraction methods are reported (α = 0.05).
Analysis of the temporal pattern of the CBF response to the stimuli, which measured the correlation to the expected response and the temporal lag to the beginning of the stimulus, showed comparable performances for each of the three subtraction methods (Figure 2, Table 1). Mean lag values were: 3.0 ± 2.8 after pair-wise subtraction, 3.1 ± 2.6 after surround-subtraction, and 3.0 ± 2.5 for sinc-interpolated data.
The signal temporal pattern of the pCASL data measured over a functional RoI in one healthy volunteer shows the expected flow and BOLD response to the block-designed stimulation of the visual cortex (Panel a). Blood flow induces a rapid oscillation of the signal from one image to the next, while the overall modulation (up and down of the signal over time ranges corresponding to eight images) is due to the BOLD effect. The dynamic CBF response is illustrated after pair-wise subtraction (b), surround subtraction (c), and subtraction of sinc-interpolated data (d). The predicted response pattern is also illustrated (gray shadowed pattern).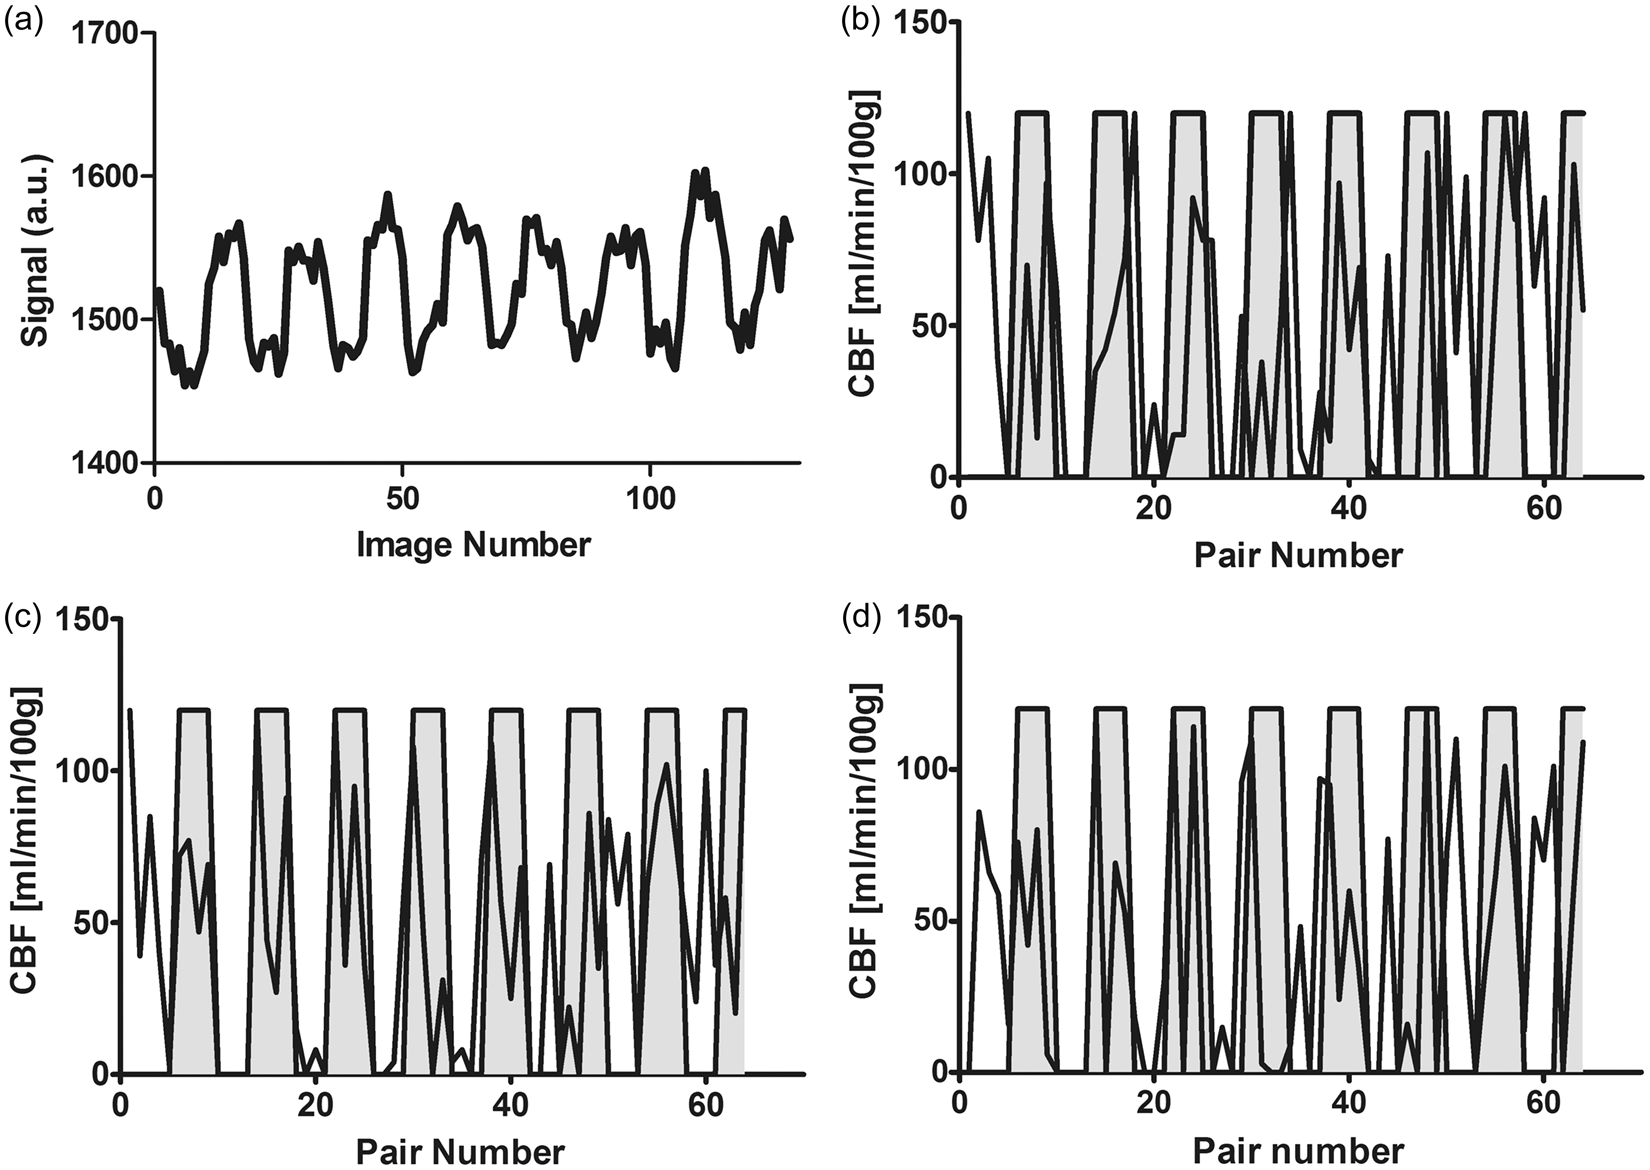
Comparison with H215O-PET
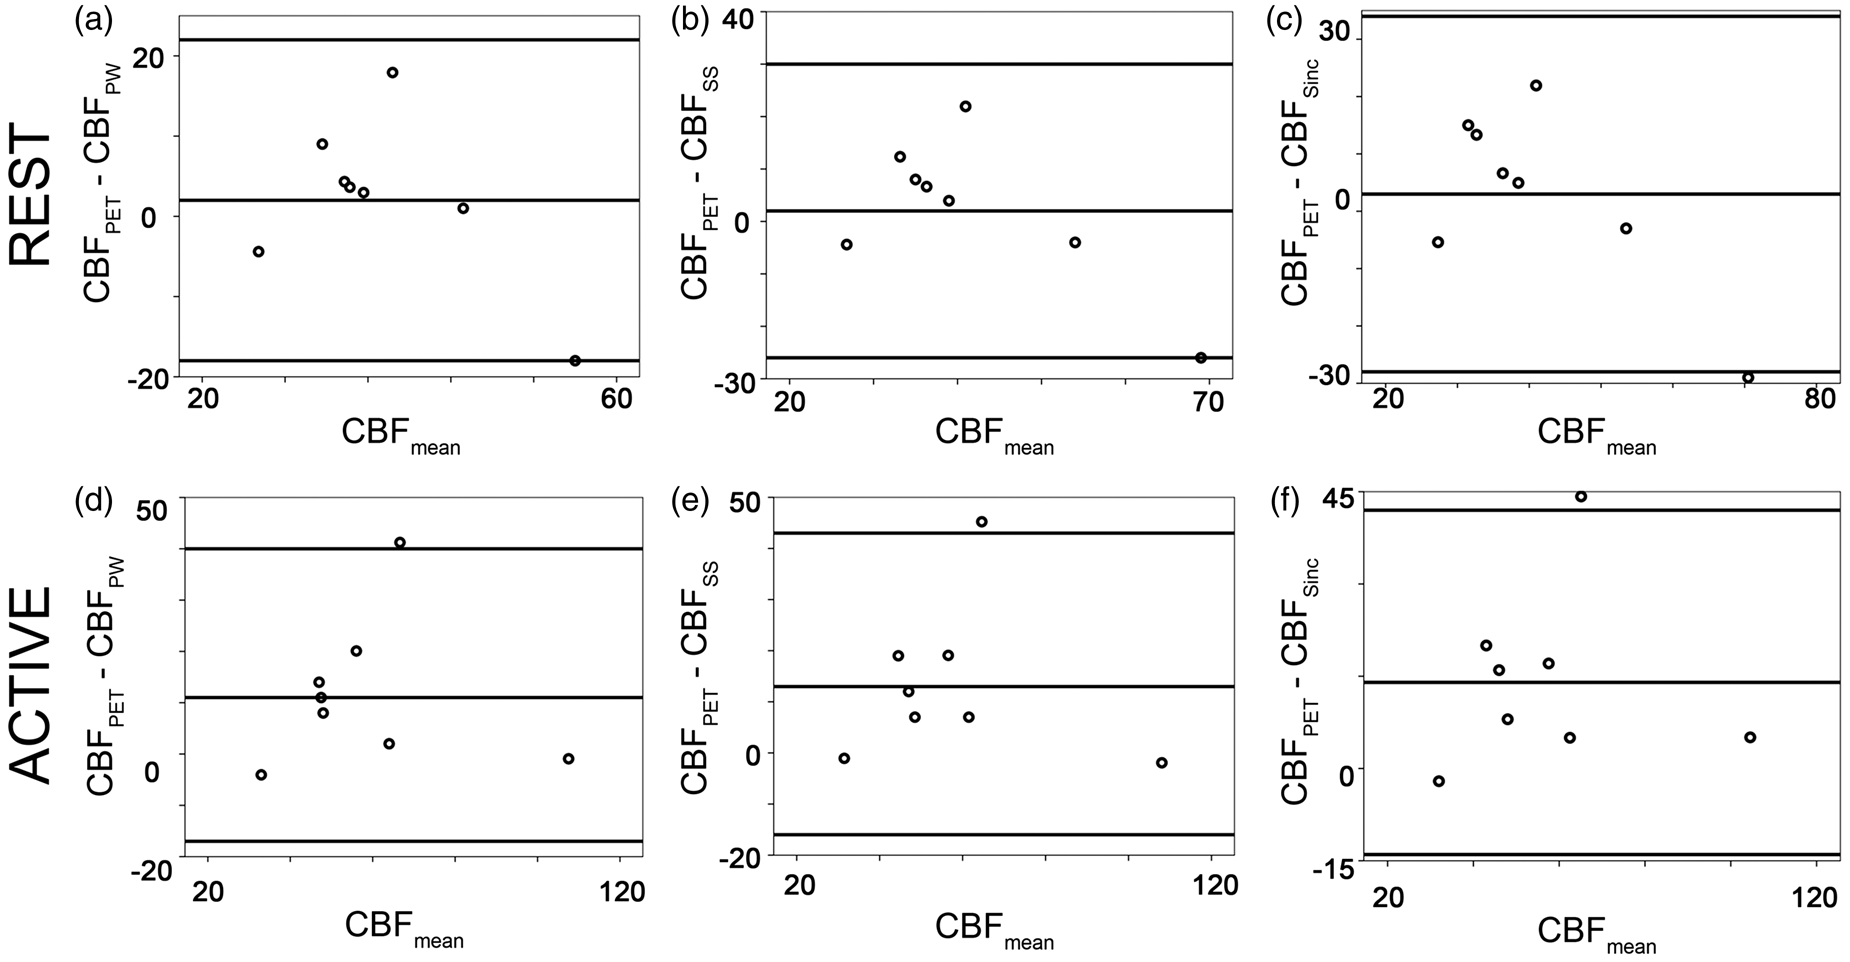
Exploratory statistics (Figure 3) confirmed that both pCASL and PET measured an increase in CBF during visual stimulation. At rest, a good agreement between PET and MRI was found for each of the subtraction methods (Figure 3). However, for each of the subtraction methods, a bias in the absolute CBF values was found during activation (Figure 3). The results of the exploratory statistics were confirmed by Bland–Altman analysis (Figure 4) and by Wilcoxon-test analysis of CBF values. At rest, PET-based mean CBF was 43 ± 10 ml/min/100 g, in good accordance to the MR measurements (Table 1, Figure 4).
Scatter plots illustrating inter-modality agreement for pair-wise subtraction (a), surround subtraction (b), and sinc-subtraction (c). Both modalities show an increase of the CBF after stimulation. The identity line is reported in each diagram. Bland–Altman analysis revealed a good agreement between MRI and PET at rest (a–c). For each of the subtraction methods, the MR estimate of the CBF under activation was lower than that measured with PET (d–f).
In PET, visual activation resulted in a significant (p < 0.005) increase in CBF of 21 ± 25 ml/min/100 g. Compared to PET, pCASL underestimated CBF increase during visual stimulation for each of the subtraction methods (mean difference pair-wise: 11 ± 33 ml/min/100 g, p = 0.050, surround subtraction: 13 ± 33 ml/min/100 g, p < 0.05; sinc-interpolation: 14 ±32 ml/min/100 g, p < 0.05). The relative CBF change measured in MRI was slightly lower than in PET (Table 1, Figure 5). However, the difference was not significant (Table 1).
Bland–Altman analysis of the relative CBF changes induced by visual stimulation shows a good agreement between the two modalities for each of the subtraction methods (a–c). A slightly, but non-significant, higher relative change was found with PET.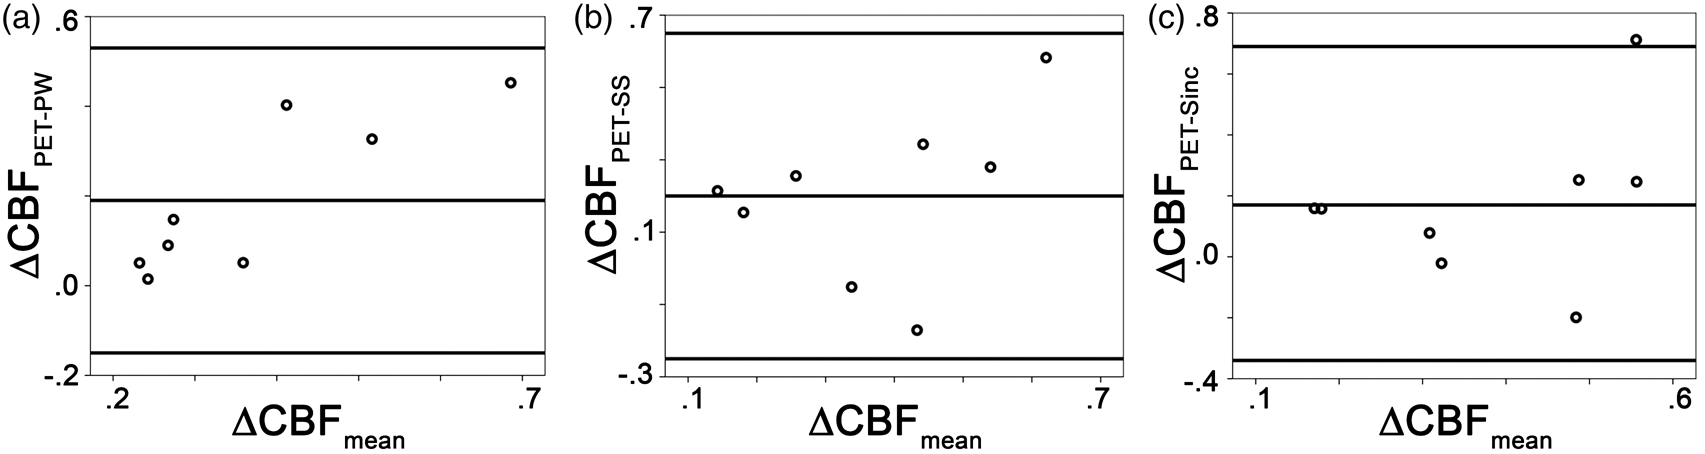
Discussion
The aim of the current study was to analyze the accuracy of CBF quantification in a neuronal task using pCASL, and the influence of three image subtraction methods. Although other studies have evaluated the accuracy of pCASL at rest,24–27 little is known about the quantification of the CBF response to stimuli. 28 In this study, agreement with the quantitative PET reference standard was assessed by comparing resting CBF, activation CBF, and relative CBF changes. PET-based CBF values were in accordance with the literature. 28 However, a larger increase in CBF was apparent compared to the values reported elsewhere29,30 (30% vs. 15–18%), which is likely due to differences in the stimulation patterns used and variations in the volunteer cohort. In our study, a single long stimulation period was presented during PET acquisition. Quantitative PET imaging of CBF using H215O necessitates a dynamic imaging protocol generating 3–5 min (i.e. we used 18×10 s) ‘time-activity curves’ for each voxel. The tracer kinetic model is fitted to these time-activity curves using the radioactivity continuously measured in arterial blood as the input function to the model. The number of repetitions of this protocol possible in each volunteer is limited by the total radiation dose received. Thus, a block protocol similar to that known to be effective for fMRI was not possible. Prolonged presentation of a stimulus is known to reduce the measurable response in fMRI (adaptation). 31 For the MRI modality in our study, we opted for a different stimulation pattern in order to maximize the response to the stimulus. A maximal, high-contrast visual stimulus was selected for optimum translation between the two modalities. Stimulus during PET was started 60 s before H215O injection and maintained until the end of the 18 × 10 s imaging protocol to ensure that both initial uptake and tracer washout rate were similarly influenced. In combination with the use of a stimulus selected for maximal response, used at the optimal contrast/frequency from the literature, we believe that the PET should be minimally influenced by adaptation.
The pCASL measurements at rest and during activation are in agreement to others.13,32 Moreover, the relative change in CBF reported in this study is in good accordance with the values reported in the literature. 32 Partial volume contamination through inclusion of white matter in the RoIs may explain the slightly lower CBF values computed in this study (around 40 ml/100 g/min) as compared to the results reported by Aslan et al. 13 for the occipital gray matter. Additionally, the relatively short post-delay time 13 selected in this study may have resulted in slight CBF underestimation. The quantification of CBF by ASL also assumes an accurate estimation of the equilibrium magnetization, M0 (equation (1)). Aslan et al. 13 estimated the equilibrium magnetization of the brain tissue from manual RoIs drawn over the thalamus in the control image, corrected for T1 relaxation. In our study, equilibrium magnetization images were acquired in separate scans using the 2D pCASL sequence by increasing the post-labeling delay and the TR. This approach has the advantage of providing a pixel-wise estimate of the equilibrium magnetization. However, depending on the T1 of the tissue, the use of background suppression in the reference scan may result in a minimal residual pixel-wise misestimation of the M0, in spite of the long TR.
As mentioned above, differences between absolute CBF values under activation for pCASL and PET in this study may reflect the difference in the stimulation pattern necessitated (continuous presentation of stimulus over 5 min in PET, block design in ASL), although it was assumed that such a checkerboard stimulation induces maximal visual activation. The difference in overall imaging protocol between modalities may also have contributed. Differences in spatial resolution between PET and MRI may also be relevant, although analysis of large occipital RoIs should reduce the influence of partial-volume effects in either modality.
Caffeine consumption 33 and daily physiology 34 are known to affect CBF quantification. In our study, scanner availability logistics and the ethical protocol did not allow for control of time of day or caffeine intake differences between the PET and MRI sessions. A reduction of the gray matter CBF at rest in the order of 20 to 27 % was reported after high caffeine intake.35,36 Chen and Parrish 37 estimated that high caffeine doses can increase the BOLD response and the CBF response to both, motor and visual tasks. In our study, CBF values quantified during two different sessions may have been residually affected by differences in the plasma caffeine concentration or daily physiology. However, it is unlikely that the differences may be in the same range as reported in the cited literature, as, for the reported studies, caffeine intake was performed in high single doses, which followed an abstinence period. Moreover, the use of a polar checkerboard visual stimulus was selected to elicit a maximal CBF response in visual areas, and the intensity/contrast between modalities was controlled. A maximal stimulus in each modality, for the same subject, was used to standardize the response as much as possible, and a high contrast visual stimulus was used to reduce the influence of arousal/attention.
This study focused on the evaluation of signal subtraction methods for CBF estimation by pCASL. Our results showed that the three subtraction methods performed similarly in the intra-modality and in the inter-modality comparison. Other strategies have been proposed to mitigate (or differentiate) the BOLD effect in the CBF time series in the literature, which were not evaluated in this study. Mumford et al. 21 proposed the use of a regression analysis of the non-differentiated ASL data. In this model, two activation-regressors are modeled to account for both the perfusion changes and the BOLD effect changes. Chuang et al. 38 performed high frequency filtering to extract CBF signal from the ASL time course.
Our study shows that all three pCASL subtraction methods followed the stimulation pattern (Table 1, Figure 2). The Wilcoxon rank sum test did not reveal any significant difference between pair-wise subtraction and the other subtraction strategies. In this study, the static background signal was attenuated by applying a spatially selective saturation before imaging, which was followed by two inversion pulses. 39 The results of our study suggest that the use of background suppression and of a short TE successfully reduces the BOLD weighting in the acquired pCASL signal. 40 These results are in line with the scientific literature. In gradient echo acquisitions, such as the ones used in our study, the BOLD sensitivity increases with the echo time. 41 The longer the echo time, the higher is the sensitivity of the sequence to activation-related changes in the concentration of deoxyhaemoglobin in the tissue. Studies which systematically evaluated the dependence of the BOLD effect of the TE, proved that TEs between 30 and 110 ms result in maximum BOLD sensitivity at 3 Tesla. 42 The dependence of the BOLD contrast on the TE in the pCASL is well known and dual echo acquisitions are often performed for simultaneous estimations of BOLD and CBF changes during challenges. 43 Our results, showing reduced BOLD contamination of acquisitions performed at echo time of 12 ms at 3 Tesla, are in line with these reports.
In a paper from 2014, Ghariq et al. 44 systematically evaluated the effect of the background suppression on the SNR of the BOLD-weighted and of the CBF-weighted fMRI data in dual-echo pCASL measurements. Background suppression improved the SNR of the pCASL in areas of low CBF. Moreover, since the BOLD-signal is proportional to the signal of the static cerebral tissue, the use of background suppression was proven to reduce the BOLD SNR.
Spurious terms in the signal patterns due to residual BOLD contamination and to perfusion fluctuations are expected to be better attenuated by sinc-subtraction. 6 However, in our study, no significant differences were found between surround subtraction and sinc-interpolation methods (Figure 5). This result is in accordance with Liu and Wong, 10 who suggested that the attenuation of spurious signal terms in block-designed experiments can be satisfactorily achieved by surround subtraction. No differences were found in the temporal pattern of the three subtraction methods. However, the analysis of the time lags may have been limited by the actual temporal resolution of our study, which was defined by the acquisition time for each dynamic.
In conclusion, this study highlighted the detectability of a neuronal stimulation pattern by pCASL by providing for the first time a comparison to the gold standard. The use of a background-suppressed pCASL sequence with short TE for block design functional ASL reduces signal contaminations due to BOLD effects and to signal noise fluctuations.
Footnotes
Funding
The author(s) disclosed receipt of the following financial support for the research, authorship, and/or publication of this article: This work was supported by the Clinical Research Priority Program (CRPP) Tumor oxygenation of the University of Zurich and by the Foundation for Research at the Faculty of Medicine, University of Zurich (grant no. 34270124). GW was additionally supported by CRPP Molecular Imaging Network Zurich.
Declaration of conflicting interests
The author(s) declared following potential conflicts of interest with respect to the research, authorship, and/or publication of this article: Prof. AB is co-founder of Swisstrace GmbH which sells the automatic blood sampling device used for the acquisition of the arterial input function in PET measurements. Dr. GW is employed by Swisstrace GmbH and by PMOD Technologies Ltd. In this manuscript, PMOD was used for pre-processing of the PET images.
Authors’ contributions
Authorship credit was based on substantial contributions to conception and design of the study (GW, FK, DN, AB, AB, and CR), acquisition of data (GW, CR), analysis and interpretation of data (GW, PO, CR), and drafting of the article (all authors contributed).