
Abstract
Arterial spin labeling and phase contrast magnetic resonance imaging provide independent non-invasive methods for measuring cerebral blood flow. We compared global cerebral blood flow measurements obtained using pseudo-continuous arterial spin labeling and phase contrast in 436 middle-aged subjects acquired at two sites in the NHLBI CARDIA multisite study. Cerebral blood flow measured by phase contrast (CBFPC: 55.76 ± 12.05 ml/100 g/min) was systematically higher (p < 0.001) and more variable than cerebral blood flow measured by pseudo-continuous arterial spin labeling (CBFPCASL: 47.70 ± 9.75). The correlation between global cerebral blood flow values obtained from the two modalities was 0.59 (p < 0.001), explaining less than half of the observed variance in cerebral blood flow estimates. Well-established correlations of global cerebral blood flow with age and sex were similarly observed in both CBFPCASL and CBFPC. CBFPC also demonstrated statistically significant site differences, whereas no such differences were observed in CBFPCASL. No consistent velocity-dependent effects on pseudo-continuous arterial spin labeling were observed, suggesting that pseudo-continuous labeling efficiency does not vary substantially across typical adult carotid and vertebral velocities, as has previously been suggested. Conclusions: Although CBFPCASL and CBFPC values show substantial similarity across the entire cohort, these data do not support calibration of CBFPCASL using CBFPC in individual subjects. The wide-ranging cerebral blood flow values obtained by both methods suggest that cerebral blood flow values are highly variable in the general population.
Keywords
Introduction
The brain represents about 2% of body weight, but is one of the most highly perfused organs in the body, utilizing approximately 15% of the cardiac output and 20% of the total body oxygen. 1 Cerebral blood flow (CBF)2,3 is classically defined in tissue-specific units (ml of blood/100 g brain tissue/min) and it is widely accepted that mean global CBF in healthy subjects is on the order of 50 ml/100 g/min. 4 As major reductions in CBF are the primary cause of stroke, CBF provides a direct biomarker for cerebrovascular function and health. In addition, CBF is closely coupled to brain metabolism and hence provides a surrogate marker of brain function. 5
Arterial spin-labeled (ASL) perfusion magnetic resonance imaging (MRI) provides a non-invasive method for quantifying whole-brain and regional CBF by using magnetically labeled arterial blood water as a nominally diffusible perfusion tracer.6–10 The perfusion is proportional to the difference of two images obtained with and without labeling (referred as labeled or tagged image and control image respectively) and can be converted to absolute CBF using specific models10,11 and assumptions. Signal-to-noise ratio (SNR) presents a challenge to accuracy of the ASL estimate of CBF, requiring averaging of multiple label/control image acquisitions to increase SNR. There are several variations of ASL based on the method of labeling the arterial blood water.6,7,12–14 Pseudo-continuous ASL (PCASL) 14 is presently the recommended optimal labeling strategy 13 because of its compatibility with modern MRI hardware and higher SNR compared to alternative options.
Phase contrast (PC)15–17 MRI provides an alternative non-invasive method for estimating whole-brain average CBF based on measurement of blood flow through the internal carotid arteries (ICAs) and vertebral arteries (VAs), which supply blood to the brain. PC measures the velocity of blood through a blood vessel using a bipolar gradient (two symmetric lobes with equal area) to encode flow by inducing phase shifts that are proportional to the flow velocity, and a flow compensated gradient for control acquisition. Subsequently, the total flow rate is obtained by integrating the flow velocities across the four arteries supplying blood to the brain, while a structural MRI scan is used to quantify the brain volume to derive whole-brain CBF in ml/100 g/min. Regional CBF cannot be measured with PC.
An important parameter in the quantification of CBF in ASL is the labeling efficiency, which refers to the degree of magnetic inversion for blood water flowing through the tagging plane.14,15 While PCASL is designed to invert flowing blood water over a range of velocities, 14 it is nonetheless sensitive to arterial velocity, which can be affected by vessel orientation or stenosis, and to other biophysical factors such as RF and magnetic field inhomogeneity at the labeling plane. Protocols for assessing vessel anatomy and signal quality at the labeling plane have been devised to optimize PCASL labeling efficiency, 18 but these are cumbersome to perform and as a result, an assumed labeling efficiency of 0.8–0.85 is often used 13 in routine practice. One way of assessing labeling efficiency is to compare CBF assessed by PCASL with an independent measure of CBF, such as PC, and comparisons between PCASL and PC acquired concurrently have been used to assess PCASL labeling efficiency15,19 and calibrate the CBF measurements. However, this approach is based on the assumption that CBF assessed by PC is accurate.
The aim of the present study was to compare and cross-validate whole-brain CBF measurements obtained using PCASL MRI (referred below as CBFPCASL) and PC (referred below as CBFPC) from a large cohort of typical middle-aged subjects scanned as part of the multisite coronary artery risk development in young adults (CARDIA) study. This comparison is intended to provide insights into CBF variability based on methods that can readily be applied in a population-based study. Using data from over 500 subjects, we measured and compared the range and variability of CBF based on these two independent measurement strategies. In addition, we compared the CBF values obtained from the two non-invasive methods. We also investigated the rationale of using CBFPC to calibrate CBFPCASL, since prior work suggested that PC could be used to correct for inter-subject variations in labeling efficiency in PCASL. 15 Toward this end, we assessed whether the variability in CBFPCASL measurements could be completely described by the CBFPC measurements, and whether the PCASL labeling efficiency, computed as a ratio of the CBFPCASL and CBFPC, varies significantly as a function of arterial velocity, which was previously proposed as the main source of variations in labeling efficiency. In lieu of a “gold standard” measure of quantitative CBF, we assessed age and gender effects, which are known modulators of CBF,20,21 as another means of comparing PCASL and PC.
Materials and methods
Cohort
CARDIA is a multisite, longitudinal study aiming at examining the development and determinants of clinical and subclinical cardiovascular disease. MRI data acquired at two sites (Minneapolis and Oakland) from 541 (291 from the Minneapolis site and 250 from the Oakland site) healthy middle-aged subjects, including blacks and whites and males and females aged 43–56 years, who underwent the MRI protocol of CARDIA Year 25 on 3 Tesla Siemens MRI scanners were considered for this study. The MRI protocols in Minneapolis and Oakland were approved by the Institutional Review Board of the University of Minnesota and the Kaiser Permanente Northern California (KPNC) Institutional Review Board, respectively. Institutional Review Boards in the United States adhere to the ethical principles and guidelines for the protection of human subjects in research enumerated in the Belmont Report (http://www.hhs.gov/ohrp/humansubjects/guidance/belmont.html), produced by the National Commission for the Protection of Human Subjects of Biomedical and Behavioral Research (April 1979). All participants signed written informed consent for the brain MRI and for all other CARDIA procedures. The data used in this study and all CARDIA data are available through the CARDIA Coordinating Center (http://www.cardia.dopm.uab.edu/contact-cardia) after approval of a paper proposal submitted to the CARDIA Publications and Presentations Committee.
Image acquisition
Non-background-suppressed PCASL data were acquired using gradient-echo echoplanar imaging (EPI) with the following parameters: TR/TE: 4 s/11 ms, voxel size: 3.4 × 3.4 × 5 mm3, matrix = 64 × 64, flip angle = 90°, FOV = 220 mm, bandwidth = 3004 Hz/pixel, echo spacing = 0.44 ms and EPI factor = 64. Twenty slices with a distance factor of 20% were acquired from inferior to superior in a sequential order. PCASL was performed with labeling offset = 90 mm, duration = 1.48 s, post-labeling delay (PLD) = 1.5 s, RF gap = 0.36 ms, RF duration = 0.5 ms and mean Gz = 0.6 mT/m. 40 label and control pairs were acquired. The PC data were acquired at eight phases within a cardiac cycle with a maximum velocity encoding of 100 cm/s. Other PC acquisition parameters were: voxel size: 0.8 × 0.8 × 5.0 mm3, FOV: 20 cm, TR =140 ms, TE = 10 ms, flip angle = 15°, and bandwidth =260 Hz/pixel. PC imaging was performed near the PCASL labeling plane. 22 PCASL and PC scans were performed in a fixed order (PCASL followed by PC). The scan protocol included a T1-weighted 3D MPRAGE sequence used for segmentation of different tissues and for computing the total brain volume. This scan was sagittally acquired with the following parameters: resolution: 1 × 1 × 1 mm3, TR/TE/TI = 1900/2.9/900 ms, matrix = 256 × 256, slices = 176, FOV =250 mm, flip angle = 9°, GRAPPA = 2, and bandwidth =170 Hz/pixel.
Processing of PC data using an in-house MATLAB program – PC analysis utility
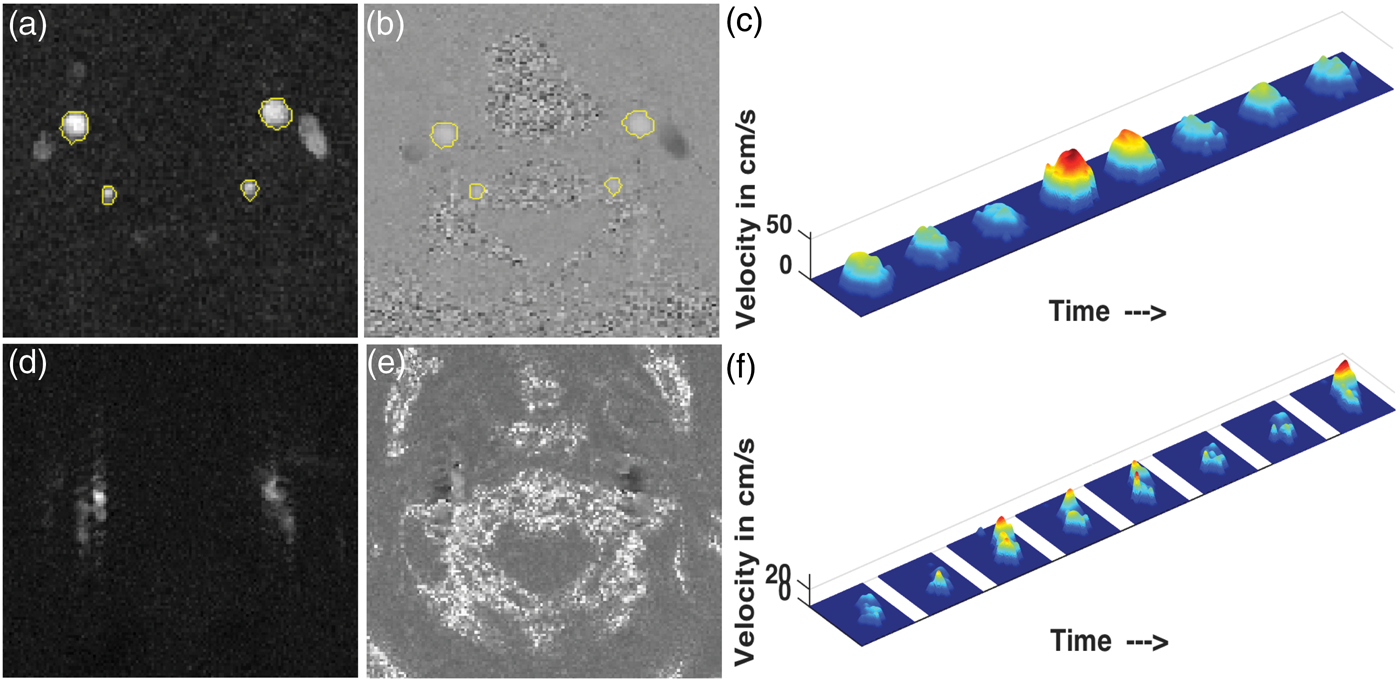
All PC data were analyzed by a single author (R.M.) using an in-house developed MATLAB (The Mathworks Inc., Natick, MA) program equipped with (i) semi-automated vessel segmentation and (ii) the function for visualizing the flow velocity profile. A snapshot of the utility is shown in the left subplot of Figure 1. The segmentation process used a pixel-wise maximum of the eight complex difference images (corresponding to eight phases) of the PC data. The user selects a particular artery by clicking inside it. Thereafter, the ROI is grown iteratively by comparing the intensities of all unallocated neighboring pixels to a threshold and adding to the ROI those pixels whose intensities are above threshold. Such a region-growing approach has the advantage of resulting in a connected ROI. The threshold was set to n times the noise level, where n = 2 by default, and could be modified by the user in the case of unsatisfactory segmentation. The noise level was estimated as the median of the intensities of the complex difference image. The right subplot of Figure 1 shows the distribution of n for the ICAs and the VAs. From the distribution, it can be seen that n = 2 was effective in vast majority of cases. Once the initial automatic segmentation is done, the user has the option of manually editing the segmentation by clicking on the image to add or remove particular pixels from the ROI in the case of an obvious error, though this was not required for the results shown in this study. Figure 2(a) and (b) shows the segmentation results on the complex difference and phase image of a particular subject.
(Left subplot) A screen shot of the PC utility developed in MATLAB; (Right subplot) distribution of the value of n (number of standard deviation of noise for setting the threshold to segment the arteries) for carotid and vertebral segmentations. Segmentation in PC (a) complex difference and (b) phase image of a particular subject; (c) velocity profile of the left carotid artery of the same subject. (d) Example of complex difference image of poor quality, (e) corresponding phase image and (f) the velocity profile of the left carotid for the same subject.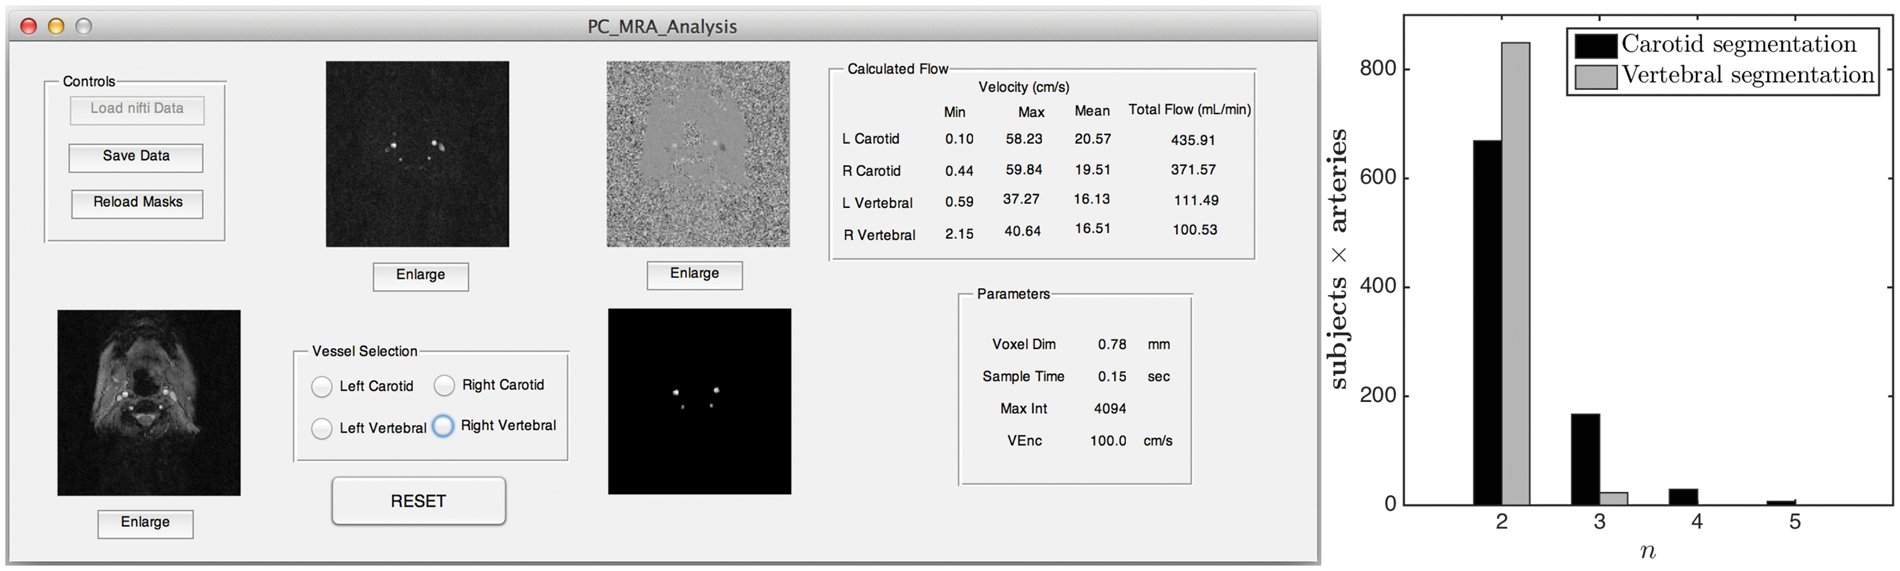
Once the segmentation mask is obtained, the velocity of the blood flow for each of the eight phases at each voxel is obtained as
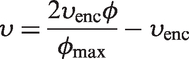
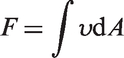
The MATLAB program also can display the velocity profiles for the user to determine whether the flow is laminar or non-laminar. An example of the laminar velocity profile for all the eight phases is shown in Figure 2(c). PC data quality was rated as “good,” “non-laminar,” or “poor” for each artery based on the segmentation masks, VFR values, and visualization of the velocity profiles. We compared velocity histograms for “good,” “non-laminar,” and “poor” flow patterns for both ICAs and VAs and determined that there was no difference in flow distributions between “good” and “non-laminar” patterns (data not shown). Accordingly, both “good” and “non-laminar” ratings were considered as acceptable measures of arterial flow, whereas cases with “poor” flow patterns were removed. The total blood VFR was obtained by adding the individual VFRs through the ICAs and VAs. Subsequently, CBFPC is obtained by dividing the total blood VFR by the product of the brain volume (grey matter and white matter volume) and the brain density (assumed to be 1.06 g/ml 15 ). The brain volume was obtained by the following steps: (i) segmenting the high-resolution T1-weighted 3D MPRAGE data using the “new segment” in SPM8 (Wellcome Department of Imaging Neuroscience, London, UK) to obtain the tissue probability maps (ii) thresholding the sum of the obtained gray matter and white matter tissue probability maps to 0.2 to obtain the brain mask, and finally (iii) multiplying the total number of voxels within the mask by the volume of each voxel.
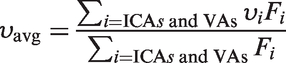
In addition to computing the average CBFPC, the average flow velocity through the four arteries was computed as
Processing of PCASL images
ASL data were processed using ASLtoolbox,
23
which is based on SPM8. The processing consists of first aligning the raw EPI images using a six-parameter rigid body motion spatial transformation. The spurious motion component caused by the systematic label/control alternation was regressed out from the motion parameters using the method in Wang
24
before applying the transformation on the images. This was followed by the removal of residual motion.
24
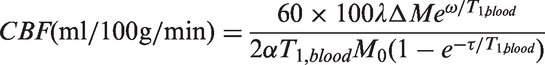
Subsequently, each volume in the time series was smoothed using a isotropic Gaussian kernel with a full-width-half-max (FWHM) = 5 mm. Pairwise subtraction of the resulting images was performed and the difference was converted to absolute CBF measurements using the formula
13,25
(a) Representative CBFPCASL map in the study sample (b) Example of CBFPCASL map of poor quality (shows extensive negative CBF values and high values at the edge of the brain suggestive of motion artifacts).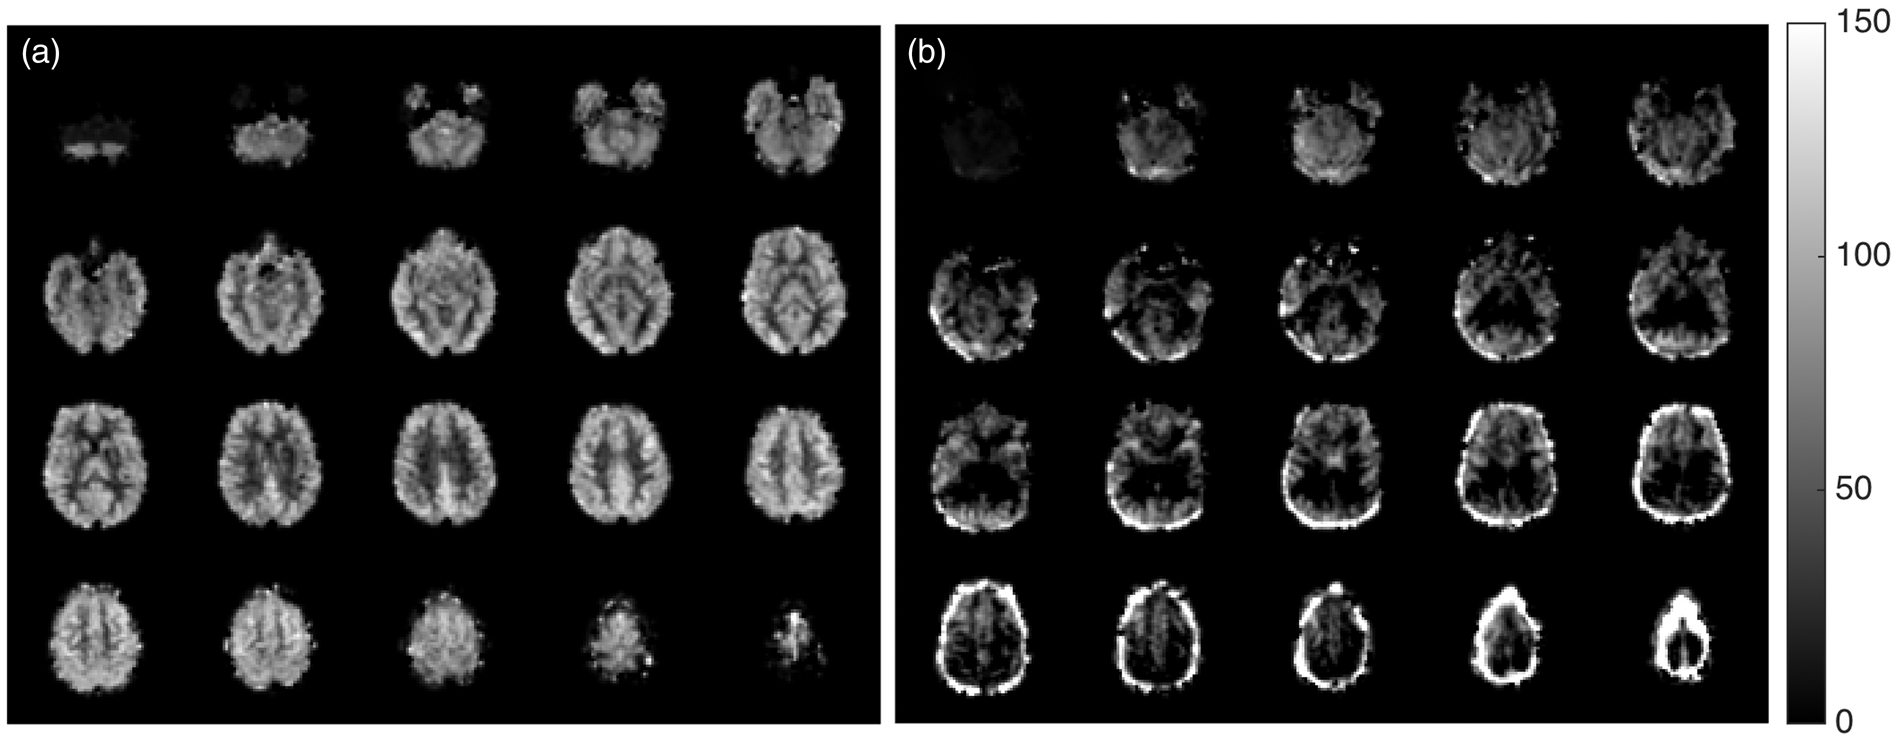
Data QA
PC data from 83 subjects were discarded due to poor flow patterns rendering PC velocities questionable, imaging below the carotid bifurcation (which would include external carotid flow not contributing to CBF), or other artifacts. An example of a complex difference image and the phase image of poor quality and the velocity profile of the left carotid artery corresponding to the same data are shown in Figure 2(d) to (f), respectively. The PCASL mean CBF maps were visually inspected and data from 29 subjects were discarded due to various artifacts. An example of CBFPCASL volume of poor quality is shown in Figure 3(b). Seven subjects had poor quality of both PCASL and PC data, leaving 436 subjects (219 from the Minneapolis site and 217 from the Oakland site) to be considered for the final analysis.
Details of statistical analyses
Statistical analyses were performed to compare and contrast the CBF measurements obtained using PC and PCASL both for the whole cohort and across sites, and also to assess the effect of arterial blood velocity on the labeling efficiency. The descriptive statistics for the different outcomes of the processed data are also reported.
First, we report the descriptive statistics of the measurements for each of PC and PCASL methods relevant to the present study. In the case of PC, we report VFRs as well as the mean and the maximum velocities in ICAs and VAs. The total VFRs in ICAs and VAs were computed by adding the VFRs in the left and right sides. The mean and the maximum velocities within the Carotid and VAs were computed by a weighted average, where the weights were proportional to the VFR through the contributing arteries as mentioned before. The VFR, mean, and maximum velocities were compared between carotid and VAs. In the case of PCASL, we report the mean and standard deviation for global CBF values (CBFPCASL.).
The overall distribution of mean CBFs across the sample was examined to characterize the variability in mean CBF in a healthy study sample and to compare whole-brain CBF across the two independent methods. Their mean values were compared using a paired T test to assess for intermodal differences. CBF variability for each modality was characterized. We also assessed CBF values for each modality for effects of gender and age, which are known modulators of CBF.20,21 Two sample T tests were used to compare the CBF in male and female population for each method and the correlation of CBF with age was also computed. Thereafter, the effects of age and sex were regressed out and the residual variabilities were compared. CBF values obtained using the two methods were then assessed for agreement by visually inspecting their scatter plot and computing the Pearson’s correlation coefficient between the two sets of values. Site effects for both modalities were investigated. Two sample T tests were used to test for differences in mean CBF between the sites for each modality. In addition, F-tests for equality of two variances were used to test for differences in variances between the two sites.
Finally, potential velocity-dependent effects on labeling efficiency were assessed. Following prior work, 15 the ratios of CBFPCASL and CBFPC for individual subjects were considered, though in the present work, CBFPCASL was estimated using an assumed labeling efficiency of 0.85. The ratios for individual subjects were considered as a function of their mean velocities of the arterial blood. To assess for reduced labeling efficiency at increased flow velocities, subjects were divided into two groups based on whether their average flow velocity was less than or greater than 20 cm/s, and two different regression lines for each group were plotted along with computation of their correlation coefficient. This analysis was repeated by replacing the mean velocity with the maximum velocity.
Results
Description of sample
Descriptive statistics of CBFPCASL and CBFPC values from PCASL and PC MRI in the study sample (N = 436).
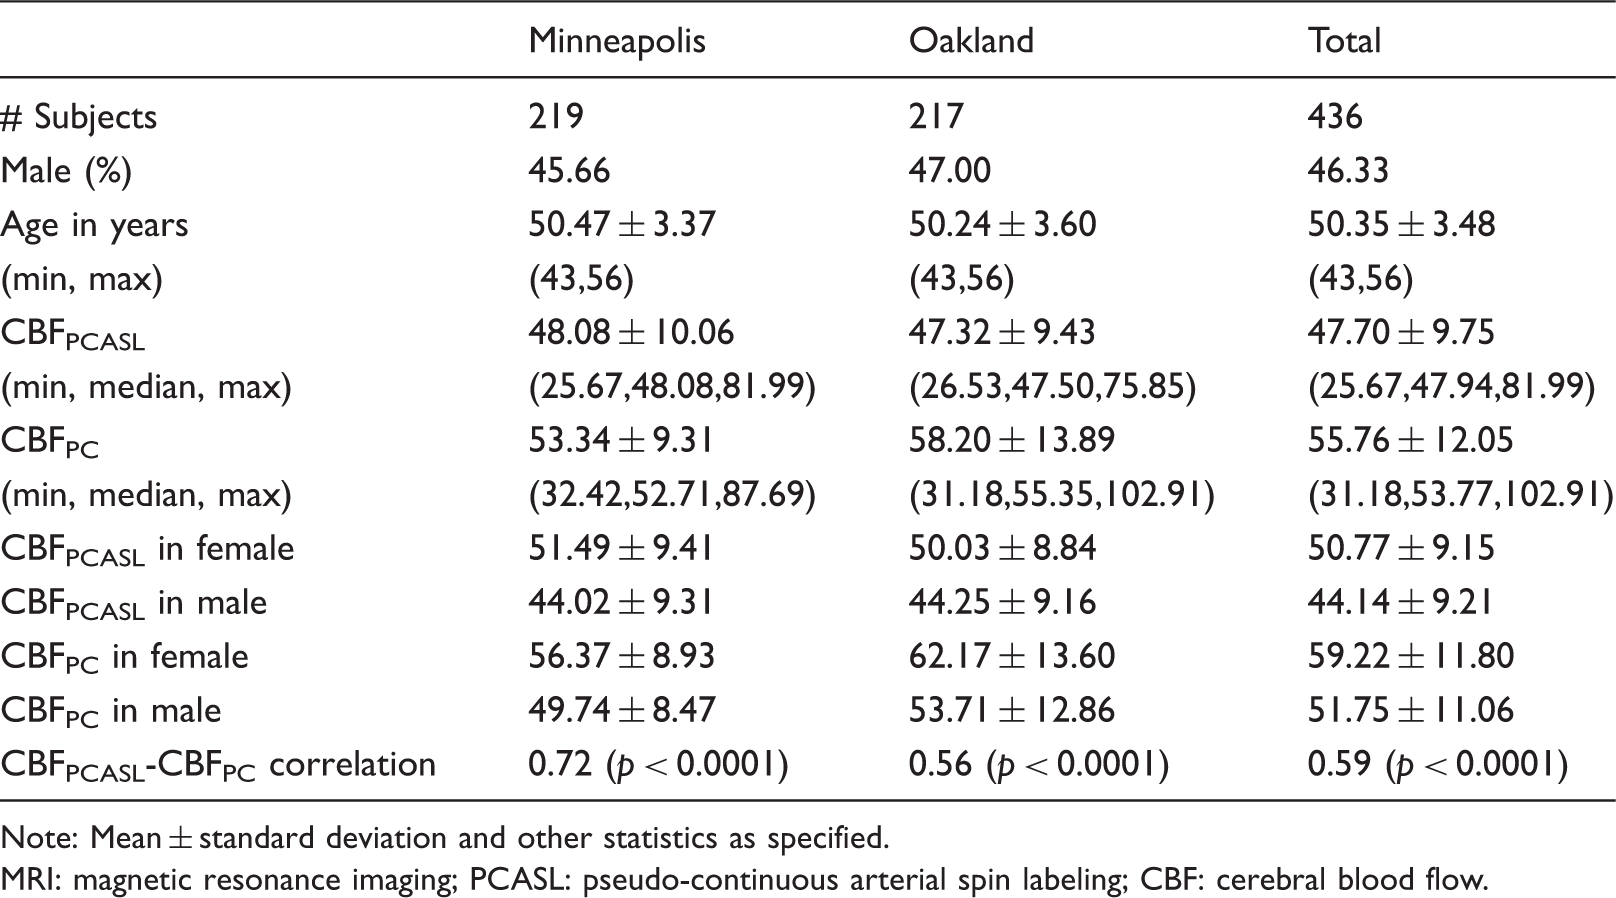
Note: Mean ± standard deviation and other statistics as specified.
MRI: magnetic resonance imaging; PCASL: pseudo-continuous arterial spin labeling; CBF: cerebral blood flow.
Characterization of arterial flow by PC
The VFR in the ICAs (558.04 ± 135.08 ml/min) was significantly higher (paired t = 53.8, p < 0.0001) than that in the VAs (202.81 ± 56.37 ml/min). The same was true for the mean and the maximum velocities. Specifically, ICA mean velocity (18.51 ± 3.72 cm/s) was significantly higher (paired t = 20.1, p < 0.001) than the VA mean velocity (14.10 ± 2.86 cm/s), and the ICA maximum velocity (31.70 ± 7.29 cm/s) was significantly higher (paired t = 20.5, p < 0.0001) than the VA maximum velocity (21.98 ± 5.19 cm/s). Standard deviations for ICA flow and velocities were generally higher than the VA. ICA and VA VFRs correlated weakly but significantly (r = 0.16, p = 0.0007), but no such correlation was observed between their velocities. The average brain volume for the cohort was 1297.86 ± 141.12 cc.
Characterization of CBF measurements by each modality
Across the study sample, average CBFPCASL was 47.70 ± 9.75 ml/100 g/min (Table 1). PC showed a higher average global CBF value of 55.76 ± 12.05 ml/100 g/min (t = 16.6, p < 0.0001) compared to CBFPCASL. The left subplot of Figure 4 shows the distribution of CBF values obtained using each method. From Figure 4 and Table 1, it can be seen that both methods demonstrate a wide range of CBF values. The range is larger in PC as compared to PCASL. The correlation between CBFPCASL and CBFPC was 0.59 (p < 0.00001). A scatter plot showing CBFPCASL versus CBFPC is displayed in the right subplot of Figure 4. For reference, the unity line is also shown on the same plot. CBFPC tended to be higher than CBFPCASL values for most of the subjects.
(Left subplot) Histogram of average CBFPCASL and CBFPC values (Right subplot) Scatter plot of CBFPCASL and CBFPC (Pearson's correlation coefficient: 0.59) in individual subjects along with the unity line.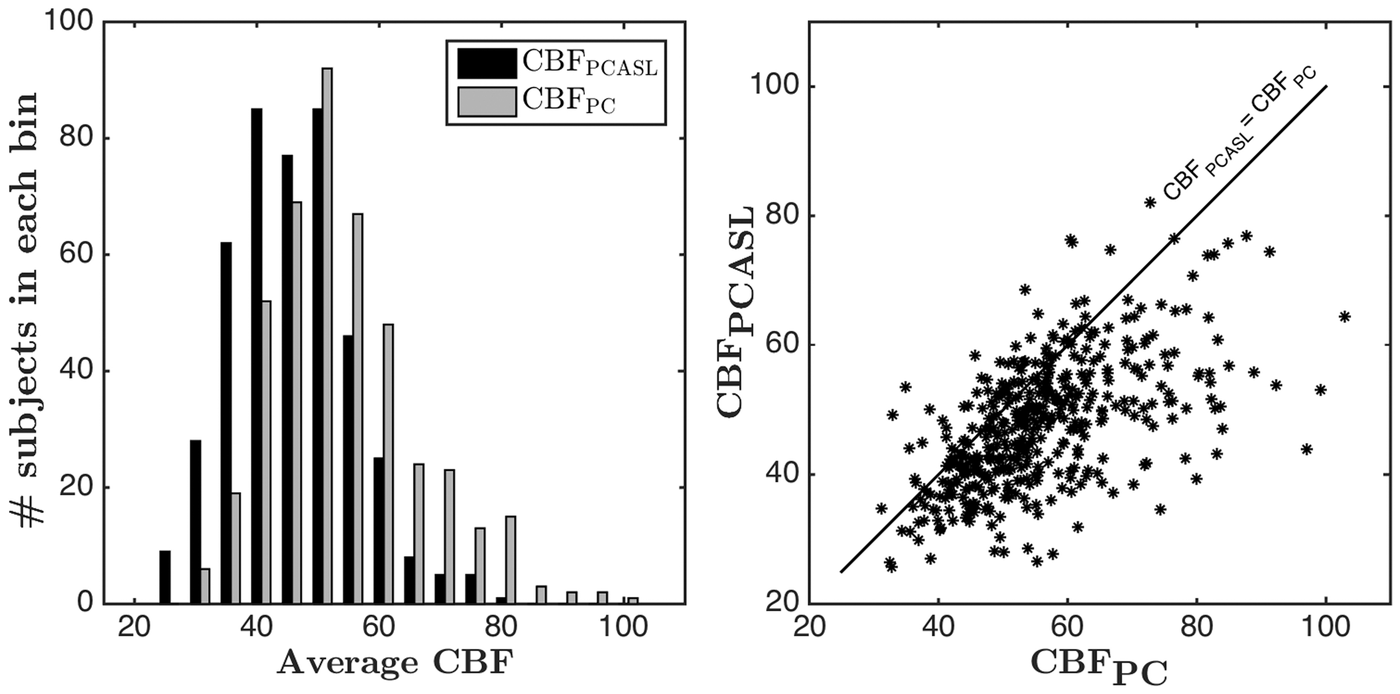
The mean CBFPCASL in females was significantly higher (t = 7.53, p < 0.0001) than that of the males (Table 1). The mean CBFPC in females was also significantly higher (t = 6.79, p < 0.0001) than in males. The correlation between CBFPCASL and age was −0.13 (p = 0.005), similar to the correlation for CBFPC with age: −0.11 (p = 0.021). We also assessed the residual variability in CBF values after regressing out the effect of age and sex, which have known associations with variability in CBF. The standard deviation decreased from 9.74 to 9.08 ml/100 g/min in the case of CBFPCASL and from 12.05 to 11.39 ml/100 g/min in the case of CBFPC.
Site effects for each modality
All data were acquired at one of two sites with identical scanning hardware. Table 1 shows the descriptive statistics for Minneapolis and Oakland sites. Sample size, age, and sex distribution were well matched across the sites. A graphical representation of site effects is shown in Figure 5. The top two subplots of Figure 5 show the histograms of CBFPCASL and CBFPC for the Minneapolis and Oakland sites, respectively. In both cases, CBFPC is shifted towards the right, though this effect is more prominent in the Oakland site. Variability between the two modalities is also more noticeable in the Oakland site compared to the Minneapolis site. The same conclusions can also be derived from Table 1. The bottom two subplots of Figure 5 show cross-site comparison of histograms of CBFPCASL and CBFPC, respectively. The CBFPC distribution corresponding to the Oakland site is shifted towards right and shows a higher range. On the other hand, CBFPCASL distributions are mostly overlapping. Statistically, CBFPC was significantly higher (t = 4.29, p < 0.0001) and more variable, with F (216 and 218 df) = 2.23, p < 0.00001, in the Oakland site than in the Minneapolis site. On the other hand, no significant differences in means and variances of CBFPCASL were found between the two sites. The correlations between CBFPCASL and CBFPC in the two sites were found to be 0.72 and 0.56, respectively, both of them being statistically significant (p < 0.0001).
(Top subplots) PCASL versus PC CBF comparison in (top left) Minneapolis and (top right) Oakland sites (Bottom subplots) Cross-site comparison of (bottom left) CBFPCASL and (bottom right) CBFPC.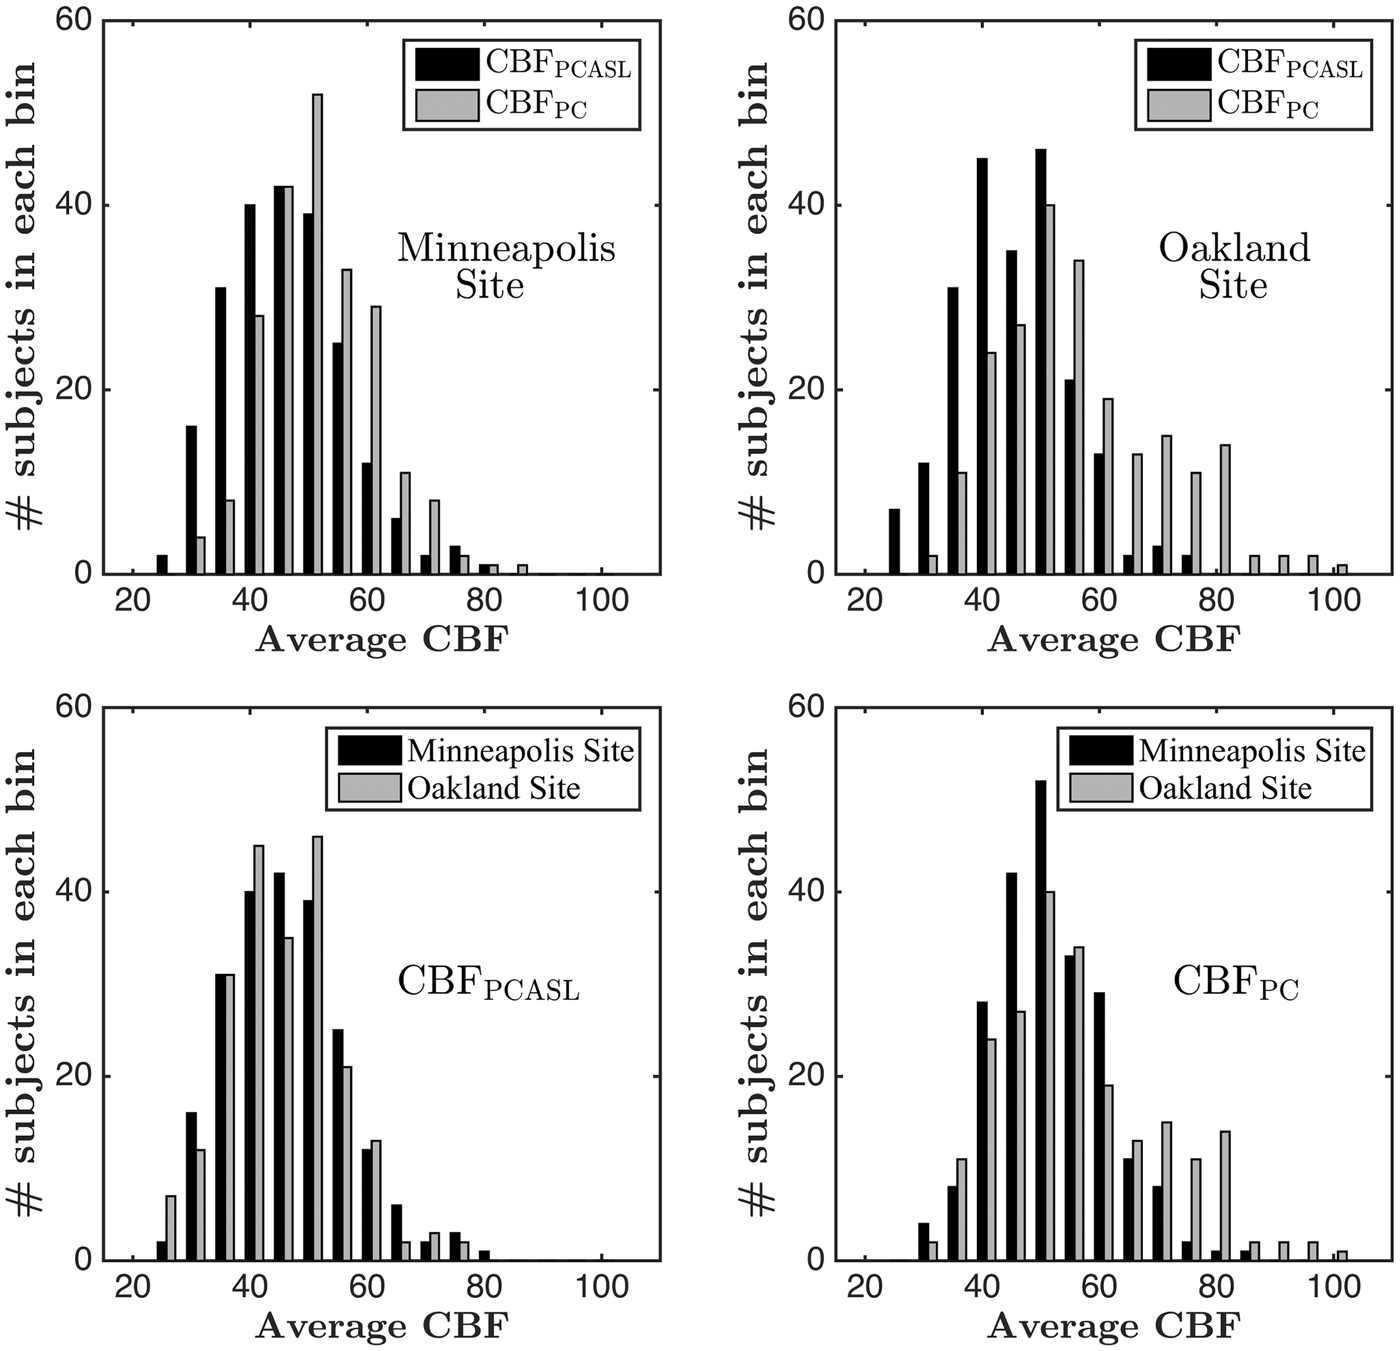
Velocity-dependent effects on PCASL labeling efficiency
The left subplot of Figure 6 shows a scatter plot of the ratio of CBFPCASL and CBFPC versus the mean velocity of the arterial blood. The points are divided into two subgroups, one with average flow velocity less than 20 cm/s (shown by asterisks) and the other with greater than 20 cm/s (shown by circles). The regression lines for the two subgroups are plotted with solid and dotted lines respectively. The slopes of the two regression lines are almost the same for the two velocities, suggesting that PCASL labeling efficiency, as assessed by comparison with CBFPCASL with CBFPC, does not decrease with increase in mean flow velocity. The correlation in each case was slightly positive, though not statistically significant. However, the correlation for the whole data set was weakly but significantly positive (r = 0.13, p = 0.007). For further verification, the right subplot of Figure 6 shows the scatter plot of the ratio of the CBF values versus the maximum velocity along with the regression line for the whole data set. The slope of the line is positive, but there was no statistically significant correlation (r = 0.09, p > 0.05) between the two variables.
(Left subplot) Scatter plot of the ratio of CBFPCASL and CBFPC with respect to mean flow velocity. The asterisks corresponds to υ < 20 cm/s and the circles correspond to υ > 20 cm/s. The solid and the dotted lines show fits corresponding to υ < 20 cm/s and υ > 20 cm/s, respectively. The fit corresponding to the complete data set is 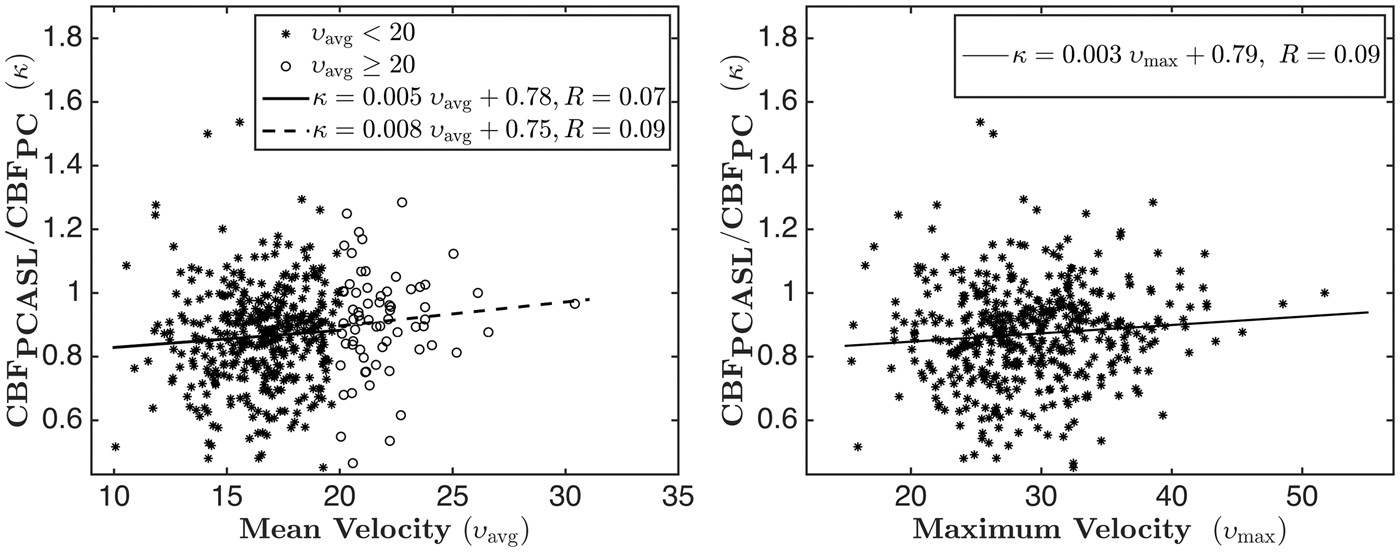
Discussion
In a large sample of middle-aged subjects, mean global CBF values by both PCASL and PC were close to the accepted value of 50 ml/100 g/min, but demonstrated a wide range from ∼25 ml/100 g/min to ∼100 ml/100 g/min. Since the range of variation was consistent across two differing modalities with a highly significant correlation different modalities and remained large after regressing out effects of age and sex, which are known moderators of CBF, the observed distribution in CBF across the cohort is most likely physiological rather than primarily reflecting measurement artifacts. Further research will be needed to elucidate the biological bases for individual differences in CBF, which likely reflect a range of genotype, phenotype, and state-dependent effects.
On a group level, the correlation of the two CBF measurements was found to be substantial. However, for a fixed value of CBF from one modality, the range of CBF values of the other modality was large. On an average about 34% of the CBFPCASL variance could be explained by the CBFPC, but a large amount of residual variability (∼66%) remains. In the case of PCASL as implemented in this study, a variety of potential sources of variability can be considered. Variations in labeling efficiency may have occurred due to the variable location of the labeling plane relative to the arterial tree, since this study used a fixed labeling location relative to the imaging volume. In addition, CBFPCASL quantification using the modified single compartment model is dependent on the T1 of blood. 11 This study used a literature value for blood T1, 26 but blood T1 is known to vary as a function of hematocrit and oxygen saturation. 27 A 10% variability in T1 leads to about 11–15% variability in CBF measurements keeping the other parameters fixed. Quantification of mean CBF is also dependent on the segmentation of the T1 scans into different tissue classes and on the coregistration of these segmentations to the functional space. Although, the “new segment” algorithm of SPM8 has been shown to provide reliable segmentation accuracy on an average, 28 significant challenges exist on an individual subject level because of individual differences in brain structure. The coregistration process is also prone to errors. 29
The CBF quantification for individual subjects using PC is dependent on the accuracy of the segmentation of the arteries, errors inherent to the PC MRI techniques, and the estimation of the total brain volume. Segmentation of the arteries was often challenging when the flow was highly non-laminar or the scan was taken at an oblique angle, and in many cases PC data were deemed unusable. Partial volume effects in PC can cause significant errors in estimation of VFR as reported in prior literatures.30–32 Other sources of errors in the PC acquisition include mismatch of encoding velocity compared to the true velocity or significant deviations of the imaging plane from orthogonal to the direction of flow. 33 The estimation of total brain volume is also dependent on automatic segmentation algorithm, similar to that used for PCASL quantification. Finally, although CBF is thought to be maintained at a relatively constant value over a wide range of perfusion pressure (by a phenomenon known as cerebral autoregulation), 34 technologies such as transcranial Doppler ultrasonography (TCD) 35 and laser Doppler flowmetry, 36 which allow flow measurements at high-temporal resolution, demonstrate that there are significant variations of the CBF around these steady state values. 37 For this study, the PC scans were acquired from only eight phases within a cardiac cycle. Additional signal averaging of PC data might have offset any effects of cardiac pulsation on PC CBF. In PCASL, effects of cardiac noise are attenuated by repeated signal averaging for labeling durations that are greater than the R–R interval. 38 Future studies comparing these modalities with the availability of a “gold-standard” measure of CBF would be helpful. At the moment 15 O-PET is considered as a “gold-standard” and there are few small-scale studies that have shown good agreement between ASL and 15 O-PET CBF values,39–41 but it would be desirable to have this comparison for a larger sample size with all three methods considered together.
CBF values obtained using PC were found to be significantly higher than those obtained using PCASL. This systematic difference could be due to either overestimation of CBF by PC due to partial volume effects, underestimation of CBF in PCASL MRI due to not achieving a labeling efficiency of 0.85, or some combination of these effects. It has been reported in prior literature30,31 that partial volume effects can lead to significant overestimation of VFR in PC. On the other hand, use of α = 0.73 rather than α = 0.85 (as recommended in Alsop et al. 13 ) would result in equal means of the distribution of the CBF values obtained using both the methods and would suggest that the PCASL labeling efficiency achieved in a large multisite study such as CARDIA may be somewhat lower than is typically assumed. The restriction of the segmented masks of the blood vessels to only those voxels in which the velocity values are positive also results in overestimation of blood flow, though this effect is expected to be small. PC MRI derives mean CBF by dividing total arterial flow by the brain volume measured using structural MRI, while in PCASL MRI, CBF is measured directly at the voxel level and then brain voxels are averaged to derive mean CBF. Differences in volume coverage of the brain could explain some of the variability between PC MRI and ASL MRI, but would not be expected to bias the difference in a systematic way. Incorrect assumptions for the values of other model parameters (e.g. average brain density, T1 of blood and blood:brain partition coefficient) can also contribute to a systematic difference. Because the labeling efficiency α enters the formula for CBF as a proportionality constant, correlations of other variables with CBF would be identical whether PCASL or PC is used, if α were the only factor that caused the two estimates to differ. However, correlations would differ between the two methods for categorical representations of CBF, such as the percentage with low CBF (which will be higher for CBFPCASL than for CBFPC).
CBF measured using PC was found to be higher and more variable in the Oakland site than in the Minneapolis site, though there were no significant site differences in any of the demographics or acquisition parameters. We currently do not have an explanation for the site effects seen in CBFPC. On the other hand, no site differences were observed for CBFPCASL. Because CBFPCASL is derived from the difference between scans acquired with and without labeling, it is relatively resistant to biophysical effects that can affect quantification in other modalities. In addition, the PCASL labeling scheme was designed to be insensitive to the possible variability in velocity, B0 or B1 field. The observed site effects with PC also degraded the correlation between CBFPCASL and CBFPC in the Oakland site compared to the Minneapolis site.
We examined the ratio CBFPCASL/CBFPC as a function of the mean arterial flow velocity and did not find any evidence that the ratio decreases with increase in the flow velocity within this velocity range as has previously been reported. 15 Similar results were obtained when the mean velocity was replaced by the maximum arterial velocity. Indeed, we observed a subtle positive correlation indicating an increase in the labeling efficiency for increasing velocities, though this correlation was significant only for the mean velocity when the whole data set was considered. It should be noted that the maximum velocity is less sensitive to the errors in segmenting the arteries, as the voxel having the highest velocity is highly likely to fall within the segmented ROI for each artery. This trend of slight decrease in labeling efficiency for smaller velocities within this velocity range is consistent with the simulation results reported in Dai et al. 14 Discrepancies between our findings and the results reported in Aslan et al. 15 may be at least partly attributed to the fact that Aslan et al. 15 examined data acquired under both normocarbia and hypercarbia, whereas the current study reflects only normocarbia, though the velocity ranges were comparable. Discrepancies between findings may also have resulted from slightly different locations for the labeling plane and the PC MRI plane in the two studies. Finally, the conclusions in Aslan et al. 15 were derived from a small sample (26 measurements), which can be biased by significant variability present in each modality as evidenced from our data. In summary, the data analyzed in the present study from a very large cohort do not support the conclusion that there is a significant velocity-dependent reduction in PCASL labeling efficiency, at least under normocapnia.
Although several studies, including our own,19,22 have used CBFPC as a means of calibrating PCASL labeling efficiency, the findings of the current study do not support this practice, at least for the specific PC methodology used. Most of the variability of the CBFPCASL in the present study could not be explained by CBFPC, and CBFPC measurements were found to be more variable than CBFPCASL measurements. While sex and age correlations in CBF consistent with prior reports33,34 were observed in both PCASL and PC data, PCASL demonstrated similar but numerically higher correlations between CBF and sex or age than did PC, suggesting that PCASL measures might be more accurate. In addition, prior studies demonstrate that reproducibility in whole-brain CBF values using PC with repeated measurements 16 is a bit poorer than that reported for gray matter CBF using PCASL with repeated measurements. 42 PC also demonstrated significant site effects while PCASL did not. Finally, Figure 4(b) demonstrates that for a fixed value of CBF obtained using one modality, the other modality can demonstrate 2–3 fold differences in CBF values. Such differences are unlikely to reflect variations in PCASL labeling efficiency and are most likely attributed to simultaneous variability in both the methods.
This study was based on PCASL and PC data acquired as part of a multimodal neuroimaging protocol included in the CARDIA Year 25 dataset. Both PCASL and PC were successfully obtained in a large fraction of the subjects scanned. However, this scanning protocol also had technical limitations. Firstly, no time of flight angiogram was performed to visualize the ICAs and VAs for optimal placement of either the PCASL labeling plane or the PC imaging plane. Doing so might have reduced variability in PCASL labeling efficiency and increased the accuracy and yield of CBFPC measurements. CBFPC accuracy can further be improved by measuring flow in three directions since it is generally difficult to have all the arteries perpendicular to the imaging plane. Labeling efficiency in PCASL can also be further optimized by accounting for magnetic field shifts at the labeling plane, 43 though this procedure is time consuming. Secondly, while PCASL data were signal averaged over several minutes, PC data were acquired over approximately one minute. Additional signal acquisition and averaging might improve the reliability of the CBFPC measurements. Thirdly, CBFPCASL modeling utilized a modified single compartment model with a single post-labeling delay and an assumed value for blood T1 as was recently recommended for clinical applications. 13 More complex modeling incorporating arterial transit time, blood and brain compartments, brain T1 mapping, and blood sampling for hematocrit might have further increased the accuracy of CBFPCASL. No large multisite study to date has achieved this level of complexity in MRI CBF measurement, but a precedent for achieving both high throughput and high-complexity scanning is now being set by the Human Connectome Project.
In conclusion, CBF is found to have high inter-subject variation across a large cohort of middle-aged subjects representative of the general population, and this variability was confirmed by both modalities. Although CBF values were highly significantly correlated between modalities, over half of the observed method variance was not explained, illustrating that both methods are noisy at the level of individual subject measurements. Although the notion of using PC to calibrate PCASL MRI is appealing, the present data do not support this practice as a means of increasing the accuracy of CBFPCASL estimation.
Footnotes
Funding
The Coronary Artery Risk Development in Young Adults Study (CARDIA) is supported by contracts HHSN268201300025C, HHSN268201300026C, HHSN268201300027C, HHSN268201300028C, HHSN268201300029C, and HHSN268200900041C from the National Heart, Lung, and Blood Institute and the Intramural Research Program of the National Institute on Aging. This study was further supported by grants from the National Institutes of Health, namely EB015893, MH080729. .
Acknowledgements
The authors would like to acknowledge Alex Smith for her help in data processing and Dr. Kiang Liu for his valuable comments.
Declaration of conflicting interests
The author(s) declared no potential conflicts of interest with respect to the research, authorship, and/or publication of this article.
Authors’ contributions
Sudipto Dolui: Processed ASL data, developed PC-MRI analysis utility, compiled the results and prepared the manuscript. Ze Wang: Processed ASL data, provided support for ASLtoolbox, critical review of manuscript. Danny JJ Wang: Developed ASL sequence and the design for comparison with PC MRI, critical review of manuscript. Raghav Mattay: Segmented the arteries in PC-MRI scans. Mack Finkel: Did preliminary analysis of PC-MRI scans. Mark Elliott: Implemented scanning protocols. Lisa Desiderio: Data coordination. Ben Inglis: MRI field site coordinator. Bryon Mueller: MRI field site coordinator. Randall B Stafford: Did preliminary analysis of PC-MRI scans, created PC-MRI analysis GUI prototype. Lenore J Launer: Designed and obtained funding for the CARDIA Brain MRI Sub-study, critical review of manuscript. David R Jacobs Jr: Participated in data analysis, critical review of manuscript. R Nick Bryan: Supervised data acquisition, participated in data analysis, critical review of manuscript. John A. Detre: Supervised methods, analysis, and manuscript preparation.