
Abstract
We aimed to explore the morphological evolution of recent small subcortical infarcts (RSSIs) over 15 months. Moreover, we hypothesized that quantitative lesion apparent diffusion coefficient (ADC) values and serum neurofilament light (NfL) levels predict subsequent lacunar cavitation. We prospectively studied 78 RSSI patients, who underwent pre-defined follow-up investigations three and 15 months poststroke using 3 T MRI including high-resolution T1 sequences. To identify potential predictors of cavitation, we determined RSSI size and quantitative ADC values, and serum NfL using the SIMOA technique. The majority of RSSIs showed cavitation at three months (n = 61, 78%) with only minimal changes regarding cavitation status thereafter. The maximum axial lacunar diameter decreased from 8 mm at three to 7 mm at 15 months (p < 0.05). RSSIs which cavitated had lower lesional ADC values and were associated with higher baseline NfL levels compared to those without cavitation, but did not differ regarding lesion size. In logistic regression analysis, only baseline NfL levels predicted cavitation (p = 0.017). In this prospective study using predefined high-resolution MRI protocols, the majority of RSSIs evolved into lacunes during the first three months poststroke with not much change thereafter. Serum NfL seems to be a promising biomarker for more advanced subsequent tissue destruction in RSSIs.
Keywords
Introduction
The presumed evolution of recent small subcortical infarcts (RSSIs) into lacunes, i.e. small CSF-containing holes, has led to the term of lacunar infarction based on careful histopathologic examinations. 1 However, with the possibility of neuroimaging follow-up, it became apparent that RSSIs do not always evolve into lacunes but can remain as mainly non-cavitated white matter hyperintensities (WMH) or even disappear after several weeks or months. This notion is important for several reasons, including the impact on possible differences in tissue vulnerability and repair, and a possible underestimation of brain tissue loss from previous RSSIs on cross-sectional imaging. Studies to date report a wide range of RSSIs that actually undergo cavitation including lacune formation.2–6 Major factors contributing to this large variability appear to be the use of different neuroimaging techniques, differences in follow-up time, and differences in definition of “lacune formation”. Thus, the timeline of RSSI cavitation or other fate, and stability thereafter, remains unclear.
In addition, it would help to understand the causes and mechanisms that determine the morphologic evolution of an RSSI. Diffusion weighted imaging (DWI) appears promising to predict lesion evolution, as it allows detection of ischemic tissue changes in a quantitative manner and more pronounced DWI abnormalities might be indicative of a greater likelihood of complete tissue destruction.7,8 Furthermore, the neurofilament light chain protein (NfL) – a marker of neuroaxonal damage – could be an interesting biomarker in this field as serum NfL levels correlated with the occurrence of new clinically silent cerebral small disease-related MRI changes in a longitudinal study of patients with RSSIs. 9
To add information on these points, we have analyzed the data from a prospective study of patients with an RSSI related to cerebral small vessel disease (CSVD). Among other investigations, these individuals underwent baseline and pre-defined MRI follow-up investigations at 3 and 15 months after stroke, which allowed assessment of the medium- and long-term morphologic fate of the RSSIs in a standardized fashion. We also hypothesized that larger RSSI size, lower quantitative apparent diffusion coefficient (ADC) values in the RSSI, and higher serum NfL levels at baseline would be associated with a higher likelihood for subsequent lacunar cavitation.
Material and methods
Patients
Starting in May 2012, we invited all consecutive acute stroke patients who were admitted to our primary and tertiary care university hospital to participate in a prospective lacunar stroke study if they were ≤75 years of age and diffusion MRI had shown a single RSSI that was compatible with the clinical stroke symptoms and located in the supply area of a small perforating brain artery. While 20 mm is generally regarded as the maximal axial RSSI diameter, we expanded the upper size limit to 25 mm for this study as some RSSIs have larger diameters in the very acute phase. Evidence for other acute brain infarcts, preexisting disability (modified Rankin Scale score >1), and contraindications for repeated MRI were defined as further exclusion criteria. 9
Patients underwent a thorough neurological examination and cerebrovascular workup including ECG, 24 h-ECG, echocardiography and duplex sonography of brain-supplying vessels, plus blood sampling and brain MRI at baseline and at three and 15 months after stroke as previously reported. 9 All patients received acute stroke treatment and secondary prevention according to standard clinical practice.
Brain MRI acquisition and analysis
At baseline, all study patients underwent brain MRI at 1.5 Tesla (Siemens MAGNETOM Espree, Siemens Healthcare, Erlangen; Germany) according to a standard protocol 9 for the clinical workup of patients with suspected cerebrovascular events. This included an axial T2-weighted fast spin echo sequence (0.5 × 0.5 ×5 mm), an axial fluid-attenuated inversion recovery (FLAIR) sequence (0.4 × 0.4 × 5 mm), a sagittal T1-weighted spin echo sequence (0.6 × 0.6 × 5 mm), a gradient echo T2* weighted sequence (0.4 × 0.4 ×5 mm), an axial diffusion-weighted (DWI) single-shot echo planar imaging sequence (1.2 × 1.2 × 5 mm) with apparent diffusion coefficient (ADC) maps and a 3D time of flight (TOF) angiography. All axial scans had a slice thickness of 5 mm with 0.5 mm gap.
At both follow-ups, brain MRI was performed on a 3 Tesla TimTrio or Prisma scanner (Siemens Healthcare, Erlangen, Germany). The protocol included high-resolution structural 3D images by means of a T1-weighted MPRAGE sequence with 1mm isotropic resolution (no gap), T2-weighted (0.8 × 0.8 × 3 mm, no gap), and FLAIR sequences (0.8 × 0.8 × 3 mm, no gap), gradient echo T2* weighted scans (0.8 × 0.8 × 2 mm, no gap), and DWI (2 × 2 × 2.5 mm, no gap) and intracranial 3D-TOF images.
All MRI scans were reviewed by a neuroradiological expert (CE) according to the STandards for ReportIng Vascular changes on nEuroimaging (STRIVE). 10 Besides assessing the location and size of the RSSI, all MRI scans were rated for WMH severity, 11 lacunes of presumably vascular origin, old cortical infarcts, microbleeds, old parenchymal hemorrhages, large vessel pathologies or other concomitant intracranial lesions 12 blinded to the clinical findings. On follow-up MRI scans (FLAIR, T2- and T1-weighted sequences), the investigator specifically described the evolution of the baseline RSSI (i.e. cavitation to a lacune, WMH, or absent/“almost vanished” lesion). 10 A lacune was defined as a cavitated lesion with a consistent CSF signal intensity on T1, T2 and FLAIR weighted MRI scans. Hyperintense lesions in the subcortical grey matter or brainstem were also categorized as WMH if no lacunar cavitation was noted. Lesions that showed very subtle tissue changes and would not have been noted without co-registration were defined as “almost vanished”. Maximal axial lesion diameters were computed on DWI sequences for the RSSI and on T1-weighted images for the respective lacunar lesions. All ratings and measurements were performed on a dedicated radiological PACS workstation including co-registration.
For quantification of the DWI changes of the RSSI on the baseline MRI, we used a semi-manual region of interest (ROI) approach to outline the RSSI and calculate its mean ADC. For comparison we identified a matching ROI located in the contralateral hemisphere and same anatomical structure to calculate a corresponding “control” mean ADC. When identifying this control ROI, care was taken to avoid areas of coexisting morphologic damage including WMH.
Serum neurofilament assessment
For assessing neurofilament levels in serum, eight millilitres of peripheral blood was taken by venipuncture within 11 days after the index RSSI (median time from stroke symptom onset to blood sampling: four days, range: 1–11 days) and at 3 and 15 months of follow-up. Serum was then immediately stored at −80℃ according to international consensus guidelines. 13 A Single Molecule Array (Simoa) assay served to measure serum NfL as described in more detail elsewhere. 14
Statistical analysis
Demographic and clinical data, ADC values, and NfL levels were analyzed with the Statistical Package of Social Science (IBM SPSS Statistics 23). The level of significance was set at 0.05. The Kolmogorov–Smirnov test assessed normality of data distribution. Groups were compared by the Chi-Square test (for nominal data), the Mann–Whitney U test (for non-normally distributed variables), or unpaired t-test (for continuous, normally distributed variables). Correlation analysis was performed using the Spearman or Pearson correlation. A hierarchical logistic regression analysis was performed to identify baseline markers associated with cavitation, controlling for age, sex, the interval from stroke symptom onset to MRI assessment at baseline and time from stroke symptom onset to baseline blood sampling in the first step and including baseline markers (RSSI diameter on DWI, baseline ADC values and NfL levels) in the second step.
To control for possible effects of small vessel disease, we performed additional analysis adding deep and periventricular WMH in the second step of the model.
Research ethics and patient consent
The study was approved by the ethics committee of the Medical University of Graz (ID: 24–260 ex 11/12), and conducted in accordance with the Declaration of Helsinki. All patients gave written informed consent. Other results from this study cohort on cross-sectional and longitudinal NfL levels, and their association with the occurrence of new cerebral small vessel disease related lesions on follow-up MRI have recently been reported elsewhere. 9
Results
Demographic, clinical and MRI characteristics of the total cohort of RSSI patients at baseline (n = 78), and comparisons regarding these variables in patients with available follow-up MRI at three months according to cavitation status (n = 74).
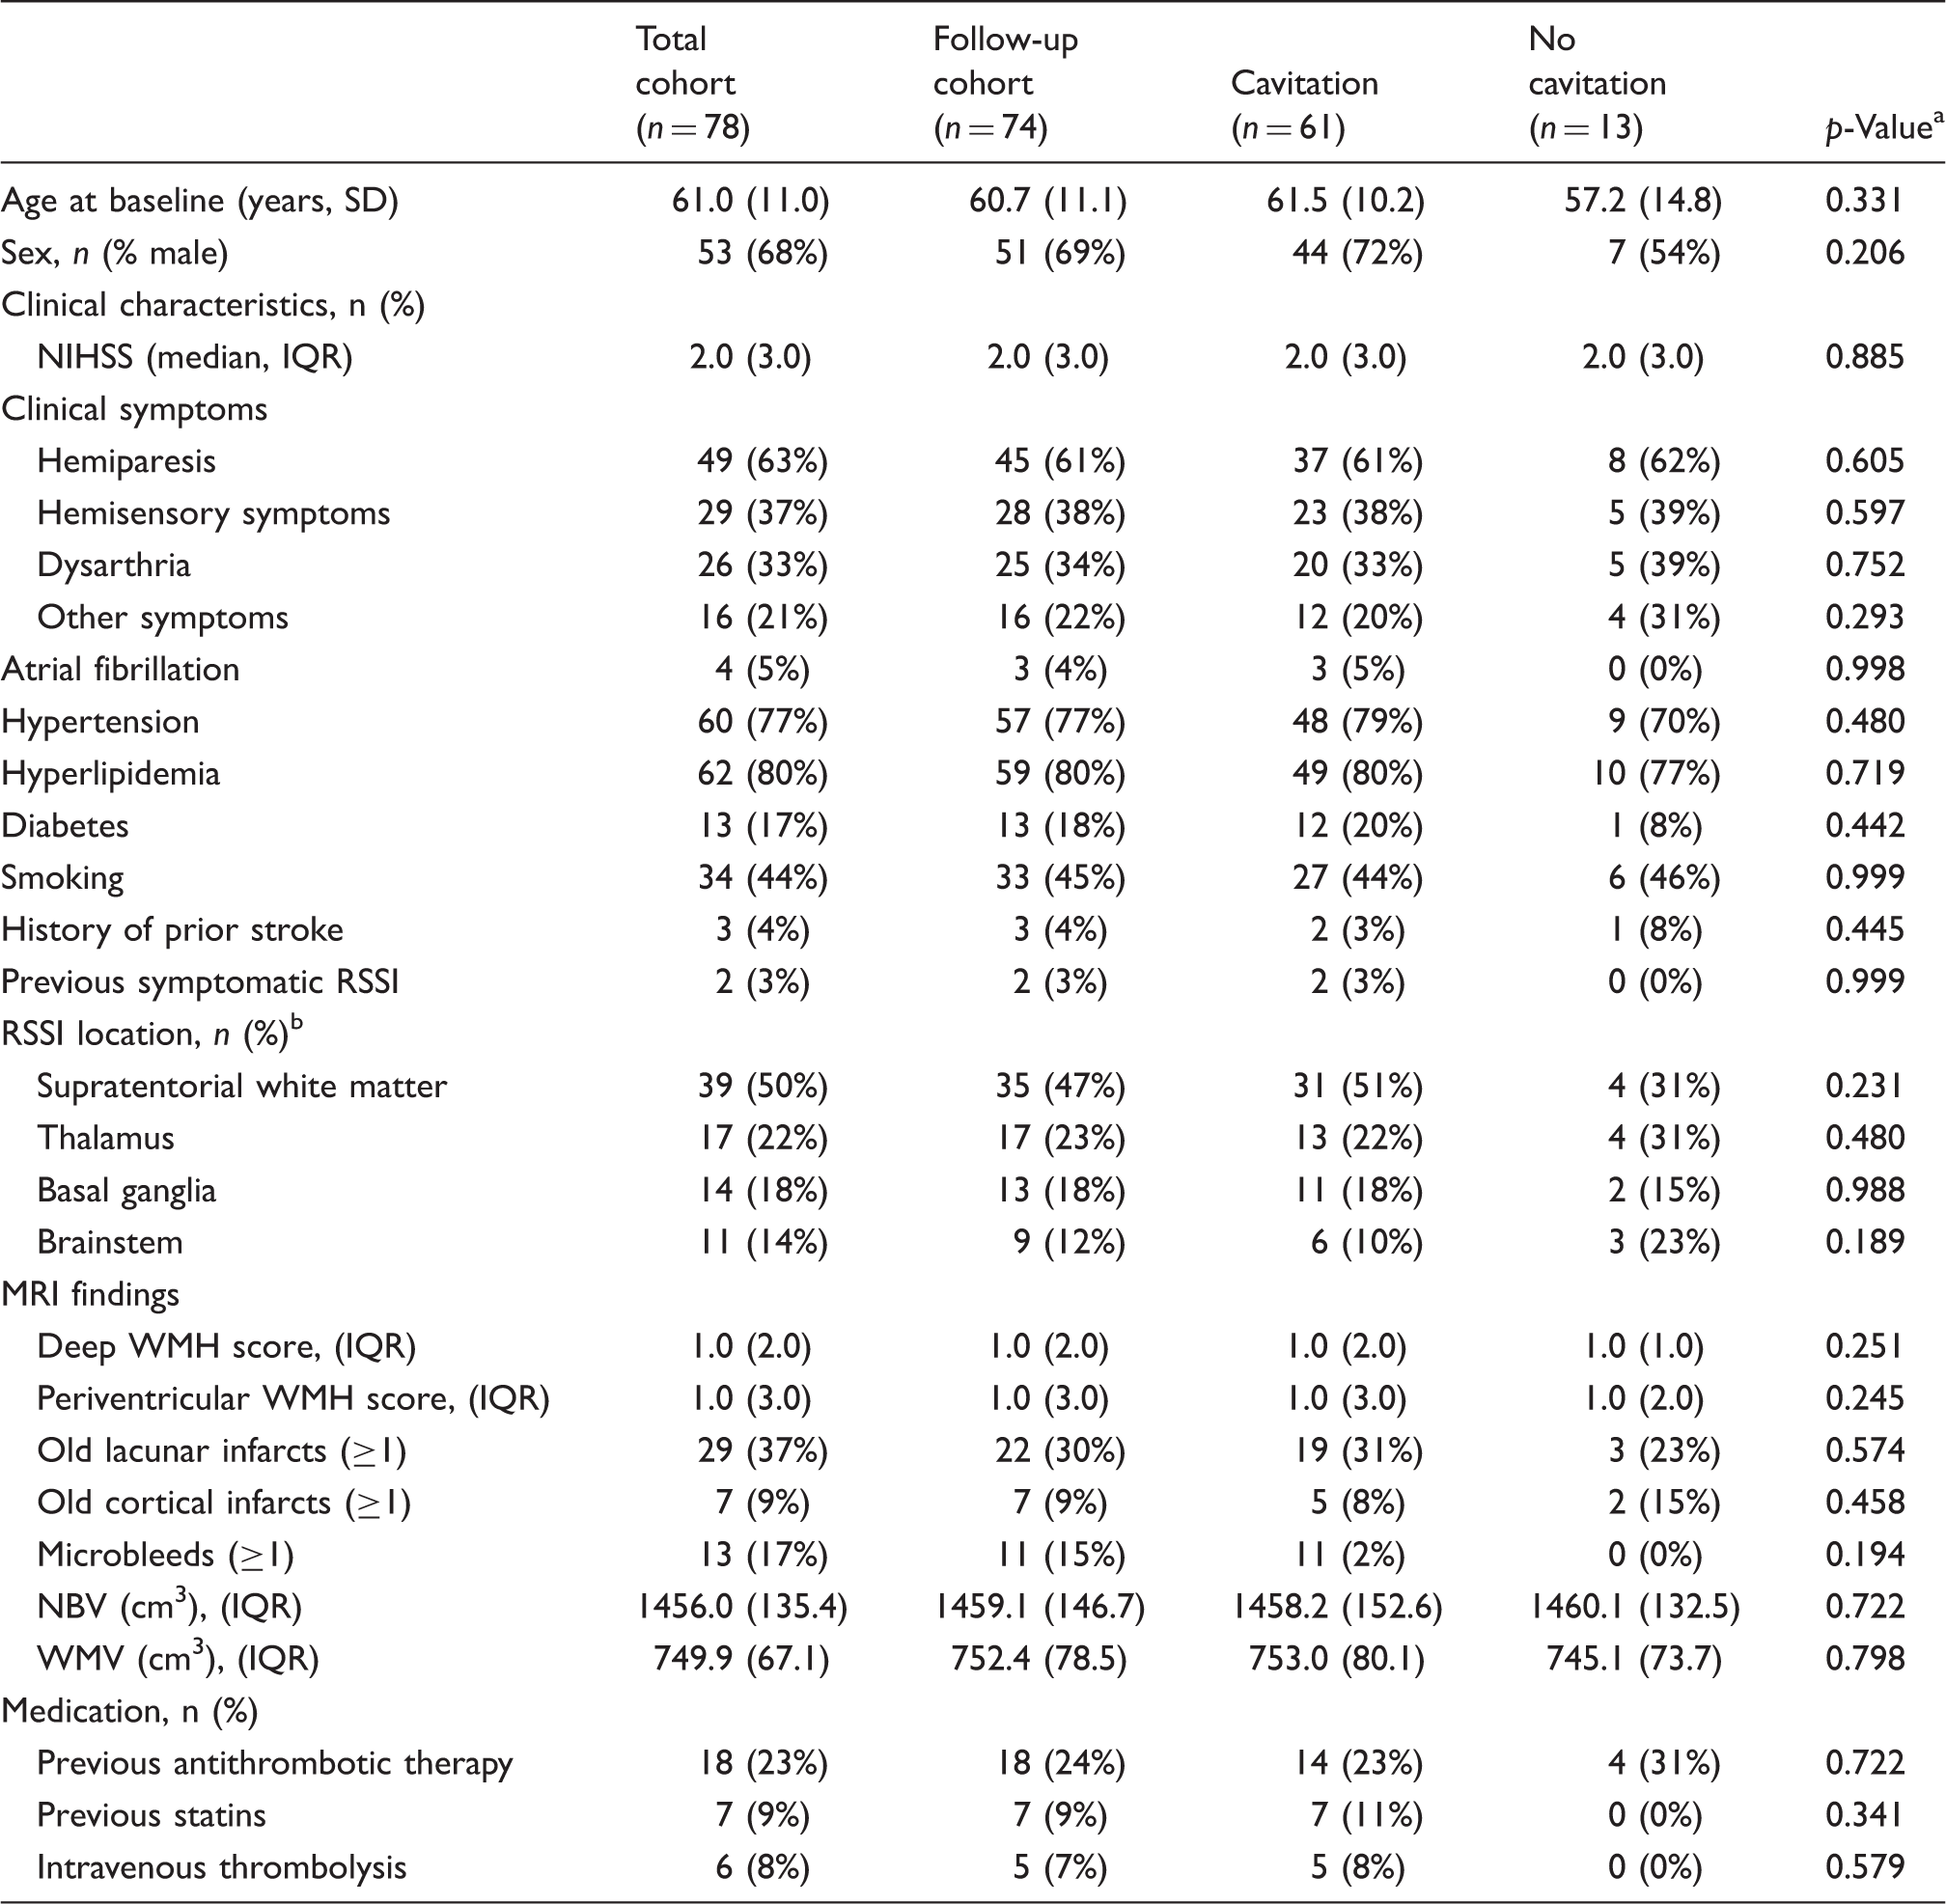
Note: Percentages are presented column-wise.
p-Values refer to the comparison between patients with versus without cavitation at the three months follow-up.
3 RSSIs were located in white matter and basal ganglia. NBV: normalized brain volume; WMV: normalized white matter volume; SD: standard deviation; RSSI: recent small subcortical infarct; NIHSS: National Institutes of Health Stroke Scale; WMH: white matter hyperintensities; IQR: interquartile range.
Information on intravenous thrombolysis and prestroke vascular medication is given in Table 1. Medical treatment for secondary stroke prevention included antiplatelets (n = 69), oral anticoagulation (n = 9), statins (n = 57), antihypertensives (n = 55) and antidiabetics (n = 8), and did not differ between patients with versus without cavitation.
MRI lesion evolution
Out of 74 patients with available MRI at the three-months follow-up, almost four out of five RSSIs patients showed cavitation at three months (n = 61, 78%) and this was confirmed in all who had a follow up MRI at 15 months (Figure 1). Eleven of 13 patients with another evolution of the RSSI also retained their morphologic characteristics at 15 months. In only one patient the RSSI appeared as a WMH at three months but as a lacune at the 15 months’ follow-up MRI scan. In another patient, the RSSI evolved to WMH at three months, which was invisible at the 15 months’ follow-up.
Lesion evolution of the RSSI at the three and 15 months’ follow-up. WMH: white matter hyperintensity.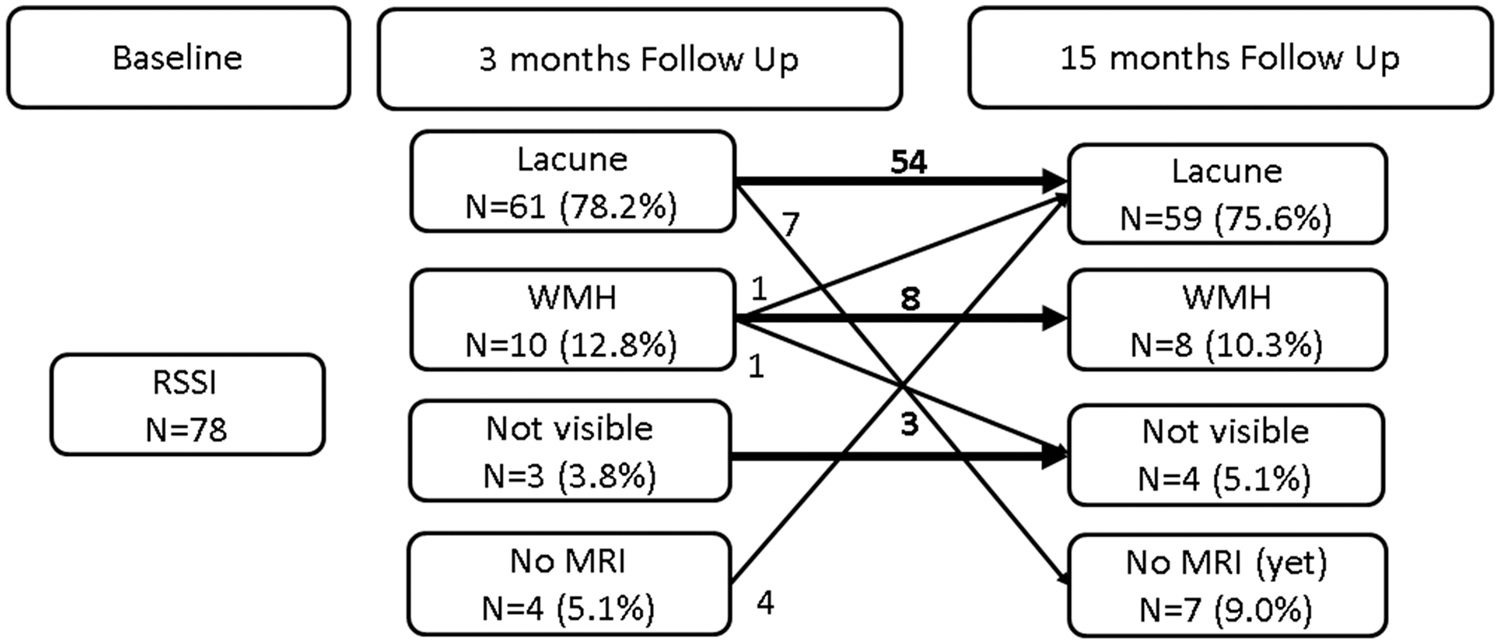
In patients with RSSI evolving to a lacune, the median axial RSSI diameter was 11.75 mm (IQR 6.57) at baseline. After three months, the median axial diameter of the cavitated area was 8 mm (IQR 7) and further decreased to 7 mm (IQR 6.8) at the 15 months’ follow-up (p = 0.008 for the comparison between 3 and 15 months’ follow-up). Figure 2 illustrates different longitudinal RSSI evolutions in three patients, with lacune shrinkage from the 3 to the 15 months’ follow-up in patient A.
Three examples of different longitudinal RSSI evolution (patients A–C). Patient A. Evolution of the RSSI to a lacune at the three months follow-up. Note the subsequent shrinkage of the lacunar diameter at the 15 months (12 mm to 11 mm). Patient B. RSSI development to a WMH at follow-up. C. Example of an almost vanishing RSSI over time.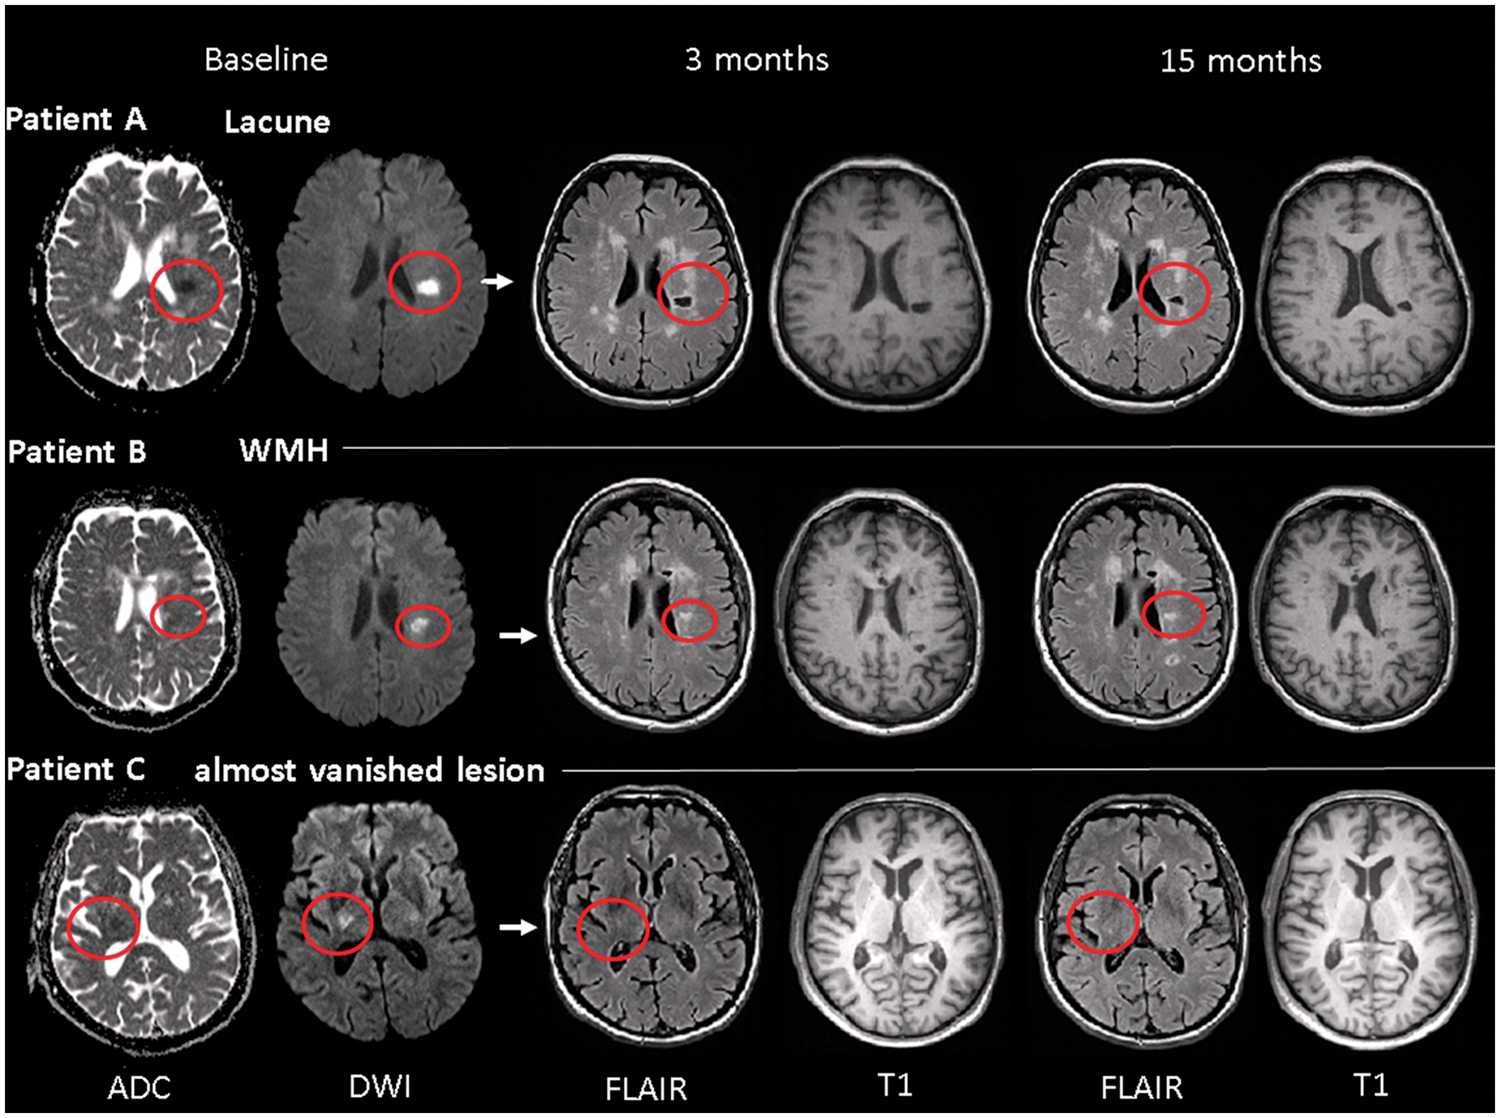
Differences in patients with versus without cavitation
The ADC values of the RSSIs at baseline were lower than the contralateral region ADC values (523.94 ±104.14 × 10⁻⁶ mm2/s vs. 759.57 ± 90.64; × 10−6 mm2/s; p < 0.0001). Overall, the larger the axial DWI diameter of the RSSI was, the lower the quantitative ADC values of the lesion (r s = −0.268, p < 0.05) and the higher the NfL levels at baseline (r s = 0.256, p < 0.05) were.
Comparison of MRI findings, NfL levels and clinical data between patients with versus without cavitation at the three months follow-up.
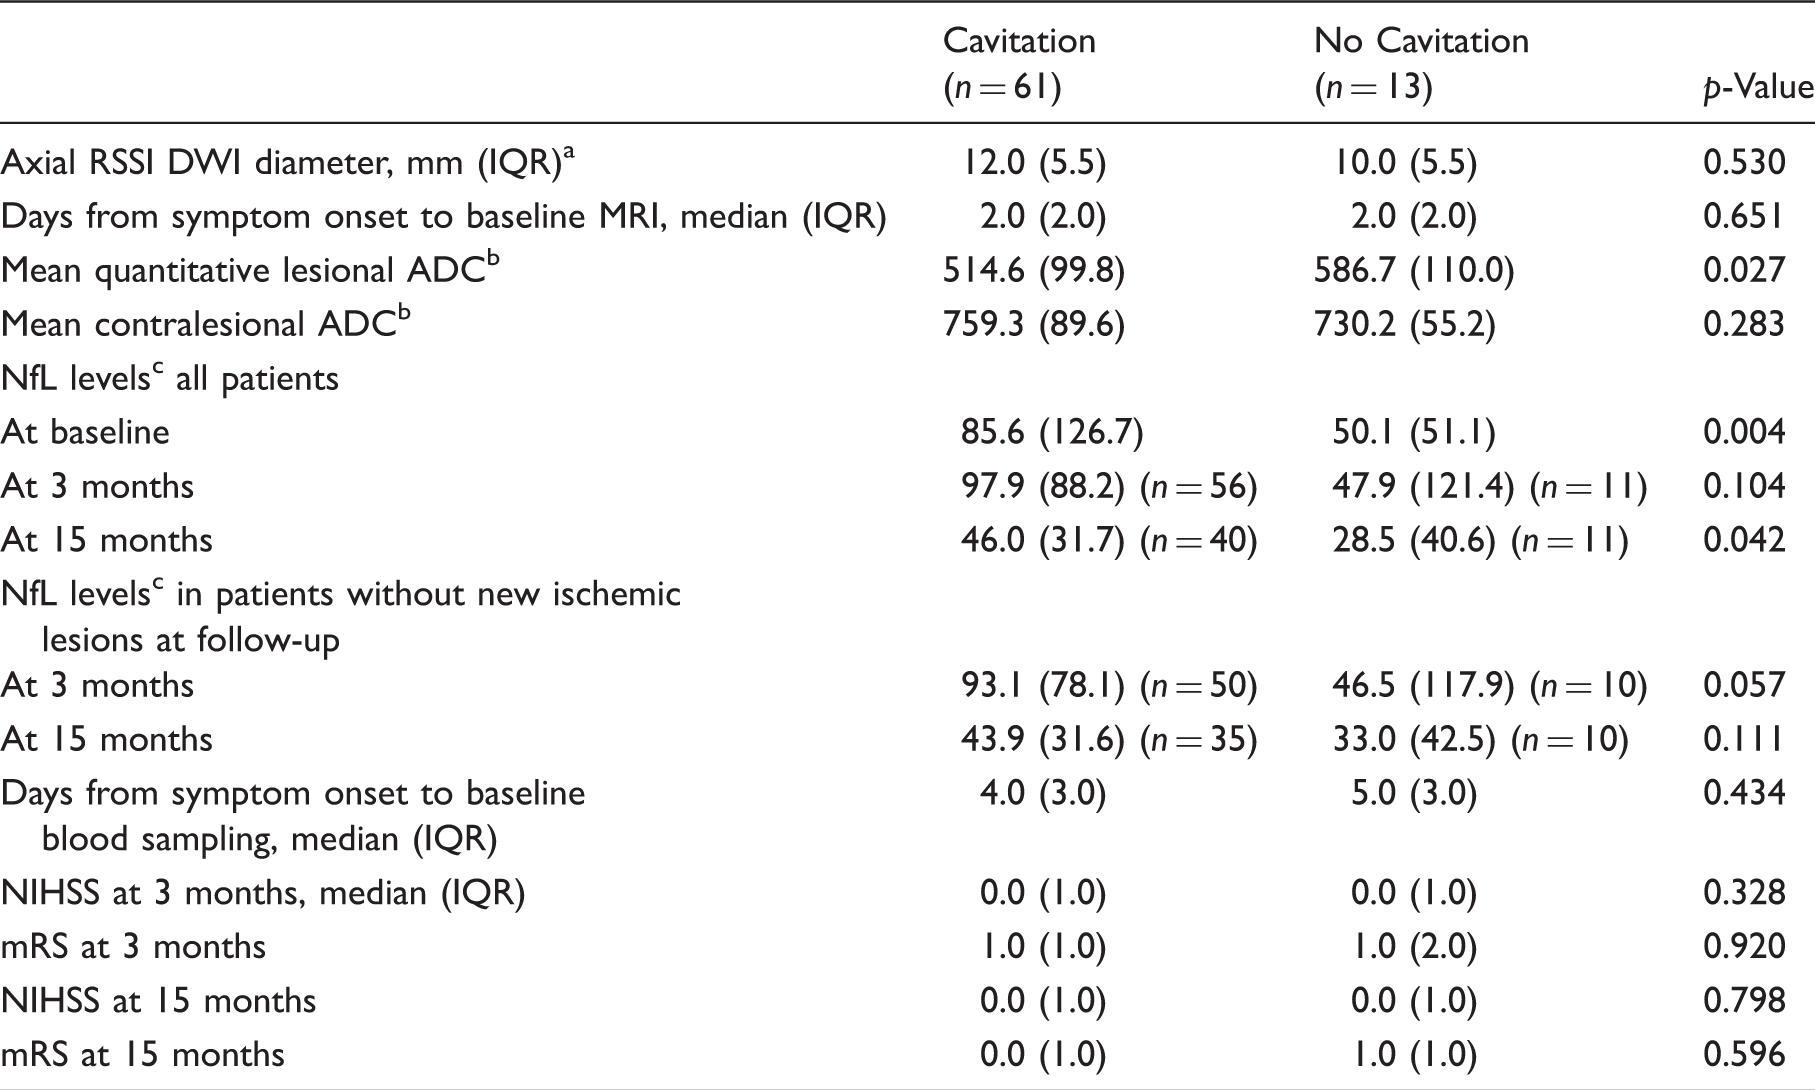
Note: NfL: neurofilament light chain protein; RSSI: recent small subcortical infarct; DWI: diffusion weighted imaging; ADC: apparent diffusion coefficient; NIHSS: National Institutes of Health Stroke Scale; mRS: modified Rankin Scale; IQR: interquartile range.
Three patients had a maximal axial RSSI diameter > 20 mm.
ADC values in × 10−6 mm2/s.
NfL levels in pg/ml median (IQR).
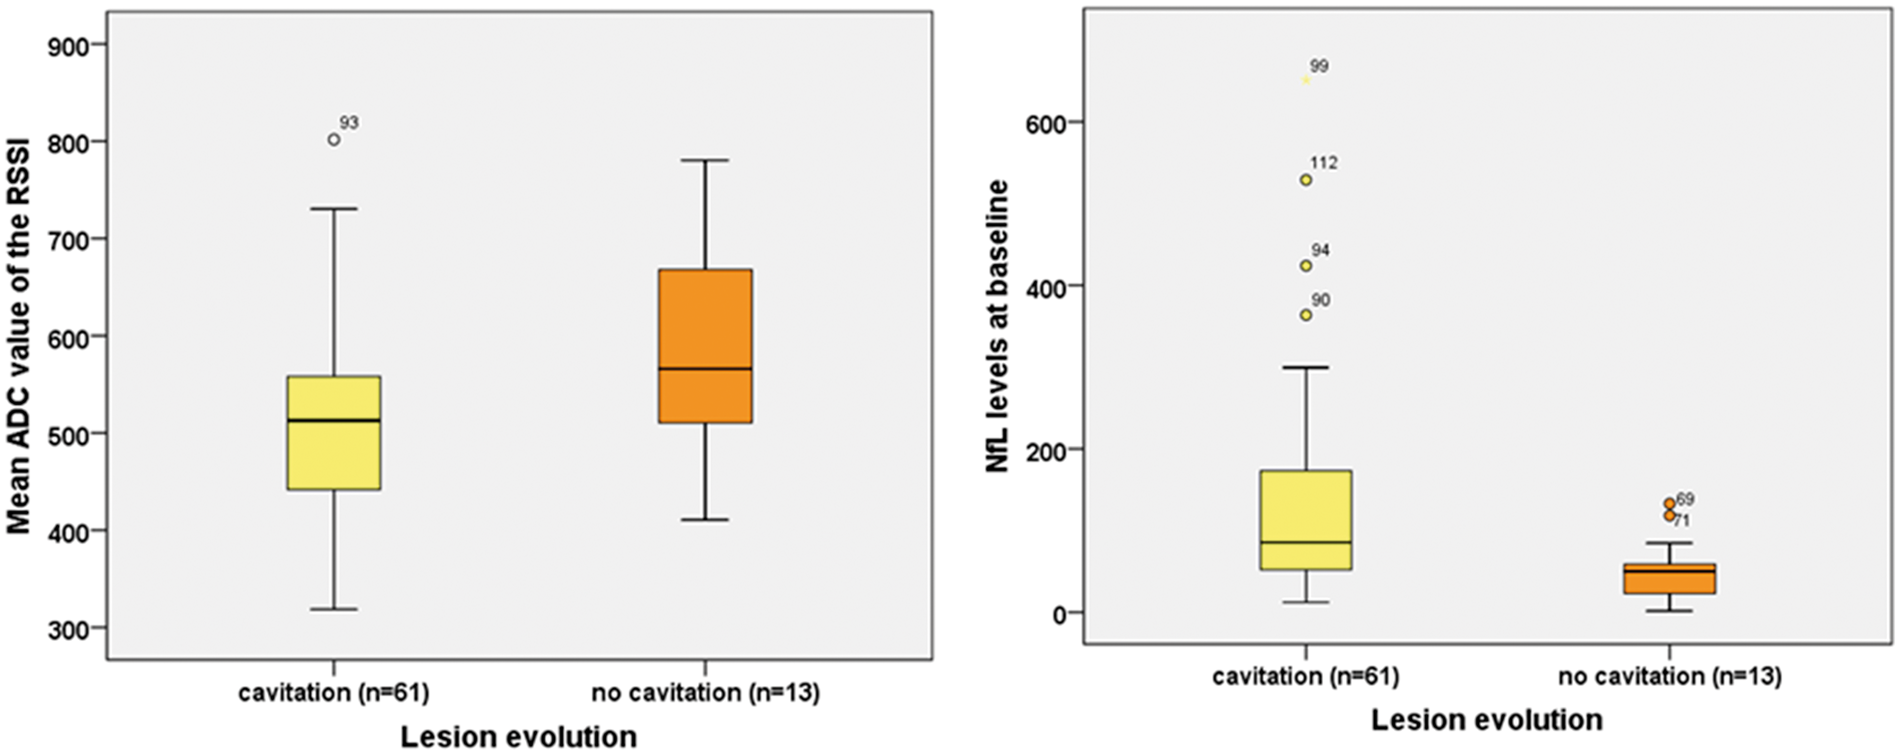
Mean ADC values (in × 10−6 mm2/s) of the RSSIs (left panel, p = 0.027) and NfL levels (in pg/ml) at baseline (right panel, p = 0.004) compared between patients with versus without cavitation at three months follow-up.
Patients with subsequent cavitation also had elevated NfL levels at follow-up. However, this finding disappeared over time when excluding patients with newly evolved yet clinically silent ischemic lesions within the follow-up period (Table 2).
Higher NfL levels at baseline correlated with a larger RSSI diameter (rs = 0.26, p = 0.024), higher scores of deep WMH (rs = 0.35, p = 0.002) and periventricular WMH (rs = 0.23, p = 0.049). No significant correlations between NfL levels at baseline and NIHSS at baseline (rs = −0.04, p = 0.763) or lesional ADC values at baseline were observed (rs = −0.14, p = 0.243).
Further information on the relationship between NfL levels at baseline and the various characteristics of the study cohort can be found in the online Supplementary material (Table S1 and Table S2).
Prediction of cavitation
In a model including RSSI diameter on DWI, baseline ADC values and NfL levels at baseline, and controlling for the interval from stroke symptom onset to MRI assessment at baseline and time from stroke symptom onset to baseline blood sampling, only NfL levels at baseline predicted RSSI cavitation at three months (p = 0.017; OR 1.03).
Similar results were observed if we additionally controlled for age and sex, where again only NfL levels at baseline predicted lesion cavitation (p = 0.035; OR 1.03).
We further added deep and periventricular WMH scores to the model and found stable that only NfL levels (pg/ml) at baseline predicted lesion cavitation (p = 0.043; OR 1.03). Results also did not change when excluding three patients who had a maximal RSSI diameter of > 20 mm (data not shown).
Discussion
This prospective cohort study adds some new aspects regarding the frequency, time course, evolution and predictors of cavitation of CSVD-related RSSIs. First, we found that almost 80% of RSSIs evolved into cavitated lacunes at a prespecified follow-up MRI scan at three months. Only minimal subsequent changes regarding cavitation status were noted at a second follow-up scan one year thereafter but the cavitated areas showed significant shrinkage over time. Second and most notably, we identified lower quantitative lesional ADC values and higher serum NfL levels at baseline as two potential predictors of RSSI tissue loss.
Although the clinical consequences have still to be determined (e.g. impact on cognitive status), more refined knowledge on the lesion evolution of RSSIs and specifically tissue loss including lacune formation, has important implications on the research of the epidemiology and pathophysiology of CSVD.
We are aware of five previous neuroimaging studies2–6 that have investigated lesion evolution of acute “lacunar” infarcts and reported a large heterogeneity with apparent cavitation including lacune formation occurring in 48–94% of patients. These substantial differences can be explained by (1) different definitions of “cavitation” including whether adhering to a strict definition of true lacune formation or any degree of cavitation, (2) diverging neuroimaging methods used, regarding modality (CT which is often too unspecific to detect CSVD-related lesions vs. MRI), (3) applied MRI sequences (e.g. incorporation of DWI in the primary diagnosis or not), or (4) possibly MRI field strengths (1.5 or 3 Tesla). Another important aspect is the time interval when follow-up neuroimaging is performed after acute infarction, which was considerably different between and within previous studies. Generally, cavitation was associated with increasing time to follow-up imaging,2,5 highlighting the importance of a pre-defined fixed follow-up assessment to systematically explore tissue changes. In some patients, cavitation has already begun in the first month after an RSSI.3,5 In a small multicenter study investigating two independent cohorts, cavitation was more common at 90 days (94%) as compared to 30 days (52%), suggesting that cavity formation might not be complete within 30 days. It is, however, still unclear whether the proportion of cavitation increases over longer time periods. Therefore, we designed this prospective study assessing morphological changes of RSSI at two time points (after three months and one further year thereafter). Interestingly only minor changes occurred in cavitation status after three months and only one patient showed lacunar cavitation of a white matter lesion between follow-up 1 and 2. In line with previous studies, RSSIs showed lesion shrinkage during cavity formation (median axial diameter decreased from 11.5 mm to 8 mm).4–6 Notably, we observed a further decrease of the cavity diameter to 7 mm at the 15 months’ follow-up. While we currently cannot provide a clear explanation for this process of lacune shrinkage, a similar observation has been already made by others. 5 This finding suggests some morphologic dynamics even at the chronic lacunar stage, which has to be considered regarding lesion cut-off definitions and deserves further exploration.
So far, knowledge about baseline clinical or morphological correlates associated with lesion evolution is scarce. To better understand the causes and mechanisms that determine the morphologic evolution of an RSSI, we investigated possible differences between patients with versus without cavitation. In line with most previous studies,3–5 we did not identify any demographic, clinical or imaging variables to predict cavitation. In contrast to this, a previous study found that deep brain atrophy was associated with cavitation, while hypertension or diabetes was associated with not cavitating RSSI development. 2
In a rodent stroke model 15 longer duration of ischemia was associated with cavity formation indicating that the degree of ischemia may be explanatory for that. It is therefore interesting that the NIHSS and mRS at baseline as well as at both follow-ups, and also RSSI size were not different between patients with or without cavitation. However, patients who developed cavitation had lower quantitative lesional ADC values indicative of more severe diffusion abnormality and local ischemic tissue destruction.7,8,16–19 In line with this finding, ADC values have been shown to be better predictors of stroke outcome compared to lesion volume alone.20,21
Therefore it is intriguing that in our multivariate analysis the ADC value was no longer significantly associated with cavity formation. This is consistent with another study, which has reported that the amount of ADC reduction in the acute stroke phase could not predict subsequent tissue outcome. 22 It could also be speculated, however, that in our specific setting NfL levels are reflective of ADC values and outperform this morphologic information as the small size of the acute lesions may preclude robust measurements, especially in the presence of a possibly inhomogeneous ADC pattern defining the subsequent area of complete tissue necrosis.
The only independent predictor for cavitation was the serum NfL level at baseline. Upon neuroaxonal damage, NfL is released into the extracellular space and subsequently the cerebrospinal fluid and blood. 23 With the recent advent of robust serum assays, serum NfL might also act as a promising biomarker for stroke, where lumbar puncture is usually not performed. We previously observed that serum NfL was elevated in RSSI patients over the level of healthy age-matched controls. 9 Thus, serum NfL seems to represent a sensitive marker for acute ischemic cerebrovascular injury, even in patients with small subcortical infarcts. We here observed that baseline NfL was positively associated with subsequent cavitation. This finding might be explained by more extensive initial tissue damage releasing higher amounts of NfL to the blood, more active diffuse small vessel disease or by ongoing inflammatory/immunological processes promoting subsequent tissue rarefaction. 24 NfL levels at 3 and 15 months after stroke were also higher in patients with cavitated RSSIs. However, after excluding patients with new clinically silent ischemic lesions at follow-up, this difference was no longer significant.
The main strength of our study is that it was specially designed to determine longitudinal morphological changes after a symptomatic RSSI by using two prespecified MRI follow-up assessments at fixed intervals with a uniform 3 Tesla protocol and the incorporation of high-resolution T1 sequences. Moreau and colleagues 3 have highlighted that a comprehensive MRI acquisition with the inclusion of thin T1 scans clearly increases the sensitivity of detecting lacunes (and avoiding misclassification as other lesions) over the single analysis of T2 or FLAIR scans – an approach we also applied here. Moreover, the analysis of these T1 scans with regard to maximal axial lacunar diameters should have largely excluded imprecise measurements as well as lesion overestimation compared to T2 or FLAIR-weighted images.
Besides the strengths of our work, our study has also some important limitations. The sample size was moderate and consistent follow-up assessments were missing in a few patients. Nevertheless, this is the largest cohort with uniform longitudinal MRI data at 3 Tesla thus far.
There has also been some intended selection of patients as we only included RSSI patients ≤75 years of age without preexisting disability (mRS < 1) to increase the chance of regular follow-up assessments and to reduce the extent of coexisting morphologic damage. Therefore, our results might not be applicable to the entire cohort of RSSI/lacunar stroke patients; however, the mean age of our patients was comparable with previously published research on this topic. ADC was calculated from routine cerebrovascular MRI obtained at baseline, which was performed on a 1.5 T instead of a 3 T MRI. Given the large voxel size of our clinical routine scans, we abstained from lesion volumetrics and rather used the axial diameter of the RSSI and WMH grades of a well-established score. Reassuringly, both measures have been shown to strongly correlate with respective lesion volumes.25,26 Furthermore, the interval of both baseline MRI and blood drawing to determine serum NfL levels from stroke onset varied between patients. It is known that both ADC and NfL levels change with the interval from the acute stroke and this may have influenced the absolute values observed.9,27 Therefore, we controlled for both intervals in our multivariate regression analysis. However, neither the interval from acute stroke to MRI nor to blood sampling was significantly different between patients with cavitating and non-cavitating RSSI at three months. This is important as we have observed an increase in NfL levels with increasing distance from the RSSI. 9 Therefore, future studies should aim at the acute MRI to be performed most close to the onset of symptoms and at multiple blood samplings over the first days after stroke to account for these issues and to define the time interval when NfL levels might be most predictive for the morphologic fate of the RSSI. Due to these limitations, the ultimate clinical value of NfL still has to be determined. Finally, potential effects of certain or intensified medication on cavitation status will need to be considered in future studies.
Supplemental Material
Supplemental material for Longitudinal MRI dynamics of recent small subcortical infarcts and possible predictors
Supplemental material for Longitudinal MRI dynamics of recent small subcortical infarcts and possible predictors by Daniela Pinter, Thomas Gattringer, Christian Enzinger, Thomas Seifert-Held, Markus Kneihsl, Simon Fandler, Alexander Pichler, Christian Barro, Sebastian Eppinger, Lukas Pirpamer, Gerhard Bachmaier, Stefan Ropele, Joanna M Wardlaw, Jens Kuhle, Michael Khalil and Franz Fazekas in Journal of Cerebral Blood Flow & Metabolism
Footnotes
Funding
The author(s) disclosed receipt of the following financial support for the research, authorship, and/or publication of this article: Daniela Pinter receives funding from the Austrian Science Fund: T690-B23.
Declaration of conflicting interests
The author(s) declared no potential conflicts of interest with respect to the research, authorship, and/or publication of this article.
Authors’ contributions
TG, CE and FF conceived the study and designed the research question. DP, TG, CE, MKn, SF, AP, SE acquired the data. DP, TG, TSH, LP, CB, GB, JK and MKh analyzed the data, which was discussed with FF, CE, SR, JMW and MKh. DP and TG wrote the first draft of the manuscript and CE, JMW and FF co-drafted the final version. DP performed the statistical analysis. FF supervised the study. All authors critically revised the manuscript and have read and approved the final manuscript and agreed to be accountable for all aspects of the work.
References
Supplementary Material
Please find the following supplemental material available below.
For Open Access articles published under a Creative Commons License, all supplemental material carries the same license as the article it is associated with.
For non-Open Access articles published, all supplemental material carries a non-exclusive license, and permission requests for re-use of supplemental material or any part of supplemental material shall be sent directly to the copyright owner as specified in the copyright notice associated with the article.