
Abstract
Laboratory and clinical studies have demonstrated that therapeutic hypothermia (TH), when applied as soon as possible after resuscitation from cardiac arrest (CA), results in better neurological outcome. This study tested the hypothesis that TH would promote cerebral blood flow (CBF) restoration and its maintenance after return of spontaneous circulation (ROSC) from CA. Twelve Wistar rats resuscitated from 7-min asphyxial CA were randomized into two groups: hypothermia group (7 H, n = 6), treated with mild TH (33–34℃) immediately after ROSC and normothermia group (7 N, n = 6,37.0 ± 0.5℃). Multiple parameters including mean arterial pressure, CBF, electroencephalogram (EEG) were recorded. The neurological outcomes were evaluated using electrophysiological (information quantity, IQ, of EEG) methods and a comprehensive behavior examination (neurological deficit score, NDS). TH consistently promoted better CBF restoration approaching the baseline levels in the 7 H group as compared with the 7 N group. CBF during the first 5–30 min post ROSC of the two groups was 7 H:90.5% ± 3.4% versus 7 N:76.7% ± 3.5% (P < 0.01). Subjects in the 7 H group showed significantly better IQ scores after ROSC and better NDS scores at 4 and 24 h. Early application of TH facilitates restoration of CBF back to baseline levels after CA, which in turn results in the restoration of brain electrical activity and improved neurological outcome.
Keywords
Introduction
Therapeutic hypothermia (TH) has become an increasingly available option for the treatment of post-ischemic neurological injury such as cardiac arrest (CA) induced brain injury.1,2 The mechanisms underlying the beneficial effects of TH, particularly the restoration of cerebrovascular homeostasis, need to be elucidated. Many destructive processes happen in the brain following primary ischemia, which continue to secondary reperfusion injury. Although TH inhibits or mitigates neuroinflammation, apoptosis, excitotoxicity, blood–brain barrier disruption, brain edema and many others factors, the neurologic prognosis after CA is mainly determined by the earlier restoration and maintenance of adequate brain blood perfusion following resuscitation.1–3 Understanding and optimizing this process will be useful in guiding the clinical applications of TH and improving its therapeutic efficacy.
In 1982, Safar’s team at University of Pittsburgh initiated the development of a model of CA in rats. 4 Since then, this model has been extensively validated to quantify brain damage for studying the mechanisms of neuronal death and screening potential cerebral resuscitation therapies with clinical significance.5–9 Brain recovery from the CA model is characterized by a sequential appearance of electroencephalogram (EEG) features: the absence or non-detectable cortical activity (non-DCA), the intermittent electro-cortical activity (ICA) and then a phase described as continuous cortical activity (CCA). 10 The monitoring and predictive indicators of the EEG during early phases were identified in the past decade.11–13 With the development of novel technology, many non-invasive monitoring can now be deployed during these early phase investigations such as heart and brain hemodynamics.
After the return of spontaneous circulation (ROSC) following resuscitation, survivors develop a systemic hemodynamic impairment that induces cerebral hypoperfusion. Successful resuscitation of the brain requires unimpaired blood recirculation. Experimental data indicate that early cerebral microcirculatory reperfusion is disrupted after CA. No-reflow, low-flow or delayed hypoperfusion disorders are major limiting factors for post-CA brain resuscitation.14,15 Therefore, the recovery of this disruption should be dealt with in the first place before other interventions are introduced. 16 In order to improve hemodynamics after CA, it is mandatory to monitor the cerebral hemodynamic impairment. Traditionally, hemodynamic optimization was focused on the systemic measures such as mean arterial pressure (MAP) optimization. Although some retrospective clinical studies have demonstrated a significant correlation between the MAP and neurological outcomes, there is no compelling evidence that early systemic hemodynamic optimization would affect prognosis of CA patients. 17 There are two different phases of CBF derangements: (a) the immediate multifocal no-reflow phenomenon and (b) the delayed protracted cerebral hypoperfusion.18,19 The hyperemia-hypoperfusion sequence after CA was documented in laboratory and clinical studies. Hossmann et al. 20 stated that perfusion pressure and cerebral blood flow (CBF) during reperfusion were important for the treatment of these derangements. As such, monitoring or imaging cerebral perfusion along with other electrophysiological measures would be informative.
The near-infrared spectroscopy (NIRS) technique has been used in clinical monitoring of brain perfusion. 21 But the size of the instrumentation, particularly the light sources and detectors, makes NIRS less suited for animal studies. NIRS provides good oxygenation information but not cerebral perfusion. Hence, as an alternative, laser speckle contrast imaging (LSCI) method deserves consideration. LSCI is a dye-free wide area, continuous blood flow imaging technique and has been successfully applied in imaging blood flow and vasculature of cerebral cortex. 22 LSCI provides a rapid characterization of cortical flow dynamics at high resolution with a thinned skull preparation in rats. 23
In this study, we investigate the effect of immediate delivery of TH post-resuscitation on cortical CBF recovery and brain homeostasis after resuscitation from CA in a rat model. We hypothesize that TH would promote CBF restoration and maintenance during early post ROSC period after CA. This study aims to elucidate a potential mechanism of TH efficacy based on the hypothesis that timely restoration of perfusion is a critical factor to restore the neurological function. Higher IQ corresponds to greater randomness quantitated by the entropy of the EEG rhythm; as such, a healthier brain (closer to the normal brain conditions) exhibits higher entropy and injured brain lower entropy. As such, our CBF results are coupled with neurological monitoring during the neuroresuscitation process to demonstrate means to monitor cerebrovascular function recovery following TH.
Materials and methods
All experiments procedures were approved by the Johns Hopkins Medical Institute Animal Care and Use Committee and conducted in accordance with the National Institutes of Health guide for the care and use of laboratory animals. Animal experiments were reported in accordance with the ARRIVE (Animal Research: Reporting in Vivo Experiments) guidelines (https://www.nc3rs.org.uk/arrive-guidelines). This CA rat model of brain injury has been well defined by our laboratory and others.4,5,16,24–26 Sample size calculations and power analysis were extrapolated from preliminary data of CBF after resuscitation from CA. Based on preliminary CBF percent recovery data, using a two-group t-test with power of 0.80 and alpha = 0.05, six animals in each group would allow a minimum effect size of 1.8 (or 3.6% recovery) to be detected. Twelve male adult Wistar rats (375 ± 25 g; 9–10 weeks old; Charles River, Wilmington, MA) were randomly assigned to two groups: 7-min asphyxia under normothermia (7 N), and 7-min asphyxia under mild immediate hypothermia (7 H) (n = 6 per group). The rats had free access to food and water before and after the experiments and were housed in a quiet environment with 12-h day–night cycles. All rats were habituated for one week before the procedures.
Experimental preparations, asphyxial CA and resuscitation
Anesthesia was induced with 4% isoflurane (Baxter, IL, USA) carried by 50% oxygen and 50% nitrogen gas at 4 L/min, followed by 2% isoflurane mixed with 1:1 oxygen: nitrogen inhalation via nose cone. Rats were implanted with three epidural EEG screw electrodes (Plastics One, USA) on the left hemisphere with one of the electrodes placed at 2 mm anterior to Bregma and 2 mm to the left of Bregma, corresponding to the M1 regions of the frontal cortex and another electrode was placed at 6 mm posterior to Bregma and 4 mm to the left of Bregma, corresponding to the V1 regions of the occipital cortex. A ground/reference electrode was placed over the cerebellar region (2 mm posterior to Lamda). The electrodes were attached to a pedestal (MS363, Plastics One, USA) and connected with a neural recording device, an RX5 TDT device (Tucker Davis Technologies, Alachua, FL). A 5 × 5 mm window over the left parietal bone of the skull was thinned to translucency by a high-speed dental drill (Vogue Professional 6000, USA) with a 1.6 mm burr. Meanwhile, saline was used for cooling during the skull smoothing procedure. The thinned skull was filled with mineral oil to reduce the specular reflections. This thinned cranial window provided the window for mounting the laser speckle imager for CBF monitoring.23,27–29
After the preparation, the rats were subjected to a 7-min asphyxia-induced CA as follows. Endotracheal intubation was performed under direct laryngoscopy with a 14 G catheter (TERUMO Surflash i.v. catheter) and mechanically ventilated with 2% isoflurane in 50% oxygen and 50% nitrogen gas at 35 breathes per minute by a rodent ventilator (Harvard Apparatus Model 553438). The left femoral artery and vein were cannulated with polyethylene 50 tubing catheters (Intramedic Non-Radiopaque Polyethylene Tubing PE 50, Becton Dickinson) for intermittently sampling of arterial blood gas (ABG), monitoring arterial pressure and fluid/medication administration. ABG samples were measured by i-STAT handheld analyzer (Abbott Point of Care Inc. Princeton, NJ). Briefly, baseline measurements of EEG and vital signs were recorded for 10 min under isoflurane after intubation and cannulation. This was followed by an anesthesia washout period of 5 min: starting with 2 min of 100% oxygen without isoflurane, then 3 min with the concentration of oxygen dropped to 20% and 80% N2 gas (room air). Baseline CBF was recorded at washout period. Vecuronium bromide 2 mg/kg i.v. (Novaplus, Abbott Labs, North Chicago, IL, USA), was administered for muscle paralysis at 2 min of washout time. Following 5 min of gas washout, global asphyxial CA was induced by stopping and disconnecting the ventilator and clamping the tracheal tube for 7 min. Global asphyxia was accompanied by transient hypertension, followed by observation of progressive bradycardia, hypotension and eventual CA (defined by MAP < 10 mmHg and cessation of electrical rhythm and non-pulsatile-pressure wave). After the 7-min asphyxia period, cardiopulmonary resuscitation (CPR) was initiated by unclamping the tracheal tube, restarting mechanical ventilation, administering epinephrine (5 µg/Kg, i.v.), and applying sternal chest compressions with two fingers (200 compressions/min). Spontaneous generation of MAP > 50 mmHg was defined as successful ROSC. Rats were excluded from the protocol if animal achieved ROSC beyond 2 min CPR. Anesthesia washout was carried out post resuscitation to minimize the drug effects on EEG signals during the return of brain rhythms and subsequent arousal. Following successful resuscitation, the animal was hyperventilated (TV 10 ml/kg, RR 65/min and PEEP 3 cm H2O).
Temperature selection and methods
Our previous experiments support the theory that cooling should begin as soon as possible after ROSC and earlier initiation of TH may have a greater impact during the early period of recovery and that injured neurons that are immediately treated have a better chance of recovering.13,26 In the 7 H group, mild hypothermia (33–34℃) was initiated immediately after ROSC by surface cooling with cold water and alcohol mist aided by an electric fan to achieve the target temperature measured by a rectal temperature sensor (Harvard Apparatus, MA, USA) within 5 min. The targeted temperature was maintained for 2 h. In the 7 N group, the temperature was maintained at 37.0 ± 0.5℃ using a homeothermic blanket system (Harvard Apparatus, MA, USA), and the temperature change was monitored during the whole procedure.
EEG recording and analysis
EEG signals were recorded using epidural screw electrodes implanted in the skull. An information quantity (IQ) of EEG was used to evaluate the EEG recovery after CA under hypothermia and normothermia. Briefly, the EEG waveform was divided into a series of windows of equal length. Wavelet coefficients were computed using a discrete wavelet transform. The distribution of the wavelet coefficients within a window was determined by constructing a histogram. Using the frequency of wavelet coefficients in each bin of the histogram, the information was calculated using the formula for Shannon entropy. The entropy value of wavelet coefficients for a single window of EEG is called the IQ. To compare IQ between multiple rats, the IQ average was normalized to a baseline mean. Normalized IQ values range from 1.0 (normal) to 0 (isoelectric).11,24 IQ acts as prognostic markers to cognitive arousal from post-CA and serves as a continued monitoring complement to the marker for neurological deficit score (NDS). Further details on the IQ electrophysiological marker and its application to monitor CA, resuscitation and TH have been published previously.12,24,25,30
CBF imaging and analysis
LSCI has been used to provide full-field, high-resolution imaging of CBF.23,27,28 In this study, we used a miniaturized LSCI imager suitable for head mounting for CBF monitoring. Coherent laser light illuminates the cortex through a multimode optical fiber bundle fixed onto the supporting frame of the imager. The reflected light was collected by a macro lens system and imaged by a high-resolution CMOS camera at a frame rate of 50 frames/s (Figure 1). The principle of LSCI was described (Supplementary Materials). Briefly, when a highly coherent laser source illuminates a medium with moving particles, e.g. the cells in blood vessels, the interference of the reflected or scattered light results in granular pattern known as speckle. The most common measure for the speckle pattern relates to the velocity of the scattering particles in the laser speckle contrast analysis: it is calculated as the ratio of the standard deviation to the mean of the intensity in the image.
31
The baseline CBF measurement was began at the anesthesia washout period before CA. All other CBF changes afterwards were normalized to the baseline.
(a) Schematic diagram of LSCI experimental setup. (b) Representative LSCI image during the CA. ROI: region of interest. (c) Schematic diagram of CA experimental procedure. TH was applied immediately after ROSC. (d) Representative LSCI images of selected ROI at difference stage of CA and CBF values in two groups (Hypothermia, 7 H and Normothermia, 7 N). CA: cardiac arrest; CPR; cardiopulmonary resuscitation; ROSC: return of spontaneous circulation. The double black asterisk (**) represents statistical significance with P < 0.01.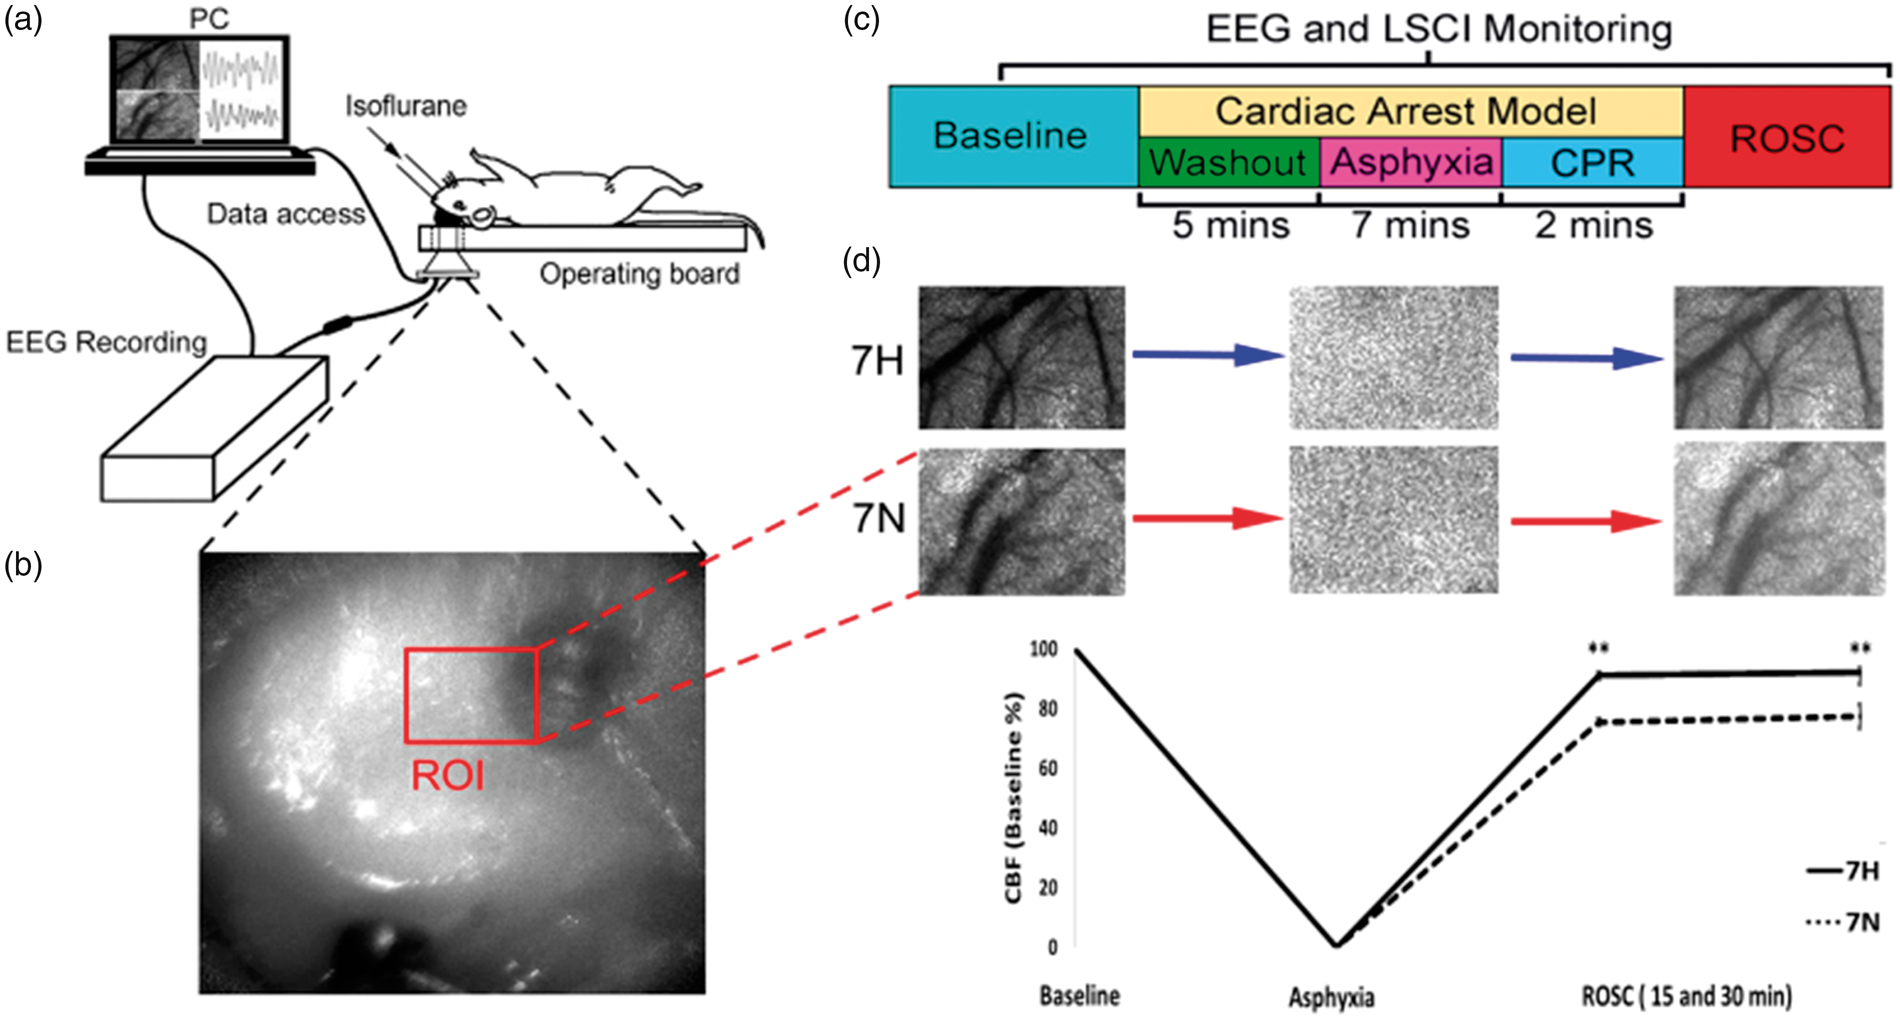
Neurological evaluation
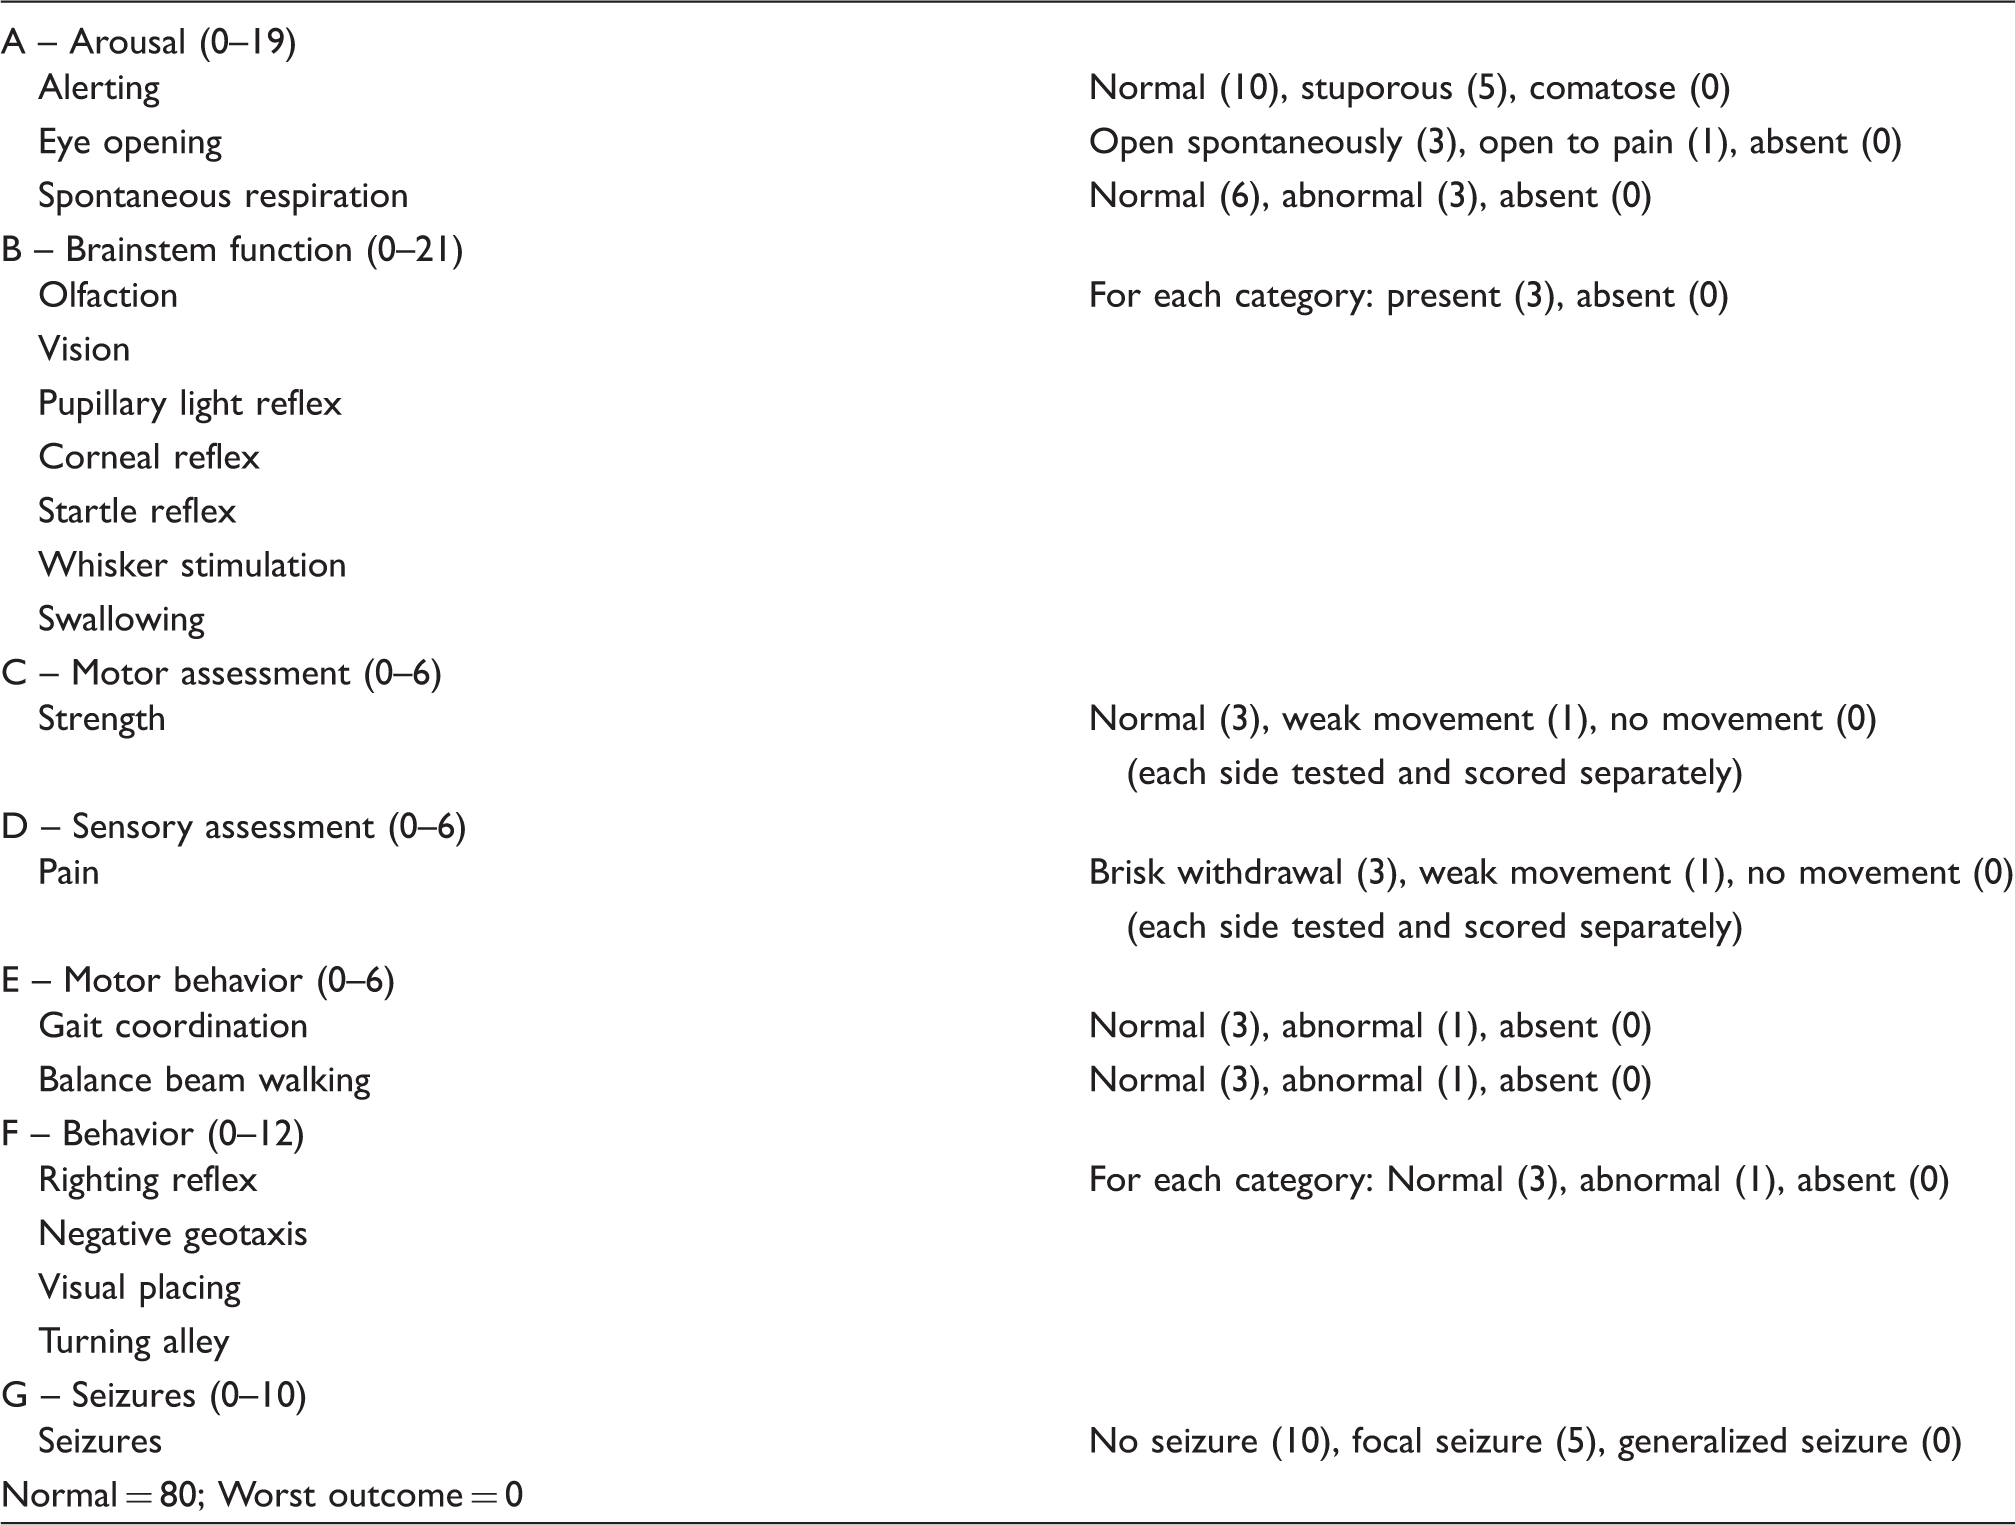
Neurologic deficit scale (NDS) for rats.
Statistics
EEG, MAP and CBF signal data were pre-processed and extracted through MATLAB software. For each outcome measurement, a repeated measures analysis was performed with experiment groups (7 H and 7 N), time points and the interaction to evaluate the group differences at each time points. Estimates of the measurements for each group at each time point and their 95% confidence intervals were based on the associated analysis. Parametric data were presented as mean ± 95% confidence interval unless otherwise stated. To account for multiple comparisons made for an outcome measurement, the p-values comparing the two groups were adjusted by a Bonferroni correction. Statistical significance threshold was set at *P ≤ 0.05; **P ≤ 0.01.
Results
Prearrest baseline and arrest-resuscitation variables among two groups.
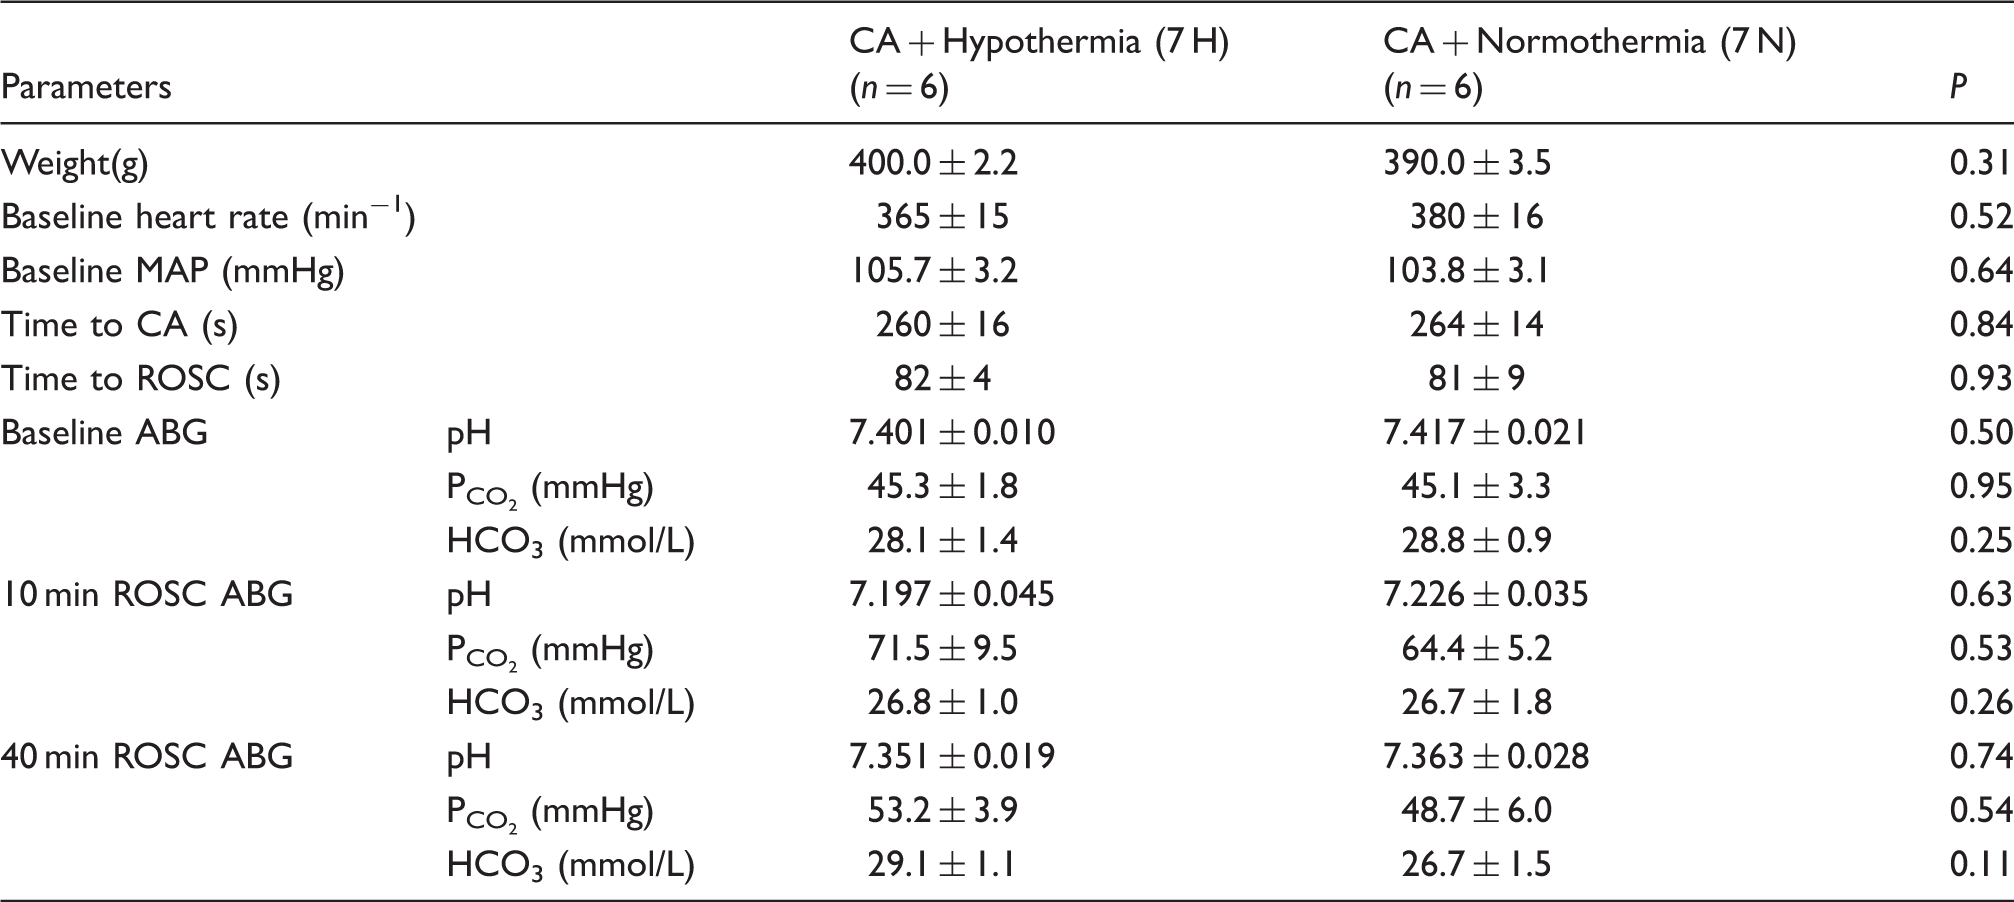
Note: Data presented as Mean ± SEM. No statistically significant differences between the two groups (hypothermia, 7 H and normothermia, 7 N).
CA: cardiac arrest; MAP: mean arterial pressure; ROSC: return of spontaneous circulation; ABG: arterial blood gas.
In the 7 H group, the body temperature was passively decreased to the targeted temperature (33–34℃) within 5 min immediately after ROSC. The temperature was maintained for 2 h followed by rewarming under room temperature. At 4 h after ROSC, the body temperature returned to 37 ± 0.5℃. In the 7 N group, temperature was maintained at 37 ± 0.5℃. The body temperature was significantly different between the two groups for the first 2-h post ROSC period: 7 H vs. 7 N as 33. 5 ± 0.7℃ vs. 37. 4 ± 0.6℃ (P < 0.01) (Figure 2).
TH was applied immediately after ROSC. Temperature recording of hypothermia (7 H) and normothermia (7 N) post ROSC period. The solid line is temperature in 7 H and the dotted line is of 7 N. Target temperature (33–34℃) was achieved at 5-min post ROSC. Temperature was significantly different (**P < 0.01) between the two groups afterwards (5–120 min post ROSC).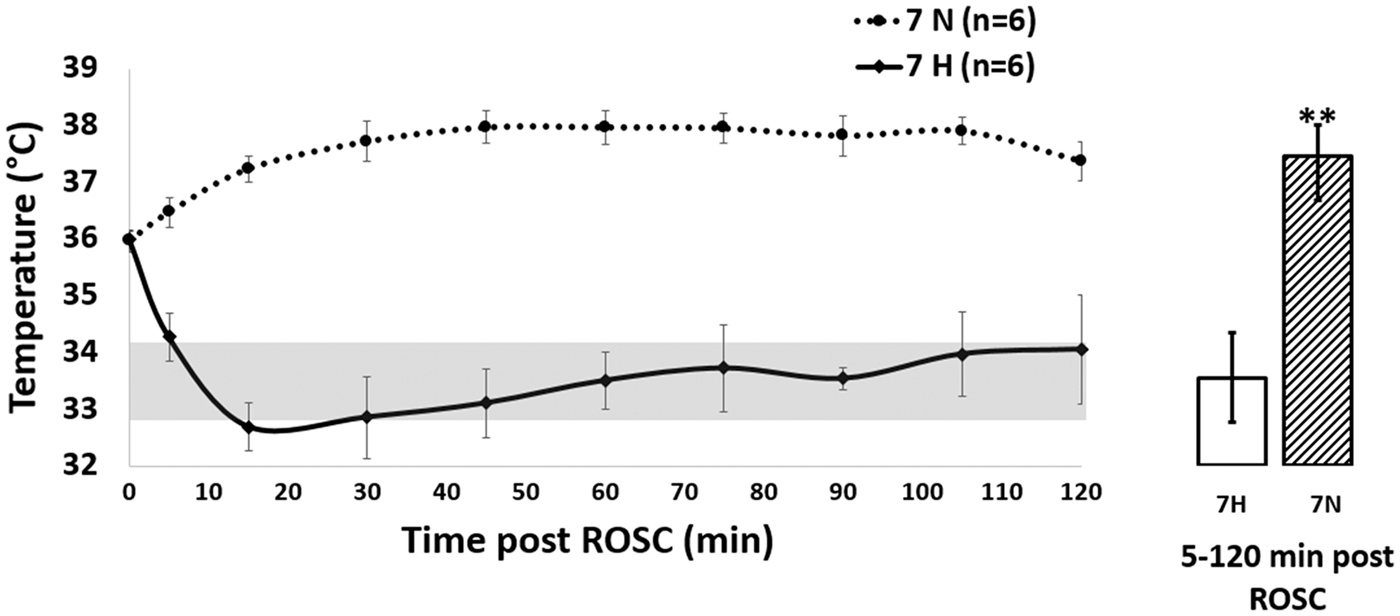
All rats in the two groups returned to ROSC upon CPR. NDS was obtained as a clinically motivated observation of neurological outcome. Rats in the 7 H group showed significantly higher NDS at 4 and 24 h post ROSC compared with that of 7 N group. NDS for 7 H versus 7 N was 55.0 ± 2.0 versus 49.5 ± 2.1 at 4 h (P < 0.05); 70.0 ± 2.88 versus 60.0 ± 4.33 at 24 h (P < 0.01; 80 = best score; Figure 3(a)). Another measure of neurological recovery was EEG. We utilized a quantitative measure. IQ. This measure has also been previously validated in this model to predict functional outcome associated with temperature manipulation.
24
The published data from our lab also showed that the IQ values during the first 2 h after CA accurately predicted neurologic outcomes.12,25 The two groups showed statistically significant differences starting from 10 min post ROSC (Figure 3(b)).
(a) NDS in hypothermia (7 H) and normothermia (7 N) group at baseline (BL); asphyxia (ASP); 4 h post ROSC (4 H) and 24 h post ROSC (24 H). The NDS was significantly different between the two groups at 4 H and 24 H post ROSC. (b) Comparison of information quantity (IQ) of EEG data for two groups (hypothermia, 7 H and normothermia, 7 N) post ROSC. There was a significant difference during post ROSC between the two groups. The black asterisk (*) represents statistical significance with P < 0.05; the double black asterisk (**) represents statistical significance with P < 0.01.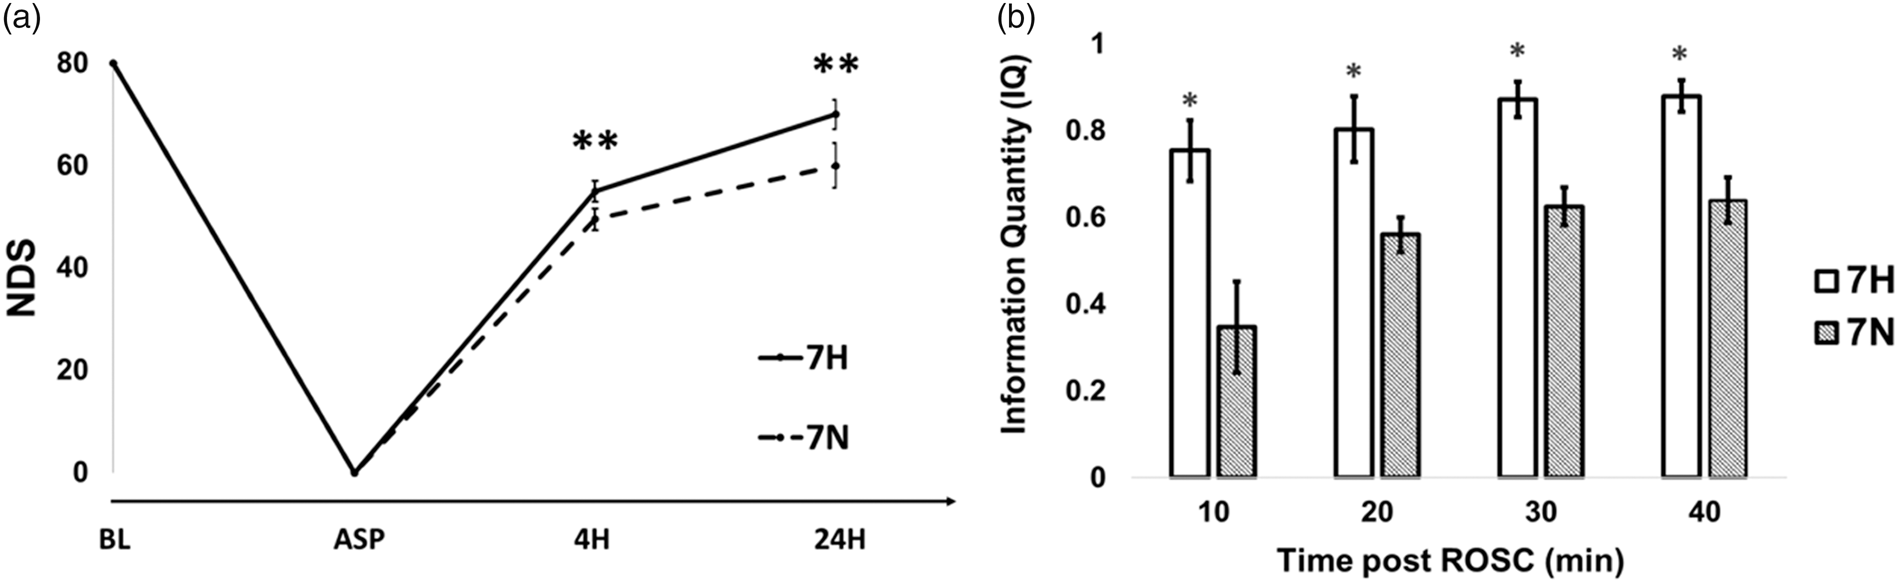
CBF was utilized to enhance our understanding of the homeostasis of the microcirculation after resuscitation. To investigate the changes of CBF during CA and resuscitation, we selected the ROI (region of interest) which was adjacent to the EEG electrode (Figure 1(b)). Figure 1(d) illustrates the representative LSCI images of selected ROI at difference stages of CA in the two groups. Our experimental data post ROSC demonstrated that the TH promoted consistently stable CBF approaching near baseline levels (set as 100%) comparable to that for the normothermia group. The average CBF during the first 5–30 min post ROSC of two groups was 7 H versus 7 N as 90.5% ± 3.4% versus 76.7% ± 3.5% (Figure1(d) and 4(a)) (P < 0.01). The systemic hemodynamic monitoring showed that there was a significant overshooting of MAP at 10 min post ROSC in the 7 H group compared with the 7 N group: the MAP levels for 7 H versus 7 N were 167.3 ± 18.5 mmHg versus 142.1 ± 18.4 mmHg (Figure 4(b)) (P < 0.05).
(a) Change of CBF (percent of baseline) in the post ROSC in two groups (hypothermia, 7 H and normothermia, 7 N); (b) Change in MAP post ROSC in two groups (hypothermia, 7 H and normothermia, 7 N). The black asterisk (*) represents statistical significance with P < 0.05; the double black asterisk (**) represents statistical significance with P < 0.01.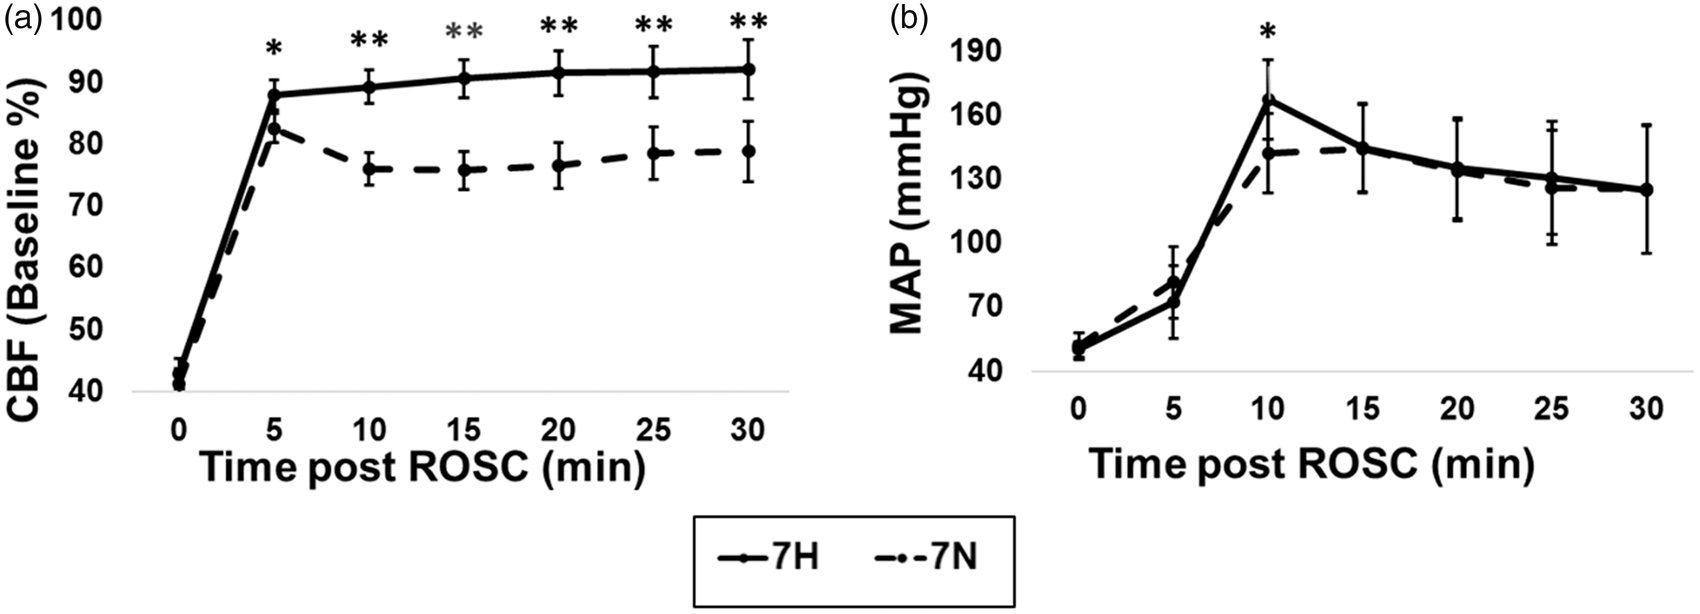
Changes in EEG appear sequentially as follows: at first there is an absence or non-DCA. Subsequently, there is an intermittent cortical activity (ICA). Finally, there is a phase described as continuous cortical activity (CCA) (Figure 5). The non-DCA stage was accompanied by no significant difference in IQ, MAP and CBF between the two groups (7 H vs. 7 N) (Figure 5(b) to (d)), although the temperature was different because of the immediate timing after the cooling initiation (Figure 5(a)). ICA was also accompanied by significantly high IQ, MAP hypertensive overshoot (P < 0.05) and near to normal level of CBF (P < 0.01) in 7 H group compared to those of in the 7 N group. Finally, the CCA stage was accompanied by a significantly higher IQ, together with consistently near normal CBF (P < 0.01) in the 7 H group compared to that of the 7 N group. However, the MAP showed no difference between the two groups during CCA.
Representative recording of CBF, EEG and MAP post ROSC. This period was divided by three blocks per the EEG activities: Non-DCA: non-detectable cortical activity); ICA: intermittent cortical activity; CCA: continuous cortical activity; APU: arbitrary perfusion units). (a) Temperature in two groups (7 H vs. 7 N) at three blocks; (b) Information quantity (IQ) in two groups (7 H vs. 7 N) at three blocks; (c) Mean arterial pressure (MAP) in two groups (7 H vs. 7 N) at three blocks; (d) Cerebral blood flow (CBF) in two groups (7 H vs. 7 N) at three blocks. 7 H, no fill bar; 7 N diagonal pattern fill bar. The black asterisk (*) represents statistical significance with P < 0.05. The black double asterisk (**) represents statistical significance with P < 0.01).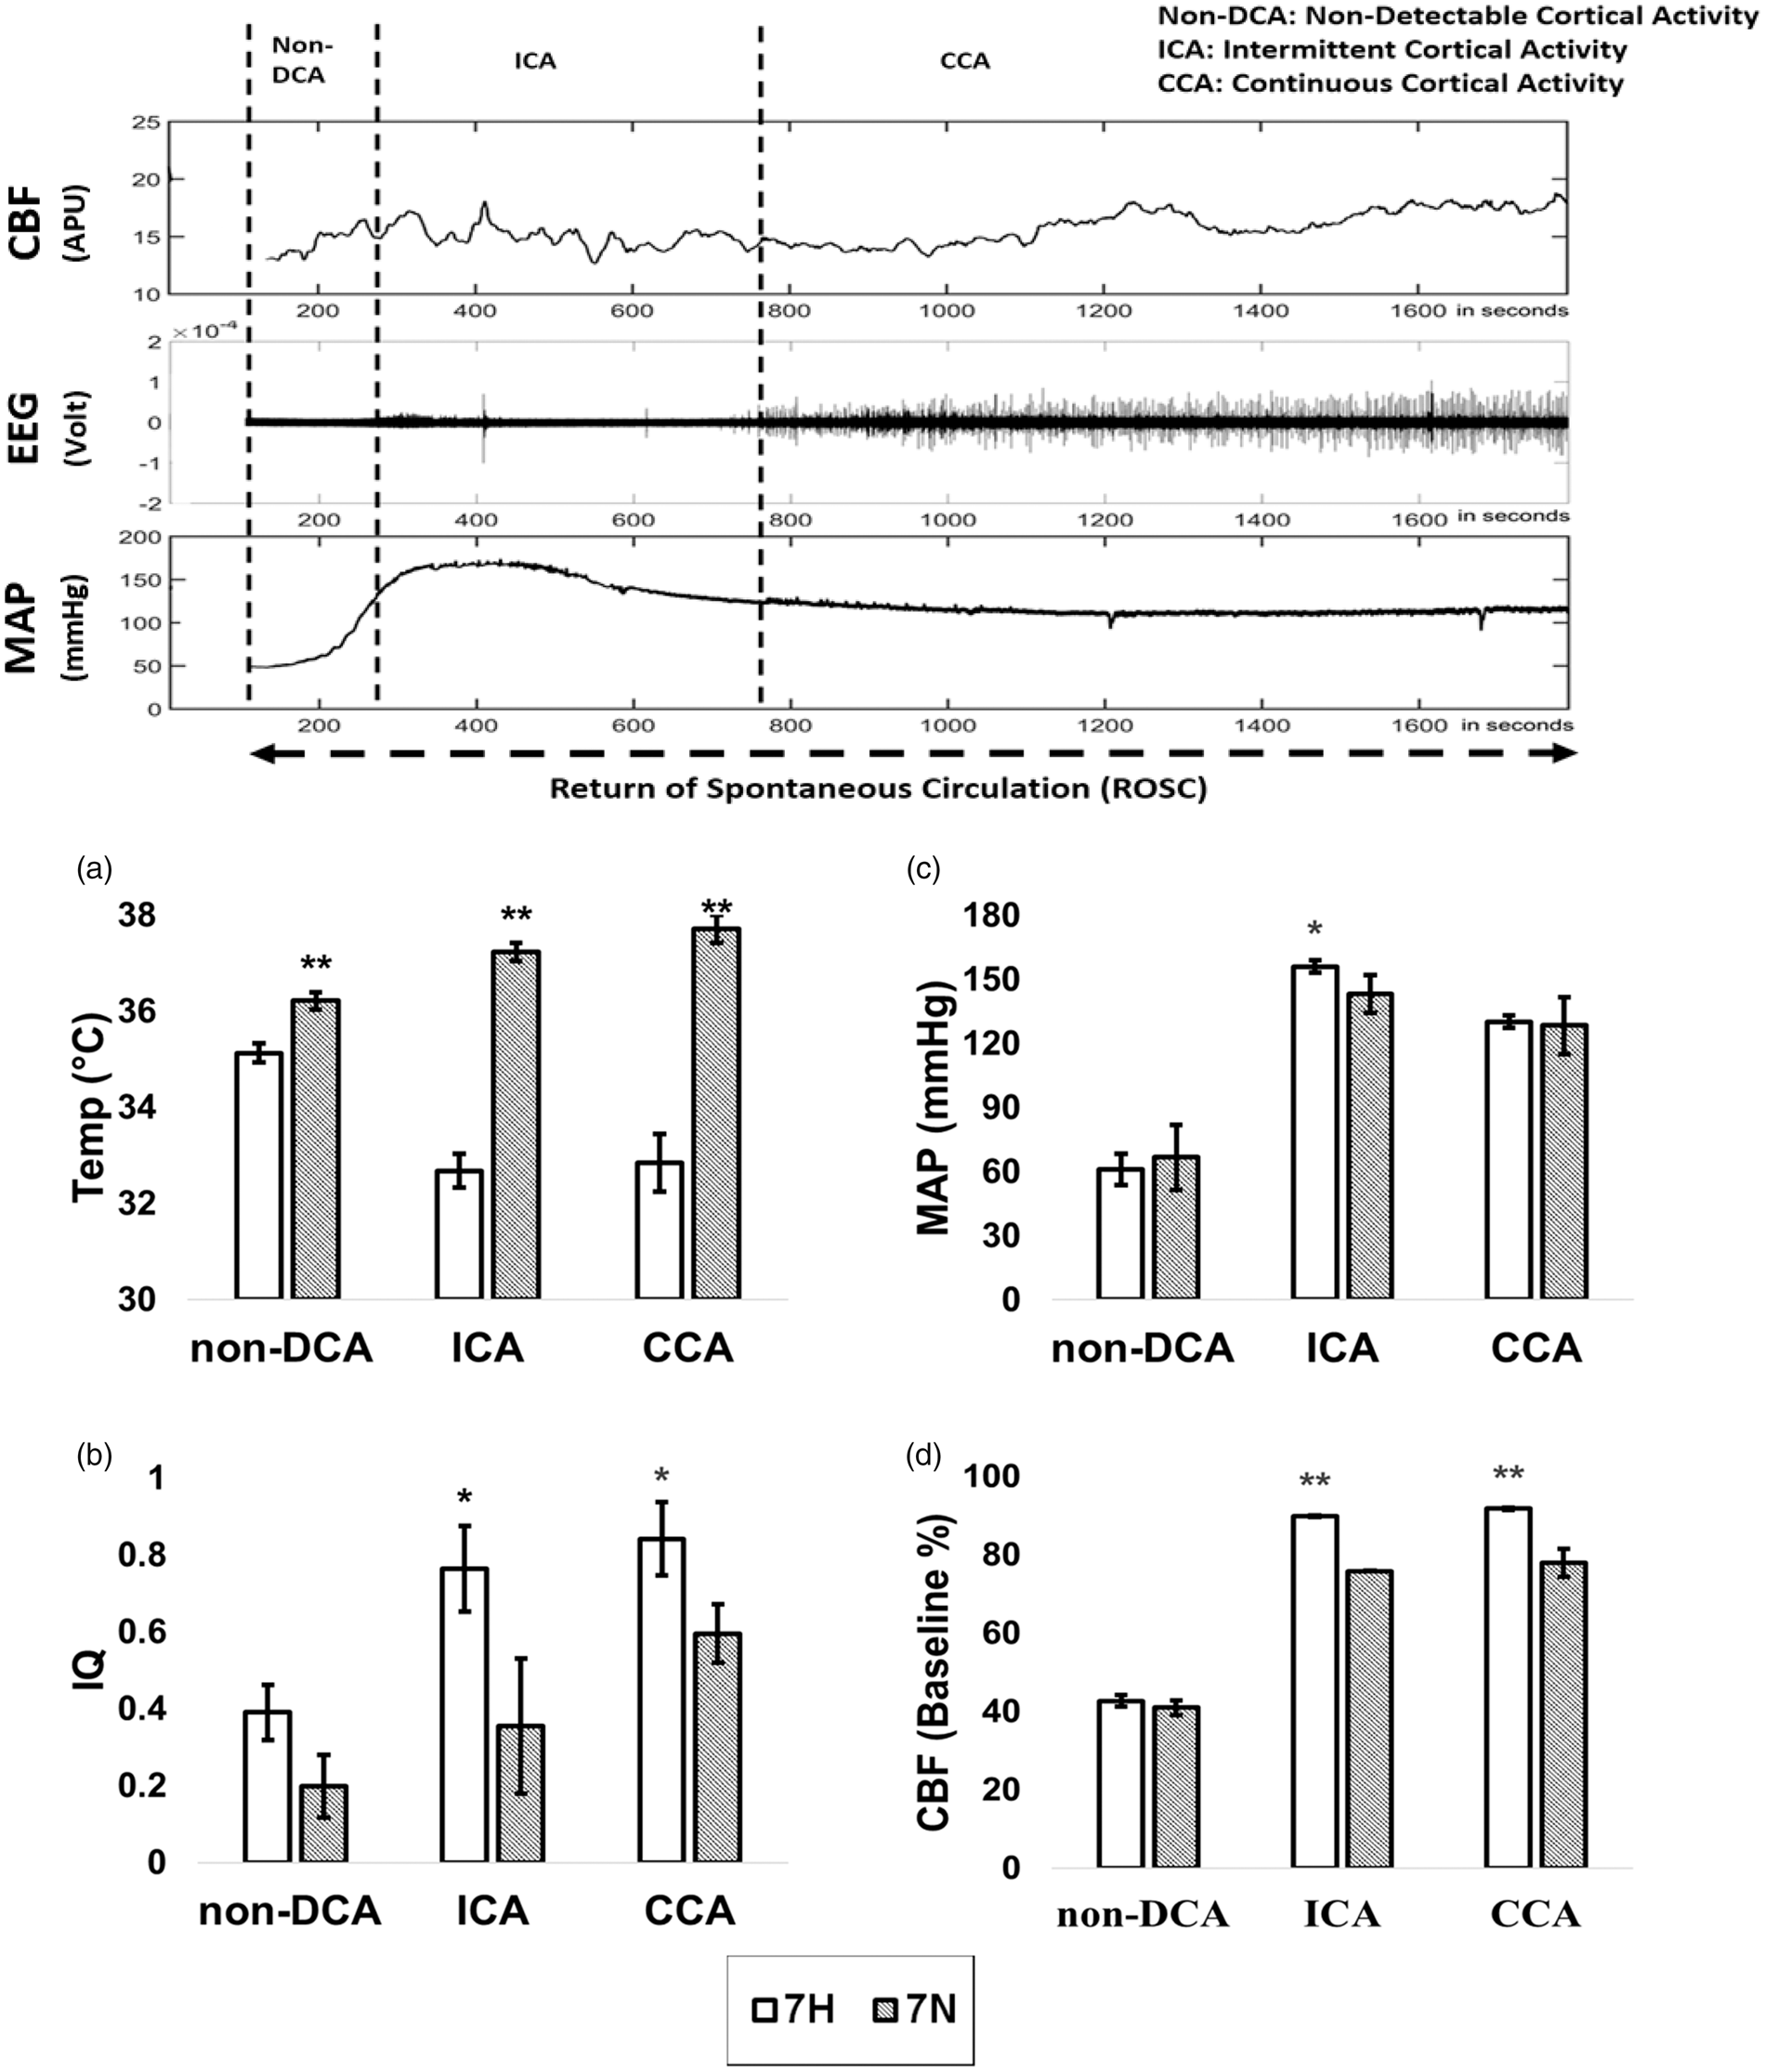
Discussion
Our previous studies done in the rodent model of CA and resuscitation showed that early delivery of hypothermia (immediately post-resuscitation) compared to the conventional hypothermia (delivered 1 hour post-resuscitation) leads to better functional outcomes after CA.13,25 A review of the clinical studies published from 2002 through 2014 related to targeted temperature management, including 2091 patients data, concluded that rapid cooling yielded a higher rate of good neurological recovery than slower cooling methods. 33 Hence, in the current study, we conducted cooling immediately after ROSC and achieved the target temperature in less than 5 min (Figure 2). Due to the recent development of the technology and innovations in rapid cooling, early and rapid cooling ought to be feasible not only in the laboratory but also in the clinical situations.34,35
In this study, we saw significantly improved NDS in 7 H rats compared to that of the 7 N rats at 4 and 24 h post ROSC (Figure 3(a)). We analyzed EEG data via the IQ algorithm.11,24 This quantitative EEG analysis was validated in our previous study about the effects of TH on the neurological recovery of the brain after CA. 13 IQ showed good tracking capability corresponding to the amplitude changes and frequency component changes. We measured the IQ from the EEG data and, based on the assumption that greater entropy corresponding to improved IQ represents better neurological brain status, the TH group indeed showed better and faster recovery of neurological signals (Figure 3(b)). These post-injury recovery results are consistent with the improved NDS measures. Previously, our research team published histological measures with cortex and hippocampus in TH group. The results showed that significant neuronal injury was noted in the first region area (Cornu Ammonis 1) of hippocampus as expected and there was significantly less neuronal cortical injury in the immediate TH group which correlated well with NDS and EEG recovery. 13
Although our studies demonstrated that TH should be applied as soon as possible after CPR, earlier studies did not clarify the pathophysiological mechanism. In this study, we used LSCI technology to quantify the CBF fluctuation post ROSC (Figure 1(d)). It was noteworthy that CBF was not automatically and sufficiently restored immediately post ROSC in the normothermia group (Figure 4(a)). Cerebral perfusion failure following the restoration of systemic circulation has been known to result in a poor outcome in animal models.14,18,36 For the animals that survive from CA, the typical sequence of CBF following ROSC is no-flow, hyperperfusion, hypoperfusion and ultimately restoration towards normal cerebral blood perfusion. The delayed hypoperfusion phase following ROSC puts the brain at risk for ischemia and secondary injury. In the current studies, we demonstrated that compared to the normothermia group, the TH group initiated a significantly higher and stable reperfusion flow (Figure 4(a)). Because TH reduces brain energy demand, the higher reperfusion should result in a better match of oxygen supply to oxygen demand.
During the early post-ROSC period, cerebral vascular resistance plays an essential role in changes of CBF: the longer the ischemic time, the higher the vascular resistance.15,19,37 Although earlier we defined the achievement of ROSC as generating MAP > 50 mmHg during CPR, the CBF did not arrive at the peak level until MAP gradually increased beyond 70 mmHg (Figure 4(a) and (b)). It took another 5 min to reach the CBF peak (Figure 4(a)) in our model. The time gap between ROSC and CBF peak arrival caused the brain extra ischemic injury due to extensive low perfusion. These results indicated that MAP should be kept at levels higher than commonly accepted for ROSC to secure the cerebral perfusion. This phenomenon might be explained by the variable critical opening pressures of microvascular beds, narrowing of capillaries by swollen astrocyte foot processes and endothelial cells, and local elevation of blood viscosity attributable to microcirculatory stasis and translocation of water from plasma and interstitium into depolarized neurons. Restoration of ATP, transcellular ionic gradients, and intracellular water content can take several minutes, depending on the duration of no flow.38,39 Recovery of cell swelling and capillary diameter is thought to be heterogenous among microvessels and could result in preferential increases in non-nutritive flow. 37 Reperfusion initiated by a hypertensive MAP is expected to open the more highly resistant areas of the cerebral microcirculation and overcomes the heterogeneous perfusion disturbance.40,41 Studies were done on the vascular obstructions after ischemia has shown that as the duration of ischemia time was increased, the amount of tissue affected by the vascular obstructions also increased in the brain, indicating that a narrowing rather than an occlusion of blood vessels caused the post-ischemic brain injury.42,43 In the present study, we observed that there was a significantly greater overshoot in the MAP in the 7 H group at 10 min post ROSC compared with the 7 N group (Figure 4(b)). This phenomenon is probably a reflection of the ongoing systemic beneficial effects of TH and may be due to an increase in systemic vascular resistance.44,45 Mild hypothermia is known to produce sympathetic vasoconstriction in skin, and mild hypothermia may potentiate the sympathoadrenal response that occurs soon after resuscitation. Studies have shown that mild hypothermia usually causes tachycardia and hypertension.46,47 A systematic review suggests that the CBF change may be opposite at 32℃ and 35℃ during hypothermia, with the CBF increased at mild hypothermia. 46 The time from onset of ischemia until the start of effective reperfusion is crucial for the efficient neuroresuscitation following CPR. So, our conclusion is that, if at all clinically possible (e.g. for in hospital or witnessed CA), TH should be started immediately following CPR to reduce the low-flow period. This result is in line with our earlier work that showed that early TH helped restored the neurological response (NDS and EEG) as well.13,26
Higher MAP has been shown to improve outcome following resuscitation in a clinical observation study, 48 but targeting a specific blood pressure threshold in general after CA is not recommended. The American Heart Association acknowledged that the evidence is lacking on the adequate MAP threshold after CA to maintain adequate cerebral blood perfusion. There is conflicting evidence for the association between MAP and neurologic outcomes after CA in the clinic.37,42,46,49–51 Based on the real-time CBF monitoring, ours is one of the first studies to monitor the early period post ROSC and demonstrate the cerebral hemodynamic fluctuations under TH. We found that TH not only initiated effective CBF restoration, but also led to a constant CBF after the post-ischemic hyperemia phase. Moreover, the real-time CBF in the normothermia group was not associated with MAP after the early hyperemia phase. The data from the normothermia group in the current study are consistent with one recent laboratory study that showed the CBF is decoupled for MAP, but linked to EEG bursting during the stabilized hypoperfusion period of ROSC in a CA model. 50 We also demonstrated that CBF was decreasing significantly compared to that of the TH group after the early hyperemia phase (Figure 4(a)). Only under the immediate TH treatment strategy was the CBF consistently at the plateau level. As is well known, under healthy condition, neuronal activation is accompanied by a local increase in CBF, as a result of neurovascular coupling. 52 Increases in CBF upon the activation of nearby neurons are important for matching the local delivery of oxygen and glucose to focal increases in the metabolic demand. Neurovascular coupling is impaired after most central nervous system damaging conditions such as ischemic stroke and subarachnoid hemorrhage.53,54 A mismatch between the CBF and the emergent neurological activity may therefore cause further damage of the brain. Study in a well-established model of neurovascular coupling showed that coupling was preserved during hypothermia. 55 Our data showed that EEG activity gradually resumed after the CBF hyperemic peak (Figure 5) and that TH provided not only an early and full recovery of CBF, but also stable perfusion after the hyperemia phase that was associated with the restoration of EEG activity (Figure 5(b) and (d)). Since CBF and MAP were uncoupled after the onset of continuous EEG activity (Figure 5(c) and (d)), using MAP guidance alone to manage the resuscitation is not likely to be adequate for neurological function recovery post CA. MAP combined with CBF monitoring is more likely to correlate with functional cortical recovery rather than MAP alone.
Furthermore, during the ICA and CCA stages (Figure 5(b) and (d)), higher MAP initiated earlier CBF restoration, which we suggest contributed to the greater recovery of the EEG metric, IQ, in the TH group than that in the normothermia group. If we only focused on the systemic arterial pressure, then we might not be able to correctly predict when the hyperemia was over. Consistently higher CBF in TH group showed a positive association with the neurological outcome even when MAP did not show significant difference between the two groups at CCA stage (Figure 5(c)). The MAP combined with CBF monitoring potentially serves as an important determinant of neurological outcome (as defined in our studies by the IQ of EEG and the NDS measures). This combined monitoring strategy could serve as a better early brain state monitoring scheme even before the full recovery of cerebral activity. In parallel, it also opens an intervention window for the CBF optimization or promotion therapy as well. Our approach of monitoring IQ of EEG and CBF provides the opportunities to achieve individualized cerebral homeostasis goals on improving outcomes of neuro-resuscitation following CA. The monitored approach may offer more precise TH treatments that would potentially improve the neurological outcomes for CA survivors.
There could be some detrimental effects with the mild hypothermia. Shivering, pneumonia, bleeding, hypoglycemia, sepsis, pulmonary edema, and bacterial translocation are some of the more common complications of TH. Seizures and cardiac arrhythmias may also occur in any patient following CA, regardless of whether hypothermia is induced. However, in contrast to deep hypothermia (<30℃), moderate or mild hypothermia does not induce arrhythmias; indeed, the evidence suggests that arrhythmias can be prevented and/or more easily treated under mild hypothermic conditions. 56 Although it was a concern that hypothermia could induce some detrimental effects such as hemorrhage, seizure or arrhythmias, the previously stated detrimental side effects with immediately mild TH were not present in our studies.
This study has limitations. First, these experiments were performed in a controlled laboratory setting in a relatively uniform group of healthy animals and we examined short-term (4, 24 h) neurological outcomes without addressing the long-term outcome in this trial. However, our previous studies showed that immediate TH resulted in better neurological outcome and long-term survival rate compared to that of the conventional TH. 13 Second, this study was conducted only on male rats. Despite sex differences favoring female in behavioral outcomes following hypoxic ischemic brain injury in rats, the results of a recent study showed that TH benefits neuropathology equally in both sexes. 57 Third, we did not monitor the brain temperature directly. In the future, we need to design a non-invasive brain temperature monitoring interface which will be feasible for clinical practice at early stage of ROSC immediately following CPR.
In conclusion, the present study demonstrates two critical points about CBF recovery that may contribute to improved neurological outcomes with the implementation of immediate TH protocol after ROSC in our model of asphyxial CA. Firstly, the early initial hypertensive MAP elicited soon after CPR is associated with effective CBF restoration after ROSC. Secondly, the consistency of stable blood flow maintenance during the delayed phase, when hypoperfusion normally occurs, is associated with improved EEG and neurologic recovery following early TH treatment. Whether the higher CBF with TH contributes to improved EEG recovery or the improved EEG recovery enhances CBF through neurovascular coupling cannot be discerned from these experiments. Nevertheless, this study demonstrates that improved reperfusion is one of the features of immediate hypothermic treatment after cardiac resuscitation.
Supplemental Material
Supplemental material for Therapeutic hypothermia promotes cerebral blood flow recovery and brain homeostasis after resuscitation from cardiac arrest in a rat model
Supplemental material for Therapeutic hypothermia promotes cerebral blood flow recovery and brain homeostasis after resuscitation from cardiac arrest in a rat model by Qihong Wang, Peng Miao, Hiren R Modi, Sahithi Garikapati, Raymond C Koehler and Nitish V Thakor in Journal of Cerebral Blood Flow & Metabolism
Footnotes
Funding
The author(s) disclosed receipt of the following financial support for the research, authorship, and/or publication of this article: This work was supported by NIH (R01 HL071568 Nitish V. Thakor). Peng Miao was supported by NSFC (61571284). Raymond C. Koehler was supported by R01 NS60307 and R21 NS095036. The authors would like to acknowledge the support for the statistical analysis from the National Center for Research Resources and the National Center for Advancing Translational Sciences (NCATS) of the National Institutes of Health through Grant Number 1UL1TR001079.
Acknowledgements
We would like to acknowledge the following undergraduate students for their assistant on the data collection, behavior testing and manuscript editing: Guosheng Wang (Cognitive Science, Case Western Reserve University) and Justin Cho (Behavioral Biology, Johns Hopkins University).
Declaration of conflicting interests
The author(s) declared no potential conflicts of interest with respect to the research, authorship, and/or publication of this article.
Authors’ contributions
NVT: supervised the project from conception to design, reviewed/edited the manuscript, and provided financial and administrative support. RCK: consulted and reviewed/edited manuscript. QW: animal experiments, data collection and manuscript preparation. PM: device development, hardware support, data collection, process and interpretation. HM: experiments assistant and data collection. SG: data process and interpretation. All authors contributed to manuscript revisions and approved the manuscript.
References
Supplementary Material
Please find the following supplemental material available below.
For Open Access articles published under a Creative Commons License, all supplemental material carries the same license as the article it is associated with.
For non-Open Access articles published, all supplemental material carries a non-exclusive license, and permission requests for re-use of supplemental material or any part of supplemental material shall be sent directly to the copyright owner as specified in the copyright notice associated with the article.