
Abstract
Brain injury is the main cause of mortality and morbidity after cardiac arrest (CA). Changes in cerebral blood flow (CBF) after reperfusion are associated with brain injury and recovery. To characterize the relative CBF (rCBF) after CA, 14 rats underwent 7 min asphyxia-CA and were randomly treated with 6 h post-resuscitation normothermic (36.5–37.5℃) or hypothermic- (32–34℃) targeted temperature management (TTM) (N = 7). rCBF was monitored by a laser speckle contrast imaging (LSCI) technique. Brain recovery was evaluated by neurologic deficit score (NDS) and quantitative EEG – information quantity (qEEG-IQ). There were regional differences in rCBF among veins of distinct cerebral areas and heterogeneous responses among the three components of the vascular system. Hypothermia immediately following return of spontaneous circulation led to a longer hyperemia duration (19.7 ± 1.8 vs. 12.7 ± 0.8 min, p < 0.01), a lower rCBF (0.73 ± 0.01 vs. 0.79 ± 0.01; p < 0.001) at the hypoperfusion phase, a better NDS (median [25th–75th], 74 [61–77] vs. 49 [40–77], p < 0.01), and a higher qEEG-IQ (0.94 ± 0.02 vs. 0.77 ± 0.02, p < 0.001) compared with normothermic TTM. High resolution LSCI technique demonstrated hypothermic TTM extends hyperemia duration, delays onset of hypoperfusion phase and lowered rCBF, which is associated with early restoration of electrophysiological recovery and improved functional outcome after CA.
Keywords
Introduction
More than 350,000 cases of cardiac arrest (CA) are reported each year and approximately 10.6% among them survive to hospital discharge. 1 Despite recent advances in patient care, brain injury remains the major cause of morbidity and death among CA victims. 2 The derived neurologic deficit is a consequence of both the primary ischemic injury and the subsequent “reperfusion injury.” 3 Recirculation after CA is the hallmark of successful resuscitation with the initial period of recirculation being paramount in both brain injury and recovery. Identifying regional and temporal changes in cerebral blood flow (CBF) during and after CA can provide a better understanding of the mechanism of ischemia-reperfusion injury. However, monitoring and quantifying these transient changes in CBF after CA in a wide field of view with high spatial and temporal resolution, is currently not available due to significant technical challenges.
In the past two decades, laser Doppler flowmetry (LDF), 4 positron emission tomography (PET), 5 magnetic resonance imaging (MRI), and two-photon laser scanning microscopy (TPLSM) 6 have been used to monitor CBF changes in laboratory and pre-clinical studies of CA. However, CBF information obtained by LDF is constrained to a very small volume (1 mm3) of tissue; PET is well known for its limited resolution; MRI is costly and requires the injection of contrast agents; and TPLSM is expensive to facilitate and requires a fluorescent contrast agent. Meanwhile, with inexpensive and relatively simple setup, our newly developed laser speckle contrast imaging (LSCI), an emerging neuroimaging technique, quantifies blood flow velocity, blood volume, vessel dilatation, constriction responses, and deoxy-hemoglobin saturation changes.7–11 The feasibility and sensitivity of LSCI have been validated in the intraoperative CBF assessment during neurosurgery, affording the advantages of visualization and measurement of relative changes in CBF.12,13
Despite debate over optimal maintenance temperatures, targeted temperature management (TTM) remains the most effective means of neuroprotection in clinical trials of CA.14,15 We pioneered the development of various electrophysiological markers to predict neurological recovery after TTM in the CA model,16–24 and evaluating the effect of hypothermic TTM on the electrophysiological signals and CBF.7,24–26 Hypothermic TTM decreases both CBF and neurometabolism.27,28 However, the exact effect of TTM on CBF, in addition to electrophysiological and functional outcomes after CA, has yet to be elucidated. Using a clinically relevant rat asphyxia-CA model, we apply a recently self-developed LSCI system with a wide field capability and high spatial and temporal resolution7,8,29 to evaluate real-time CBF changes during and after CA under normothermic or hypothermic TTM conditions. To our knowledge, this is the first report on continuous CBF monitoring at the level of individualized vessels with high spatial and temporal resolutions in the setting of CA.
Materials and methods
Animals and treatment
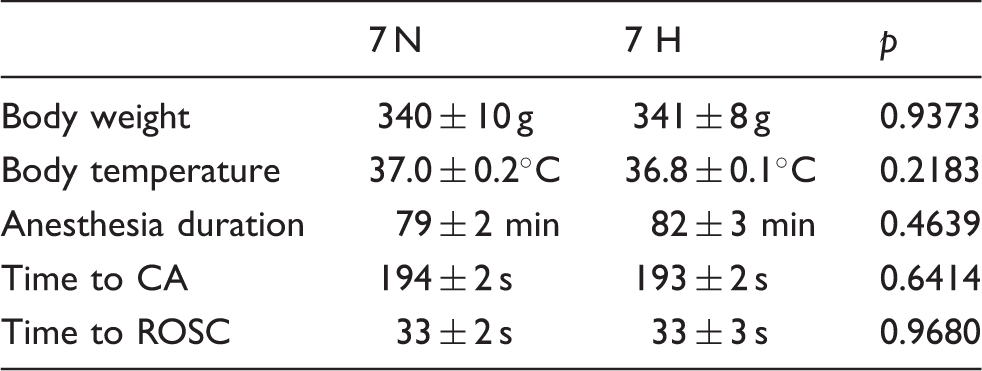
All experiments were performed using a protocol approved by the University of Maryland Animal Care and Use Committee. All procedures were compliant with National Institutes of Health Guide for the Care and Use of Laboratory Animals. Reporting in vivo experiments complies with ARRIVE guidelines. Two groups (n = 7/group) of adult male Wistar rats (Charles River, Wilmington, MA) with body weights between 280 and 360 g (seven to eight weeks old) underwent 7 min asphyxia-CA under normothermia (36.5–37.5℃) or hypothermia (32–34℃) conditions randomly, as we published.16,17 One day before CA, rats were anesthetized by 1.5% Isoflurane and fixed in a stereotactic frame (David Kopf instruments, Tujunga, CA, USA). A midline incision was made over the scalp. A cranial window was opened at the left hemisphere with 7 mm × 5 mm area centered at AP, −1; ML, −2.5, as described previously. 10 Three epidural screw electrodes (Plastics One, Roanoke, VA) were implanted in the right hemisphere, as previously described. 19 The cranial window was encircled by a cylinder base (laboratory-designed, height: 4.2 mm, radius: 5.5 mm, thickness: 0.5 mm) that was connected to the imaging system. The cylinder base was fixed on the skull by dental cement. All procedures were performed under standard sterile conditions. Rectal temperature was maintained at 36.5–37.5℃ using a heating pad for the duration of the surgery.
Experimental protocols
Asphxial-CA animal model and TTM
We used our previously developed and extensively published experimental protocol to induce CA and resuscitation in rats.16–19,24,30 On the day of CA, rat was intubated and then ventilated with 1.5% isofluorane mixed with 1:1 oxygen:nitrogen. Cannulations of the femoral artery and vein were then performed for drug administration and monitoring of mean arterial pressure (MAP). After cannulation, a 5-min baseline EEG measurement with 1.5% isofluorane was recorded. A washout period with 100% oxygen for 2 min and room air for 3 min followed the baseline recording in order to prevent the effect of anesthesia on signals. During the last 3 min of the washout period, rats were paralyzed via an i.v bolus injection of vecuronium (2 mg/kg). CA was induced by clamping the breathing circuit and disconnecting the ventilator for 7 min. Time to CA was recorded when pulse pressure was <10 mmHg. Cardiopulmonary resuscitation (CPR) was initiated immediately after asphyxia with oxygenation, sternal chest compressions, epinephrine, and NaHCO3 until MAP > 60 mmHg, which we defined as return of spontaneous circulation (ROSC). The arterial blood gases were measured from the femoral artery via cannulation at 20 min after ROSC.
Core temperature was measured with a rectal probe and recorded periodically. The normothermia group was maintained at 36.5–37.5℃ for 8 h after ROSC. Hypothermia was induced immediately after ROSC by surface cooling with misted water to achieve the target temperature of 32–34℃ within 15 min. 19 The core temperature was maintained between 32℃ and 34℃ for 6 h. Rats were then gradually re-warmed to 37.0℃ within 2 h. To ensure that no temperature fluctuation occurred after the TTM, such as spontaneous hypothermia, all animals were kept inside a neonatal incubator at 28℃ for the first 24 h post-TTM. 19
LSCI and image processing
The miniature laser speckle imaging system was used to record CBF. An 8-bit COMS camera (DCC1240C, Thorlabs) was mounted on the cylinder base over the skull to capture images; a laser diode (780 nm; 10 mW; L780P010, Thorlabs) was powered by a driver module (LDC220C, Thorlabs) to illuminate the cranial window. Laser speckle images (640 × 640 pixels) were acquired at 50 fps (exposure time T = 5 ms). In each trial, we recorded 320 consecutive frames of speckle images. Continuous image acquisition began at the anesthesia washout period and continued until 4 h after ROSC. After excluding artificial and noisy images, laser speckle contrast analysis was implemented to obtain CBF information. The relative CBF (rCBF) velocity changes over time in the selected region of interest (ROI) were normalized to baseline at the washout period. The vascular patterns were extracted and segmented using a region growing algorithm from the LSCI image. Then, the major arteries and veins were recognized according to the LSCI and anatomical characteristics. 31 Within the cranial window, three of the largest superficial cerebral veins and the two largest arteries were selected. The rCBF changes in an individual cortical artery or vein were calculated. After selecting an ROI in the center of the primary motor cortex (M1) with a size of 1 mm × 1 mm (centered at AP, −1.5; ML, −0.5), we further acquired and quantified the mean rCBF velocity changes of capillaries in M1 by eliminating cortical vessels from the images. 10 The overall rCBF of the rat was calculated by further averaging the rCBF of veins, arteries, and capillaries.
EEG recording, quantification and neurological deficit score
The EEG was continuously recorded at baseline, during CA and 4 h after ROSC as we previously described.17–19 Signals were examined for noise, both in the time domain using TDT software and in the frequency domain using MATLAB (Mathworks, Natick, MA). Artificial signals were blindly excluded in the final analysis. To objectively track EEG recovery after CA, our previously developed and well-validated electrophysiological marker, quantitative EEG-information quantity (qEEG-IQ), was calculated by an entropy-based informational quantification method.17–19,22 The qEEG-IQ was computed every 10–15 min and normalized to baseline. A qEEG-IQ of 0 was indicative of no brain activity and was assigned to dead animals, while a higher qEEG-IQ was indicative of higher entropy with better brain activity recovery. We have verified qEEG-IQ as a prognostic marker early after ROSC for functional outcomes 72 h after resuscitation, while rats remain in comatose and are treated with TTM.17–19
The neurological deficit score (NDS) of each animal ranged from 0 to 80 based on a series of behavioral tests 17 including arousal, brain stem function, sensory and motor assessment, motor function, and simple behavioral responses was blindly tested at 6 h, 24 h, 48 h and 72 h after ROSC. Our established and well-verified NDS examination was performed by a trained examiner blinded to groups and the primary outcome measure of this experiment was defined as the 72-h NDS score, as we published.16–19
Statistical analysis
A commercial statistical computer program (IBM SPSS Statistics, version 22, Armonk, NY) was used to analyze the data. Nonparametric analysis of variance with repeated measures was used to compare the NDS among groups. The parametric test results were reported as mean ± S.E.M. One-way analysis of variance (ANOVA) as a repeated measurement with Student–Newman–Keuls (SNK) analysis or multiple comparisons were performed to compare time interval aggregated rCBF. A p-value <0.05 was considered significant.
Results
Real-time imaging and quantification of CBF by LSCI
Main experimental procedures and timeline for LSCI/EEG recording are summarized in Figure 1(a). A simplified LSCI equipment setup was indicated in Figure 1(b), including a laser driver, a laser diode, a camera, and a computer system. After selecting ROI and then transforming it to an LSCI image (Figure 1(c)), we showed representative high resolution CBF images with dynamic changes during and after CA in Figure 1(d) and the quantified rCBF in Figure 1(e). CBF decreased dramatically or stopped entirely during CA and then increased to and surpassed baseline values immediately after ROSC, representing a reactive hyperemia phase; 20 min after ROSC, CBF decreased below the baseline level, entering a prolonged hypoperfusion phase until at least 90 min after ROSC. However, there were no visually distinguishable differences among the two groups of CA. After the CBF of each rat was quantified and normalized to its own baseline via a custom algorithm, the subtle changes in rCBF after ROSC are shown in Figure 1(e).
(a) Experimental design and procedures; (b) LSCI recording setup; (c) Example of ROI transformation to a LSCI image; (d) Averaged CBF images at 1 min bin of a representative rats for each group, with BSL indicating baseline, CA occurring at 5 min, and 7 min indicating the time following asphyxia; ROSC 3–60 min indicates time after ROSC; (e) rCBF quantified at the same time point as depicted in (d). Black line represents 7 min normothermia group, red line represents 7 min hypothermia group.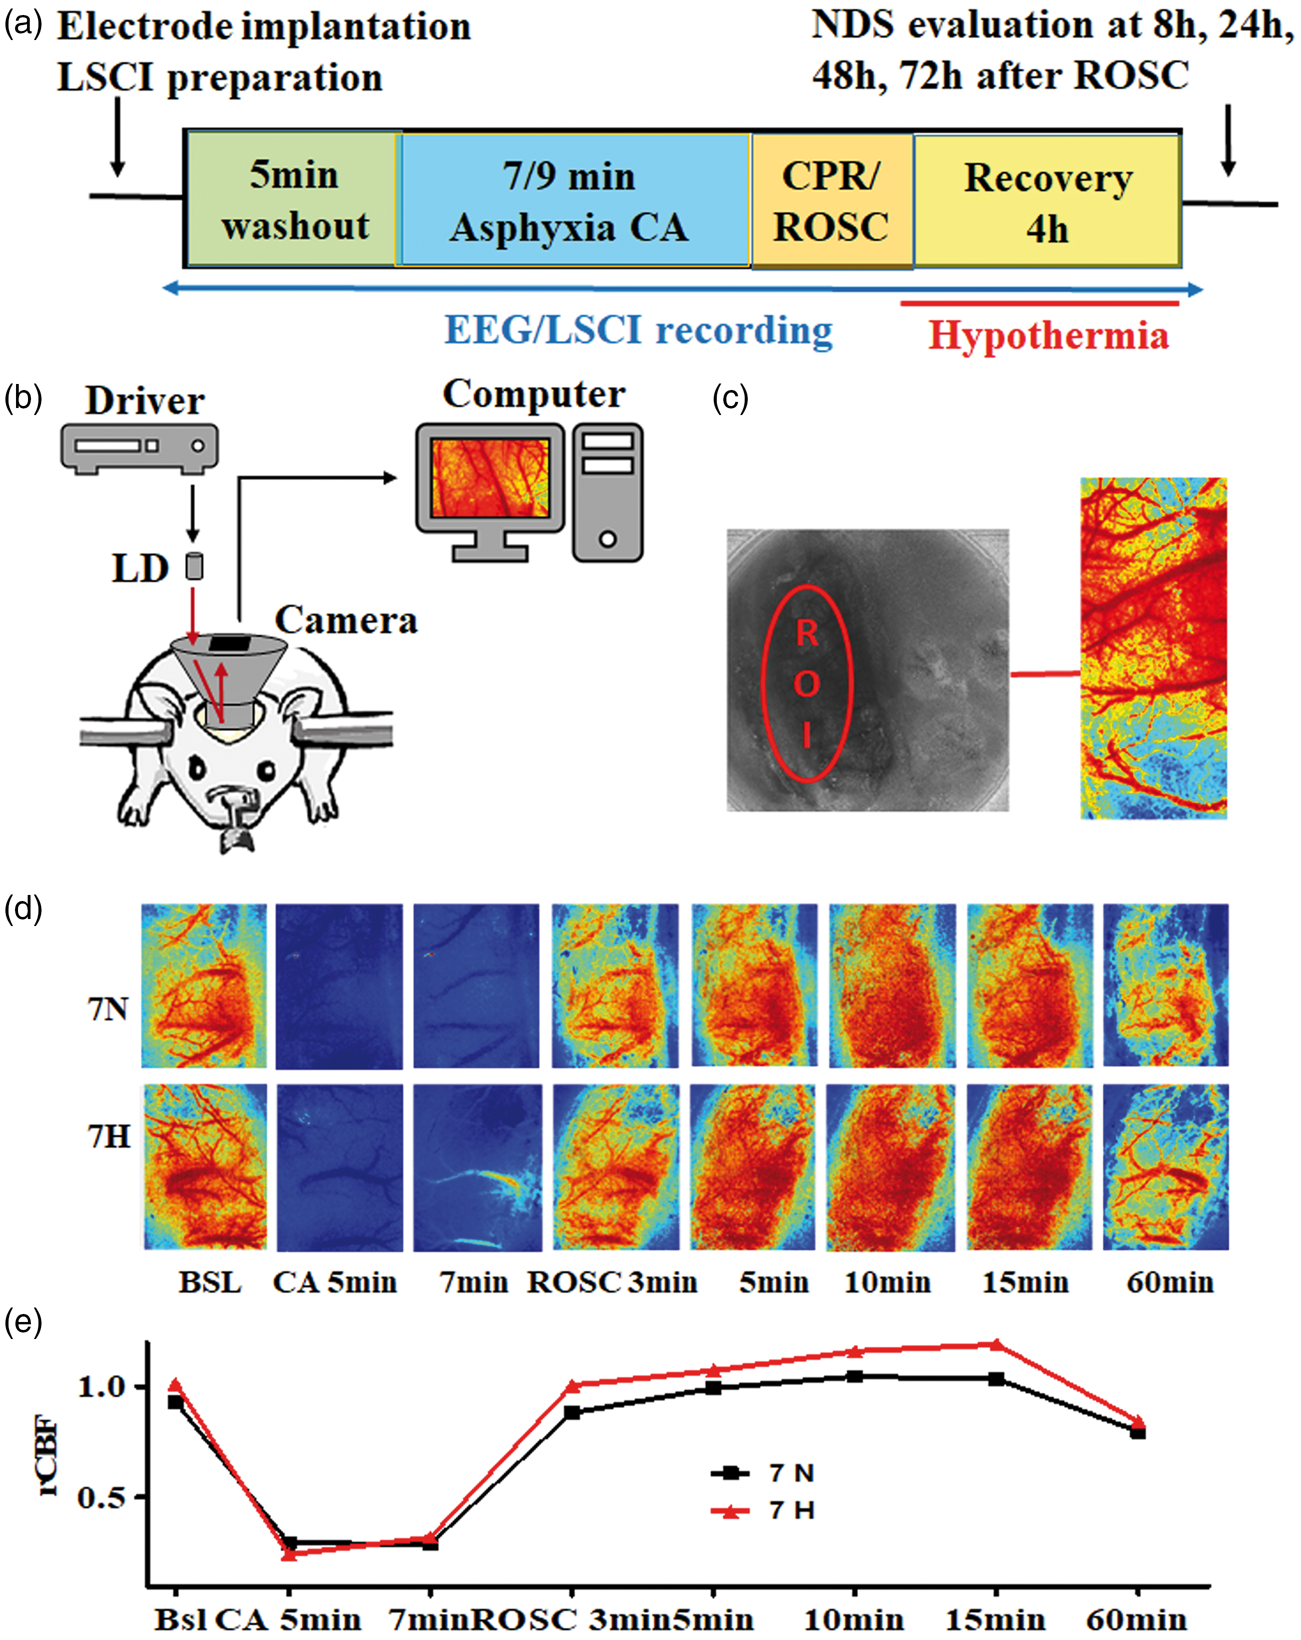
Real-time quantification of rCBF showed regional response of veins to CA
A representative ROI selection of veins is shown in Figure 2(a). The three largest superficial cerebral veins from rostral to caudal responded differently to CA. Three characteristic phases of rCBF after asphyxia were shown: a no-flow phase during asphyxia, a transient hyperemia phase immediately after ROSC, and a subsequent hypoperfusion phase (Figure 2(c)). There was no difference in rCBF among the veins at baseline and during asphyxia but, time interval data from the hyperemia phase (3–12 min after ROSC) showed that the rostral vein had a higher rCBF than both the middle and caudal veins (1.11 ± 0.03 vs. 1.03 ± 0.18 vs. 1.01 ± 0.02; p < 0.01). The hypoperfusion phase (20–90 min after ROSC) conversely showed that the rostral vein had a lower rCBF than that of the middle and caudal veins (0.77 ± 0.01 vs. 0.85 ± 0.01 vs. 0.89 ± 0.01; p < 0.001) (Figure 2(b) and (c)).
The rCBF responses of veins following 7 min CA in normothermia animals. (a) A representative LSCI image showing ROI for vein 1, 2, and 3 ordered from rostral to caudal; (b) rCBF comparison of veins before, during asphyxia, and until 90 min after ROSC. (c) rCBF of veins quantified at 1 min bin. BSL indicates baseline. “I, II, III” represents the characteristic CBF phases during and following CA: I: no flow or reduced flow phase; II, reactive hyperemia phase (3–12 min after ROSC) and III, hypoperfusion phase (20–90 min after ROSC). **p < 0.01; ***p < 0.001.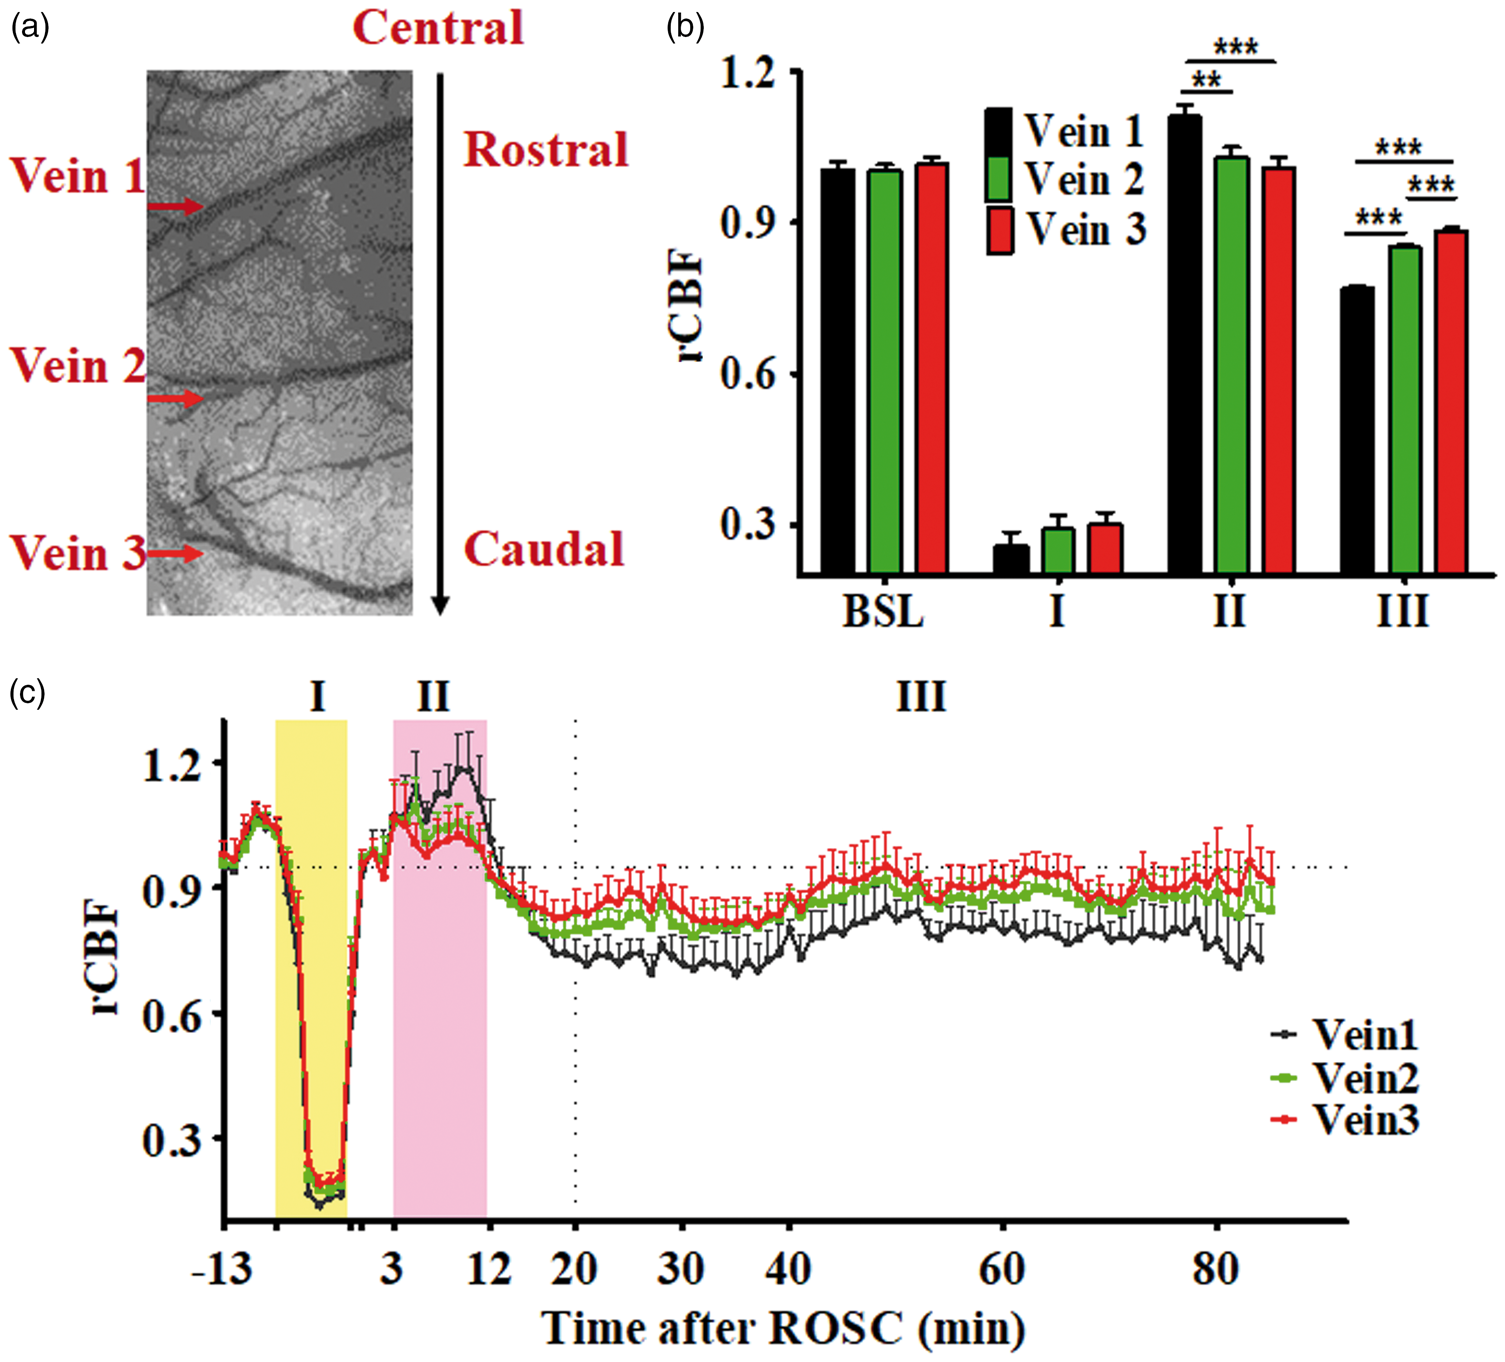
Real-time quantification of rCBF showed heterogeneous responses by the vascular system in response to CA
A representative selection of ROI for the three components of vascular system is shown in Figure 3(a). It is shown that capillaries in the M1 region had a higher rCBF than that of venous and arterial in the hyperemia phase (3–12 min after ROSC) (1.11 ± 0.03 vs. 1.05 ± 0.02 vs. 1.02 ± 0.01; p = 0.01). An opposite trend was seen during the hypoperfusion phase, such that the capillary had a lower rCBF than that of arterial or venous (0.68 ± 0.01 vs. 0.79 ± 0.01 vs. 0.84 ± 0.01; p < 0.001) (Figure 3(b) and (c)).
The rCBF responses of veins, arteries, and capillaries following CA injuries in 7 min CA normothermia animals. (a) LSCI image showing ROI, with green arrows indicating the three largest superficial veins and red arrows indicating the two largest arteries. The blue circle indicates capillaries in the M1 region. (b) Averaged rCBF changes in veins, arteries and capillaries before, during asphyxia, and until 90 min after ROSC. (c) rCBF quantified at 1 min bin. BSL indicates the rCBF at baseline. “I, II, III” represents the characteristic CBF phases during and following CA: I: no flow or reduced flow phase; II, reactive hyperemia phase (3–12 min after ROSC) and III, hypoperfusion phase (20–90 min after ROSC). *p < 0.05; ***p < 0.001.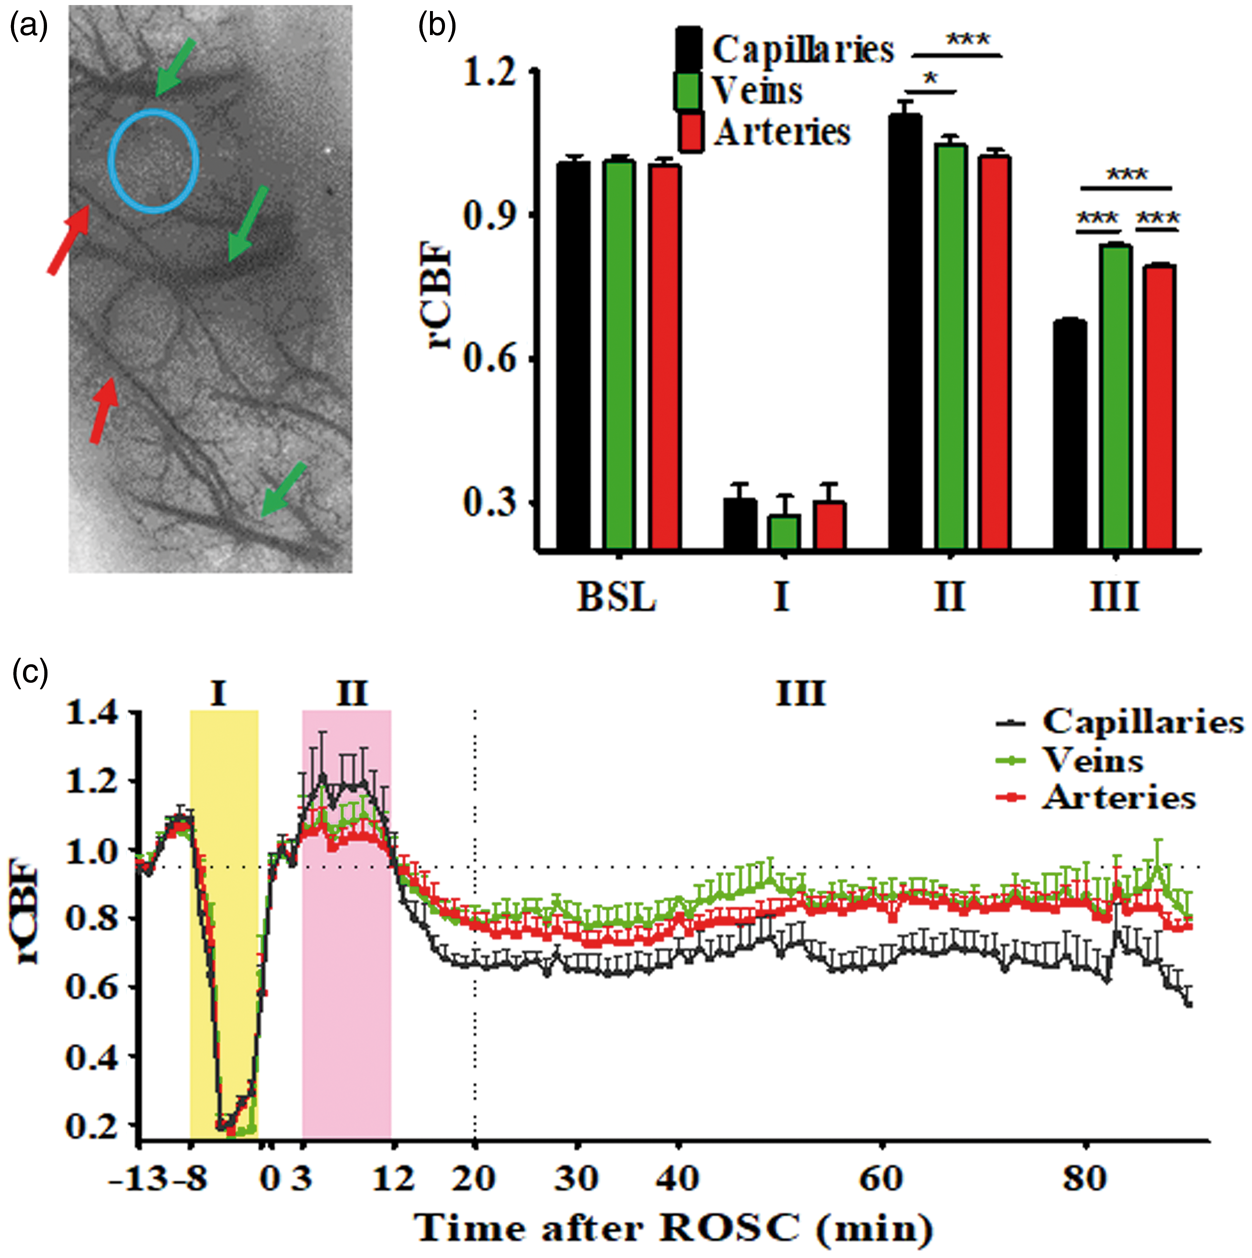
Baseline characteristics and temperature management of experiment animals
Baseline body weight, temperature, and duration of preparation.
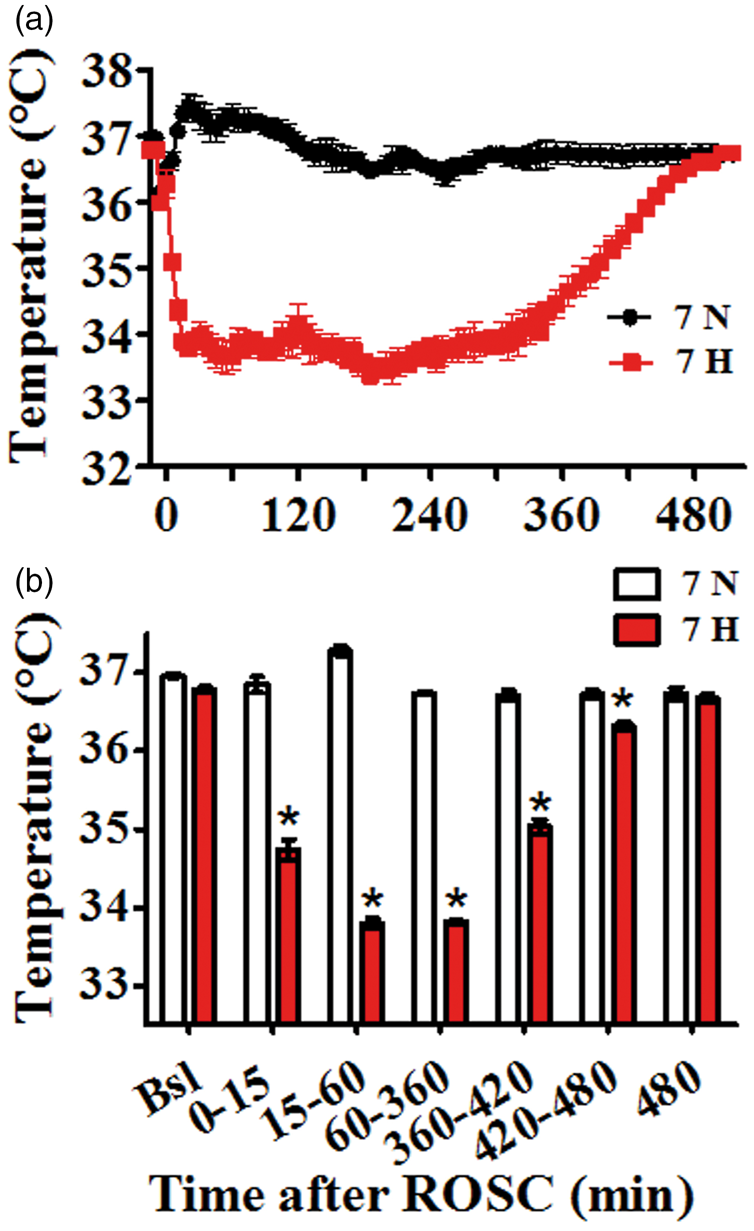
(a) Temperature recording of experiment animals. (b) Comparison of temperature between 7H and 7N at various time intervals. *p < 0.001. Blank line/bar represents 7 min normothermia group, and red line/bar represents 7 min hypothermia group.
Functional and electrophysiological recovery
NDS in the 7H group at 8 h was significantly higher than the 7N group (median [25th–75th], 52 [50–60] vs. 42 [28–45]. p < 0.05) (Figure 5(a)). Overall accumulated NDS in the 7H group was higher than the 7N group (74 [61–77] vs. 49 [40–77], p < 0.01) (Figure 5(b)). qEEG-IQ in the 7H group was significantly higher than the 7N group at the period of 45–60 min (0.89 ± 0.05 vs. 0.65 ± 0.02, p < 0.01), 75–90 min (0.91 ± 0.05 vs. 0.74 ± 0.03, p < 0.05), and 105–120 min (1.01 ± 0.05 vs. 0.79 ± 0.03, p < 0.05) after ROSC (Figure 5(c)). Accumulated qEEG-IQ in the 7H group was significantly higher than the 7N group between 45 and 210 min after ROSC (0.94 ± 0.02 vs. 0.77 ± 0.02, p < 0.001) (Figure 5(d)).
Comparison of neurologic recovery between hypothermic and normothermic groups (a) NDS at 8 h, 24 h, 48 h, and 72 h. “°” indicate outliers and “*” indicate extreme values; (b) Accumulated NDS from 8 h to 72 h. Box-plot indicates median and interquartile range. Wiskers indicates 1.5 times interquartile range; (c) qEEG-IQ at 10–15 min bin; (d) Accumulated qEEG-IQ between 45 and 210 min after ROSC; *p < 0.05, **p < 0.01, ***p < 0.001.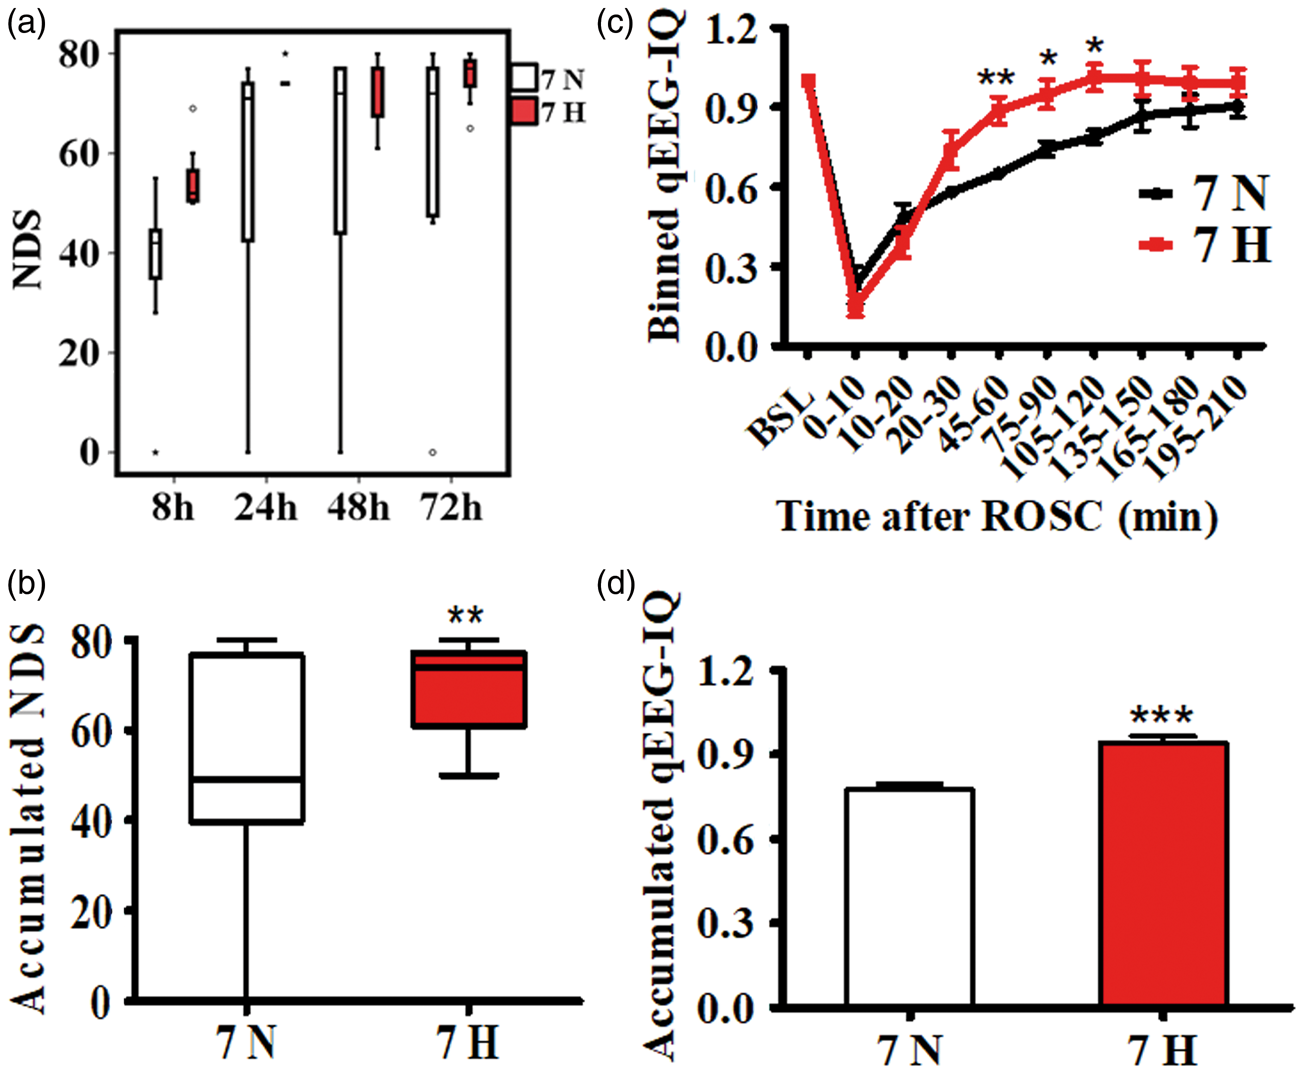
Hypothermia effect on rCBF after CA
After averaging rCBF across veins, arteries, and capillaries of the same animal, the effect of hypothermia on rCBF was examined by comparing the two temperature groups that underwent 7-min CA (Figure 6). There was no significant difference between groups at baseline (I) and during CA (II) as hypothermia had not yet been initiated (Figure 6(a)). With immediate hypothermic TTM after ROSC, the duration of the hyperemia phase was prolonged (19.7 ± 1.8 vs. 12.7 ± 0.8 min, p < 0.01), leading to a delayed onset of the hypoperfusion phase (Figure 6(a)). During the early hyperemia phase (1–10 min after ROSC), the aggregated rCBF in hypothermia animals was lower than that in normothermia animals (1.02 ± 0.02 vs. 1.07 ± 0.02; p = 0.048). During the late hyperemia phase (10–28 min after ROSC), the rCBF was higher in the hypothermia group than in the normothermia group (0.93 ± 0.01 vs. 0.80 ± 0.01; p < 0.001). During the hypoperfusion phase (40–90 min after ROSC, IV), the aggregated rCBF in the hypothermia group was lower than that of the normothermia group (0.73 ± 0.01 vs. 0.79 ± 0.01; p < 0.001) (Figure 6(b)).
A comparison of rCBF between normothermic and hypothermic animals. (a) Averaged rCBF at 1 min bin. (b) Averaged rCBF at the indicated period after ROSC. “I, II, III, IV” indicate baseline (I), CA period (II), hyperemia phase (III) and hypoperfusion phase (40–90 min after ROSC, IV) ***p < 0.001.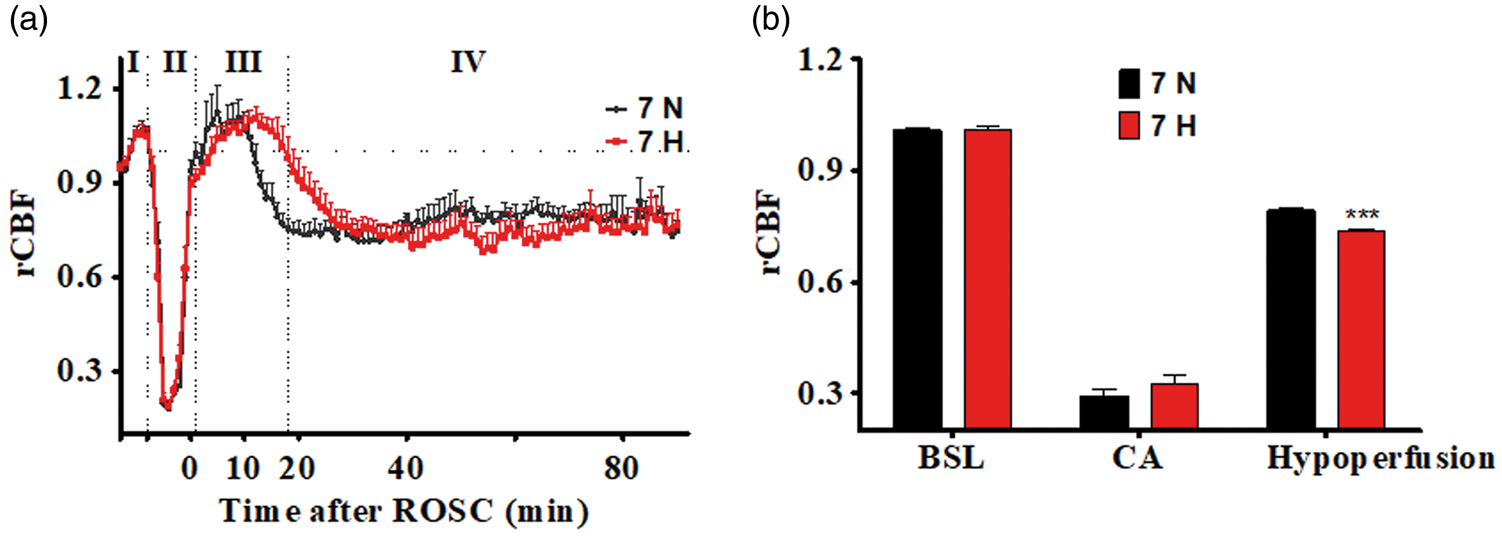
Discussion
In this study, our novel LSCI imaging technique with high spatiotemporal resolution and accurate quantification capacity was applied for the first time in an asphyxia-CA rat model to monitor the real-time transient and subtle changes of rCBF. Unlike in stroke models, CPR makes the CA model a very challenging model for LSCI study. We modified the LSCI equipment which was fixed in the skull without motion artifacts during the surgery and recording to fit it to CA settings, leading to the first application of LSCI in CA research, with a continuous recording of CBF and the ability to capture delicate changes. We further demonstrated that (1) The regional differences in rCBF among veins of distinct cerebral areas were identified at the level of individual vessels. (2) For the first time, the rCBF of three components of the vascular system, arteries, veins, and capillaries were found to respond with different level of sensitivity to CA-induced ischemia-reperfusion. (3) Hypothermia immediately following ROSC had a longer hyperemia duration, a delayed onset of the hypoperfusion phase with a lower rCBF, a better NDS, and higher qEEG-IQ compared to normothermia.
Characterization of rCBF at the level of individualized vessels with high resolution could help identify the mechanisms of CBF dysregulation after CA and lead to prospective vessel type specific therapeutic strategies. We showed for the first time that there are regional responses of rCBF across the venous system and distinct sensitivity levels of the rCBF response among the three components of vascular system following CA. Characterization of the regional pattern of reperfusion after CA could help identify the vulnerable tissue, discern the mechanisms of CBF regulation after CA, and thus facilitate region-specific treatment strategies. Acute brain injury leads to pathological changes in the venous system. 32 The regional response of the superficial cerebral veins may reflect localized dysregulation of vascular tone (resistance), which refers to the degree of constriction experienced by a blood vessel relative to its maximally dilated state, and was affected by intrinsic factors including local hormones/chemical substances and metabolic by-products. 33 The brain-regional ischemic vulnerability and its underlying mechanism remain unclear. Higher CBF in the hyperemia phase and lower CBF in hypo-perfusion phase of the rostral vein than the caudal vein may underlie the rostral vulnerability of the brain to ischemia in clinical practice and animal models.34,35
Distinct responses of rCBF among arteries, veins, and capillaries to CA-induced ischemia-reperfusion injury suggest a disharmony of CBF regulation within the vascular system. During the hyperemia phase, rCBF of the capillaries increased more than that of the veins and the arteries. Conversely, during the hypoperfusion phase, the rCBF of the capillary decreased more than in the artery or veins. This reflects a distinctly regulated vascular tone among the three types of vascular structures. Initially, CBF was thought to be controlled by arterioles rather than capillaries; 36 however, this concept was challenged recently as it was shown that capillaries not only participated in functional hyperemia, but also help maintain brain vascular resistance.37,38 In contrast, large arteries and veins had less reactive tone than microvessels and capillaries. 33 This may explain why we observed greater changes in the capillaries in both the hyperemia and hypoperfusion phases. On the other hand, these distinct responses among vascular system components may also represent a redistribution of circulatory blood among the vascular system after CA, supporting the emerging idea that management of acute brain injury should shift its focus from reperfusion to recirculation. 32
We showed how hypothermia affects rCBF after CA in a higher level of detail than previously conducted and showed that hypothermia benefited neurological recovery through changes in CBF. In our study, hypothermia was induced immediately after ROSC, resulting in a prolonged hyperemia phase, and delayed but augmented hypoperfusion. This was consistent with reports from both an asphyxia CA model with hypothermia induced before CA 39 and a bilateral occlusion and release of the common carotid arteries (BCCAO) model with hypothermia induced during global ischemia. 40 Little is known about the etiology and management of hyperemia immediately after ROSC. Whether the hyperemia phase is beneficial or detrimental is still unknown. 41 Our results showed that hypothermia prolongs the duration of hyperemia. We have previously reported that conventional hypothermia initiated 1 h after ROSC had less favorable outcomes than immediate hypothermia. 18 Conventional hypothermia should not impact the hyperemia phase since hyperemia lasts less than 15 min at normothermia. Thus, it may indicate that a longer hyperemia phase is beneficial to neurological recovery.
Bearing limitation such as being un-wearable and unable to overcome motion artifacts, commercialized LSCI equipment such as PeriCam PSI (Perimed, Sweden) has been applied clinically for skin microcirculation blood perfusion.42,43 Several experimental clinical trials of LSCI to measure CBF have been documented;13,44–48 however, clinical applications still needs FDA approval, which is currently in progress in several countries. Despite a wide range of applications targeting blood flow in brain, skin, retina et al., the LSCI technique is limited by a shallow blood flow sampling depth, which predominantly reflects only the superficial blood flow of biological tissue. Thus, CBF of deep tissue such as the hippocampus may not be detected by LSCI.
In summary, dynamic rCBF changes after CA were characterized in greater details than ever before by taking advantage of the high spatiotemporal resolution and wide field view of the LSCI technique. Quantified cerebral restoration monitors brain injury and recovery with TTM. Hypothermic TTM is associated with delayed onset and lower cerebral flow during the hypoperfusion phase, which is associated with early restoration of electrophysiological recovery and improved functional outcome after CA. Whether higher CBF during hyperemia phase and/or lower CBF during hypoperfusion phase directly contributes to the improved electrophysiological and functional outcome through neurovascular coupling is out of the scope of the current study and pending future investigation. This study demonstrated that our quantified cerebral-vascular responses during different phases of recovery after CA constitute important phenomenon, which may help uncover the mechanism of injury and recovery with TTM, and have great potential to facilitate the management of brain ischemia.
Footnotes
Funding
The author(s) disclosed receipt of the following financial support for the research, authorship, and/or publication of this article: The work was supported by R01HL118084 from NIH (to XJ). He, Deng and Jia were supported by NIH R01HL118084. Dr. Jia was partly supported by NIH R01NS110387 and Maryland Stem Cell Research Fund (2013-MSCRFE-146-00) (to XJ). Tong was partly supported by NSFC (61371018).
Declaration of conflicting interests
The author(s) declared no potential conflicts of interest with respect to the research, authorship, and/or publication of this article.
Authors’ contributions
XJ contributed with conception and design of the study, data interpretation, manuscript drafting, revision and final manuscript approval. JH contributed with in vivo experiment, data acquisition, analysis and interpretation, manuscript drafting and revision. HL contributed with the setup of LSCI technique in CA, and CBF data analysis. LY and RD contributed with EEG signal analysis, and DC contributed with manuscript revision. ST contributed with LSCI technique and custom-designed setup.