
Abstract
Arterial stiffness is linked to cerebral small vessel damage and neurodegeneration, but barriers to accessing deep cerebrovascular anatomy limit our ability to assess the brain. This study describes an adaptation of a cardiac-related scrubbing method as a means of generating blood oxygenation level-dependent pulsatility maps based on the cardiac cycle. We examine BOLD pulsatility at rest, based on the non-parametric deviation from null metric, as well as changes following acute physiological stress from 20 min of moderate-intensity cycling in 45 healthy adolescents. We evaluate the influence of repetition time (TR) and echo time (TE) using simulated and multi-echo empirical data, respectively. There were tissue-specific and voxel-wise BOLD pulsatility decreases 20 min following exercise cessation. BOLD pulsatility detection was comparable over a range of TR and TE values when scan volumes were kept constant; however, short TRs (≤500 ms) and TEs (∼14 ms) acquisitions would yield the most efficient detection. Results suggest cardiac-related BOLD pulsatility may represent a robust and easily adopted method of mapping cerebrovascular pulsatility with voxel-wise resolution.
Keywords
Introduction
Characterizing brain pulsatility has broad clinical appeal, as it may provide new avenues for advancing our understanding of cerebrovascular and cognitive health. The heart circulates blood in a pulsatile manner and the elastic properties of large arteries serve to dampen pulsatile energy prior to reaching the brain’s microvasculature. 1 Aging and vascular risk factors increase arterial stiffness, resulting in the propagation of pulsatile stress further down the arterial network, which is thought to contribute to target organ damage. 2 Elevated haemodynamic pulsatility in the brain is associated with white matter hyperintensities, which in turn are predictors of cognitive impairment and the development of dementia and stroke.3–10 Several non-invasive methods quantify hemodynamic pulsatility. Pulse wave velocity, for instance, is a gold standard that measures the pulse arrival time at two locations, typically the femoral and carotid arteries.11,12 Although pulse wave velocity is low-cost and reliable, it indexes central arterial stiffness only, and thus provides limited insight on downstream cerebrovascular beds. 1 Cerebral hemodynamic pulsatility can be acquired with transcranial Doppler ultrasound13,14 and time-of-flight or phase contrast MRI,15,16 although these techniques are limited to the large cerebral arteries. Conversely, MRI elastography can map stiffness of tissue,17,18 but this does not appear to reflect vascular aging.18,19
Blood oxygenation level dependent (BOLD) contrast functional MRI (fMRI) is ideal for measuring pulsatility because of its whole brain coverage and capacity for high temporal resolution.20,21 BOLD is commonly used as an indirect measure of neuronal activity due to co-localized changes in blood oxygenation. Importantly, cardiac and respiratory sources of physiological variability are known to influence the BOLD signal. In 1999, Dagli et al. 22 provided empirical evidence of a pulse waveform in the BOLD signal with voxels proximal to major arteries. Cardiac sources are generally a nuisance for fMRI activation and there are a plethora of methods that remove this signal through cardiac gating,23,24 bandpass filtering 25 and retrospective image correction (RETROICOR).25,26 The latter is widely used software that regresses cardiac and respiratory traces to correct for physiological noise. An alternative perspective, however, views the cardiac-related fluctuations as a source of information that reflects brain pulsatility. Recently, Tong et al.27,28 assessed the direction of blood flow via the temporal shift of the pulse trace in different brain locations.
The goal of the current study is to further develop BOLD pulsatility mapping and investigate whether acute aerobic exercise will produce a measurable pre- vs. post-exercise differences. Healthy adolescents participated in this study by undergoing a series of BOLD scans before and 20 min after a single bout of aerobic exercise. We hypothesized that cardiac cycle-related regional BOLD pulsatility would decrease after exercise, based on the established phenomena of reduced vascular tension29–33 and tone33–35 subsequent to exercise. To test this hypothesis, we performed tissue-based and voxel-wise analyses. Post hoc, we characterize the first pair and second pair in separate pre versus post-exercise BOLD scan comparisons. We explore a potential order effect brought on by an experimental design that has resting BOLD scans that precede task BOLD, both pre- and post-exercise. Due to numerous sources that can contribute to BOLD pulsatility contrast, we investigated the influence of repetition time (TR) and echo time (TE) by simulation and empirical data, respectively.
Methods
Experiments and participants
Participant characteristics for exercise study.
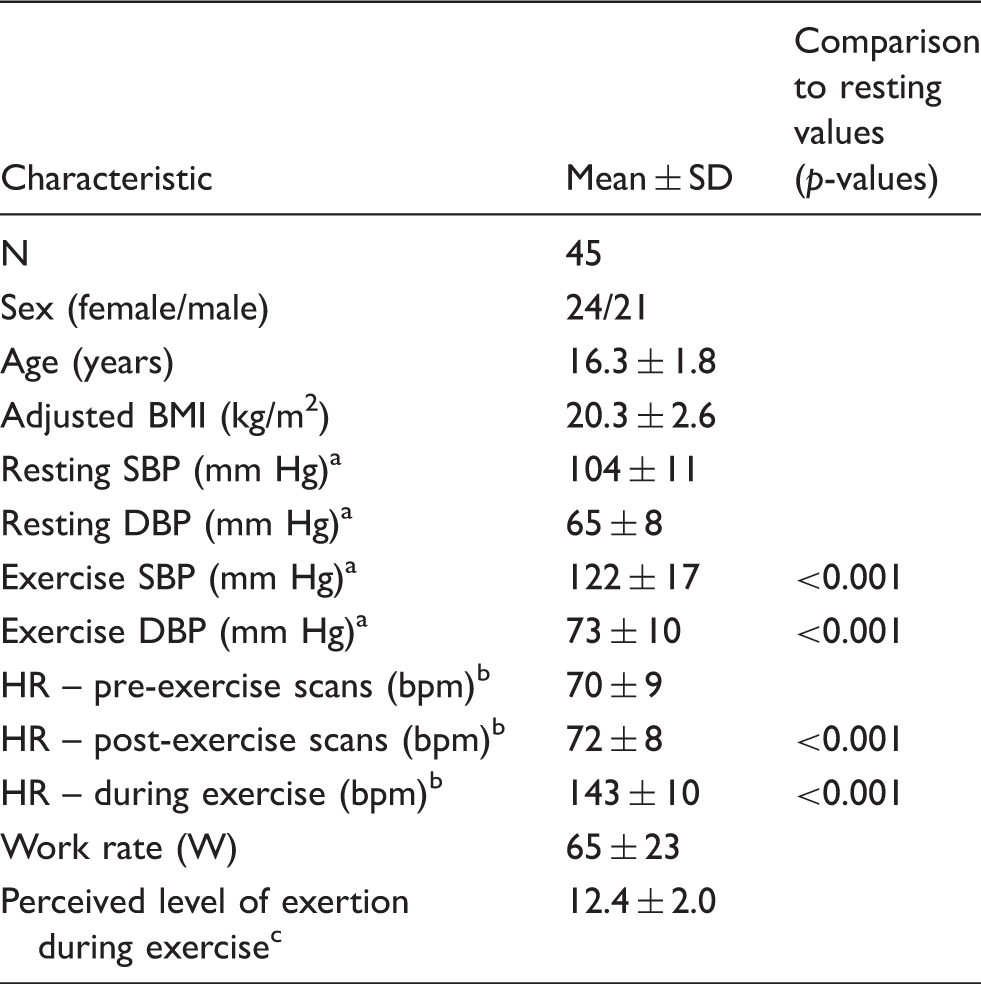
Blood pressure calculated using 39 participants as data were missing for 6 participants.
Heart rate calculated using 44 participants as data were missing for 1 participant.
Self-reported using Borg scale: 6 (no exertion) – 20 (maximal exertion).
SD: standard deviation; BMI: body mass index; SBP: systolic blood pressure; DBP: diastolic blood pressure; HR: heart rate.
We conducted two supporting analyses to complement our main objective of developing a method of detecting a cerebrovascular pulsatility using BOLD fMRI. The first simulated the influence of TR and post-processing methods on the ability to detect cardiac-related pulsatility in BOLD data. The second empirically investigated the influence of TE on the ability to detect cardiac-related pulsatility in BOLD data, for which 10 additional English-speaking participants without any major illnesses, psychiatric disorders, or contraindications to either exercise or MRI testing were recruited. Written informed consent was obtained from all participants and from the parents/guardians of the adolescent participants for the exercise study. This study was approved by the Sunnybrook Health Sciences Centre Research Ethics Board, in accordance with the Declaration of Helsinki ‘Ethical Principles for Medical Research Involving Human Subjects’.
Experiment 1 – Study of the effect of acute exercise
Aerobic exercise session
Participants exercised on a semi-recumbent cycle ergometer (ISO 1000R, SciFit, Tulsa USA) with heart rate recorded every minute. Exercise involved a 5-min low intensity warm-up, a 20-min steady state exertion at a target heart rate of 70% age-predicted maximum (i.e. 220 – age in years), 37 and a 2-min cool down. Participants whose heart rates deviated by more than 5 bpm from their target were instructed to adjust their exercise intensity.
Data acquisition
Four BOLD scans were acquired for each participant across two sessions: one resting state followed by one task-based (previously described by Metcalfe et al. 38 ) scan was acquired at baseline and again 20 min following the cessation of exercise. Neuroimaging was performed using a 3-T MRI system (Achieva, Philips Healthcare, Best NL) with a body coil transmitter and an 8-channel head coil receiver. Single-echo BOLD acquisition parameters were identical for all scans (TR = 1500 ms, TE = 30 ms, 28 slices, 4 mm thickness, 80 × 80 matrix, 3 × 3 mm resolution, flip angle 70°) with the exception of 230 volumes for resting state and 240 volumes for the task-based BOLD scans. The resting state scan was acquired first in both the baseline and post-exercise sessions. T1-weighted images were collected post-exercise using fast-field echo imaging (TR = 9.5 ms, TE = 2.3 ms, TI = 1400 ms, 256 × 164 × 140 matrix, 0.94 × 1.17 × 1.2 mm resolution). Cardiac and respiratory traces were digitized at 500 Hz using a fingertip pulse oximeter and respiratory bellows, respectively.
T1 segmentation
After spatial alignment to the fMRI volumes, T1-weighted images were used to segment cerebral spinal fluid (CSF), grey matter and white matter tissue types using the Oxford Centre for Functional MRI of the Brain (FMRIB)'s Automated Segmentation Tool (FAST) from the FMRIB Software Library (FSL; version 4.1). 39 We further classified CSF into ventricular CSF of interest and sulcal CSF of non-interest using an in-house MATLAB script.
BOLD preprocessing
We used analysis of functional neuroimages’ (AFNIs) RETROICOR 40 to remove respiratory effects in the BOLD data, then performed skull stripping, slice timing correction, spatial smoothing of 5 mm FWHM, and motion correction. BOLD images were registered to a T1-weighted template image that was created from all participants using the advanced normalization tools (ANTs) software package. 41
Spurious cardiac pulse intervals were removed if they were more than 0.3 s above/below the mean inter-beat interval. The minimum number of usable volumes, or volumes with a recorded pulse interval that fell within the accepted range as mentioned in the previous step, was set to 138, i.e. 60% of the total volumes per scan, chosen as the best compromise between number of volumes and number of participants. Participants were excluded from analysis if any individual scan had an insufficient number of viable volumes. To ensure equal amounts of BOLD data were used for each participant, we randomly sampled 138 volumes to perform the pulsatility model fitting.
Resorting method
Signal intensities for each volume were sorted according to their position in the cardiac cycle on a per-voxel basis (Figure 1(a)). A 7-term Fourier series model was fit to the sorted data based on the following rationale: (1) to replicate the original model in Dagli et al., and (2) to use seven terms in the model to capture sufficient finger pulse trace signal variance, which is a temporally smoothed relative to ECG, without the risk of over-fitting the pulse trace. Goodness of fit was evaluated by the coefficient of determination (R2) (Figure 1(b)). To establish a null goodness of fit distribution, the model was also fit to 45,000 random permutations of the sorted data (i.e. roughly matching the number of brain voxels in a single volume). A deviation from null metric was calculated as the number of standard deviations between the actual R2 and the mean null R2; this metric represents the degree of pulse trace influence in a given voxel, hence a BOLD pulsatility map (Figure 1(c)). A threshold was set to five deviations from null, corresponding to a non-parametric p < 0.001.
Schematic diagram of the resorting method with (a) BOLD temporal volumes matched to the pulse oximeter and sorted based on cardiac cycle position. (b) Sample time series resorted by cardiac cycle and fit with a 7-term Fourier series. The R2 of this fit is then (c) compared to a randomly generated distribution of 45,000 null fits. R2 values greater than five standard deviations (green line) from the null distribution mean were considered pulsatile. The black line indicates the R2 value of cardiac cycle position sorted example in (b).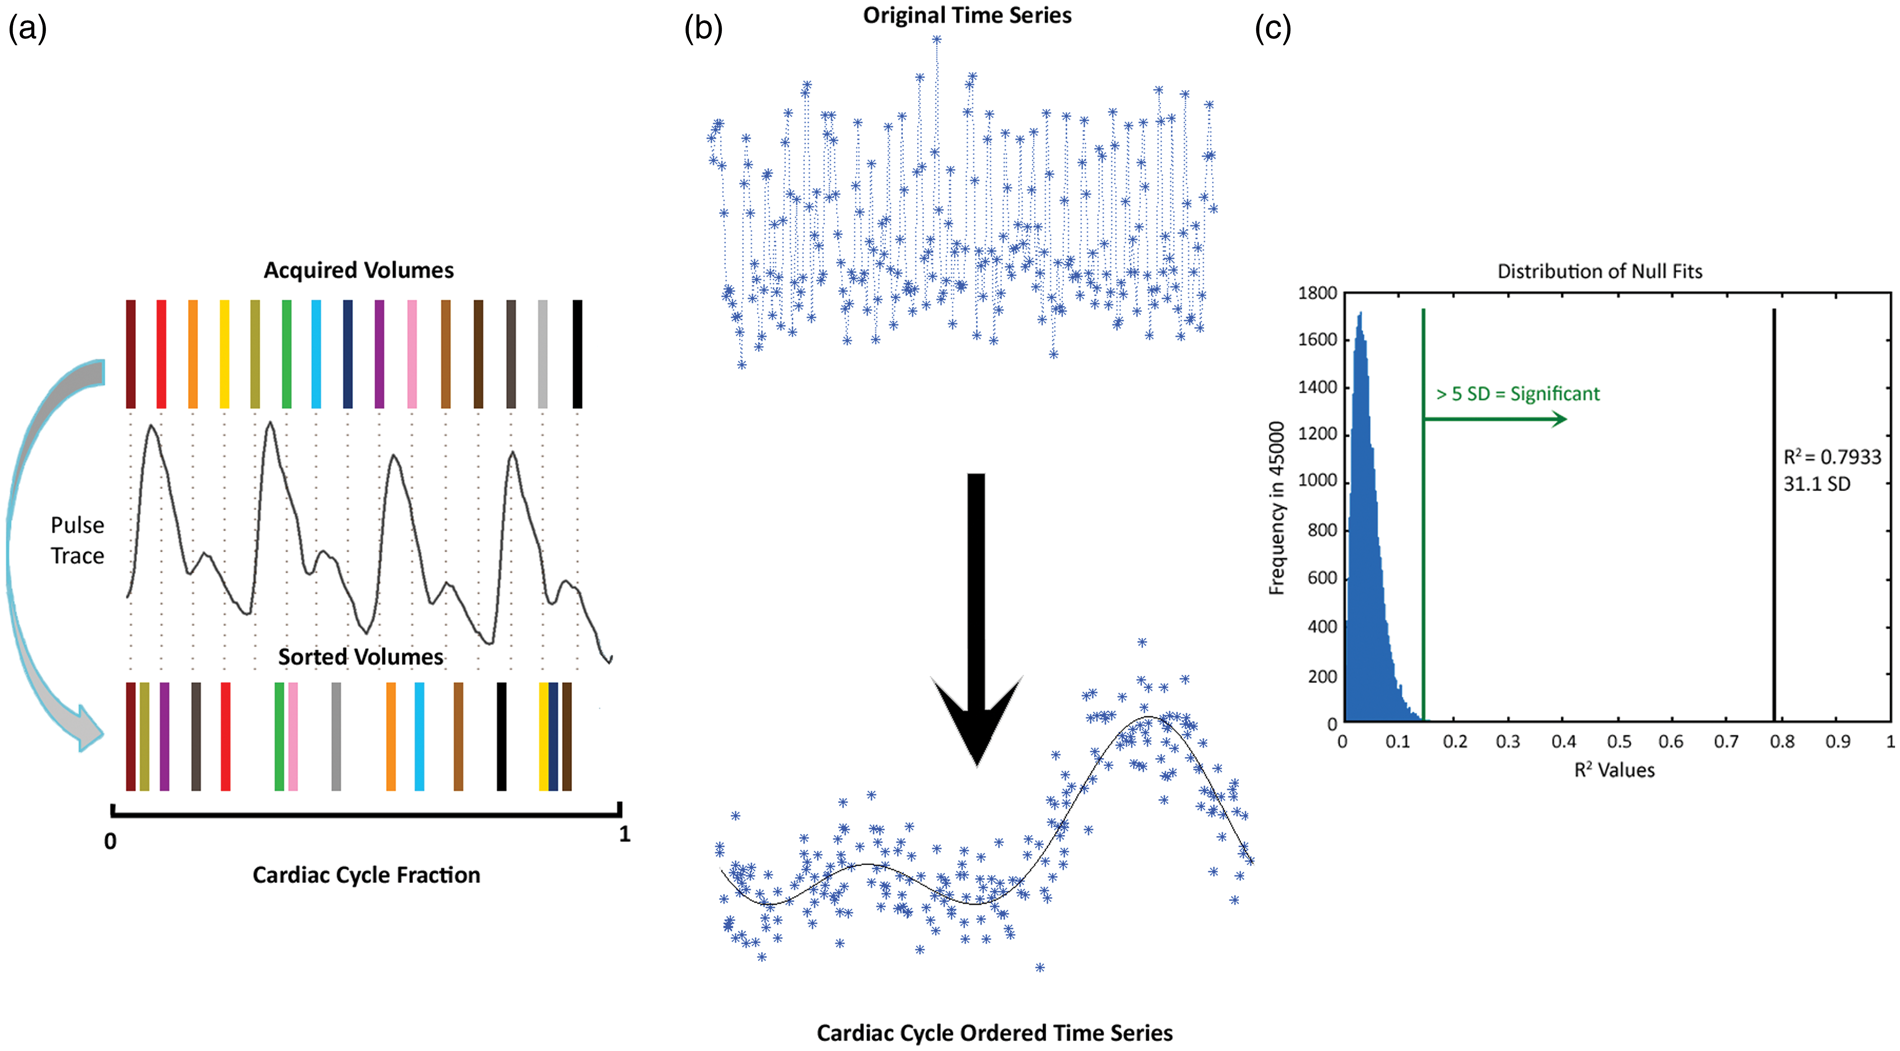
Experiment 2 – Simulation study of the effect of TR and signal filtering
Simulated BOLD time series data comprised cardiac (target physiological signal), respiratory (non-target physiological noise), and noise sources. The cardiac signals were modelled after a normal physiological trace collected using the pulse oximeter, by the function
Nine TR values were selected, ranging from 33 ms 43 to 3000 ms. 22 Each value was chosen from previous fMRI experiments.22,38,43–45 One hundred thirty-eight points were then collected from the generated signals with spacing equal to that of each of the chosen TRs, equivalent to Experiment #1. For comparison, a second TR simulation was performed whereby the total number of volumes was made to increase as TR decreased, effectively maintaining the same acquisition duration for each of the TR choices.
RETROICOR was implemented to remove respiratory signals. A second data cleaning method, for comparison, was a first-order Butterworth high-pass filter using a frequency cut-off of 0.27 Hz, implemented in R (version 3.2.0). Detection of pulsatility was calculated for each cardiac frequency, TR and data cleaning method using the resorting method described in Experiment #1.
Experiment 3 – Empirical study of the effect of TE
Multi-echo fMRI BOLD volumes (TR = 2300 ms, TE1 = 13.8 ms, TE2 = 35.4 ms and TE3 = 57.0 ms, 28 slices, 4 mm thickness, 80 × 80 matrix, 3 × 3 mm resolution, flip angle 70°, 195 volumes) and T1-weighted images (TR = 9.5 ms, TE = 2.3 ms, TI = 1400 ms, 256 × 164 × 140 matrix, 0.94 × 1.17 × 1.2 mm resolution) were acquired on a second sample of 10 healthy adults (3 female, age: 25 ± 3 years). Preprocessing and BOLD pulsatility calculation steps were the same as for Experiment #1, save that the threshold for acceptable data was reduced to 129 useable volumes, to reflect the fewer acquired volumes.
Statistical analysis
Two sets of analyses were conducted for Experiment #1. The first tested for global session effects by comparing the pre- versus post-exercise percentage of pulsatile voxels for grey matter, white matter and ventricular CSF. This two-way repeated-measures ANOVA accounted for session, scan condition as well as sex, age and heart rate. We conducted two paired t-tests post hoc to test intra-subject session differences and session by scan condition interactions.
The second analysis investigated voxel-wise differences based on the degree of pulsatility in a voxel, as assessed by the deviations from null metric. We compared the amplitude of the BOLD pulsatility maps between baseline and post-exercise sessions using the non-parametric FSL Randomise program and treated resting state and task scans separately. The model also included sex and age as covariates. We corrected for family-wise error with 5000 permutations. BOLD pulsatility maps were spatially blurred by 5 mm FWHM to account for inter-participant differences in feature location prior to voxel-wise analysis.
In Experiment #3, we compared the percentage of pulsatile voxels by tissue type and TE using the Friedman test. Following a significant Friedman test, Wilcox signed rank test was performed between each pair of echoes and adjusted for multiple comparisons using Holm's method. 46
Results
BOLD pulsatility maps
Pulsatility maps identified the major cerebral arteries, ventricles and the superior sagittal sinus, as expected. Visually, inter-subject spatial agreement of the pulsatility maps was high; all major features were in close alignment, with small variations likely due to normative inter-participant neurovascular anatomy differences. An average BOLD pulsatility map is shown in Figure 2.
Mean pulsatility map from all participants. The scale indicates the number of deviations away from the goodness of fit is for the null fit distribution.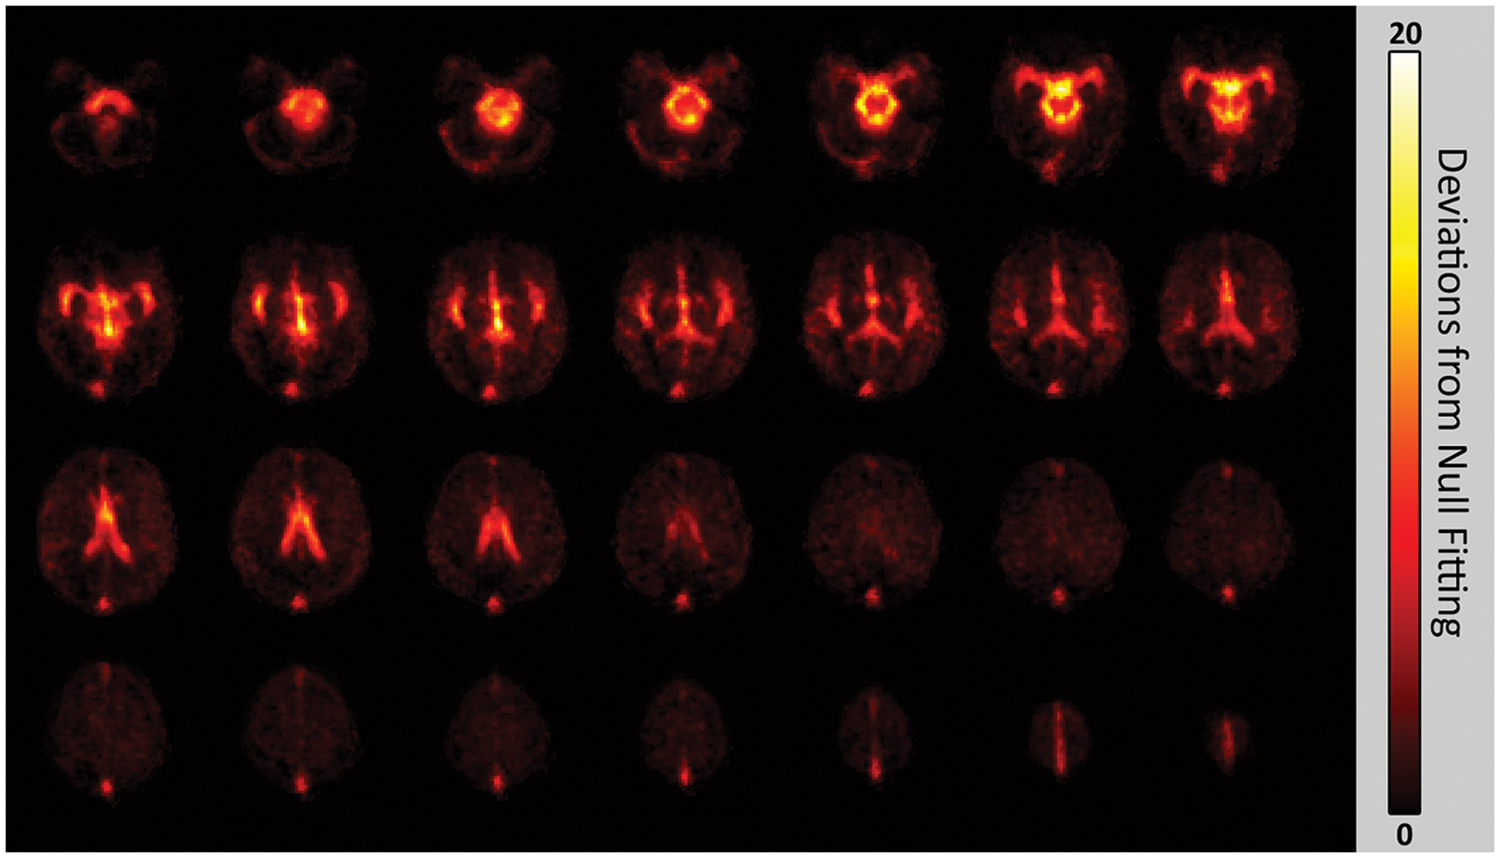
Acute exercise and tissue pulsatility
There was a significant effect of session on the percentage of ventricular CSF (F(1,25) = 9.53, p = 0.0049), grey matter (F(1,25) = 14.0, p = 0.00096) and white matter (F(1,25) = 8.92, p = 0.0062) voxels exhibiting pulsatility features. There was also a significant session by scan condition interaction for this metric, in all three tissues (ventricular CSF: F(1,25) = 9.44, p = 0.0051; grey matter: F(1,25) = 5.65, p = 0.025; white matter: F(1,25) = 5.58, p = 0.026), while none of the tissues had a significant scan condition effect (ventricular CSF: F(1,25) = 0.030, p = 0.86; grey matter: F(1,25) = 2.05, p = 0.16; white matter: F(1,25) = 3.74, p = 0.065). Sex, age and heart rate did not have a significant effect on the percentage of pulsatile voxels in ventricular CSF (F(1,25) < 0.77, p > 0.39), grey (F(1,25) < 1.13, p > 0.30) or white matter (F(1,25) < 3.75, p > 0.064).
Post hoc, intra-subject analysis showed that 37 out of 45 participants (87%) had a decreased proportion of pulsatile grey matter voxels after exercise for the resting BOLD scan (i.e. # of voxels with pulsatility post-exercise was lower than pre-exercise at p < 0.05). For white matter and CSF, the significant drop in spatial extent was seen in 80% and 73% of individuals, respectively. The number of individuals showing decreased pulsatility extent for the task BOLD scan was 62%, 67% and 56% of individuals for grey, white and CSF masks, respectively.
There was no difference in the percentage of pulsatile voxels for the two baseline scans (all tissues: p > 0.10); however, the resting state scan (19.8 ± 1.1 min post-exercise) had significantly lower pulsatility than the task scan (26.7 ± 1.6 min post-exercise) after exercise cessation in grey (p = 0.027) and white matter (p = 0.014) but not in ventricular CSF (p = 0.17), after adjustment (Figure 3). This was a consequence of a decrease in the percentage of pulsatile voxels in the post-exercise resting state scan compared to baseline (all tissues: p < 0.0025), and no change in the post-exercise task scan (ventricular CSF: p = 0.17; grey matter: p = 0.12; white matter: p = 0.25).
Average percentage of pulsatile voxels in each tissue category with standard error and multiple comparison-corrected p-values; *p < 0.05, **p < 0.01; RS: resting state.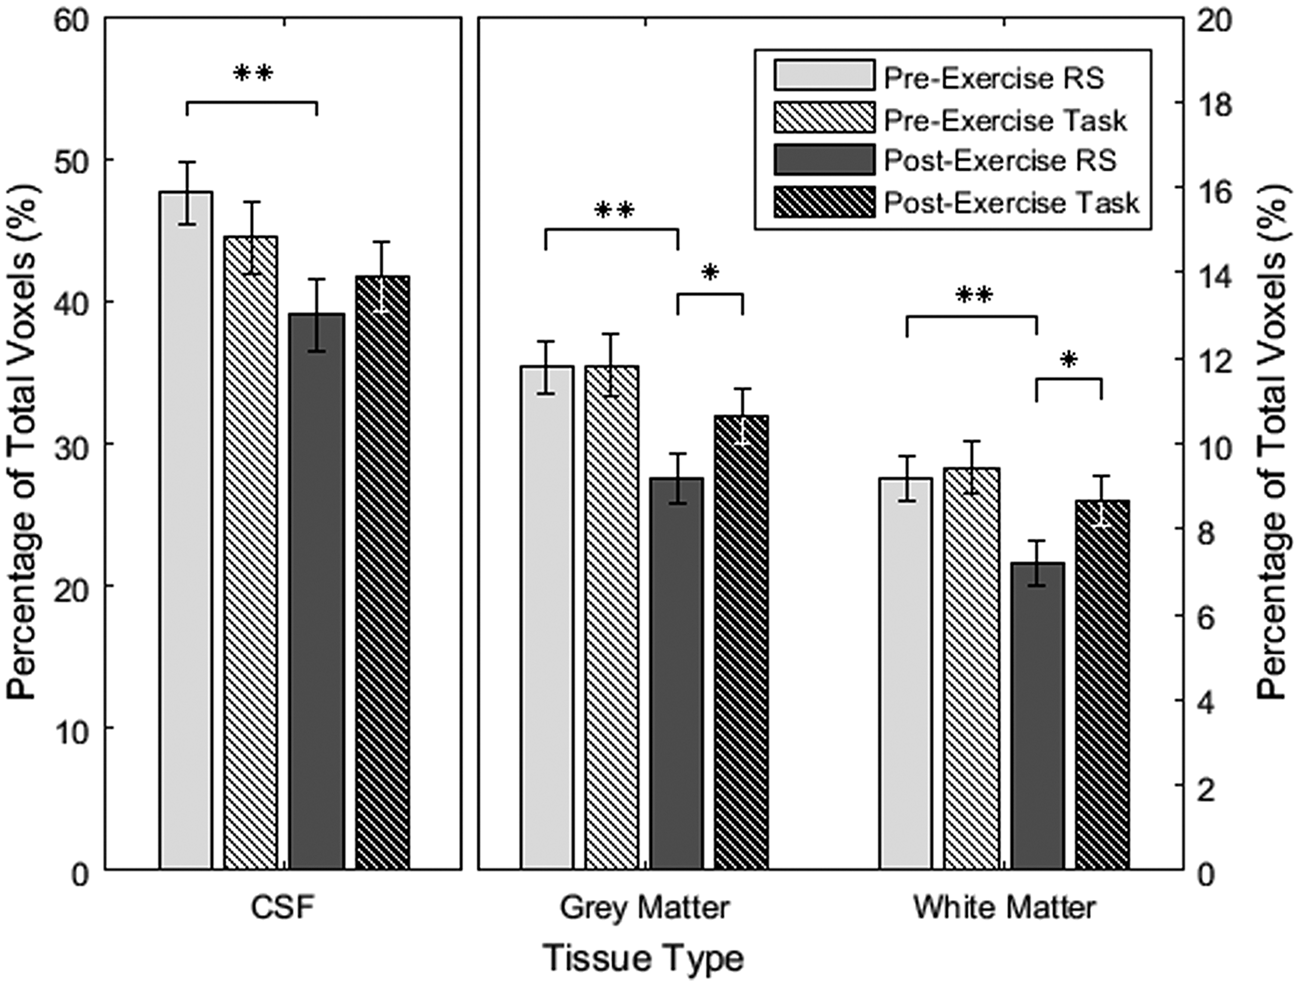
In assessing the temporal evolution of the BOLD pulsatility, splitting the post-exercise BOLD scans into first and second half showed no within-scan order effect for either post-exercise BOLD scans (p > 0.12; these within-BOLD scan analyses were based on 40 out 45 participants due to the minimum number of volumes needed to assess pulsatility).
Acute exercise and voxel-wise pulsatility
For the first set of BOLD pulsatility maps (i.e. derived from resting state scans), voxel-wise session comparison revealed widespread decreases in the amplitude of the BOLD pulsatility effect in the major blood vessels and ventricles after exercise (Figure 4). For the second set of BOLD pulsatility maps (i.e. task scans), there was a single significant cluster showing a post-exercise decrease in the amplitude of the BOLD pulsatility in the left insula (Figure 4).
Permutation-based voxel-wise results comparing of baseline and post-exercise BOLD pulsatility maps, showing a decrease in pulsatility after exercise, using a corrected p-value <0.05 in (a) resting state and (b) task scans.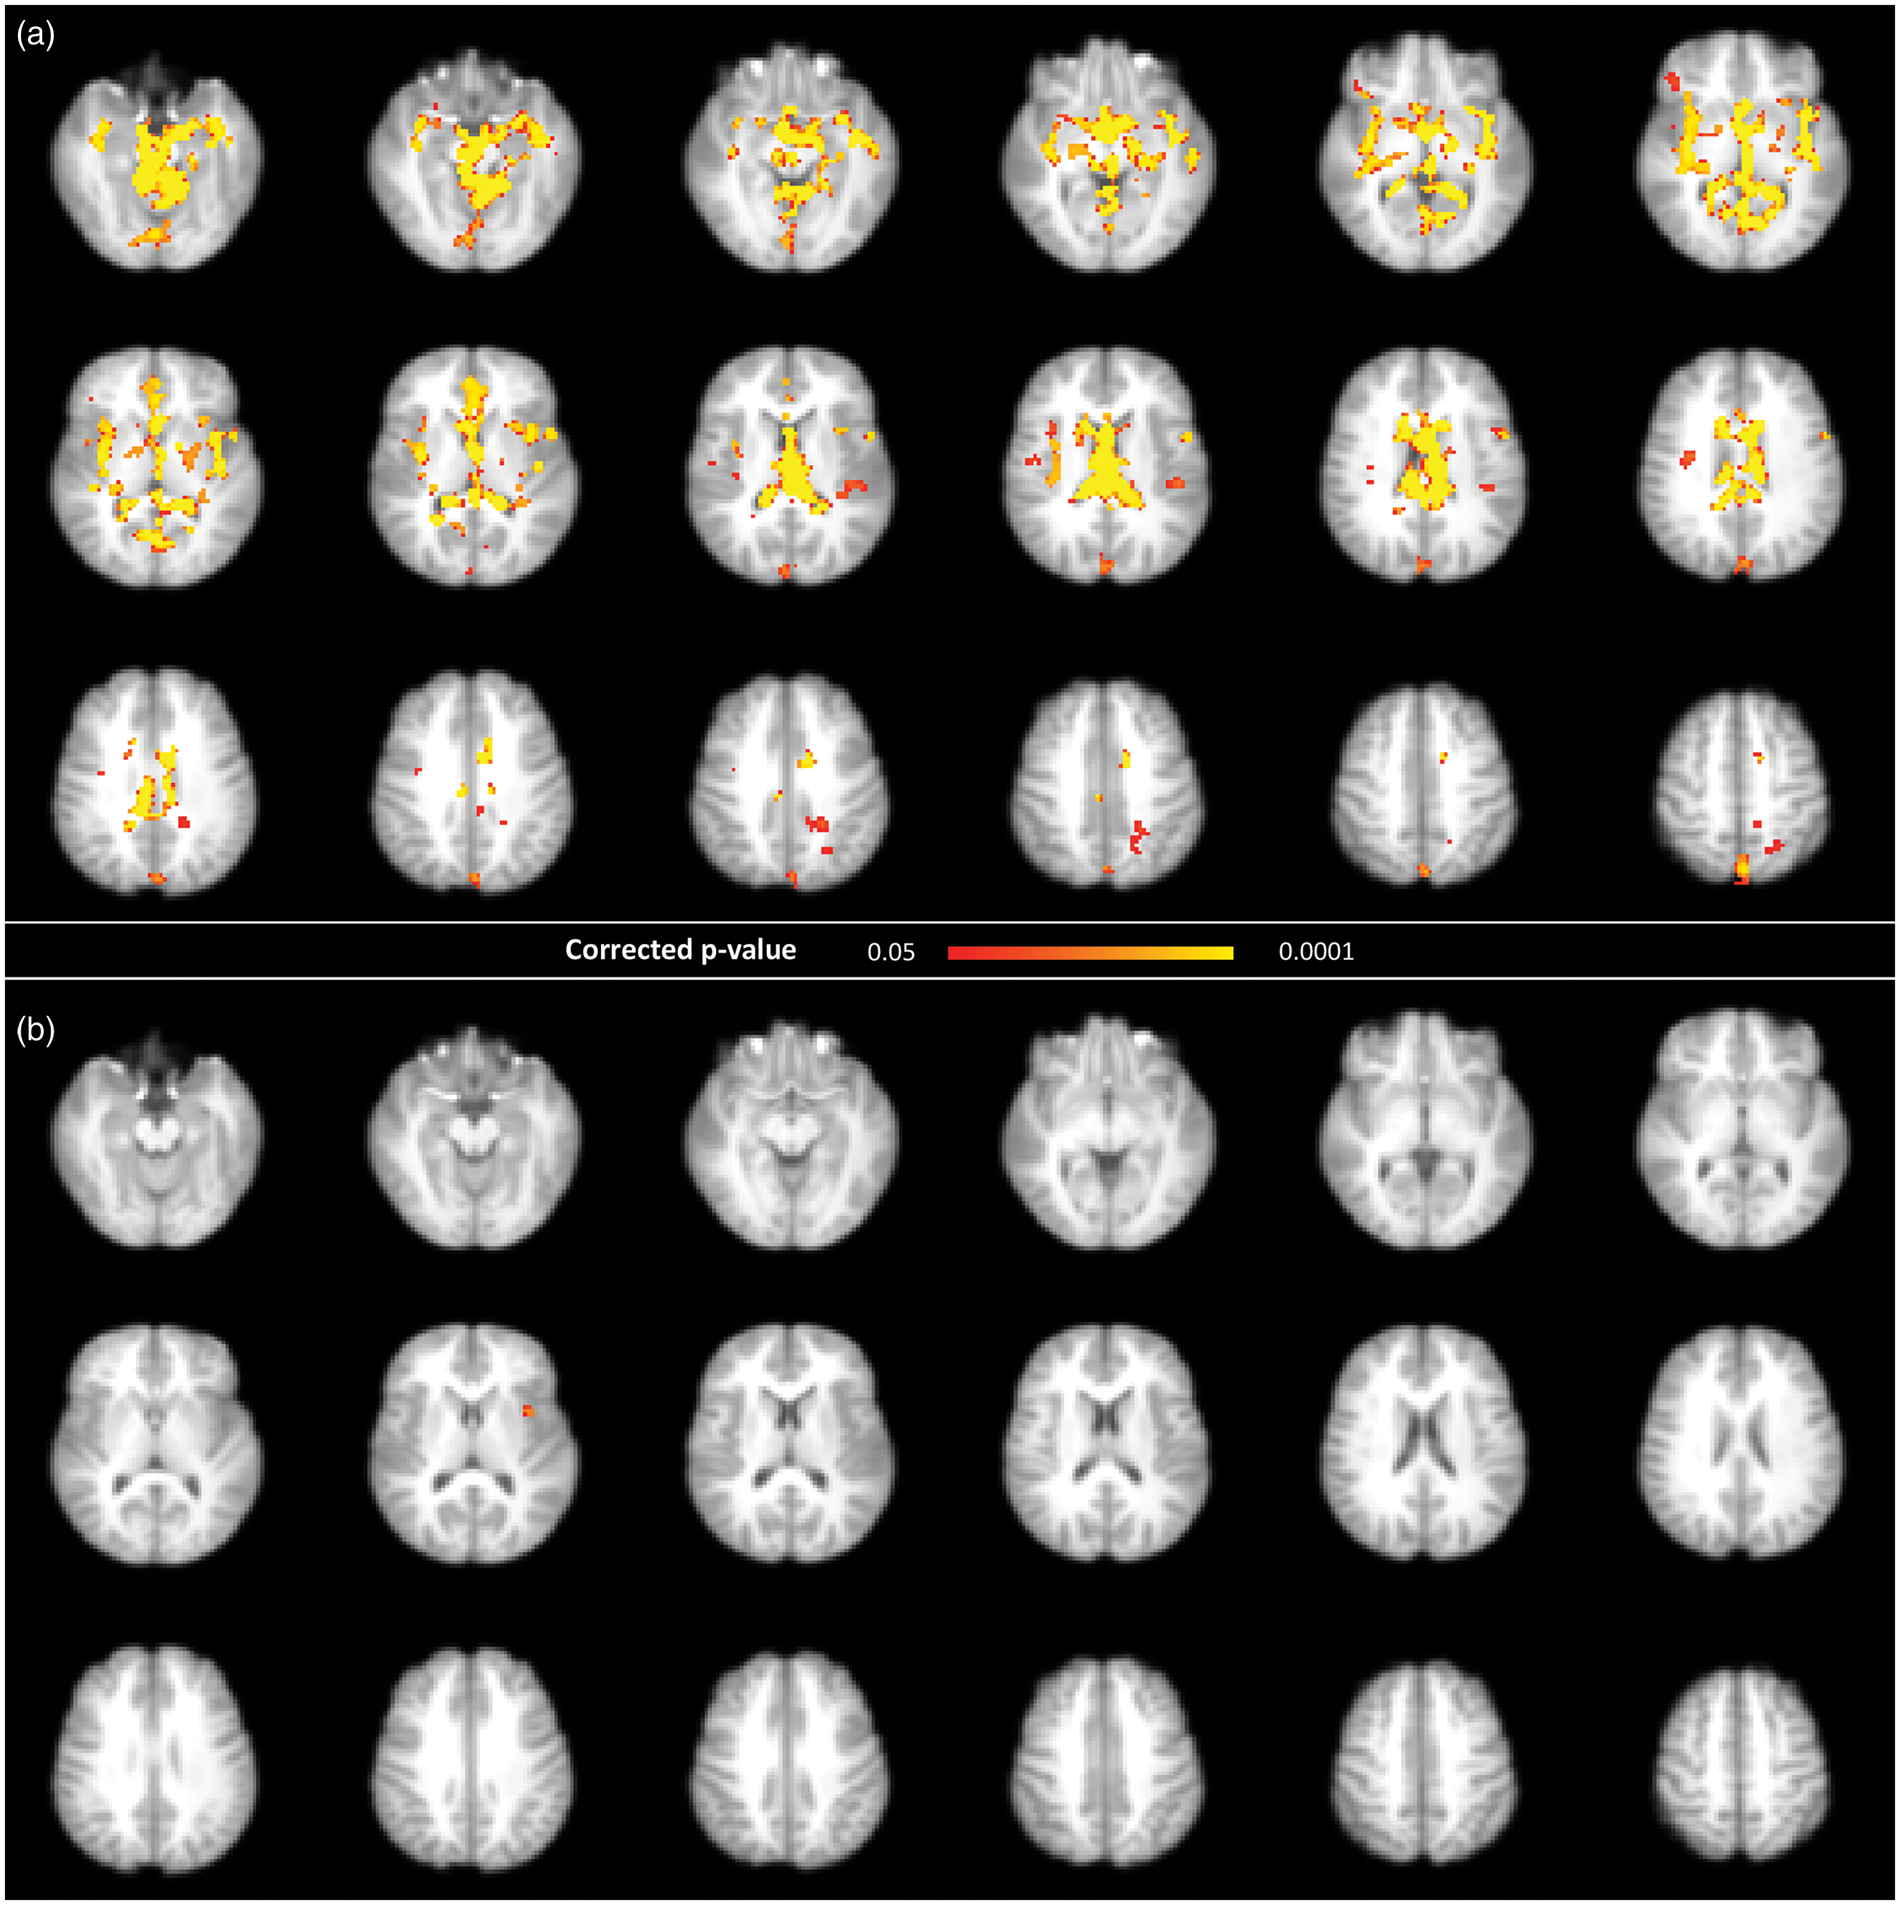
Effect of TR and data cleaning on BOLD pulsatility
Simulations showed that the ability to detect pulsatility decreases with increasing TR (Figure 5(a)); however, for TR > 500 ms, the detectability is less dependent on TR. The RETROICOR-corrected and uncorrected results had similar detection levels, regardless of the sampling period length. Keeping the acquisition duration constant across the range of TRs demonstrated a strong association between the number of acquisition volumes and detecting a cardiac pulsatility trace (Figure 5(b)).
(a) BOLD pulsatility deviations from null for each simulated scenario, plotted according to heart rate, TR and data cleaning method: uncorrected, high-pass filter and RETROICOR. (b) The simulation results show a dramatic TR dependence when the number of volumes at each TR is not held constant. Larger markers indicate means for each scenario.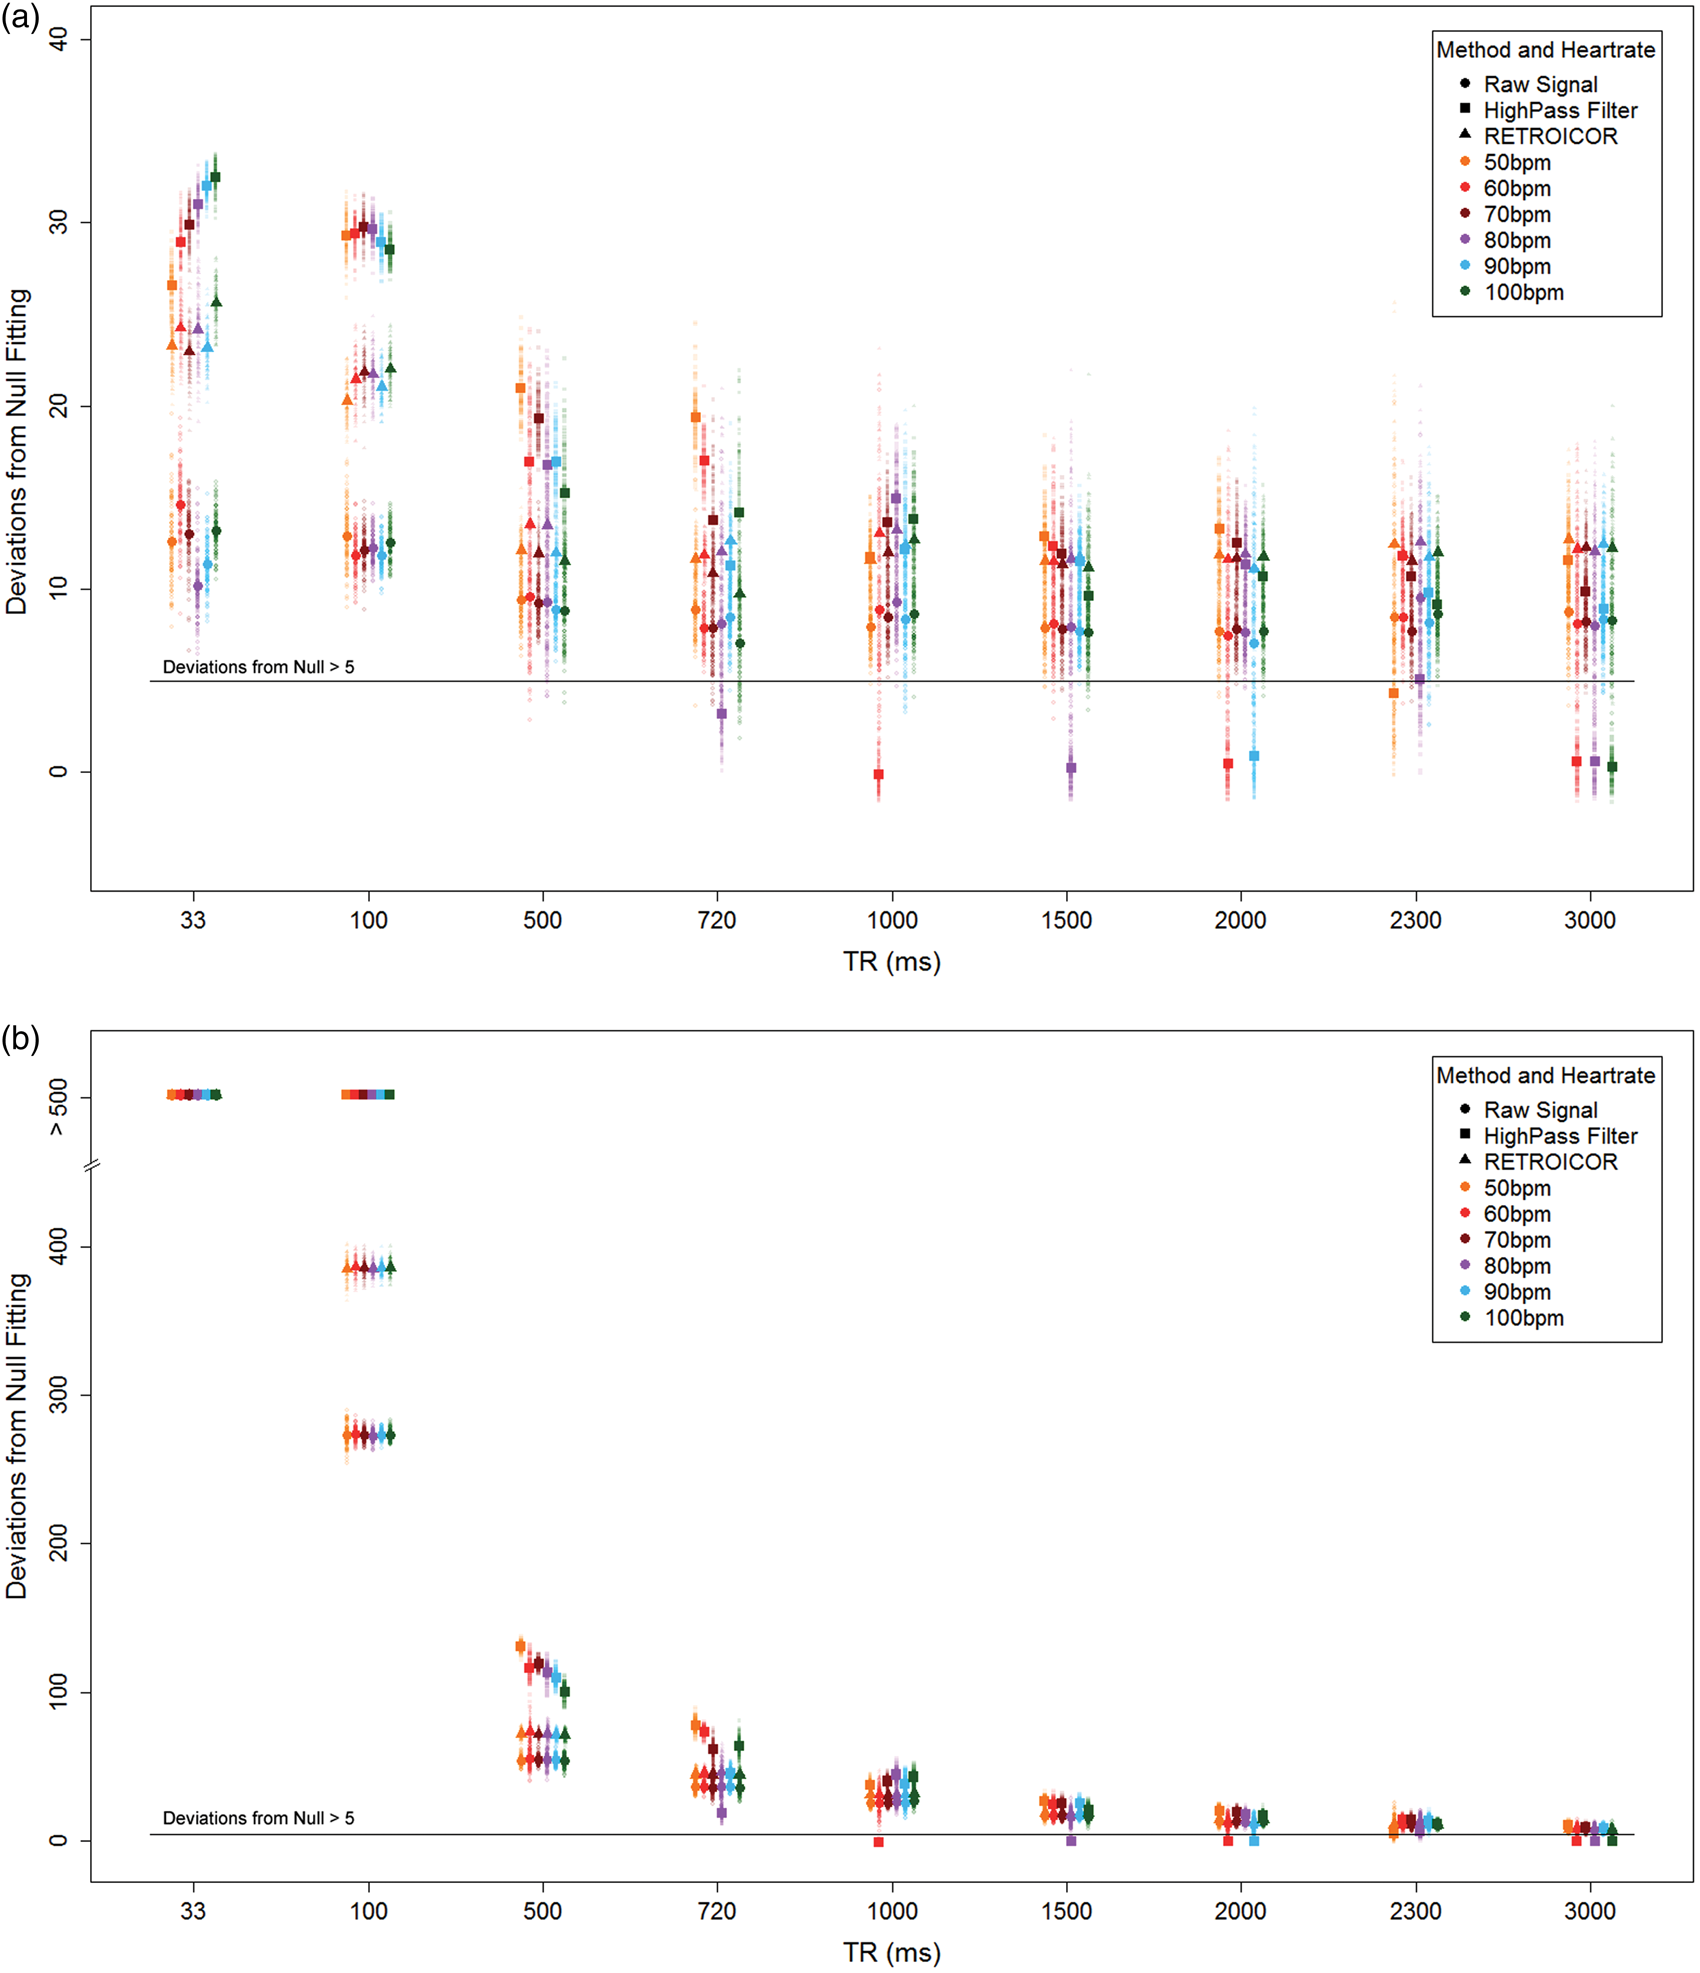
Use of a high-pass filter was problematic due to inconsistent detection of pulsatility at certain TRs, which depended on the average heart rate (i.e.
Effect of TE and tissue pulsatility features
Friedman tests found a significant dependence of the percentage of pulsatile voxels on TE in grey (χ2 = 16.8, p < 0.001) and white matter (χ2 = 15.2, p < 0.001). Ventricular CSF showed no TE effect (χ2 = 4.1, p = 0.13). Post hoc tests on grey and white matter showed that TE1 had higher pulsatility compared to both TE2 and TE3 (p < 0.006, p < 0.006, respectively). TE2 had higher pulsatility than TE3 in grey matter (p = 0.014), but not white matter (p = 0.43) (Figure 6).
Mean percentage of pulsatile voxels in each of the tissue categories with standard error and p-values that have been adjusted for multiple comparisons using Holm’s method; **p < 0.01.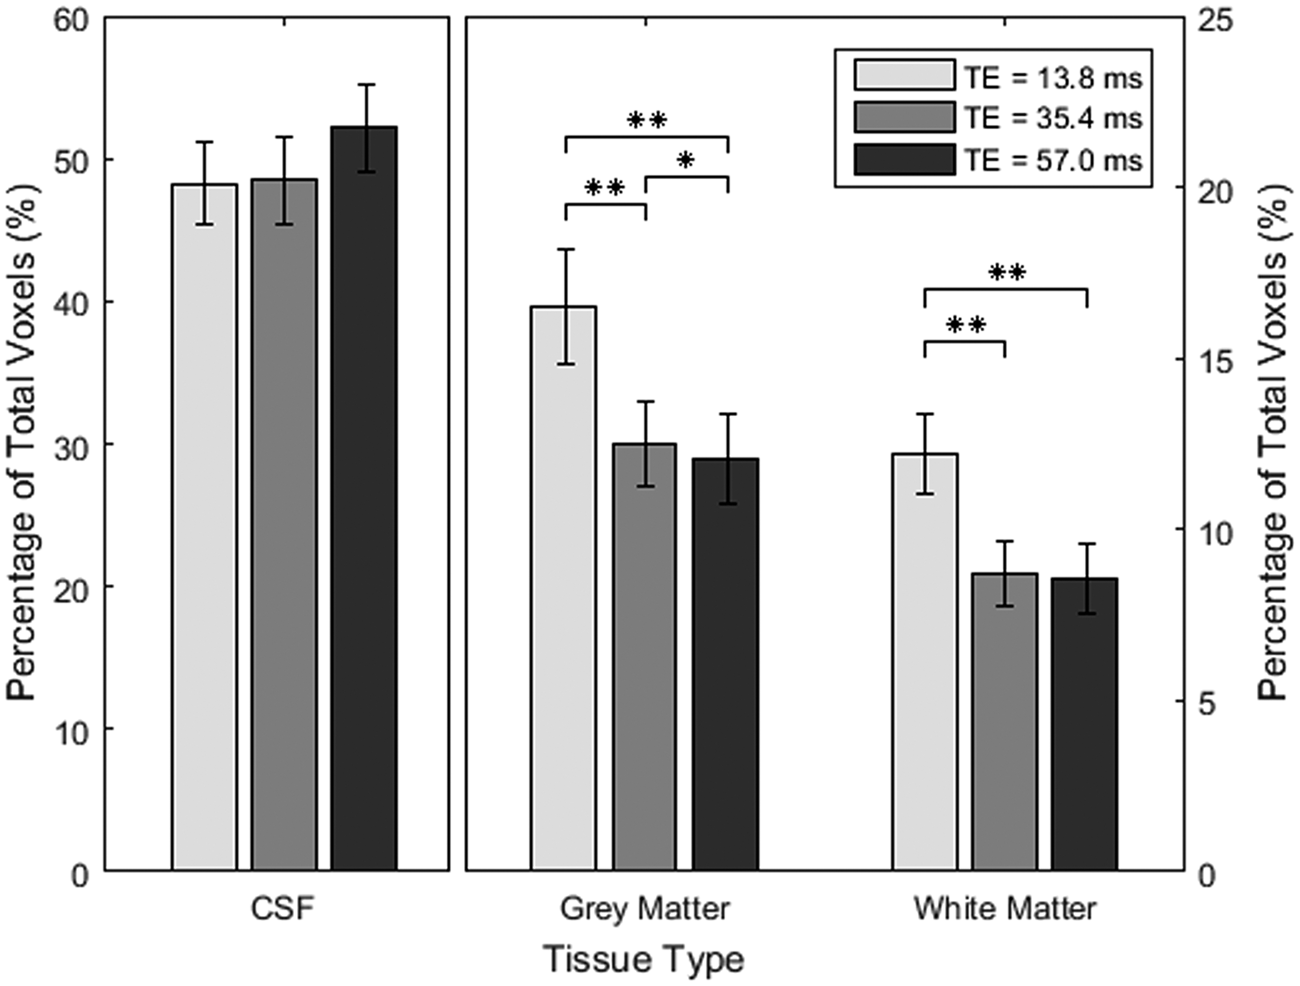
Discussion
The current study found that cardiac-related pulsatility features were detectable in BOLD data near the major cerebral arteries, lateral ventricles and the superior sagittal sinus. We observed a session dependence, whereby cardiac-related BOLD pulsatility tended to decrease within 20 min after aerobic exercise. Our findings also showed an absence of pulsatility differences when comparing the second pair of BOLD pulsatility maps, which could be the result of a normalization effect, an order effect or a combination thereof. The BOLD pulsatility features in the left insula, however, showed a persisting pulsatility decrease at 27 min post-exercise. The current findings support the notion that cardiac-related BOLD pulsatility reflects dynamic haemodynamic features in brain. To improve characterization of these BOLD pulsatility effects, we identified that pulsatility detection was most achievable with shorter TR and TE parameters, using simulated and empirical approaches, respectively.
Effect of acute exercise
In support of our primary hypothesis, BOLD pulsatility effects decreased acutely after exercise, as observed in tissue-based and voxel-wise analyses. While BOLD pulsatility was lower in both post-exercise scans compared to baseline, the session difference was only significant for the first post-exercise scan. No difference in pulsatility was found between the two baseline scans, while in contrast, the second (task condition) post-exercise scan showed markedly higher pulsatility in both grey and white matter compared to the first (rest condition) post-exercise scan. Between these post-exercise scans, there were 16% (Hedge’s g = 0.36) and 20% ((Hedge’s g = 0.42) more pulsatile voxels for grey and white matter, respectively. The same post-exercise trend was not observed in ventricular CSF.
Vascular tone is reduced during exercise to accommodate increased blood flow demands and to modulate increased pulsatile pressure from the heart, and remains so for a period after cessation, resulting in reduced arterial stiffness and post-exercise hypotension.31,33,35,47,48 In individuals with impaired vascular endothelial response, such as hypertensives, post-exercise hypotension can last for hours after exercise cessation,31,49–52 while this effect is typically less pronounced in normotensives30,33 and is thought to normalize by 30 min,50,53 with the most prominent effects between 15 and 30 min post-exercise.52,54
The largest BOLD pulsatility effects at baseline occurred in proximity to arteries and ventricles, as expected from the literature.22,27,28 The voxel-wise session-effect showed decreased BOLD pulsatility at the Circle of Willis, the lateral ventricles, the sagittal sinus and, notably, the superior parietal white matter along a watershed territory. 55 The percentage of grey matter voxels showing pulsatility was not different for the baseline task and the corresponding post-exercise task scans; however, the voxel-wise analysis of the BOLD pulsatility maps revealed one significant cluster in the left insula. This brain region is involved in parasympathetic and sympathetic systems that influence heart rate and blood pressure56,57; however, it remains to be seen whether BOLD pulsatility in the insula has any bearing to neuronal signal. Nonetheless, it is noteworthy that the insula regulates vascular tone in response to cardiovascular stressors. 58
Effect of TR and data cleaning on BOLD pulsatility
Simulation results revealed BOLD pulsatility is reliably detected with longer TRs, despite sampling rates that are below the Nyquist frequency, by virtue of the periodic nature of our target signal. Additionally, there was no decrease in the ability to detect this effect with increasing TR, once we passed the Nyquist frequency of the cardiac signal, when using either the RETROICOR-corrected or raw signal. Increasing TR values beyond 4000 ms would, however, be more problematic for detecting a respiratory trace. This suggests that there would be no inherent difference between scans conducted within the normal range of TRs used in conventional BOLD scans, as long as other imaging parameters are held constant and furthermore cardiac and respiratory traces are recorded adequately.
It is important to note that the TR simulations suggest it is possible to detect a cardiac pulsatility with only a limited amount of acquired time frame volumes when considering rapid TRs. In the case of TR = 33 ms, it would take but a few seconds to acquire >100 volumes and have sufficient data to detect pulsatility. Naturally, these simulation results would benefit from empirical characterization to establish the minimum number of volumes needed to detect pulsatility during short TR BOLD scans. High-pass filtering produced better results for detecting cardiac pulsatility than either RETROICOR or the uncorrected signal, but this advantage disappeared as soon as we reached the Nyquist frequency. The cardiac signal was almost entirely lost after the filter was applied, whenever the TR was an integer multiple of the average period between simulated heartbeats, making it an unreliable post-processing choice for BOLD scans collected at conventional TRs. This follows from sampling theory where a signal can only be properly sampled at a lower frequency if the sampling frequency and the frequency of interest are not integer multiples. 59
Effect of TE on BOLD pulsatility
The proportion of BOLD voxels with a pulsatility influence was highest for the shortest TE, which suggests additive T2* and proton density inflow cardiac influences at shorter TEs. For grey and white matter, the difference between TE1 and TE2 was larger than the difference between TE2 and TE3. The opposite was true for ventricular voxels, with a trend of increased percentage of pulsatile voxels with longer TE. For grey and white matter, this trend may be related to T2* decay in signal intensity which follows an exponential decay curve, similar to the trend of the average percentage of pulsatile voxels. This theory seems at odds with what happens in ventricular CSF but this could be due to a much longer T2 for CSF,60,61 resulting in very little change in the signal intensity over the period of three echoes.
One of the limitations of this study is the lack of a direct gold-standard measure of brain pulsatility. Although our data showed a decrease in pulsatility post-exercise, we are unable to validate these findings with other techniques. The changes in pulsatility may reflect acute cerebral blood flow changes, which we observed previously and note that white matter showed more of a time-dependent response compared to grey matter. 62 Therefore, we speculate that the global grey and white matter pulsatility decreases after exercise could in part be explained by changes in cerebral blood flow. This study did not include monitoring end-tidal carbon dioxide, nor continuous blood pressure; each of the variables would influence cerebral blood flow as well as pulsatility. Additionally, angiography scans were not collected, so we are unable to co-localize vascular anatomy with the BOLD pulsatility maps; however, previous literature suggests there is good agreement. 28 Another source of variation is heart-rate variability, which has previously reported to influence functional connectivity, 63 and is not accounted for in this study. We surmise that variation in the heart rate, i.e. changes in the RR intervals, could lead to a less precise localization of the peak in the finger pulse trace. We estimated a peak width (i.e. 10% from the peak) in the finger pulse trace to be 79 ± 19 ms, corresponding to roughly 8.8% of the average heartbeat interval. Intravascular flow/volume and extravascular bulk flow can also contribute to BOLD signal variation so we are unable to isolate these competing effects. RETROICOR was implemented as the first image-processing step, in line with accepted use of this technique. BOLD data were acquired in ascending order; therefore, it is possible that superior slices could have reduced detection of pulsatility on account of less effective data cleaning. The prominent pulsatility from the sagittal sinus, however, suggests that our method was capable of detecting pulsatility features for higher axial slices. Future work could include fluid nulling approaches to improve isolation of pulsatility signals64,65 or extend the pulsatility analysis to investigate whether parameters in the Fourier model provide additional insight when compared to the goodness-of-fit metric. A final limitation is that we did not measure blood pressure during BOLD scanning, which would have been useful in interpreting the pulsatility changes over the course of scanning post-exercise.
Conclusions
Resorting BOLD fMRI volumes according to their position in the cardiac cycle provides a reliable method to visualize and quantify cardiac-related brain pulsatility. BOLD pulsatility was markedly reduced in grey and white matter, and ventricular CSF compartments acutely after semi-recumbent cycling aerobic exercise among healthy adolescents. The implicated exercise-based physiological alterations likely include changes in cardiac output, vascular tone, arterial stiffness, and blood pressure. There was a persistent decrease in regional pulsatility up to 30 min after exercise cessation in the left insula, a region that regulates autonomic signals. The proposed BOLD pulsatility approach is amenable to retrospective BOLD fMRI, so long as the cardiac and respiratory traces have been collected. Cardiac-related BOLD pulsatility appears evident over a range of TR and TE values. This study helps to establish the feasibility of mapping BOLD cardiac pulsatility changes in response to aerobic exercise among healthy adolescents. This work is amenable to broader application, such as hypertension or vascular aging, where by comparison cerebral blood flow is reduced and pulsatility is likely increased; we note examples of clinical brain pulsatility in the literature already.3,5,66,67 This study also emphasizes the benefit of recording cardiac and respiratory signals during BOLD scans, both as a vital component for measuring cerebrovascular pulsatility and to account for the strong influence that these sources play in conventional activation studies.
Footnotes
Authors’ contributions
AT performed all data processing and analysis, interpreted results and drafted the manuscript. BIG designed the study, interpreted results and revised the manuscript. ASWM helped with study design, data processing and revised the manuscript. ADR helped with the study design, advised on data interpretation and revised the manuscript. BJM conceived of the study design and analysis approach, interpreted results, helped draft the manuscript and approved the final version.
Declaration of conflicting interests
The author(s) declared no potential conflicts of interest with respect to the research, authorship, and/or publication of this article.
Funding
The author(s) disclosed receipt of the following financial support for the research, authorship, and/or publication of this article: This research was supported by a grant from the Ontario Mental Health Foundation (1010589). BJM was supported by a NARSAD Independent Investigator Grant from the Brain and Behavior Research Foundation. The authors thank Garry Detlzer and Ruby Endre for MRI data collection.