
Abstract
Iron released after intracerebral hemorrhage (ICH) is damaging to the brain. Measurement of the content and distribution of iron in the hematoma could predict brain damage. In this study, 16 Yorkshire piglets were subjected to autologous blood injection ICH model and studied longitudinally using quantitative susceptibility mapping and R2* relaxivity MRI on day 1 and 7 post-ICH. Phantom calibration of susceptibility demonstrated (1) iron distribution heterogeneity within the hematoma and (2) natural absorption of iron from 154 ± 78 µg/mL (day 1) to 127 ± 33 µg/mL (day 7). R2* in the hematoma decreased at day 7. This method could be adopted for ICH in humans.
Keywords
Introduction
During intracerebral hemorrhage (ICH), bleeding within the brain parenchyma may result in irreversible neurological deficit or death. Mechanical tissue damage and cytotoxicity of hemolysis-generated hemoglobin/heme/iron are linked to neuroinflammation, blood–brain barrier disruption, and edema.1–7 Free iron causes brain injury by triggering ferroptosis, 8 activating prolyl hydroxylase, 9 and catalysis of free radical production via Fenton’s oxidation. Free radicals could damage proteins, lipids, and nucleic acid.10–13 Better understanding of iron-induced injury could be essential for developing effective treatment strategies.
Preventing iron-mediated toxicity is a promising therapeutic target for ICH. Systemic administration of deferoxamine, an iron chelater, attenuates brain edema and improves functional deficits in the rat and pig ICH models, and is currently under clinical evaluation in humans.14–17 Thus, accurate approach for quantification of iron bio-distribution in hematoma could help in better understanding of iron-mediated damage in ICH in humans. Currently, gross hematoma volume (HV) and its anatomical location at acute stages are the main prognostic markers for ICH outcome.
ICH is normally characterized as hypointensity on T2*-weighted gradient echo (GRE) MRI which is sensitive to the presence of paramagnetic substances including iron. However, GRE is known for blooming artifacts, which leads to overestimation of HV. 18 The rate of transverse magnetization relaxation, R2* (R2* = 1/T2*) significantly increases in the presence of iron, and could be used as an indirect measure of iron concentrations.19–25 The enhanced R2* relaxation is utilized in susceptibility-weighted imaging (SWI), which combines image magnitude with the phase shift caused by local susceptibility differences, enhancing sensitivity.26,27 Quantitative susceptibility mapping (QSM) uses advanced processing of the phase images to calculate a quantitative susceptibility map. 28 QSM differentiates between paramagnetic substances (such as iron, ferritin, and hemosiderin) from diamagnetic substances (such as calcium, water or myelin). Use of R2* and QSM for determining in vivo brain iron concentrations has been validated in postmortem studies and calibration curves using phantom imaging have been documented.29–31
In this study, we demonstrated feasibility of measuring serially iron in an autologous blood infusion pig model using quantitative R2* and susceptibility to demonstrate heterogeneity in iron content within the hematoma. 32 A calibration phantom is used to convert the hematoma susceptibility measurements into iron concentration.
Methods and procedures
Animal studies were approved by our institution’s Animal Welfare Committee. The studies followed the guidelines outlined in the Guide for the Care and Use of Laboratory Animals from the National Institutes of Health and the ARRIVE guidelines on animal research. 33
Induction of ICH
Sixteen male Yorkshire pigs were studied with average age/weight of 8 week/13.4 ± 2.4 kg. Pigs were sedated with ketamine (25 mg/kg, IM) and maintained under isoflurane during the surgery. During this surgery, animals were intubated and the right jugular artery was catheterized for monitoring blood pressure, blood gases, and glucose concentrations. Body temperature was maintained at 37.5℃ by blanket.
A cranial burr hole (1.5 mm diameter) was drilled 11 mm to the right of the sagittal and 11 mm anterior to the coronal suture. An 18 mm 20-gauge sterile plastic catheter was placed stereotaxically into the center of the right frontal cerebral white matter (centrum semiovale) at the level of the caudate nucleus and cemented in place. Lobar ICH was induced by pressure controlled infusion of 1.0 mL of autologous blood into the right frontal hemisphere over 10 min. After a 5-min break, another 1.5 ml of blood was injected over 6 min.
Image acquisition
ICH shows large dynamics over the first few days of onset.34,35 Therefore, the pigs were imaged one day after the surgery with a follow-up scan on day 7. During scanning, animals were ventilated with average 18 breath-per-minute with maximum airway pressure of 20 cm-H2O, oxygen saturation level (SpO2) of 97%, typical end tidal CO2 of 47 mmHg, heart rate 120 beat-per-minute, and body temperature 98.6℃. Anesthesia was maintained with 2% isoflurane mixed with oxygen.
Animals were positioned prone in 3.0 Tesla Philips Ingenia MRI system (Philips, Best, Netherlands) and imaged using 15-channel head coil. Anatomical imaging included: 3D T1-weighted (TR/TE = 8.11/3.74 ms, FOV = 200 × 200 × 64 mm3), 2D coronal T2-wighted (TR/TE = 3500/100 ms, FOV = 200 ×200 mm2, slice thickness = 3 mm), and 3D fluid-attenuated inversion recovery (FLAIR, TR/TE = 4800/383 ms, FOV = 200 × 200 × 64 mm3). QSM was obtained using 3D fast GRE with eight echoes, minimum TE = 5.79 ms, and echo spacing = 9.06 ms. Both magnitude and phase images were saved.
Calibration phantom
Six phantoms of iron(III) chloride (Sigma-Aldrich, St. Louis, MO) in deionized water were prepared with concentration of 100, 300, 500, 700, 900, and 1200 µg Fe/mL. The phantoms were imaged using the same QSM protocol described above. Susceptibility was measured in a regions-of-interest (ROIs) in the middle of the phantoms.
Image analysis
Hematoma and edema volumes
A semi-automated seed growing algorithm using Analyze 10.0 (Analyze Direct Inc., KS, USA) was used to delineate hematoma and edema volume on FLAIR images.
R2*
Non-brain tissues were removed using the BET tool. 36 All time points were registered using rigid-body transformation in SPM12 (http://www.fil.ion.ucl.ac.uk/spm/software/). A custom script in Matlab (Mathwork, Natick, MA) generated the R2* maps. Fifteen ROIs of size ∼30 pixels were placed across 3–5 slices for hematoma, surrounding edema, and contralateral ventricular cerebral spinal fluid (CSF), and the average R2* values were recorded.
QSM
The Matlab-based susceptibility tensor imaging (STI) software 37 was used to compute the susceptibility maps. ROI analysis was repeated using the same ROIs defined on the R2* maps. Placement of ROIs within hematoma was performed independently by two raters (MEH and AV).
Statistical analysis
Statistical analysis used paired t-testing in SigmaPlot (version 11.0 Systat Software, San Jose, CA). A linear regression was performed to evaluate correlation between R2* and QSM measurements, and between the two time points.
Results
Figure 1 shows representative images of multi-modal MRI and quantitative maps from one slice in one animal. The FLAIR image visualizes a hypointense core corresponding to hematoma, surrounded by hyperintese edema. In this case, edema shows significant attenuation at day 7 compared with day 1. The T1-weighted image depicts changes in hematoma from hypointense (day 1) to hyperintense signal (day 7). The GRE images show a reduction in total hematoma and edema volume at day 7 relative to day 1. A heterogeneous distribution of R2* values is observed within the hematoma. At day 7, a significant reduction is observed in R2* within the hematoma. The susceptibility maps also show reduction within the hematoma at day 7. Both R2* and susceptibility (Figure 1, image overlay) confirm heterogeneity within the hematoma. Figure 1(c) shows the ROIs used for calculating the intracranial (ICV), hematoma, and edema volumes in the same animal. Significant reductions in hematoma and edema volumes are observed at day 7 compared with day 1 (Figure 1(d)), measuring 31.0 ± 24.7% (p = 0.02) and 52.4 ± 31.7% (p = 0.001), respectively. Intraventricular hemorrhage was observed in only 3 out of 16 animals.
Serial multi-contrast anatomical and quantitative parametric MRI maps of one ICH pig brain at day 1 (a) and day 7 (b). The data show, from left to right, FLAIR, T1w, GRE, R2* map, QSM susceptibly map, and an image overlay of R2* (gray) and QSM (red). Also shown are two of five typical regions of interest (ROI). Qualitative interpretation indicates edema volume reduction on FLAIR, hemoglobin breakdown to paramagnetic methemoglobin on T1w, and hematoma volume reduction on GRE. (c) Outlined boundaries of intracranial volume (green), edema (blue), and hematoma (yellow). (d) Hematoma and edema volume changes between day 1 and day 7. Asterisks denote statistical significance relative to day 1 (*p < 0.05, **p < 0.001).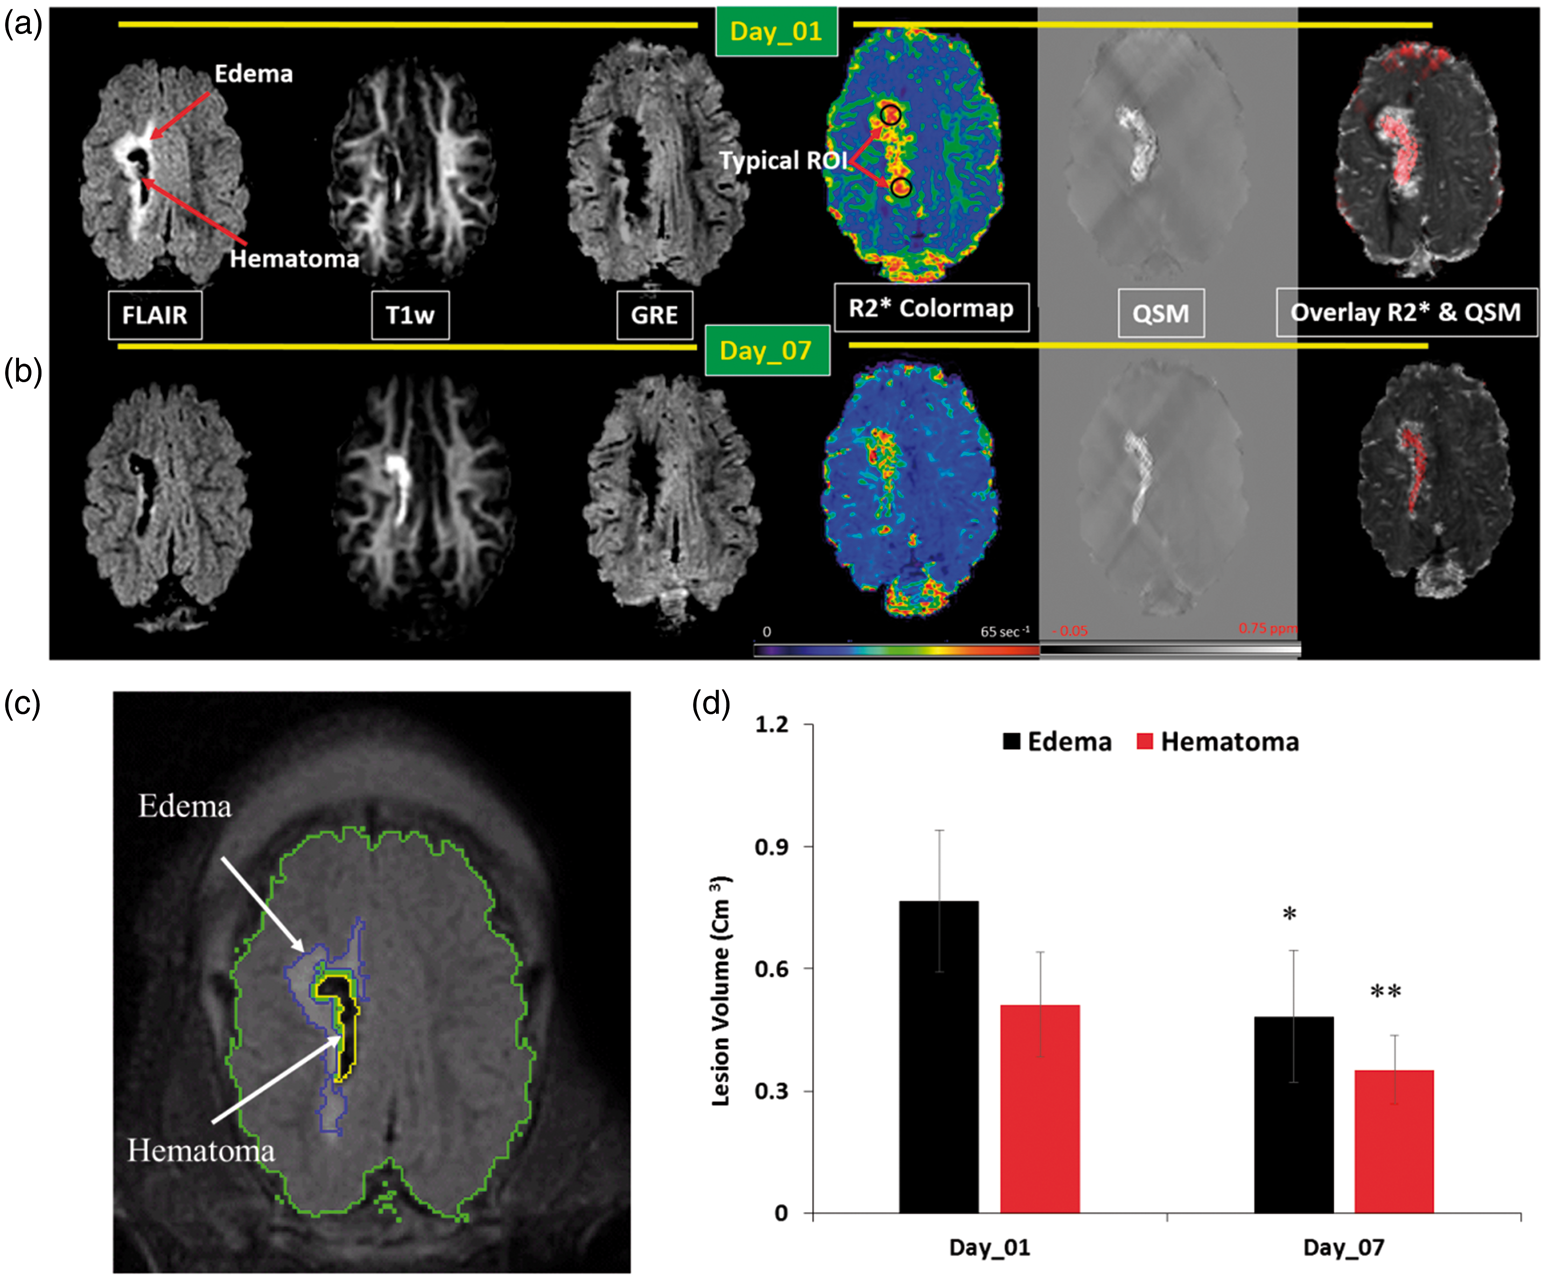
Figure 2 summarizes the changes in R2* and susceptibility within the hematoma, edema, and CSF. R2* was reduced (p < 0.05) in both hematoma and CSF, while susceptibility was significantly reduced (p < 0.05) in edema at day 7. Calibration of the iron chloride phantom shows a linear relation (Figure 2(c)) with regression line: susceptibility in ppm = 0.0012 × (iron concentration in µg/mL) – 0.08325, in good agreement with previous reports.29,38 Using this calibration, iron concentration in the hematoma was estimated to be 154 ± 78 and 127 ± 33 µg/mL at day 1 and day 7, respectively. A strong correlation is observed between R2* and susceptibility within the hematoma after removing one outlier at both day 1 (R2 = 0.32, p < 0.03, Figure 2(d)) and day 7 (R2 = 0.86, p < 0.001).
Serial quantitative R2* (a) and QSM (b) measurements within hematoma, edema, and cerebral spinal fluid (CSF) at days 1 and 7 post ICH. (c) Relationship between iron concentration in the calibration phantom and the measured magnetic susceptibility. (d) Correlation between R2* and susceptibilities within hematoma at Day 1 and Day 7.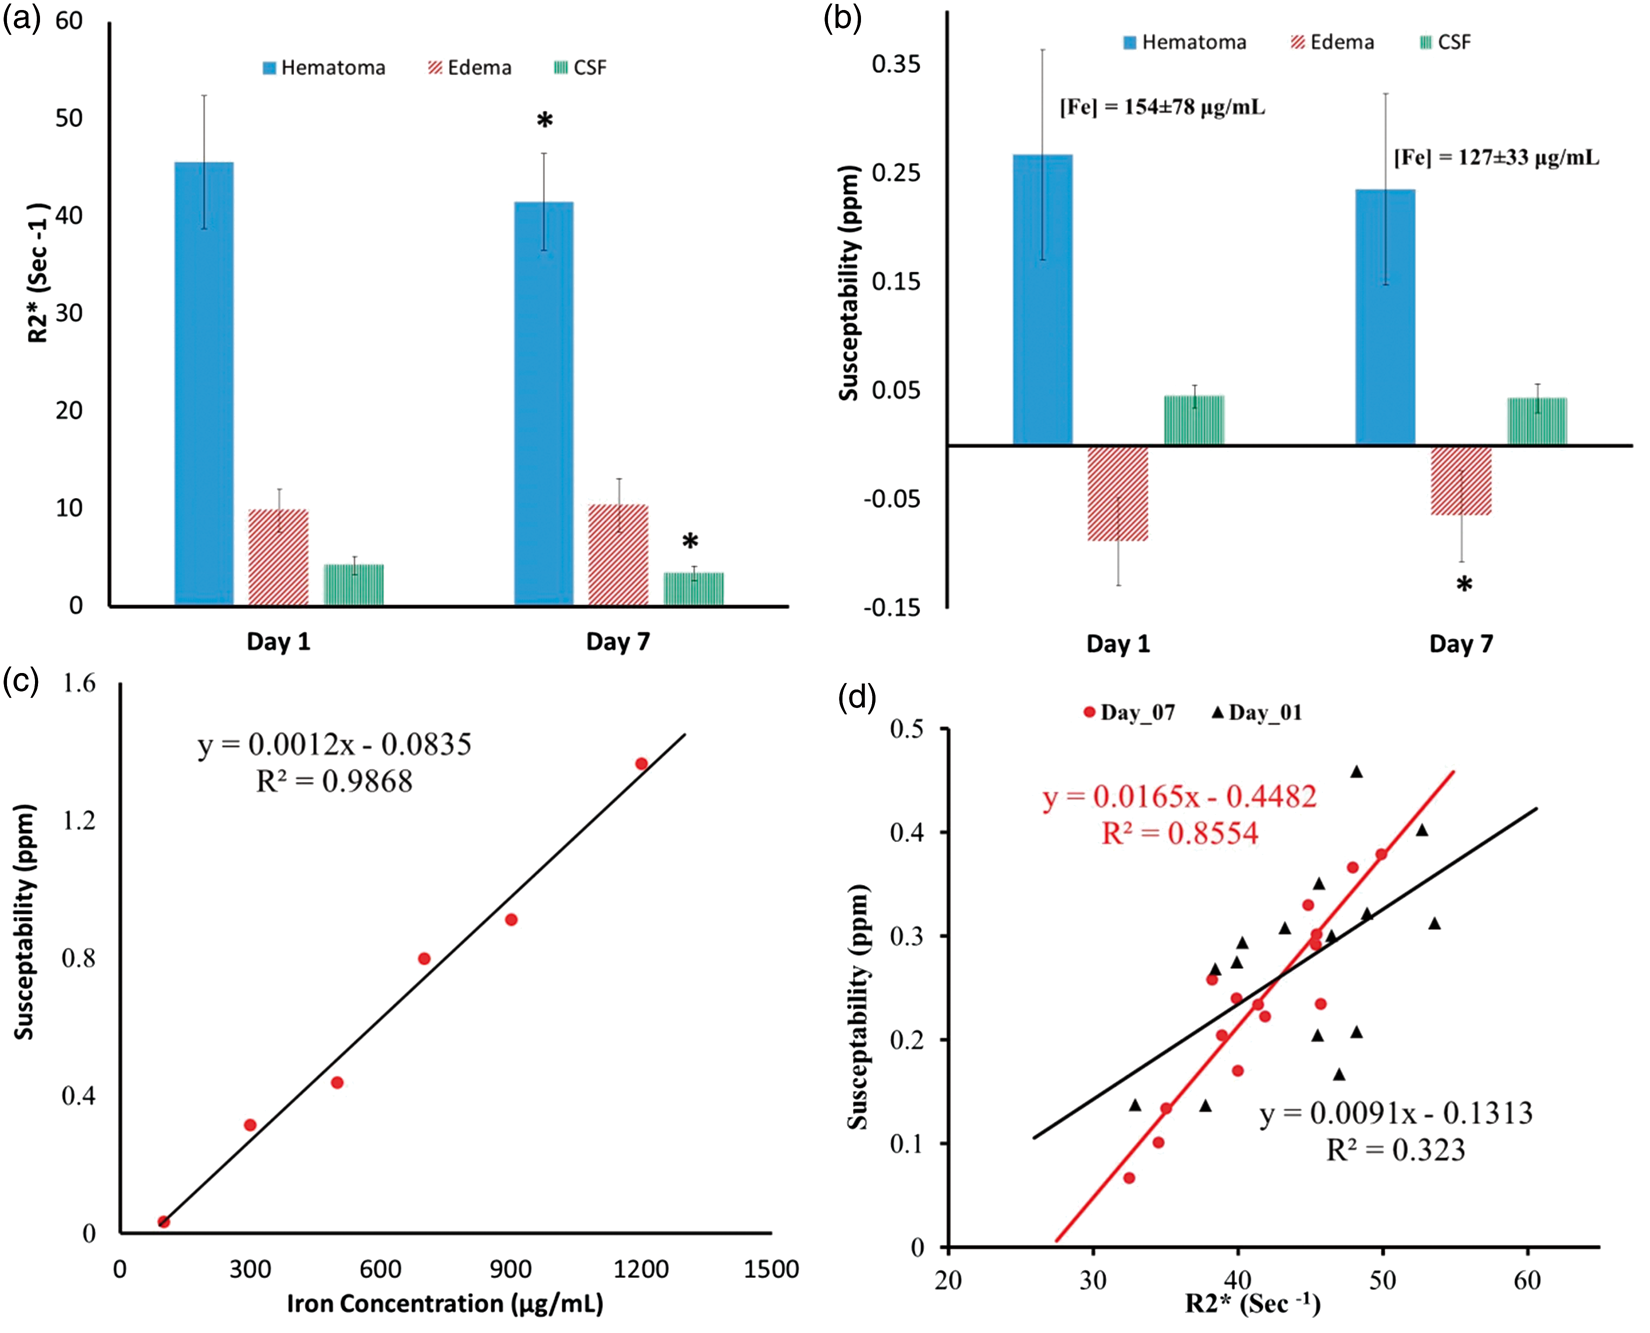
Discussion
Accelerated rate of T2* signal decay is associated with the presence of both heme and non-heme iron, and it has been used as an indirect quantitative tool to measure iron concentration.20,39,40 In this work, we used quantitative QSM and R2* to longitudinally study iron changes in susceptibility in an ICH pig model. The pig ICH model used in this study has several advantages over rodent models, including the human-like gyrated brain, larger hemispheric white matter volumes, and the larger hematoma and edema volumes. Using this model, we observed a spatially varying R2* and susceptibility within the hematoma, suggesting a heterogeneous distribution of iron. Such heterogeneity may not be readily detected using conventional imaging methods targeting the delineation of the boundaries of the HVs. In addition, using a calibration phantom, we estimated the iron concentration within the hematoma.
Resolution of hematoma and edema over time—evaluated using conventional MRI and computed tomography—is considered as a sign of improvement/recovery in patients with ICH.41,42 Conventional imaging may not be adequate to evaluate efficacy of therapeutic interventions targeting endogenous clearance of hematoma-deposited iron.15,16,43,44 Longitudinal studies using advanced MRI methods for quantifying iron as presented in this study could be essential for assessing the efficacy of new treatments targeting iron.
Presence of iron within the hematoma results in an increase in R2*, whereas presence of cytotoxic/vasogenic edema decreases R2* (i.e. increased T2*).45–48 Here, we observed a significant reduction in R2* and a trend toward lower susceptibility within the hematoma at day 7, compared with day 1. The decrease in susceptibility did not reach statistical significance, perhaps due to large variation in the HV among animals (0.54 ± 0.57 mL). Decrease in susceptibility within the edema at day 7 is attributable to the smaller edema volume.
A significant decrease in R2* within the contralateral ventricular CSF between the two time-points was probably due to removal of extracellular blood plasma and/or an increased CSF production causing dilution, increasing T2*. No change in susceptibility within the CSF suggests the absence of diffuse iron and also supports the notion that significant decrease in R2* is driven by non-heme-related changes.
A strong correlation between R2* and susceptibility was observed in the sub-chronic phase, similar to previous work. 49 However, only a week correlation was found in the sub-acute stage of ICH. The poor correlation at day 1 could be due to dynamic pathological changes which settled down at day 7, resulting in an improved correlation. Visual inspection of multimodal imaging contrast between day 1 and day 7 suggests the presence of channels within the hematoma causing liquid plasma straining through the hematoma. The negative susceptibility within the surrounding edema also suggests lack of diffuse iron, but this finding needs further histological validation.
Assessing the value of these advanced imaging biomarkers in disease progressions requires further histological confirmation and clinical evaluation, which will be pursued in a future study. Another challenge of this study was the variations observed in the induced hemorrhage and edema volumes, despite the consistency in the surgical procedure and the constant volume of injected blood. These variations could be due to differences in responses among individual animals. The methodological limitations include the ill-conditioned QSM solvers which are prone to streak artifacts, and the sensitivity of R2* to blooming artifacts especially at tissue-air interfaces.
In summary, we have shown that R2* and QSM can provide qualitative and quantitative information about the heterogeneity and longitudinal evolution of hematomas in the pig model of ICH. These tools can be used to assess the efficacy of new experimental ICH treatments, particularly those targeting iron, and may help advance our understanding of the pathological role of iron-induced secondary damage in cerebral hemorrhage.
Footnotes
Funding
The author(s) disclosed receipt of the following financial support for the research, authorship, and/or publication of this article: This work was supported by National Institute of Health /National Institute of Neurological Disorders and Stroke 5R42NS090650-03.
Acknowledgements
The authors thank Dr. Christopher Smith and veterinarian team for surgical and technical assistance and Mr. Vipulkumar Patel for help with MRI experiments.
Declaration of conflicting interests
The author(s) declared no potential conflicts of interest with respect to the research, authorship, and/or publication of this article.
Authors’ contributions
MH designed the study, carried MRI quantitative analysis, and drafted the manuscript. REG contributed to data analysis, assisted in optimizing MRI acquisition. XZ supervised the animal surgical procedures and induction of the hematoma. KMH provided qualitative and quantitative quality assurance of images and data analysis. AV measured hematoma and edema volumes. PAN facilitated and supervised the animals MRI imaging protocol. ST assisted in animal preparation and surgical procedures. GS performed the animal surgical procedure. SIS assisted in interpretation of the results. JA supervised and facilitated both surgical and imaging components of the study, and interpreted the results. All authors contributed to and approved the final manuscript.