
Abstract
The mechanisms underlying dysfunction of cerebral microvasculature induced by type 1 diabetes (T1D) are not fully understood. We hypothesized that in cerebral microvascular endothelium, α-processing of amyloid precursor protein (APP) is impaired by T1D. In cerebral microvessels derived from streptozotocin (STZ)-induced T1D mice protein levels of APP and its α-processing enzyme, a disintegrin and metalloprotease 10 (ADAM10) were significantly decreased, along with down-regulation of adenylate cyclase 3 (AC3) and enhanced production of thromboxane A2 (TXA2). In vitro studies in human brain microvascular endothelial cells (BMECs) revealed that knockdown of AC3 significantly suppressed ADAM10 protein levels, and that activation of TXA2 receptor decreased APP expression. Furthermore, levels of soluble APPα (sAPPα, a product of α-processing of APP) were significantly reduced in hippocampus of T1D mice. In contrast, amyloidogenic processing of APP was not affected by T1D in both cerebral microvessels and hippocampus. Most notably, studies in endothelial specific APP knockout mice established that genetic inactivation of APP in endothelium was sufficient to significantly reduce sAPPα levels in the hippocampus. In aggregate, our findings suggest that T1D impairs non-amyloidogenic processing of APP in cerebral microvessels. This may exert detrimental effect on local concentration of neuroprotective molecule, sAPPα, in the hippocampus.
Keywords
Dysfunction of cerebral microvessels caused by chronic hyperglycemia plays an important role in the cognitive decline observed in diabetic patients.1,2 In the brain of experimental animals with type 1 diabetes (T1D), the morphological changes in endothelium and smooth muscle cells, and impaired reactivity of arterioles and venules, appear at the early stage of diabetes.3–5 This phenomenon supports the concept that disrupted function and integrity of cerebral vasculature contribute to the initiation of neurological dysfunction. In addition, since normal function of cerebral microvasculature is critical for triggering endogenous neurogenesis after injury such as stroke, 6 hyperglycemia-induced cerebral vascular dysfunction has detrimental effect on brain recovery after ischemic stroke in mice. 7 However, mechanisms underlying dysfunction of cerebral microvessels during T1D are not fully understood. Our previous studies have demonstrated that amyloid precursor protein (APP) is mostly expressed in endothelium of blood vessels, 8 suggesting a possible important role of endothelial APP in vascular homeostasis.
Three major isoforms (namely APP695, APP751, APP770) of the transmembrane glycoprotein APP have been identified. 9 Brain microvascular endothelial cells (BMECs) primarily express APP770 and APP751, both of them containing Kunitz-type protease inhibitor (KPI) domain. 9 APP is proteolytically processed by two major pathways. In the amyloidogenic pathway, β-site APP cleaving enzyme 1 (BACE1) generates amyloid beta (Aβ) peptides that are critically important in the pathogenesis of Alzheimer's disease. In the non-amyloidogenic pathway, activation of disintegrin and metalloprotease 10 (ADAM10), ADAM17, and ADAM9, generates soluble APP alpha (sAPPα). It has been demonstrated that the KPI domain of sAPP is responsible for inhibition of prothrombotic proteinase factor XIa therefore inhibiting cerebral thrombosis. 10 Under physiological conditions, α-processing pathway is the dominant mechanism of APP processing in non-neuronal cell types including endothelium.9,11–13
Extensive studies have demonstrated that sAPPα has neurotrophic and neuroprotective effects.14,15 Indeed, sAPPα is capable of rescuing neuronal phenotypic deficits of APP−/− mice. 16 Since in the brain, neurogenic niches are highly vascularized regions with highly permeable capillaries,17,18 it is possible that neurotrophic molecules such as sAPPα produced by the microvasculature may play an important role in protecting surrounding neuronal tissues. Our previous study has established that prostacyclin (PGI2) signaling pathway plays an important role in APP metabolism in cerebral microvessels. 19 However, APP processing in the cerebral vasculature of T1D in mice or humans has not been studied. The present study was therefore designed to test the hypothesis that non-amyloidogenic processing of APP in cerebral microvascular endothelium is impaired in T1D.
Material and methods
Mice
Use of the animals and protocols, and all experimental procedures performed on live animals (blood collection, and injection of streptozotocin (STZ)) were approved by the Institutional Animal Care and Use Committee of Mayo Clinic. Animals used in this study received care in compliance with the Guide for the Care and Use of Laboratory Animals published by the National Institute of Health. All mice were maintained on standard chow with free access to drinking water in a 12-h-light, 12-h-dark cycle room. T1D mice were created as described in our previous study. 20 Male mice (B6129SF2J, six-to-eight weeks old, The Jackson Laboratory, Bar Harbor, ME) were randomly assigned to be injected with STZ (Sigma-Aldrich, St. Louis, MO; 110 mg/kg body weight, intraperitoneally), or injected with solvent (0.09 M citrate buffer solution, Sigma-Aldrich, control group). Blood glucose was examined one and two weeks after STZ injection, as well as two or eight weeks after developing hyperglycemia. Animals with blood glucose >300 mg/mL were considered diabetic and were used for experiments two or eight weeks after developing hyperglycemia. Blood glucose in control and STZ-induced diabetic mice at two weeks after developing hyperglycemia were 220.6 ± 8.9 and 526.8 ± 17.5 mg/dL, respectively (n = 17, P < 0.05). Body weight in control and diabetic mice with hyperglycemia for two weeks was 28.2 ± 0.8 and 26.1 ± 0.7 g, respectively (n = 17, P < 0.05). Blood glucose in control and STZ-induced diabetic mice at eight weeks after developing hyperglycemia were 189.6 ± 7.5 and 544.9 ± 14.2 mg/dL, respectively (n = 27–29, P < 0.05). Body weight in control and diabetic mice with 2-month hyperglycemia were 33.4 ± 0.8 and 28.0 ± 0.7 g, respectively (n = 27–29, P < 0.05). Investigator was not blinded as to which mouse belonged to control group and which belonged to diabetic group. Mice were euthanized by injecting pentobarbital (250 mg/kg body weight; intraperitoneally) before harvesting of brain tissue. The experiments were performed in accordance with the ARRIVE guidelines.
Mice harboring loxP sites on either side of exon 3 of the APP gene on C57BL/6J background kindly provided by Dr. H. Zheng (Baylor College of Medicine, Houston, TX) were crossed with Tie2-Cre transgenic mice, generating endothelium-specific APP-deficient (eAPP−/−) mice in our laboratory as previously described. 21 Wild type littermates were used as control mice. Male four-to-six months old mice were used in the experiments.
Isolation of cerebral microvasculature
Cerebral microvessels were isolated from whole brain as described in our previous studies. 19 Mouse brain was collected and placed in cold (4℃) modified Krebs–Ringer bicarbonate solution (in mmol/L: NaCl 118.6; KCl 4.7; CaCl2 2.5; MgSO4 1.2; KH2PO4 1.2; NaHCO3 25.1; glucose 10.1; EDTA 0.026). After anterior cerebral, posterior cerebral, middle cerebral and basilar arteries were removed, cerebral microvessels were subsequently isolated from whole brain or brain hemisphere by 15% Dextran (Sigma-Aldrich) centrifugation. 19 For isolation of microvessels of hippocampus, both hippocampi of the mouse (pool of two mice per sample) were collected and microvessels were isolated as described above.
Isolation of mouse BMECs
Mouse BMECs were isolated as described in our previous studies. 19 Brain microvessels pellet was suspended in endothelial basal medium 2 (EBM2) (Lonza, Allendale, NJ) containing 1 mg/ml collagenase/dispase (Roche, Indianapolis, IN), 1000 U/ml DNase 1 (Roche), and 0.147 µg/ml tosyllysine chloromethyl ketone (Sigma-Aldrich) and incubated at 37℃ for 75 min. The isolated cells were then washed with endothelial growth medium 2 (EGM2, Lonza), and cultured in 24-well plates coated with mouse collagen IV (BD Biosciences, San Jose, CA). Cells were cultured in EGM2 + 15% FCS. Puromycin (4 µg/ml, Sigma-Aldrich) was added to the culture for the first 48 h to deplete the cells of non-endothelial origin. After culturing cells for eight days, BMECs were collected for isolation of total RNA.
Western blot analysis
Western blot analysis of APP and its processing, and prostaglandin metabolism was conducted as described in our previous studies.19,22 Isolated cerebral microvessels were homogenized in lysis buffer (containing 50 mmol/L NaCl, 50 mmol/L NaF, 50 mmol/L sodium pyrophosphate, 5 mmol/L EDTA, 5 mmol/L EGTA, 0.1 mmol/L Na3VO4, 1% Triton X-100, 10 mmol/L HEPES, pH 7.4) and protease inhibitor cocktail (Sigma-Aldrich). 19 The hippocampus was isolated from right hemisphere using a light microscope. After removing any visible vasculature on the surface of the hippocampus, the hippocampus was homogenized in lysis buffer. The protein samples were then subjected to Western blot. Rabbit antibody against APP was obtained from Life Technologies (Rockford, IL). Rabbit anti BACE1 was obtained from Abcam (Cambridge, MA). Rabbit antibody against ADAM9 was obtained from Cell Signaling Technology (Danvers, MA). Rabbit antibodies against ADAM10 and ADAM17 were obtained from EMD Millipore Corporation (Temecula, CA). Mouse anti-sAPPα antibody (2B3) was purchased from Immuno-Biological Laboratories (Minneapolis, MN). Rabbit anti prostacyclin synthase (PGIS) and thromboxane A2 synthase (TXAS), and Rabbit-anti-mouse cyclooxygenase 2 (COX2) were purchased from Cayman Chemical (Ann Arbor, MI). Mouse anti COX1 was obtained from Invitrogen (Carlsbad, CA). Goat anti prostaglandin I2 (IP) receptor, and rabbit anti adenylate cyclase 3 (AC3), AC5/6, AC2, and AC4 were purchased from Santa Cruz Biotechnology (Dallas, TX).23,24 Blots probed with mouse-anti-actin (Sigma-Aldrich) were used as loading controls. Protein expression was normalized to actin. For α-secretases, the protein levels of mature ADAM9, mature ADAM10, and mature ADAM17 were quantified. The blot was either exposed to CL-X Posure film (Pierce) followed by quantifications of optical densities of the bands by using UN-SCAN-IT gel 6.1 (Silk Scientific Corporation, Orem, UT) or subjected to LI-COR digital imaging analysis system (Model 2800, Image Studio Version 4.0) (LI-COR, Inc., Lincoln, NE).
Measurements of cAMP, thromboxane A2, and PGI2
The microvessel lysates were acetylated before measuring cAMP levels using colorimetric cAMP ELISA Kit (Cell Biolabs, San Diego, CA), according to manufacturer's protocol. TXA2 and PGI2 were measured as their stable metabolites, TXB2 and 6-ketoProstaglandin F1α (6-ketoPGF1α), respectively. 22 After brain microvessels were incubated with 10 µM arachidonic acid for 1 h, the supernatants were collected and subjected to TXB2 ELISA assay or 6-ketoPGF1α ELISA assay (Cayman Chemical).
Knockdown of AC3 by small interfering RNA
Cultured human BMECs (Applied Cell Biology Research Institute, Kirkland, WA) were used at passages 4–6. Experiments were performed as described in our previous studies by use of Lipofectamine 2000 (Invitrogen). 19 For knock-down of AC3, cells were treated with AC3-small interfering RNA (siRNA) (a pool of three target-specific siRNAs, from Santa Cruz Biotechnology), or Control-siRNA-A (Santa Cruz Biotechnology) (60 nM) for three days.
RT-qPCR and reverse transcription PCR
RT-qPCR was performed as described in our previous study. 19 After total cellular RNA was isolated using RNeasy Plus Mini kit (Qiagen, Redwood City, CA), SuperScript III First-Strand Synthesis System kit (Invitrogen) was used to reverse transcribe RNA to cDNA. For characterization of isolated mouse BMECs by detection of VE-cadherin, the primers corresponding to mouse VE-cadherin mRNA [forward (5′GAGCT AAGAGGACCCTCTGCTACTC3′) and reverse (5′TGGGCCTCTTTGTGTCTGTATG3′)] were used. Mouse GAPDH primers are: forward (TGCCAAG GCTGTGGGCAAGG3′), and reverse (5′TGGGCCC TCAGATGCCTGCT3′). For quantification of AC3 mRNA using Bio-Rad CFX Connect Real-Time System after human BMECs treated with AC3-siRNA, PrimPCR SYBR Green Assay human ADCY3 and human GAPDH (Bio-Rad, Coralville, IA) were used.
Reverse transcription PCR was performed to confirm endothelial deletion of APP in BMECs derived from eAPP−/− mice. Primers for mouse APP: forward: 5′GCAGATCACAAACGTGGTGG3′; reverse: 5′AG GAACTTGCACTTGTCGGG3′. Mouse GAPDH primers are: forward (TGCCAAGGCTGTGGG CAAGG3′), and reverse (5′TGGGCCCTCAGATG CCTGCT3′).
Measurement of Aβ42 and Aβ40
Aβ42 and Aβ40 levels were measured in lysates of hippocampus isolated from the right hemisphere of control or diabetic mice using mouse Aβ42, and Aβ40 ELISA kits, respectively, according to manufacturer's protocol (Novex, Life Technologies).
Statistical analysis
Data are presented as mean ± SEM, “n” denotes the number of mice from which tissue samples were collected. Differences between mean values of two groups were compared using unpaired Student t-test. Differences between multiple groups were analyzed using one-way ANOVA followed by the Tukey test (SigmaPlot 12.0 for Windows). P < 0.05 was considered statistically significant.
Results
Inhibitory effect of T1D on expression of APP and ADAM10 in brain microvessels
To investigate the APP metabolism, we studied cerebral microvessels isolated from whole brain of control mice and mice with T1D induced by intraperitoneally injection of STZ. Protein expression of APP was significantly decreased in diabetic brain microvessels two weeks or two months after developing hyperglycemia (Figure 1(a)). Interestingly, protein levels of ADAM10 were significantly decreased only in microvessels of two-month T1D, suggesting that this reduced ADAM10 expression only occurred after prolonged hyperglycemia (Figure 1(b)). However, the expression of ADAM17, ADAM9, or BACE1 remained unchanged (Figure 1(c) to (e)). To determine whether APP metablism in hippocampal microvessels is impaired, we further measured protein expression of APP and ADAM10 in microvessels derived from the hippocampi of the mice exposed to two weeks of hyperglycemia. As demonstrated in Figure 1(f) and (g), APP protein levels were significantly decreased, while ADAM10 protein expression was not significantly changed. Therefore, the alterations of expression of APP and ADAM10 in hippacampal microvessels were consistent with the changes observed in microvessels derived from the whole brain.
Protein levels of APP and ADAM10 were decreased in diabetic brain microvessels. (a–e) Mouse cerebral microvessels were isolated from whole brain of the mice exposed to two weeks or two months of hyperglycemia. Western blot was carried out for detection of (a) APP (two weeks, n = 5; two months, n = 9), (b) ADAM10 (two weeks, n = 5; two months, n = 9), (c) ADAM17 (two weeks, n = 5, two months n = 7), (d) ADAM9 (two weeks, n = 5; two months, n = 7), and (e) BACE1 (two weeks, n = 5, two months, n = 7). *P < 0.05, compared to control mice. (f) APP protein expression was significantly reduced in hippocampal microvessels of mice two weeks after developing hyperglycemia (n = 6, *P < 0.05). (g) ADAM10 protein levels were not significantly changed in hippocampal microvessels of two week-T1D mice (n = 6). Cropped blots are displayed.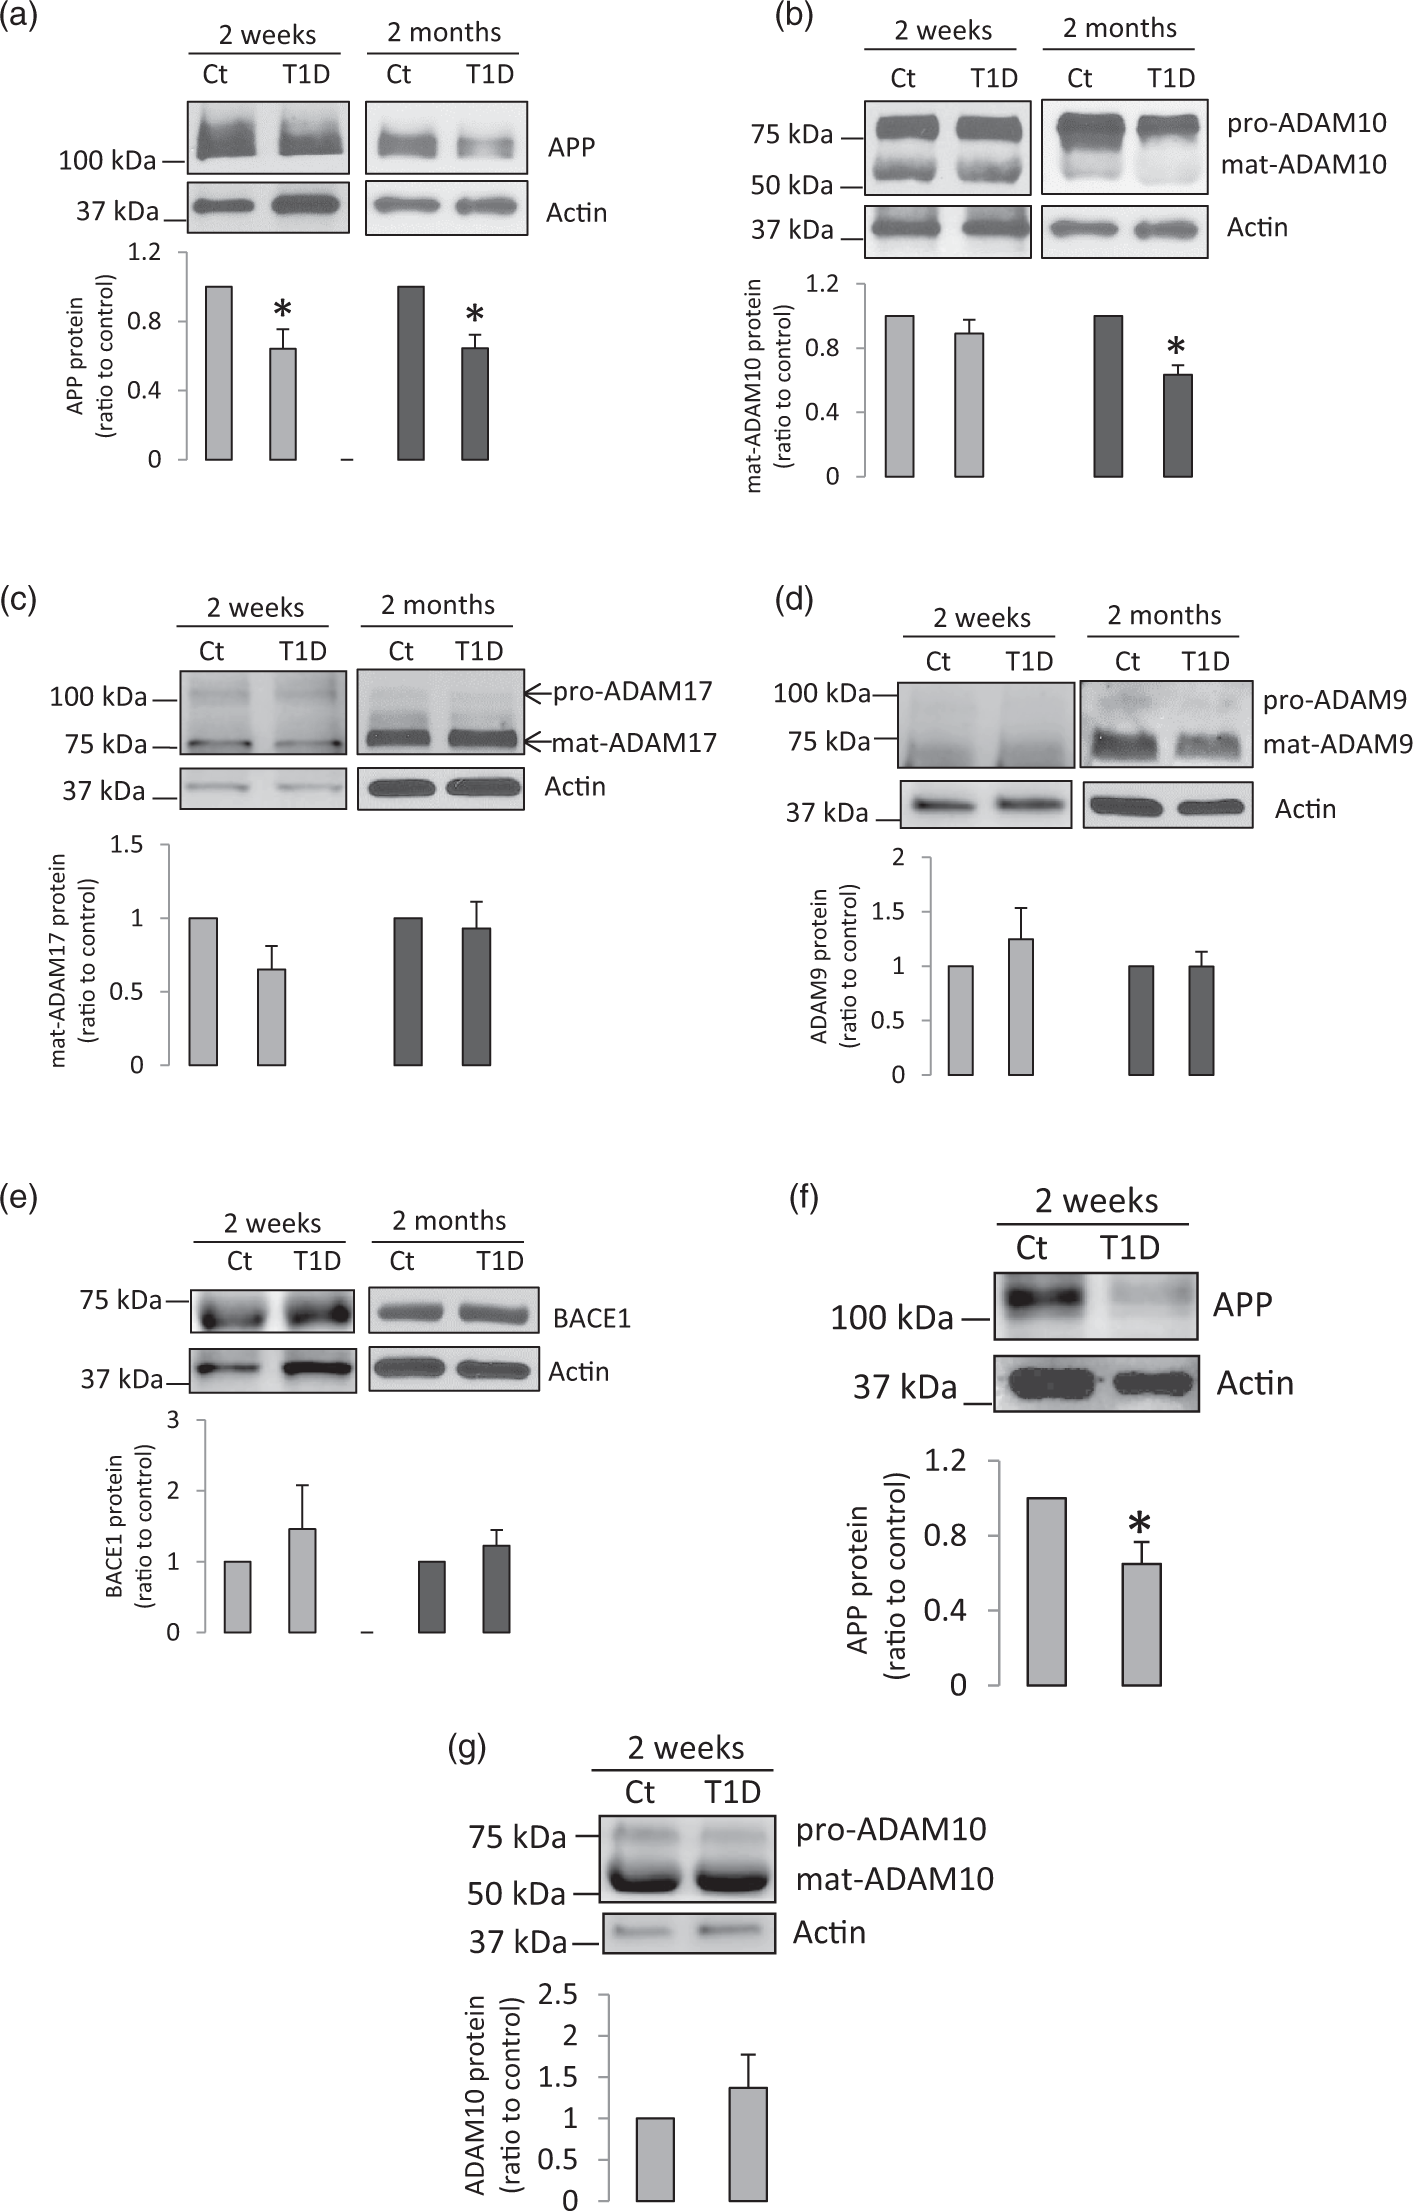
Aberrant prostaglandin signaling in cerebral microvessels
Our previous study
19
has demonstrated that activation of IP receptor-cAMP signaling pathway upregulates the expression of ADAM10 and APP thereby stimulating production of sAPPα in human BMECs. Therefore, we next investigated the metabolism and signaling of prostagladins in cerebral microvessels. Production of PGI2 (measured as 6-keto-PGF1α) and TXA2 (measured as TXB2) in brain microvessels of two-month diabetic mice was significantly increased (Figure 2(a) and (b)). However, we did not detect statistically significant changes in the protein expression levels of COX1, COX2, PGIS, and TXAS (Figure 2(c) to (f)).
Aberrance of PGI2 signaling pathway in two–month diabetic brain microvessels. (a) Released 6-keto-PGF1α from brain microvessels of diabetic mice was significantly increased (n = 5–10, *P < 0.05, compared to control mice). (b) Production of TXB2 was augmented in diabetic cerebral microvessels (n = 5–8, *P < 0.05, compared to control mice). (c–f) Protein expression of COX1 (n = 8), COX2 (n = 10), PGIS (n = 9), or TXAS (n = 10) in cerebral microvessels was not changed. (g) cAMP levels were significantly reduced in diabetic cerebral microvessels (n = 5–10, *P < 0.05, compared to control mice). (h–j) Protein expressions of IP receptor, AC5/6, and AC3 in cerebral microvessels were detected via Western blot (n = 6, *P < 0.05, compared to control mice).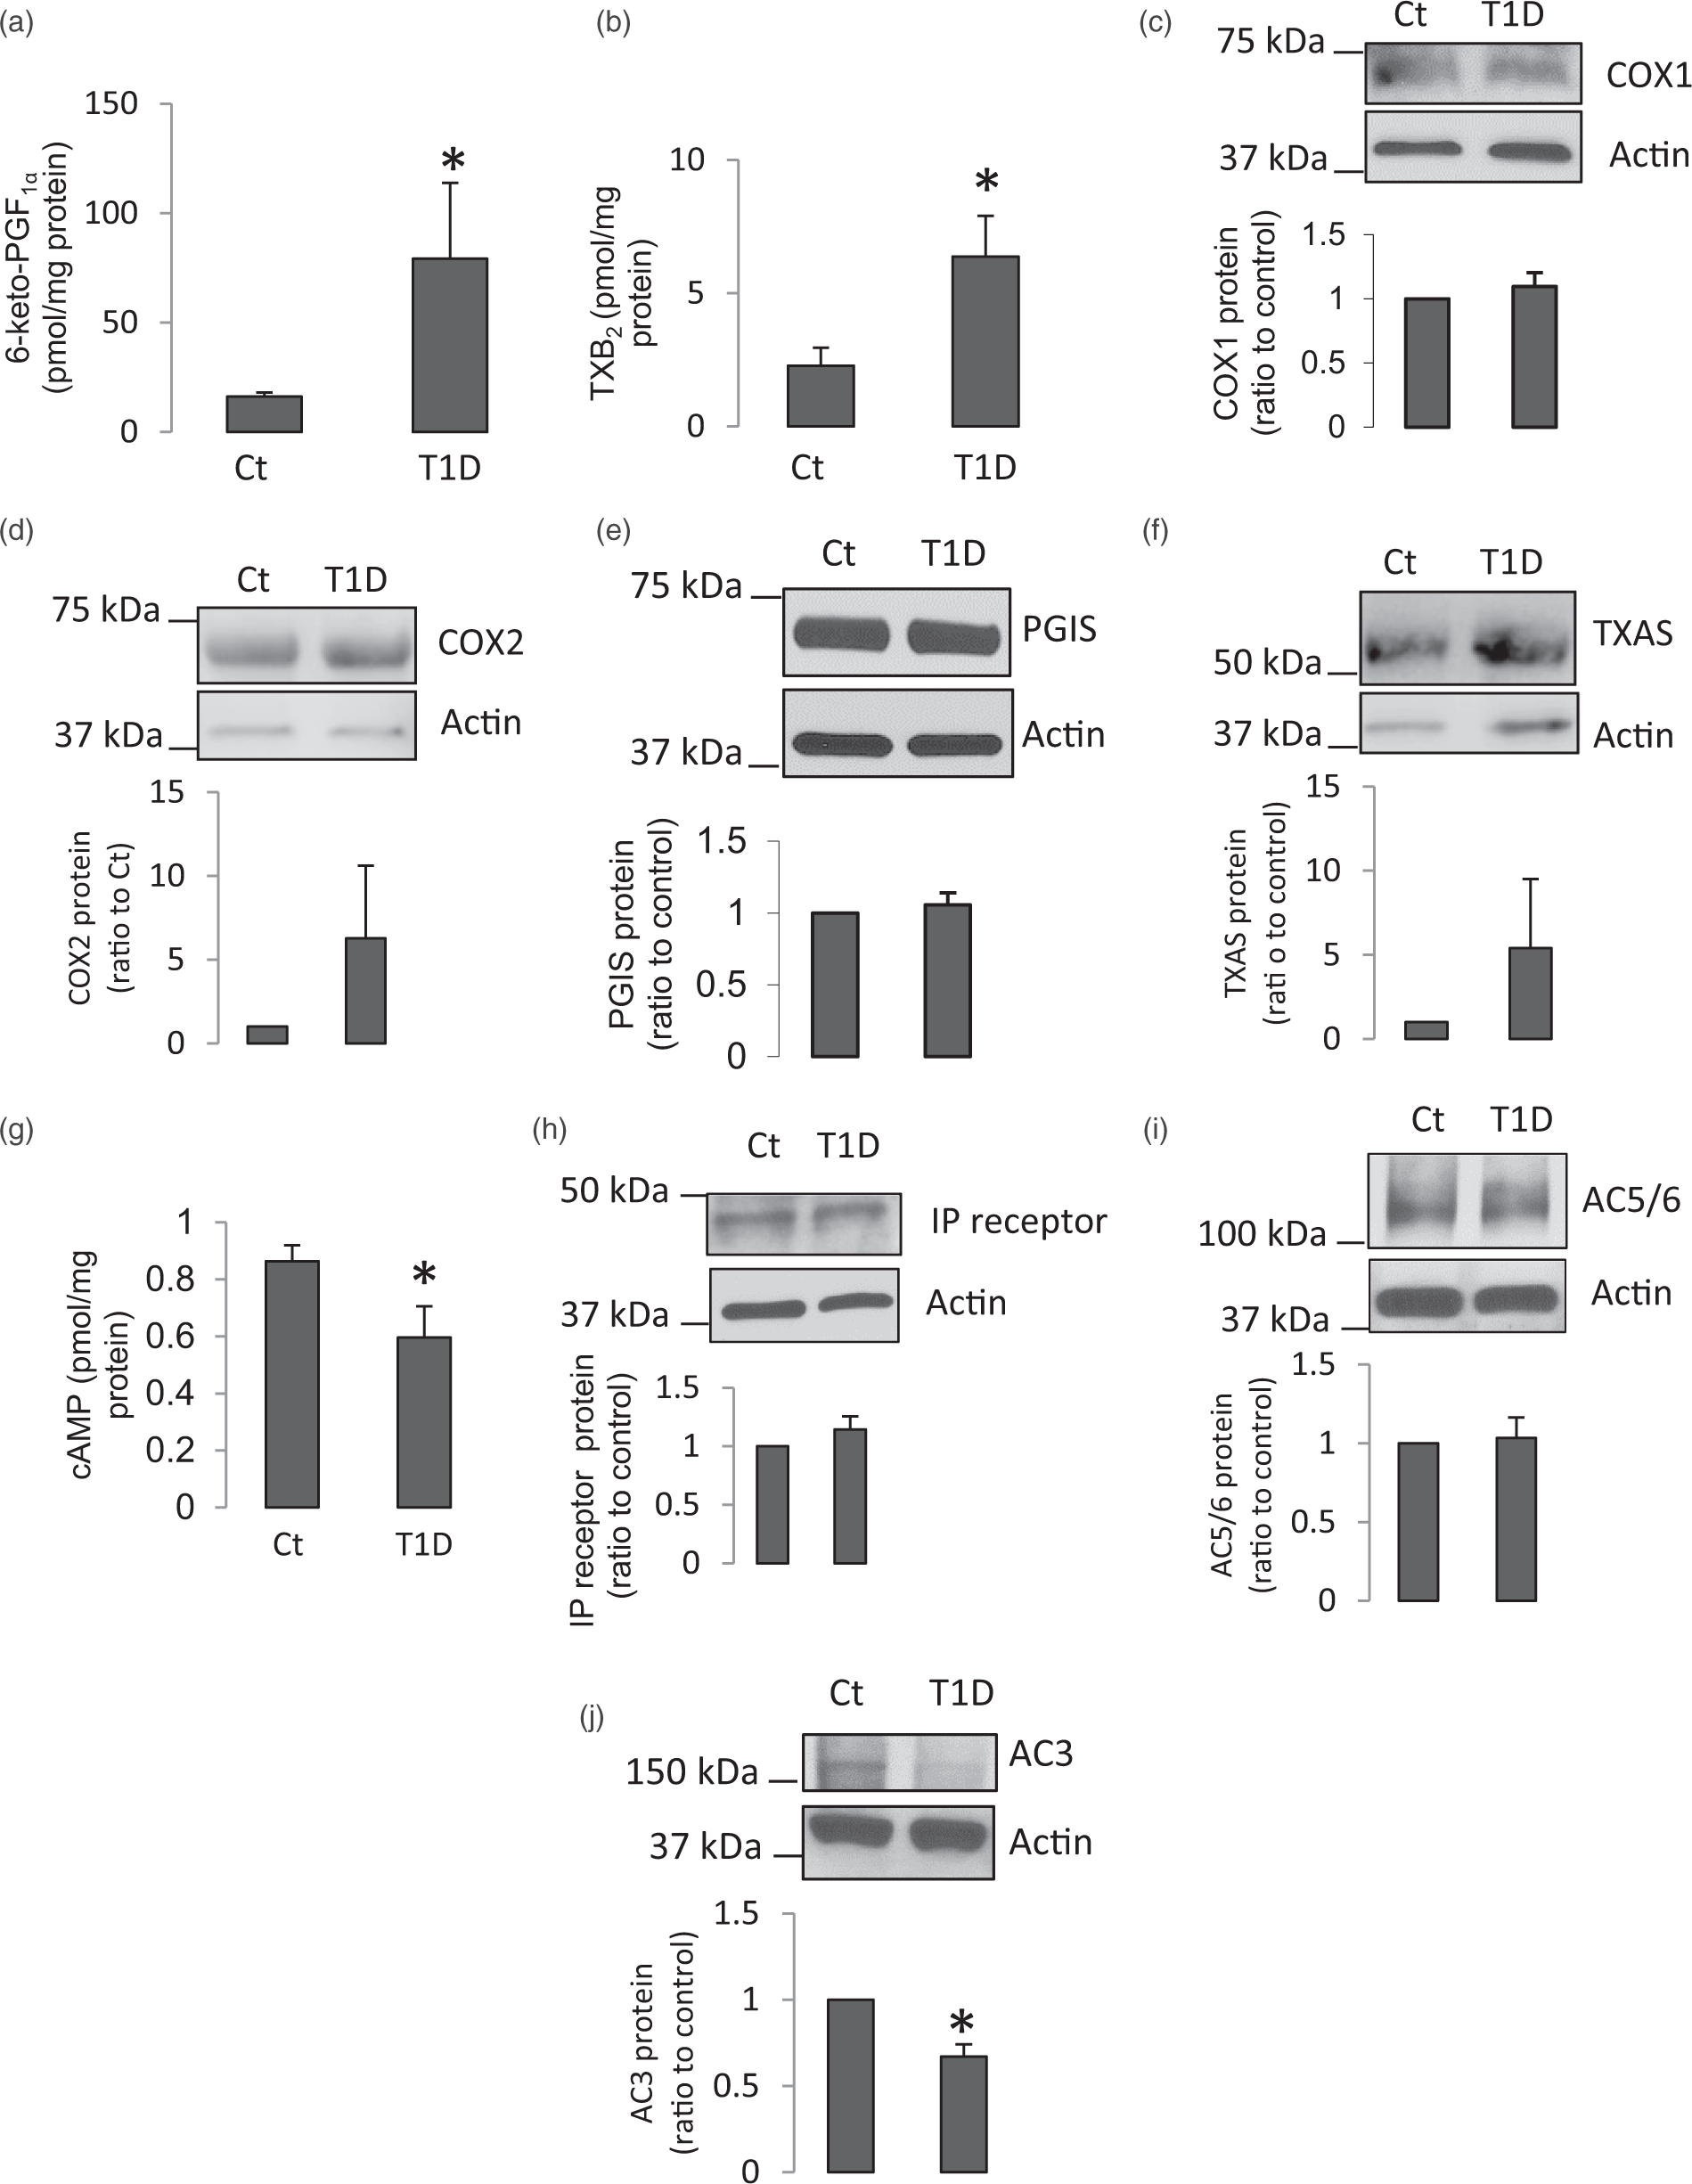
Surprisingly, intracellular levels of cAMP in diabetic cerebral microvessels were significantly decreased as compared to those of control mice (Figure 2(g)). To determine the mechanisms of reduction of cAMP in diabetic vessels, we investigated the upstream signaling molecules that could possiblly affect cAMP levels. The protein levels of IP receptor and AC5/6 were not changed in diabetic cerebral microvessels (Figure 2(h) and (i)). In contrast, protein expression of AC3 was significantly decreased in diabetic vessels (Figure 2(j)). Furthermore, AC2 and AC4 protein were undetectable by Western blot (data not shown). These results suggest that in brain microvessels of T1D mice, impairment of AC3 may contribute to the decreased cAMP levels, which may consequently affect APP and ADAM10 expression.
Role of prostaglandin signaling in regulation of APP and ADAM10 in human BMECs
We next determined the effect of genetic inactivation of AC3 on expression of APP and ADAM10 in human BMECs. Knockdown of AC3 by siRNA by treating cells with AC3-siRNA significantly suppressed AC3 mRNA levels in the cells (Figure 3(a)) and decreased ADAM10 protein levels (Figure 3(b)), confirming that ADAM10 expression was dependent on expression of AC3. This finding was consistent with our previous studies
19
indicating that IP–cAMP signaling pathway regulated ADAM10 expression. The result was also in line with our in vivo results demonstrating that down-regulation of AC3 in brain microvessels was accompanied by suppression of cAMP and ADAM10. Of note, knock-down of AC3 did not change expression of APP or BACE1 (Figure 3(c) and (d)).
Knockdown of AC3 suppressed ADAM10 protein levels in human BMECs. (a) AC3 mRNA levels were significantly reduced in human BMECs treated with AC3-siRNA for three days (n = 5, *P < 0.05, compare to cells treated with Ct-siRNA). (b) AC3-siRNA treatment for three days suppressed ADAM10 protein expression (n = 8,*P < 0.05, compared to cells treated with Ct-siRNA). AC3-siRNA treatment did not affect expression of APP (c, n = 8) or BACE1 (d, n = 3).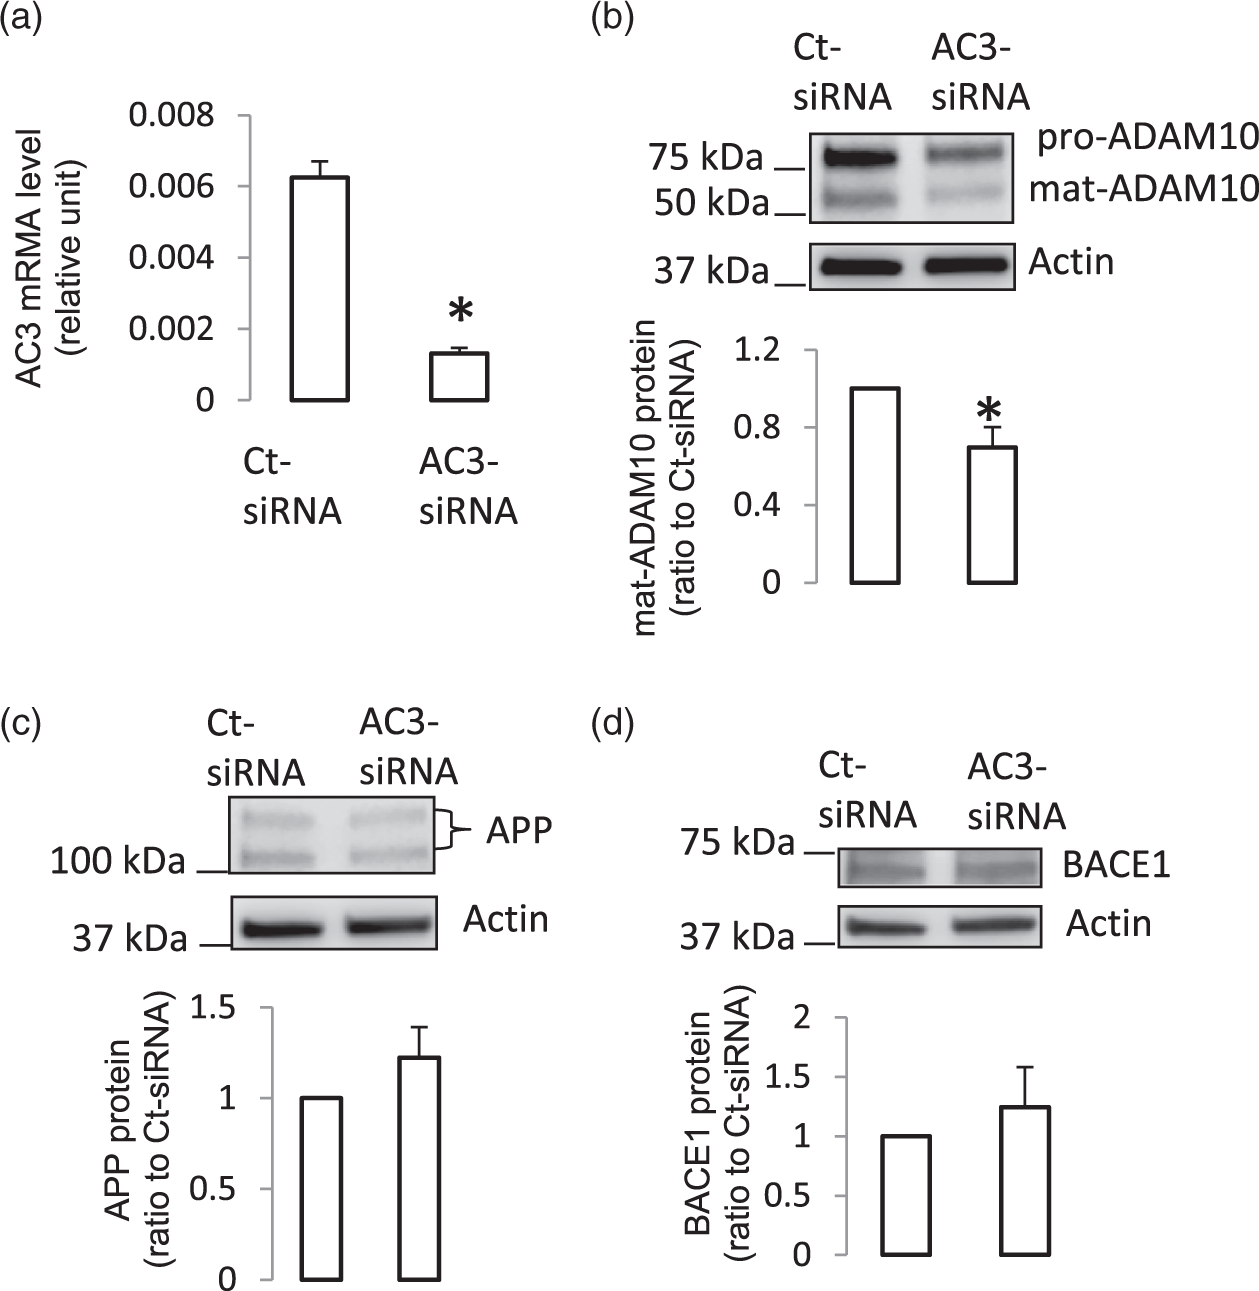
Since levels of TXA2 increased in diabetic microvessels, and activation of TXA2 receptor (TP receptor) may regulate APP expression via various signaling pathways,25–27 we also investigated the regulatory role of TXA2 in expression of APP and its processing enzymes in human BMECs. Treatment with U-46619 (a TP receptor agonist) caused a decrease in APP expression (Figure 4(a)), but did not change protein levels of ADAM10, BACE1, ADAM9, and ADAM17 in human BMECs (Figure 4(b) to (e)). These results indicate that increased TXA2 may contribute to the decreased levels of APP in diabetic cerebral microvessels.
The effects of stimulation of TP receptor on APP and its processing in human BMECs. (a–e) Human BMECs were treated with U-46619 at indicated concentration for four days. The cells were collected and the protein samples were subjected to Western blot (n = 3–4, *P < 0.05, compared to no treatment control).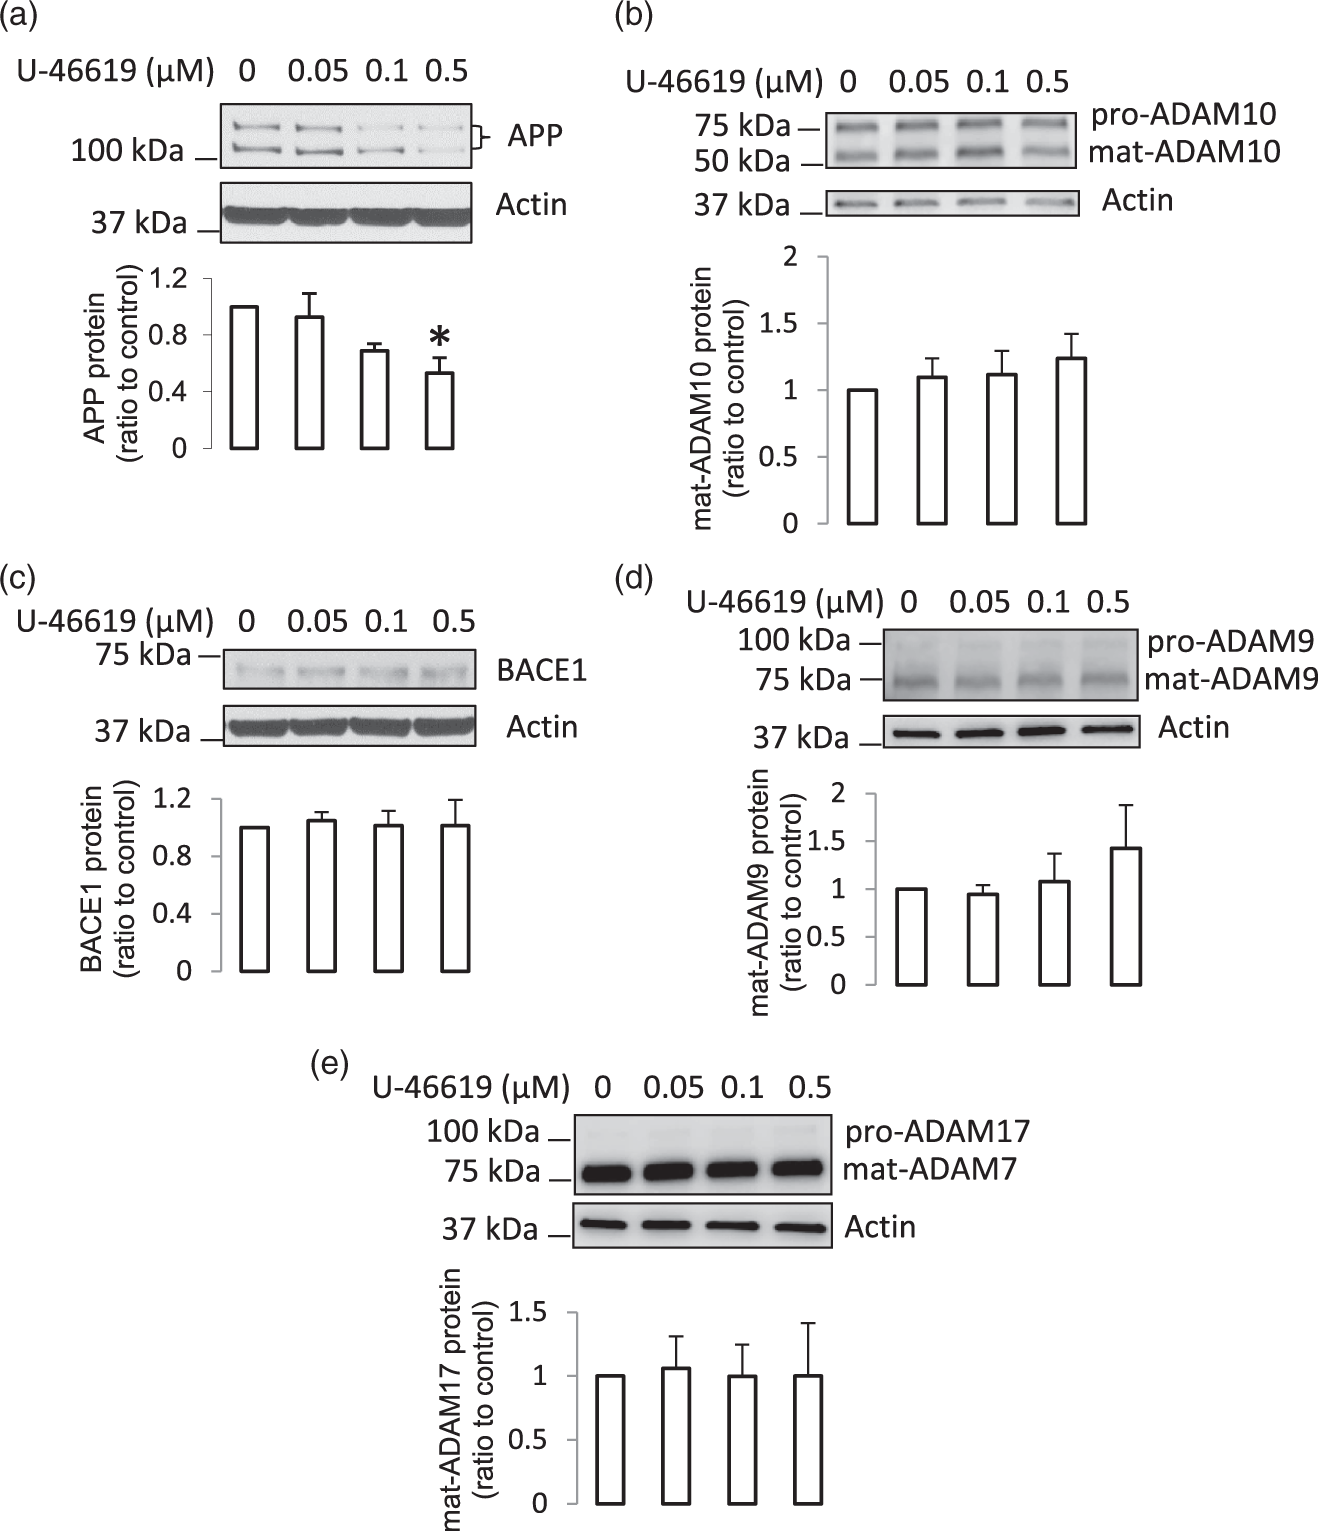
sAPPα levels were reduced in the hippocampus of T1D mice
Given the fact that in T1D mice, neurodegeneration has been observed in hippocampus, a region essential for cognitive function,28–31 we next examined the APP metabolism in the hippocampus. sAPPα protein levels were significantly decreased in hippocampus of mice exposed to two weeks or two months of hyperglycemia (Figure 5(a)), while the levels of Aβ42 and Aβ40 were not changed (Figure 5(b) and (c)). Further examination of APP and its processing in the hippocampus revealed that expression of APP was not altered (Figure 5(d)). ADAM10 protein levels remained unaltered in hippocampus of mice with two-week hyperglycemia but decreased in hippocampus of two-month hyperglycemic mice (Figure 5(e)). The expression of ADAM17, ADAM9, or BACE1 was unchanged (Figure 5(f) to (h)). These results indicated that two weeks of hyperglycemia led to a reduction of hippocampal sAPPα content although APP and its processing enzyme levels remained unaltered. Two months after development of hyperglycemia, reduction of sAPPα content was accompanied by decreased ADAM10 protein levels in hippocampus. Since we observed the reduction of AC3 expression in cerebral microvessels, we also tested whether AC3 plays a role in the regulation of ADAM10 expression in the hippocampus. As shown in Suppl. Figure 1, protein expression of AC3 in the hippocampus of the mice exposed to two months of hyperglycemia was not changed, indicating that different mechanisms were involved in the reduction of ADAM10 protein levels in neuronal tissue of the hippocampus. Thus, together with the findings in cerebral microvessels, we speculated that reduction of hippocampal content of sAPPα might be caused by the combination of down-regulation of APP and ADAM10 in brain microvessels, and reduced ADAM10 expression in hippocampus.
Hippocampal sAPPα content was reduced in diabetic mice. Mouse hippocampi were isolated two weeks or two months after development of hyperglycemia. (a) Protein levels of sAPP α were significantly decreased (two weeks, n = 5; two months, n = 6; *P < 0.05, compared to control mice). (b and c) Levels of Aβ42 and Aβ40 in the hippocampus were not significantly different between control and diabetic mice with two week (b, n = 5) or two month (c, n = 5–7) hyperglycemia, as compared to control mice. (d–h) Expression of APP and its processing enzymes in the hippocampus. The hippocampus form diabetic and control mice were collected and samples were subjected to Western blot (two weeks, n = 5; two months, n = 6; *P < 0.05, compared to control mice).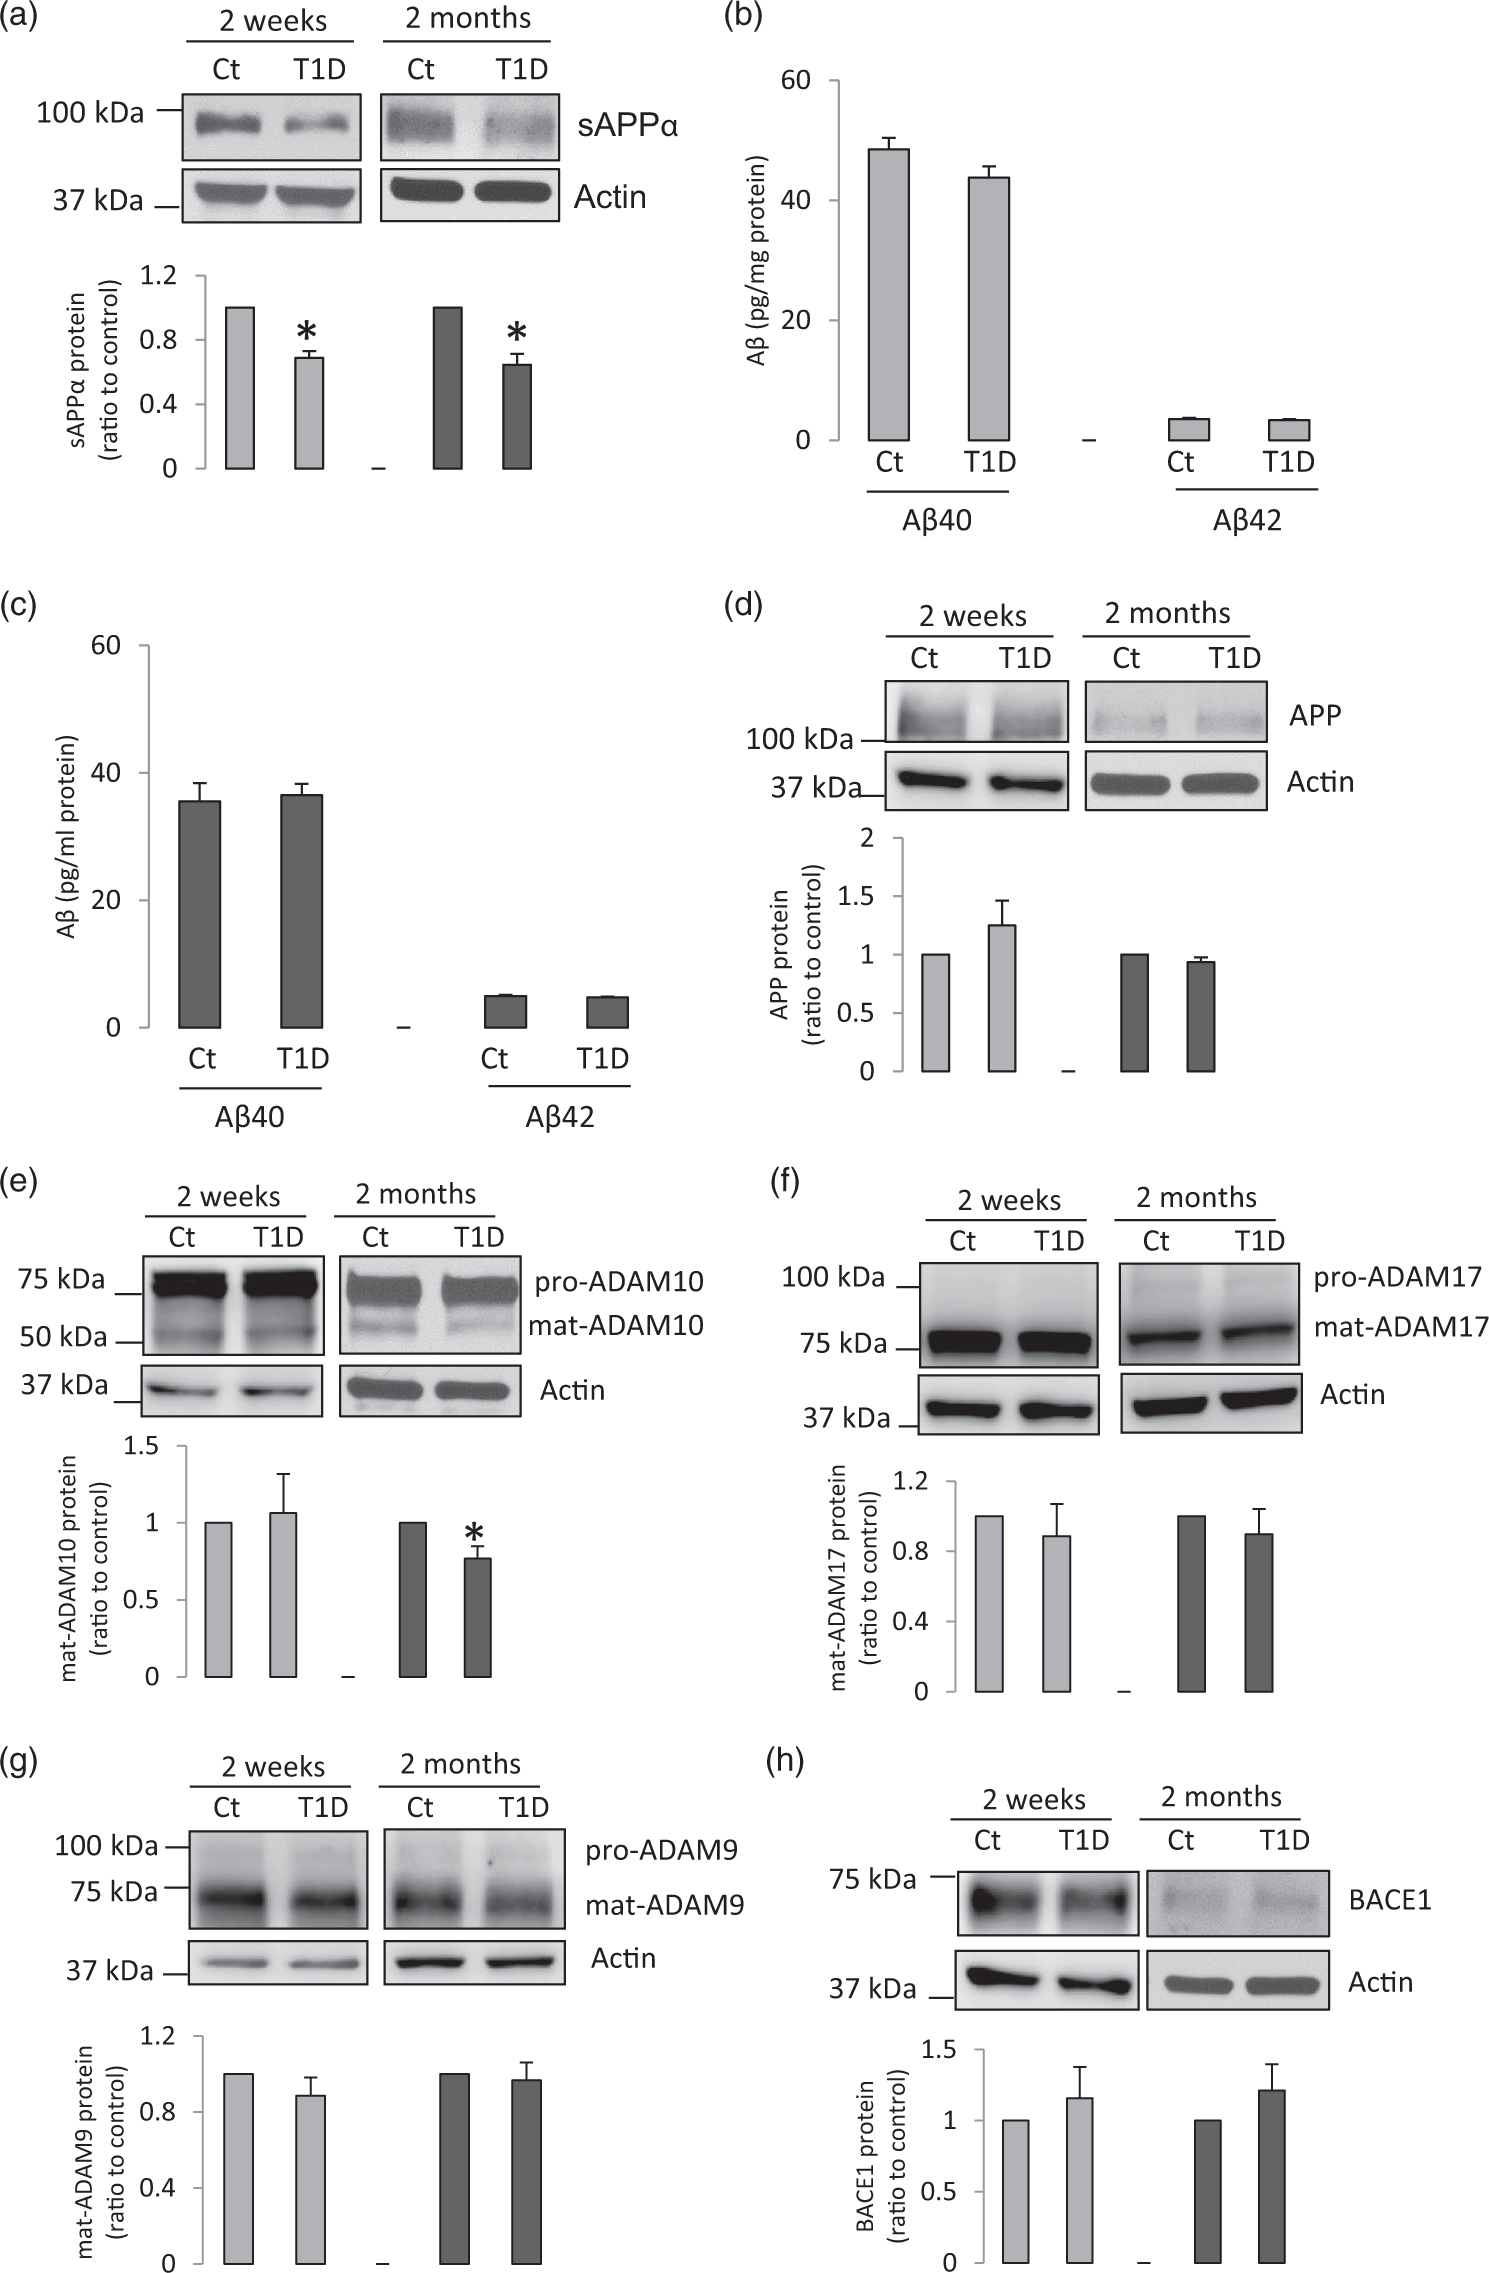
Genetic deletion of APP in endothelium decreased sAPPα content in the hippocampus
To determine whether the production and release of sAPPα in cerebral microvessels may affect the sAPPα content in hippocampus, we utilized mice with endothelial-specific knock-out of APP (eAPP−/− mice). In BMECs derived from isolated cerebral microvessels of eAPP−/− mice, APP mRNA was deleted (Figure 6(a)). In contrast, RT-qPCR showed similar mRNA expression of the endothelial cell marker VE-cadherin in mouse BMECs derived from wild type and eAPP−/− mice (Figure 6(b)). As expected, APP protein expression in cerebral microvessels of eAPP−/− mice was significantly reduced as compared to that of wild type littermates (Figure 6(c)). The incomplete deletion of APP protein in the isolated microvessels of eAPP−/− mice most likely reflects the presence of APP in other cell types including smooth muscle cells and pericytes. Most notably, sAPPα content was significantly decreased in the hippocampus of eAPP−/− mice (Figure 6(d)). However, in the hippocampus, protein expression levels of APP and its processing enzymes remained unchanged (Figure 6(e) to (i)). Aβ40 and Aβ42 levels in hippocampus were also not altered (Figure 6(j)). Thus, it appears that loss of cerebral endothelial production of sAPPα is an important component contributing to the reduction of sAPPα content in the hippocampus of eAPP−/− mice.
Endothelial deletion of APP in mice reduced sAPPα content in the hippocampus. (a) APP mRNA was depleted in BMECs isolated from brain of eAPP−/− mice. (b) mRNA levels of endothelial cell marker VE-cadherin in isolated mouse BMECs were similar between wild-type and eAPP−/− mice (n = 4). (c) APP protein levels were significantly decreased in cerebral microvessels of eAPP−/− mice (n = 6, *P < 0.05, compared to wild type mice). (d–i) There was significant change in protein levels of sAPPα, but not in protein expression of APP and its processing enzymes in hippocampal samples of eAPP−/− mice compared to those of wild type mice (d–g, i, n = 8; h, n = 6; *P < 0.05, compared to wild-type mice). (j) Levels of Aβ40 and Aβ42 in the hippocampus were not changed by endothelial deletion of APP (n = 6–7).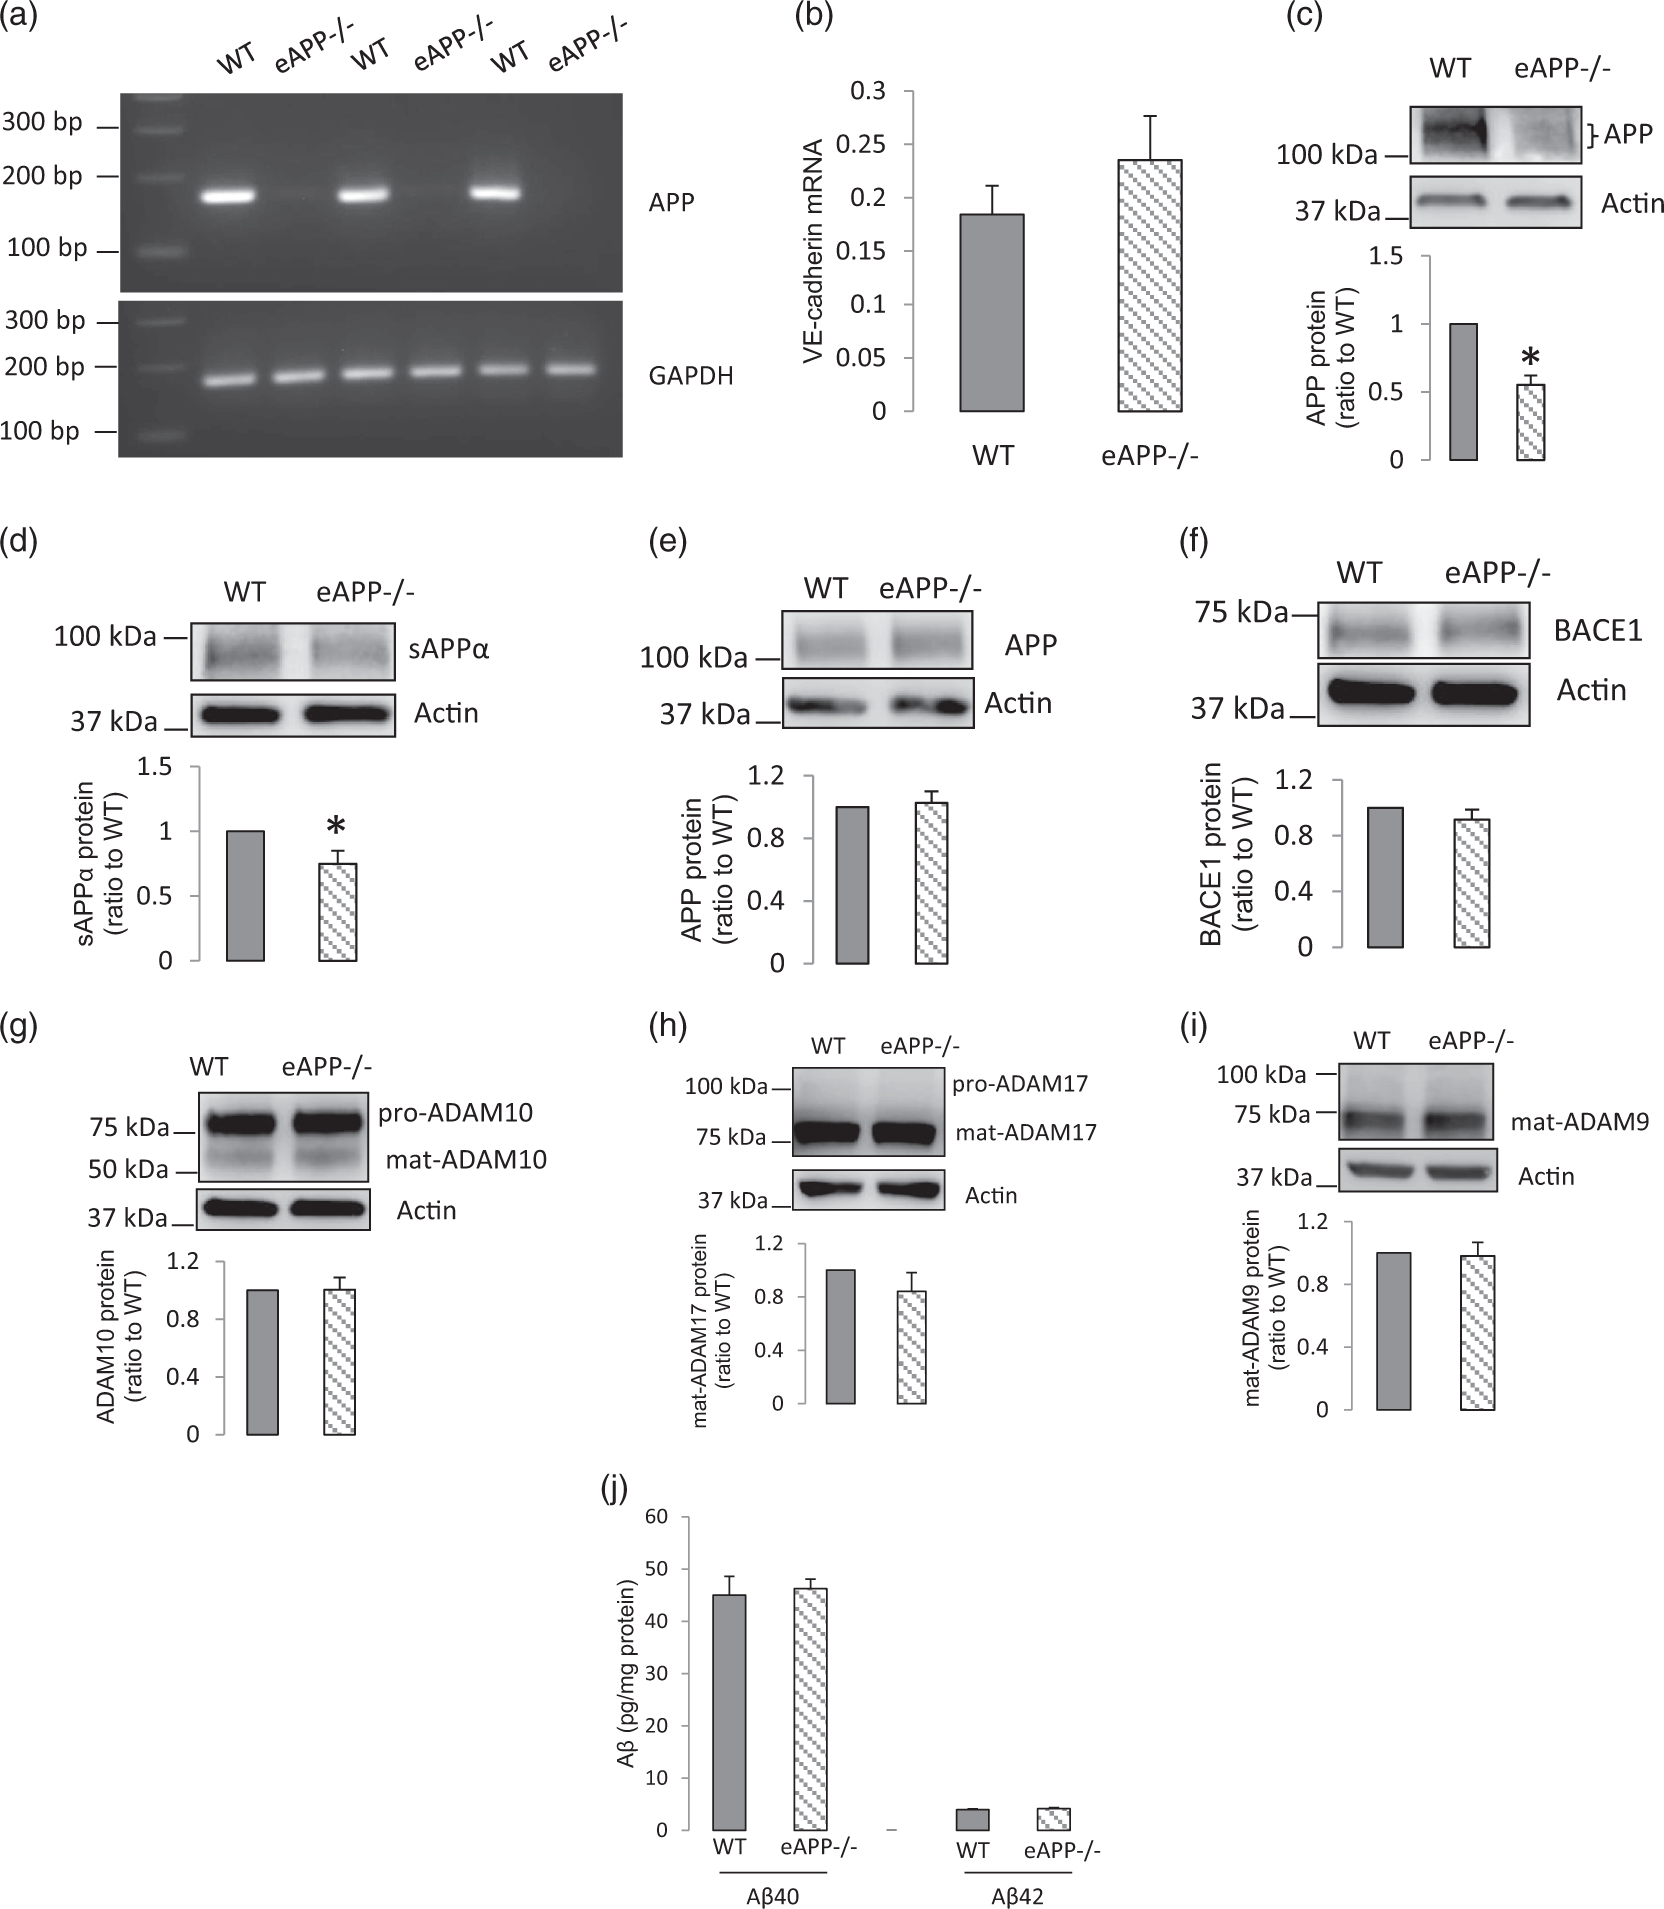
Discussion
Our studies report several new findings: (1) cerebral microvascular protein expression of APP is significantly decreased in STZ-induced diabetic mice; (2) protein levels of ADAM10 are also significantly reduced in cerebral microvessels of mice exposed to two month of hyperglycemia; (3) AC3 expression in diabetic microvessels is down-regulated, and this is accompanied by a lower level of cAMP; (4) in human BMECs knockdown of AC3 suppresses ADAM10 protein levels but has no effect on APP expression; (5) production of TXA2 is augmented in diabetic brain microvessels; (6) activation of TP receptor inhibits APP expression in human BMECs, suggesting that dysregulation of TXA2 signaling in brain microvessels is responsible for the suppressed expression of APP; (7) hippocampal sAPPα content is significantly reduced in T1D mice, while levels of Aβ42 and Aβ40 are not changed; (8) in the hippocampi isolated from eAPP−/− mice, sAPPα levels are significantly reduced, but APP and its α and β processing enzymes are not altered, supporting the conclusion that cerebral endothelium may significantly contribute to sAPPα levels in hippocampus.
The present study is the first to report that in mouse cerebral microvessels, T1D suppressed expression of APP and ADAM10, thereby causing impairment of the ability of cerebral microvessel to produce neuro-protective protein sAPPα. Since prior studies established that sAPPα exerts anti-coagulant and neurotrophic functions,10,16,32 our findings identified previously unrecognized molecular mechanisms contributing to detrimental effects of T1D in the cerebral circulation.
It has been reported that in T1D patients, TXA2 production in platelets is activated, thereby causing the diabetic prothrombotic state.33,34 Furthermore, in STZ-induced diabetic mice, acetylcholine- or insulin-like growth factor-1 (IGF-1)-induced aortic release of TXA2 is increased.35,36 Overproduction of TXA2 and PGI2 is also observed in the aorta of STZ-induced diabetic rats. 37 In pial arterioles of STZ-induced diabetic rats, impaired cerebral arterioles reactivity is caused by augmented production of TXA2. 38 In the present study, we observed that in cerebral microvasculature of STZ-induced diabetic mice, production of TXA2 and PGI2 was significantly enhanced. The ratio of PGI2/TXA2 in control mice and T1D mice is 7.1 and 12.4, respectively. The more robust increase in PGI2 production in microvessels of T1D (compared to TXA2) may be a compensatory response to the reduced production of sAPPα that also has anti-thrombotic function. The increased production of TXA2 and PGI2 apparently was not caused by the change of protein levels of COX1, COX2, TXAS, or PGIS in brain microvessels. Other mechanisms may be involved, such as enhanced phospholipase A2 activity,39,40 altered phospholipid content in the cell membrane, 41 or increased uptake and mobilization of arachidonic acid. 42 It is also possible that TXA2 stimulates endothelial cells to produce PGI2. 43 Further investigation is required to determine the exact mechanisms responsible for the increased levels of TXA2 and PGI2 in diabetic brain microvessels.
Activation of IP receptor is primarily coupled to Gs protein and subsequent activation of ACs, which in turn increases formation of cAMP.44,45 To date, nine membranous isoforms of AC (AC1-9) and one soluble AC have been identified. 44 Existing studies suggest that endothelial cells express AC2, 3, 4, and 6.46,47 Previous studies indicate that AC5/6 expression is decreased in mesenteric arteries of STZ-induced T1D rats, leading to an impairment of vasodilator function. 48 However, changes of cerebral microvascular AC isoforms in T1D have not been studied. In the present study, we found that AC3 protein levels were decreased in diabetic brain microvessels, while AC5/6 expression was not altered. Other isoforms of AC such as AC2 and AC4 were undetectable. Based on the results from (1) our previous studies demonstrating that in human BMECs pharmacological activation of intracellular cAMP signaling by forskolin (an AC activator) stimulated ADAM10 expression, 19 (2) our current findings that AC3 is a mediator responsible for the regulation of ADAM10 expression in cultured human BMECs, and (3) that decreased AC3 expression was accompanied by decreased cAMP in diabetic microvessels, we conclude that in diabetic brain microvessels, loss of AC3 function reduced cAMP levels and consequently decreased ADAM10 expression.
T1D may also affect other cells (such as smooth muscle cells and pericytes) of microvessels, besides endothelium. Although endothelium is the major component of isolated microvessels, and the major cell type contributing to the amount of APP expression in the vasculature, 8 we cannot rule out the possibility that other cell types such as pericytes and smooth muscle cells may also contribute to the observed changes in the isolated microvessels.
Interestingly, in human BMECs TP receptor agonist, U46619, reduced APP expression, which is consistent with our in vivo observation that increased microvascular production of TXA2 is accompanied by decreased expression of APP. The exact mechanisms underlying TP receptor-mediated reduction of APP protein levels remains to be determined. Previous studies suggest that stimulation of TP receptor could affect complex cellular signaling.28,49 Stimulation of TP receptor could activate protein kinase C, which negatively regulates APP transcription,28,29 or enhance ERK1/2 signaling that causes reduction of APP mRNA levels by posttranscriptional mechanism.28,30 Whether similar mechanisms may account for our observations obtained in human BMECs remains to be determined.
Previous studies have demonstrated that STZ-induced T1D exacerbates cerebral amyloidosis in the mouse models of Alzheimer's disease.50,51 In contrast, STZ-induced T1D in wild type mice did not increase APP levels and Aβ42 deposition in the brain despite the fact that hippocampal function was impaired.50,52 Furthermore, although existing evidence suggest that diabetes may be a risk factor for Alzheimer's disease, clinical pathological studies did not find increased Aβ deposition and neurofibrillary tangles in the brain of diabetic patients.53,54 These observations indicate that mechanisms other than amyloid accumulation may be responsible for the cognitive impairment induced by T1D. For instance, it has been demonstrated that sAPPα promotes neural progenitor proliferation, survival, and migration, and plays important roles in brain development and cognitive function.55,56 Moreover, patients who have early onset of diabetes (younger than seven years) have higher risk of developing clinically significant cognitive deficits.57–60 It is therefore conceivable that the cognitive impairment may be caused by reduced levels of neurotrophic molecules in the brain. Indeed, we found that levels of sAPPα were significantly reduced in diabetic hippocampi. This observation is in line with reported morphological changes in the brain regions associated with learning and memory, including the hippocampus of STZ-induced diabetic mice.28–31
In the present study, we report that in T1D mice, cerebral microvascular protein levels of APP and ADAM10 were significantly decreased. Since in neuronal cells, APP primarily undergoes amyloidogenic processing, while in non-neuronal cells, non-amyloidogenic processing is dominant,12–14 it is possible that substantial amount of sAPPα in brain may be derived from non-neuronal cells. Relevant to our studies, neurovascular niches are highly vascularized with high blood–brain barrier permeability.17,18 This specialized vasculature in the hippocampus (especially subgranular zone) may deliver vascular sAPPα into surrounding neuronal tissue. It has been reported that circulating proteins such as albumin and chemokine C-C motif ligand 11 are able to cross brain–blood barrier to access neuronal tissue in hippocampus.61,62 In the current study, when endothelial APP was genetically deleted, the hippocampal sAPPα levels also decreased while no change was found in the expression of APP and its α and β processing enzymes in neuronal tissue. These results strongly suggest that brain microvessels may be an important source of hippocampal sAPPα, and that impairment of microvascular APP metabolisms in T1D may partially contribute to the reduction of sAPPα in the hippocampus. These results are also consistent with our previous studies demonstrating that changes of sAPPα content in hippocampus followed the changes of sAPPα production in cerebral microvessels. 19
Our findings identify new mechanisms underlying diabetes-induced cerebral microvascular dysfunction. Our studies also suggest that reduced levels of sAPPα in the diabetic hippocampus may in part result from impaired microvascular metabolism of APP (Figure 7). We speculate that the reduced sAPPα levels in the hippocampus may significantly contribute to cognitive dysfunction caused by T1D.
50
Future studies focused on behavioral assessment and establishment of the hippocampus-related cognitive decline in T1D mice are required to substantiate functional importance of diabetic vascular complications in the cerebral circulation.
In cerebral microvessels of T1D mice, reduced expression of ADAM10 and APP caused by decreased AC3 signaling and increased production of TXA2, respectively, may contribute to low levels of sAPPα in the hippocampus. We speculate that the reduced sAPPα levels in the hippocampus may be one of mechanisms responsible for cognitive dysfunction.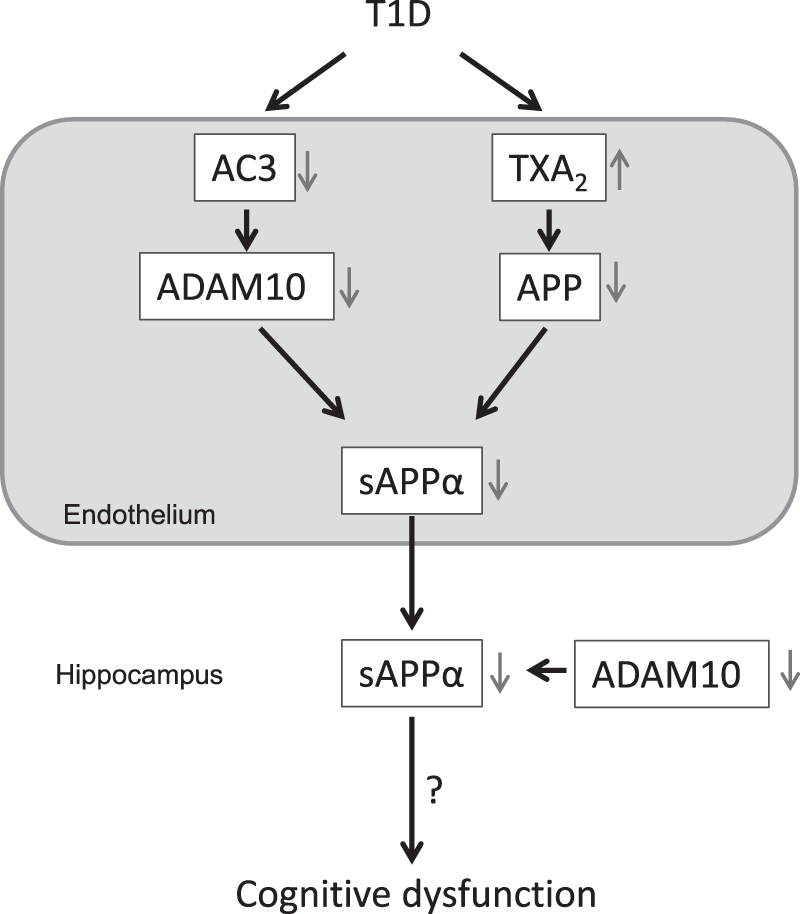
Footnotes
Funding
The author(s) disclosed receipt of the following financial support for the research, authorship, and/or publication of this article: This work was supported by National Institutes of Health (NIH) Grants HL-131515 and HL-111062 and the Mayo Foundation (to Z. S. Katusic).
Acknowledgements
We would like to thank Mr. Darrell R. Schroeder (Department of Biomedical Statistics and Informatics) for his assistance with statistical analysis.
Declaration of conflicting interests
The author(s) declared no potential conflicts of interest with respect to the research, authorship, and/or publication of this article.
Authors' contributions
Experimental design: TH, ZK. Performing experiments and data analysis: TH, RS, AVR, LVD. Manuscript writing: TH, RS, AVR, LVD TL, ZK.
References
Supplementary Material
Please find the following supplemental material available below.
For Open Access articles published under a Creative Commons License, all supplemental material carries the same license as the article it is associated with.
For non-Open Access articles published, all supplemental material carries a non-exclusive license, and permission requests for re-use of supplemental material or any part of supplemental material shall be sent directly to the copyright owner as specified in the copyright notice associated with the article.