
Abstract
Preterm infants (born at 24–34 weeks of gestational age) suffer from a high incidence of neurological complications. Cerebrovascular lesions (intraventricular hemorrhages, IVH, and ischemic injury) due to the immaturity of the vascular system and its inability to adapt to the extra-uterine environment are the major causes of adverse neurological outcomes. We investigated the feasibility of assessing cerebrovascular status in preterm infants using a novel non-invasive optical procedure, pulse-DOT, usable within the incubator. Pulse-DOT, validated in adults, provides estimates of cerebral arterial status based on optical measurements of the pulse wave. These measurements are taken with a high-density optode montage and provide accurate spatial and temporal information. We found that two pulse parameters (pulse relaxation function, PReFx, and pulse rise time, PRT) in the investigated frontotemporal region, correlated with infant’s age at recording, indexing cerebrovascular development. Moreover, PRT differentiated infants with and without concurrent IVH (sensitivity = 100%, specificity = 70%). These values are at least as high as those of the resistivity index obtained with transcranial Doppler of the middle cerebral artery, the current clinical method of choice for investigating arterial elasticity in preterm infants. This makes pulse-DOT a promising tool for investigating cerebrovascular risk factors and related pathologies in preterm infants.
Keywords
Introduction
Approximately 10% of infants are born preterm (24–37 weeks of gestational age, wGA 1 ) in the USA, and around a quarter of them present neurodevelopmental sequelae. The survival rate of extremely preterm infants (<28 wGA) has increased significantly over the last two decades.2–4 However, neuromorbidity increases in severity with decreasing GA at birth, 3 with more than 50% of very early preterm infants presenting some degree of neurodevelopmental disability.2,3,5 Amongst the most significant pathologies leading to neurodevelopmental disability in preterm infants are intraventricular hemorrhages (IVHs) and ischemia (stroke), which may result in brain damage and poor cognitive outcomes. 6 As halting or reversing the damage generated by these neuropathologies after their occurrence is difficult, their prevention is critical. Since these pathologies often occur shortly after birth (within the first few days), current prevention methods include administration of steroids or other drugs to mothers considered at risk for a premature partum before delivery. However, there is only a small intervention window for this preventive therapy and in many cases, premature delivery cannot be predicted. Therefore, early screening methods for identifying at-risk preterm infants may potentially be extremely useful.
It is thought that several factors make preterm infants particularly susceptible to IVHs and ischemia: (a) large variations in vascular tone due to immature blood pressure regulation (with consequent hypo- and hypertensive episodes), which may be complicated by an immature pulmonary circulation, and, in some cases, by the effects of mechanic ventilation; (b) the consequences of these problems for brain circulation, which may react to these systemic phenomena by generating extreme cerebral vasodilation or vasoconstriction; and (c) the immaturity of large cerebral arteries (in particular their lack of elasticity 7 ), which may expose smaller blood vessels and capillaries to excessive blood pressure and lead to breakages of their walls.
Currently, the method of choice for studying arterial maturation in preterm infants is non-invasive transcranial Doppler ultrasonography (TCD
8
). TCD can be used to study blood velocity (BV) in particular points of specific intracranial arteries, such as the middle cerebral artery (MCA). BV is strongly dependent on the elasticity of the arterial wall, which, in turn, is related to the presence of elastin and collagen (proteins giving the arterial wall its characteristic elastic properties); however, BV is also related to peripheral resistance (i.e. vasodilation or vasoconstriction in tissue). In neonatal care, TCD is used to assess BV during the systolic (BVs) and diastolic (BVd) periods in selected arteries, from which it is possible to derive the resistivity index (RI), using the following equation

This approach to assess the maturity of cerebral arteries in preterm infants has several advantages. It is noninvasive and measurements can be performed at the bedside and repeated multiple times or even monitored for extended periods. Extensive normative data have been collected, providing a reliable clinical basis for interpretation. Further, TCD provides other important imaging information, such as the ability to detect IVH and hydrocephalus. Its major limitations for studying the elasticity of cerebral arteries are that TCD can estimate BV only in segments of large intracranial vasculature, and that it requires operator expertise to localize appropriate measurement points.9,10
We recently introduced a new noninvasive optical procedure based on diffuse optical tomography (pulse-DOT) to assess the status of cerebral arteries by mapping parameters of the pulse wave in the brain.11–13 Optical methods have been extensively used to study pulse parameters and blood oxygenation in peripheral arteries (photoplethysmography or pulse oxymetry14,15) and have been shown to produce pulse waveforms analog to those obtained with continuous-wave Doppler.16,17 Newly developed recording and analytic methods allow for the mapping of the optical pulse wave in the brain. 11 The pulse-DOT signal can be considered as coming exclusively from the arteries. In fact, previous spectroscopic analyses (reported in Fabiani et al. 11 ) show that the optical pulse-DOT signal is only associated with changes in oxy-hemoglobin concentration and not with changes in deoxy-hemoglobin concentration, reflecting the very high oxygen saturation of the signal (>95%). This oxygen saturation level is only achieved within the arteries. Blood pulsation in the arteries and arterioles produces changes in the amount of absorbed near-infrared (NIR) light, which can be measured at high sampling rates (up to thousands of times per second). Therefore, the optical pulse signal can be studied in exquisite detail even for individual heart beats. 18 In this and previous studies, we obtained a very high signal-to-noise ratio (SNR) by averaging pulses over a period of about 15 min (yielding thousands of pulse repetitions per subject). In fact, pulse-DOT measured with this approach has a much higher SNR (>20) than that attainable with functional near-infrared spectroscopy (fNIRS) and optical methods for studying cerebral blood flow (e.g. diffusion correlation spectroscopy, DCS). In adults, the split-half reliability of measurement for pulse-DOT parameters is also very high (r > .95).11,19
Previous research11,12 indicates that the pulse signal, as measured with pulse-DOT, is largely generated beneath the skull (i.e. by cerebral arteries). In fact, contamination from extra-cerebral sources can be reduced in three main ways (which were all employed in the current study): (1) by discarding optical channels with short source-detector distances (which are the most sensitive to superficial phenomena); (2) by applying inversion algorithms that accurately estimate the depths of optical perturbations (thus separating deep from superficial effects, with the latter being masked out in the analysis); and (3) By focusing on frequencies that are appropriate for the pulse measures (0.5–5 Hz), and relatively insensitive to vasomotoric/hemodynamic effects – such as those measured with fNIRS.
Finally, it is important to note that pulse-DOT can be recorded with currently available devices commonly used for fNIRS measurements, provided they afford a sufficient (>10 Hz) sampling frequency. 20 The main advantage of pulse-DOT is that measures can be taken from many different areas over the head, providing a more extensive picture of cerebrovascular function than that afforded by TCD. Optical pulse waves can be obtained from each of many individual channels or voxels in the head, if DOT reconstruction procedures are applied.21–23 Several pulse parameters can be estimated from these waves, including pulse amplitude (PA), pulse transit time (PTT), pulse rise time (PRT), and the pulse relaxation function (PReFx). Moreover, by mapping PA, low-resolution maps of arteries can be obtained (pulsograms). 11 Based on previous studies performed in adults,11–13 small PAs, long PTTs and PRTs, and large PReFxs are all signs of a healthy cerebrovasculature. These parameters, however, measure different aspects of the arterial system. PA is strongly related to peripheral pulse pressure (the difference between systolic and diastolic blood pressure), both across individuals11,12 and within individuals under conditions where vasodilation and/or vasoconstriction occur globally or locally. 13 As for pulse pressure measured at the forearm, in adults, PA is strongly correlated with age (i.e. older adults have larger PA than younger adults). PTT and PRT are inversely related to pulse wave velocity (PWV). In fact, comparisons of PTT between two points along the same artery (such as the MCA) can be used to derive an estimate of PWV in that artery. 11 As for PWV estimates obtained from intracranial and extracranial locations with Doppler sonography, short cerebral optical PTT and PRT (reflecting fast PWV) should be considered signs of arterial stiffness, and slow cerebral PTT and PRT should be considered signs of arterial elasticity.
Whereas PTT and PRT reflect arterial status between the heart and the measurement point, PReFx is a measure of the pulse shape as predicted by the Windkessel model, reflecting the summation of the forward and backward pulse waves and intended to provide a summary estimate of the elasticity of arteries in a particular region (with large PReFx indexing smaller wave summation and a higher degree of elasticity 11 ). In older adults, PReFx is related to age and cardiorespiratory fitness (with greater arterial stiffness for older and less fit individuals). Most interestingly, it is strongly correlated with gray and white matter volume preservation (with greater volumes associated with greater PReFx) both between11,12 and within individuals. 19
Here we provide an initial demonstration of the feasibility of measuring cerebral pulse-DOT in preterm infants within the incubator. Specifically, we produced three-dimensional maps of optical pulse parameters and investigated whether we could assess the status of maturation of cerebral arteries in preterm infants with and without IVH (diagnosed using ultrasound). We expected the cerebral pulse-DOT parameters to reflect lower elasticity in younger infants (i.e. shorter PTT and PRT, larger PA and smaller PReFx). To test our assumptions, we performed correlation analyses of these parameters with the infants’ GA at recording. A comparison of infants with and without IVH allowed us to determine the extent to which pulse-DOT parameters were associated with the presence of IVH. Further, pulse-DOT parameters were also compared to the MCA RI measured by TCD as correlates of IVH status.
Methods
Participants
Demographic, health, TCD, and optical data for the preterm infant sample.
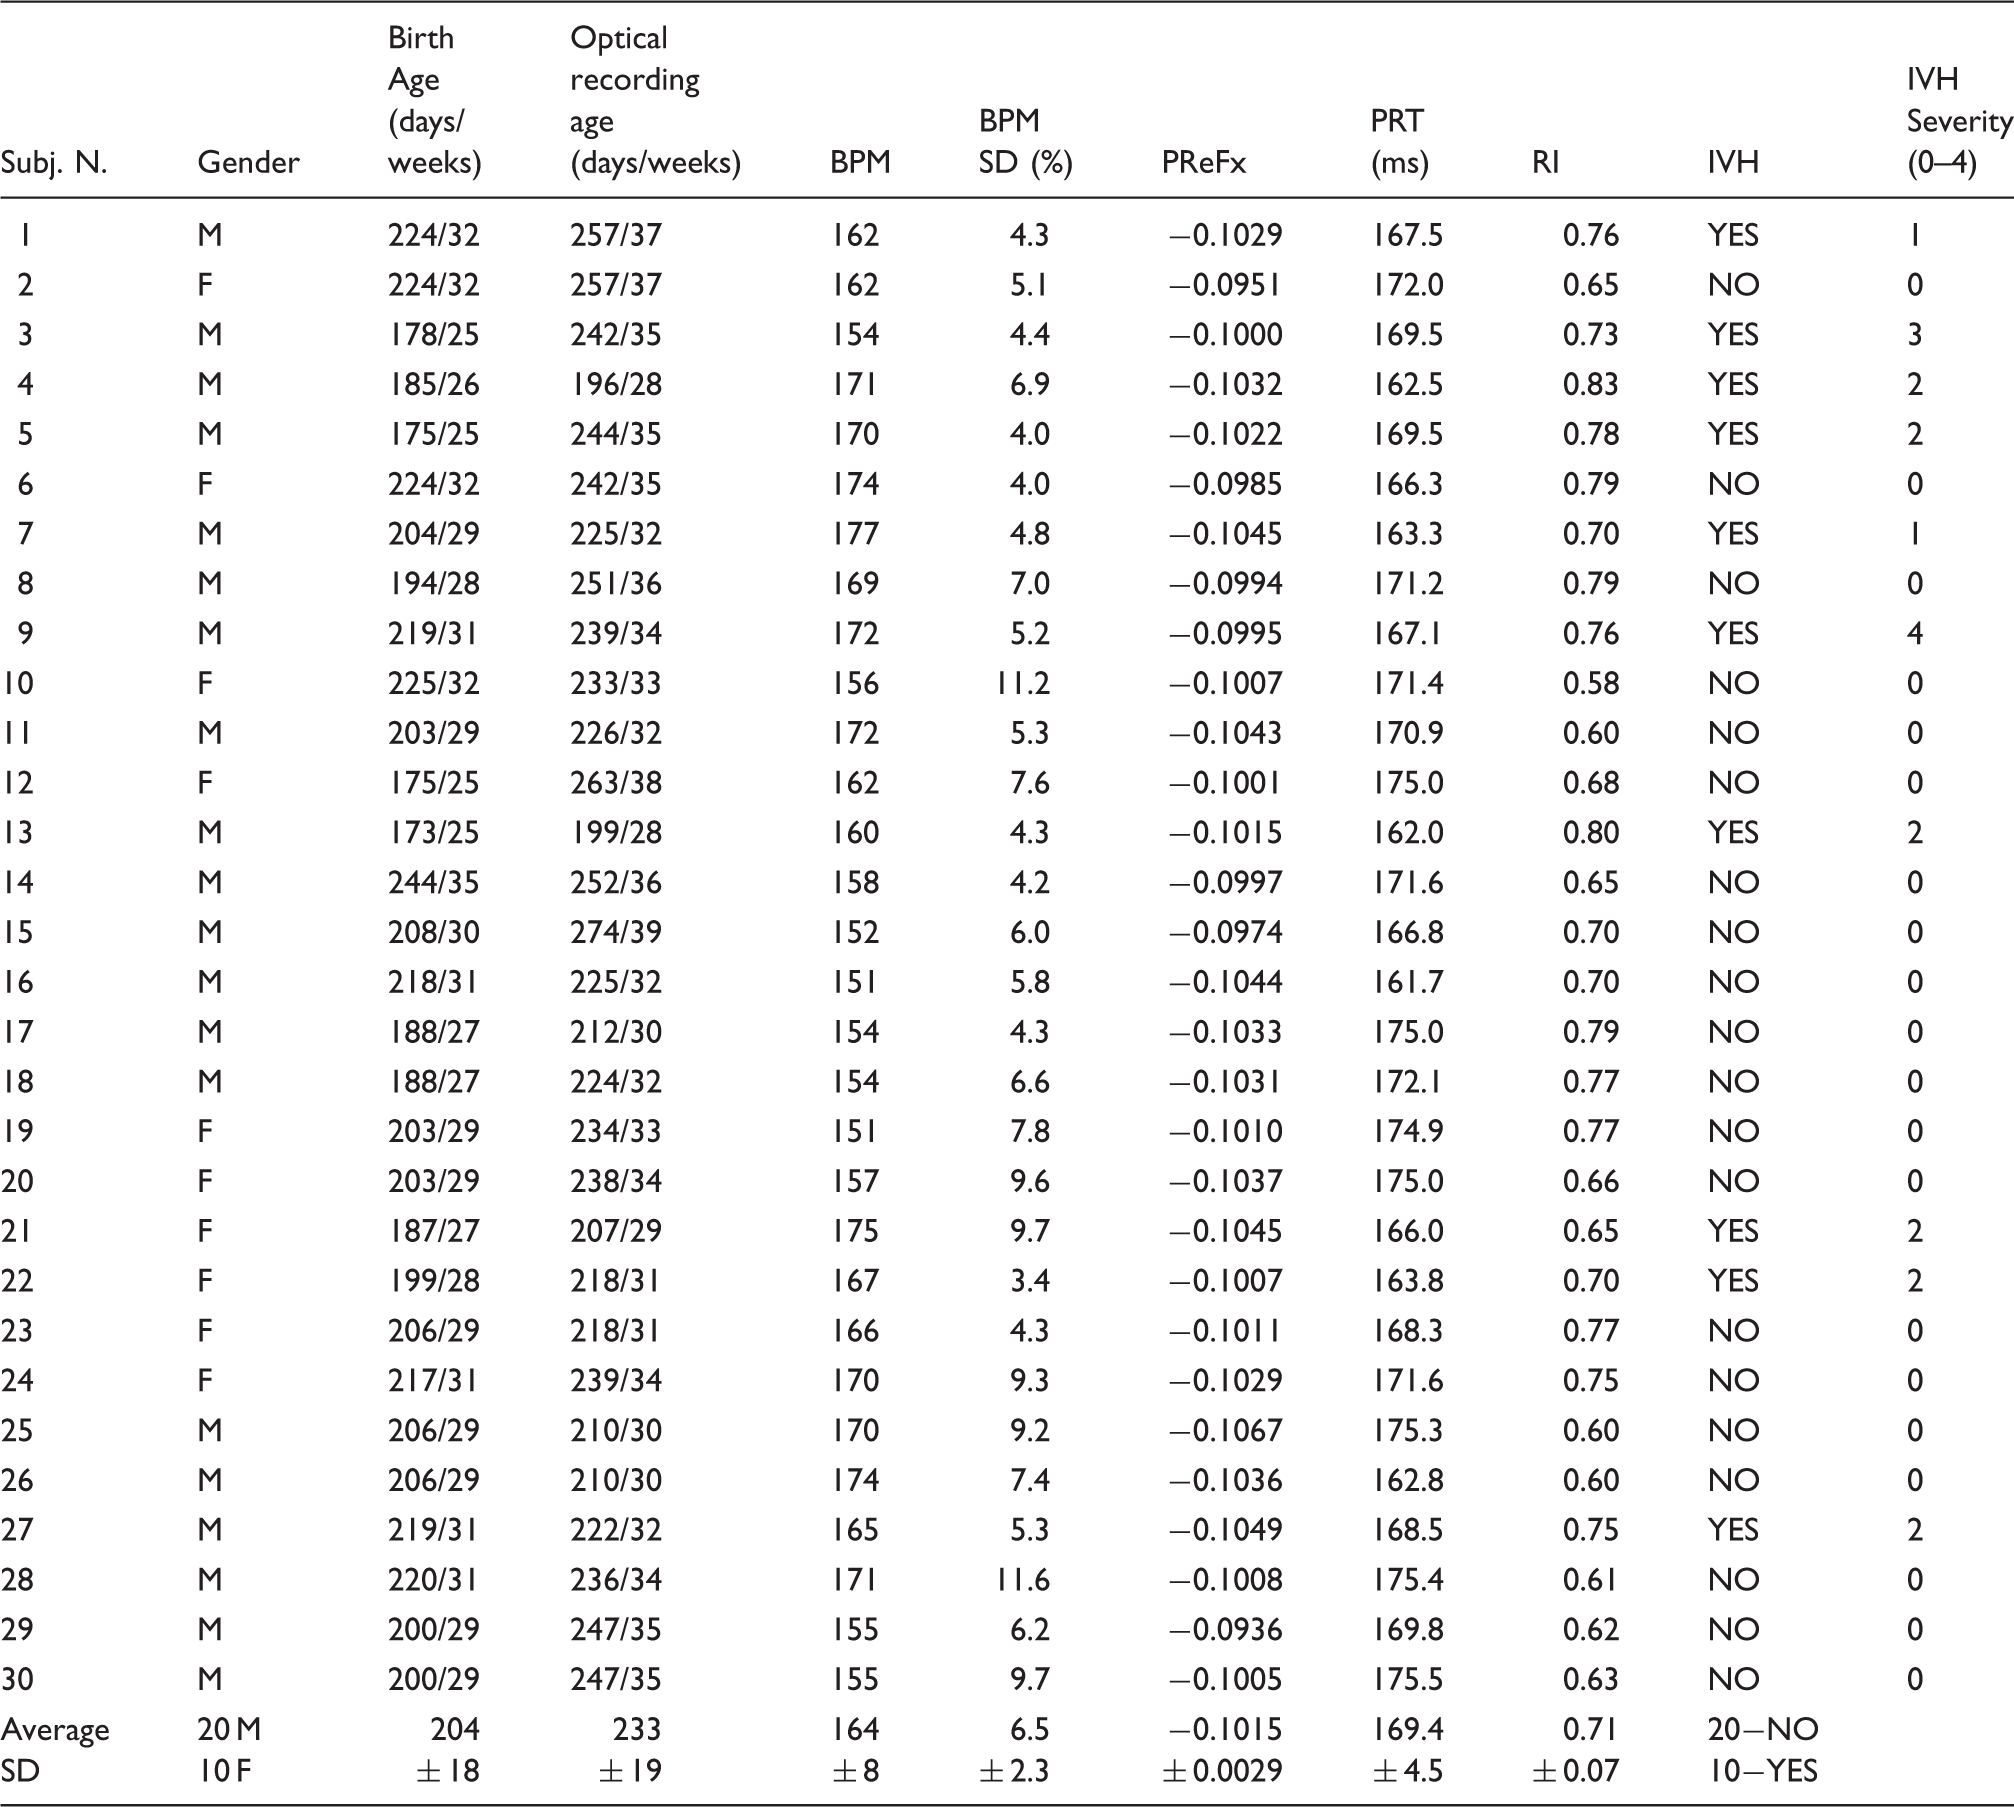
Note: Age is expressed in days and in wGA (rounded up).
BPM: beats per minute; SD: standard deviation expressed as a percent of mean value; PReFx: pulse relaxation function; IVH: intra-ventricular hemorrhage; Severity: 0 (no IVH) to 4 (most severe).
Although blood pressure was monitored for clinical purposes, the BP data were not stored or included in the research documentation available for these infants. However, the infants were hemodynamically stable at the time of recording (which occurred while they were asleep, in the middle between two feeding periods), with no additional circulatory support or medication
Optical recording
Two optical patches were positioned on the infant’s head while she/he was lying supine in the incubator (Figure 1(a)). The right and left frontotemporal patches were independently positioned such that the middle detector of the most inferior row in each hemisphere (labeled E and M, respectively, Figure 1(b)) was located 1.5 cm above the infant’s ipsilateral preauricular point. This arrangement allowed for extensive coverage of the temporal, parietal, and frontal brain regions surrounding the Sylvian fissure. The recording patches were well tolerated and did not engender any visible reaction from the infants, who were in fact sleeping.
(a) Experimental setting: two optical patches were placed on each brain hemisphere with the infant remaining within the incubator. (b) Locations of sources (red) and detectors (blue) overlaid onto the right and left hemisphere of the template infant’s brain. (c) Estimates of the region investigated by the optical patches for the youngest (top) and oldest (bottom) infants. Average light sensitivity is displayed on a logarithmic scale up to an attenuation of 100 times its maximum value.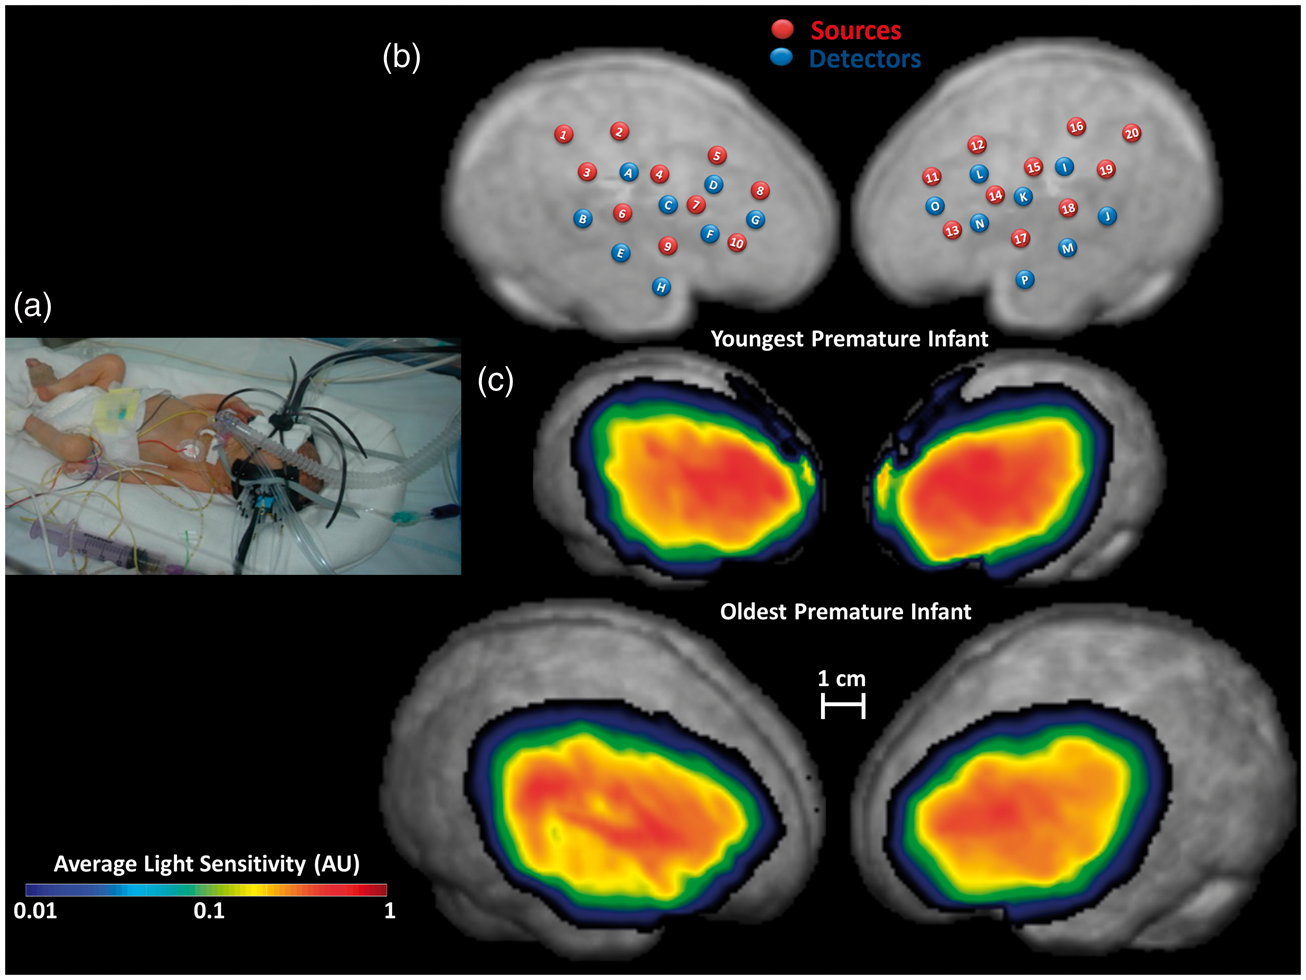
Approximately 15 min of recording were obtained from the infants while they slept (most typically during the early night hours). This was done to minimize movements, which could create artifacts in the optical recordings. There are currently no data about daily fluctuations of cerebral pulse curves in preterm infants (or even in adults). However, PA data may be affected by changes in blood pressure that could occur during normal daily living activities or during the sleep/wake cycle. For this reason, we attempted as much as possible to maintain comparable recording conditions across infants (i.e. infants asleep during the early hours of the night).
Pulse-DOT data were acquired with a multi-channel frequency-domain NIR spectrometer (ISS Imagent™, Champaign, Illinois) equipped with 128 laser diodes (64 emitting light at 690 nm and 64 at 830 nm) and 16 photo-multiplier tubes (PMTs), using a 38.5 Hz sampling frequency. Ten light injection points (each consisting of two wavelengths) and eight detectors were located on each hemisphere, forming a high-density optode array of 80 channels/hemisphere (data were recorded from all combinations of sources and detectors), for a total of 160 channels for each wavelength (Figure 1(b)). Source-detector distances varied between 1.0 and 6.0 cm. Good contact of the optical fibers (sources and detectors) with the scalp was monitored using the following criteria: (a) there was enough light reaching the detectors (readings >10,000 AC counts for the shortest channels); (b) the amount of light reaching detectors decreased exponentially with distance from the source; and (c) the pulse waveform was visible in the individual recordings (before averaging), at least for short and medium source-detector distance channels. Channels with low light (typically with long source-detector distances; DC intensity <20 A/D counts) were excluded from analysis. This led to the exclusion of 38% (SD = 15%) of channels on average.
Optode co-registration with structural magnetic resonance images
Anatomical priors (i.e. segmented structural MR images (sMRI)) are required to generate the forward models used for 3D reconstruction. In adults, each person’s pulse-DOT recording locations are first digitized in 3D and then co-registered with individual sMRI.11–13 However, it is not ethical to obtain MR imaging in this fragile population solely for research purposes. Thus, a segmented T2-weighted sMRI of a single de-identified 32-weeks-old preterm infant (224 days; head circumference = 29 cm), obtained for clinical reasons, was used for anatomical reconstruction. Since variability in head size is an important factor in our sample (and may affect the relative overlap of the optical maps), head circumference was measured in each infant, and used to generate a factor for isotropic inflation/deflation of the template sMRI to approximate each individual’s head size. Note that this procedure does not account for different head shapes or gyrification, but does provide a reasonable first approximation in the absence of more precise anatomical information. Optode locations were digitized on a doll (head circumference = 29 cm) wearing the same optode patches used during actual measurements, using a Polhemus 3D digitizer. The right and left optode patches were independently co-registered to each subject’s rescaled sMRI estimate based on the sMRI-identified preauricular points, with a fixed sagittal rotation as reported in Figure 1. Finally, a geometrical “scalp forcing” procedure was applied to the digitized points to force them to lie on the sMRI outer surface.24,25
Pulse-DOT analysis
Following procedures used in the adult literature, DC intensity data were normalized (by dividing them by their mean value),26,27 movement corrected, 28 and band-pass filtered between 0.5 and 5 Hz (Butterworth digital filter). Although a movement correction algorithm 28 was used, the recorded signals were practically free of movement artifacts, due to the limited mobility of preterm infants within the incubator while asleep. As a consequence, the corrected data were nearly identical to those before correction.
Only the 830-nm channels were used for pulse shape estimation because this wavelength has higher sensitivity to pulse-related absorption changes due to its higher sensitivity to oxy-hemoglobin (arterial saturation >95%). 11 An automatic procedure for single-pulse identification 18 was used to identify individual pulses (measured as relative changes in DC light intensity) which were then averaged separately for each channel and subject.
To reconstruct the pulse waveform in the infants’ head, we used algorithms identical to those applied in the fNIRS research field.22,29–31 However, pulse-DOT’s SNR is much greater than fNIRS’s, because of its large amplitude and rapid frequency (<500 ms; in preterm infants, a pulse occurs more than twice/s). Thus, in the same time period, it is possible to collect >25 times as many pulses as fNIRS responses. This results in a five-fold increase in SNR.
A forward model of light propagation in the head (yielding a Jacobian or sensitivity matrix) and an inverse procedure are required for 3D reconstruction. The forward model was estimated using the finite element method (FEM) applied to the diffusion equation.29,31 The FEM software NIRFAST29–30 was used to model light propagation (based on the sMRI template brain) and to compute sensitivity matrices of DC light intensity to absorption changes. “Fine” meshes (maximum tetrahedral volume = 2 mm3) were generated for FEM using the Matlab software iso2mesh. 32 Baseline optical properties were obtained from Chiarelli et al. 22 and Tian and Liu. 33 Figure 1(c) reports the average logarithmic light sensitivities for the youngest and oldest infants, overlaid onto the rescaled sMRIs. Note that the optical patches were identical in dimension irrespective of infant’s head size. The visual impression that light sensitivity is broader on the larger head is due to the fact that the head’s surface is projected on a flat surface for displaying purposes. However, this is not an issue for the actual analyses, since they were conducted on a 3D voxel-based, rather than a 2D pixel-based, volume.
Light attenuates exponentially as a function of source-detector distance, making the recorded data progressively less sensitive to phenomena occurring deeper or further away from sources and detectors. Stable estimates of pulse-DOT data can only be obtained for voxels for which sensitivity is >.01 of the maximum value (Figure 1(c)). Therefore, the forward model was restricted to these voxels.
Next, an inverse source-reconstruction procedure was applied to the recorded signals. 22 This procedure allowed for unbiased localization of absorption fluctuations up to a depth of 30 mm from the scalp. Tomographic (i.e. 3D reconstructed) optical pulse wave data were obtained in the rescaled sMRI space; however, for inter-subject analyses, each sMRI was isotropically scaled to the reference image dimension. This approach allowed us to compare waveforms describing the pulse for each voxel across subjects.
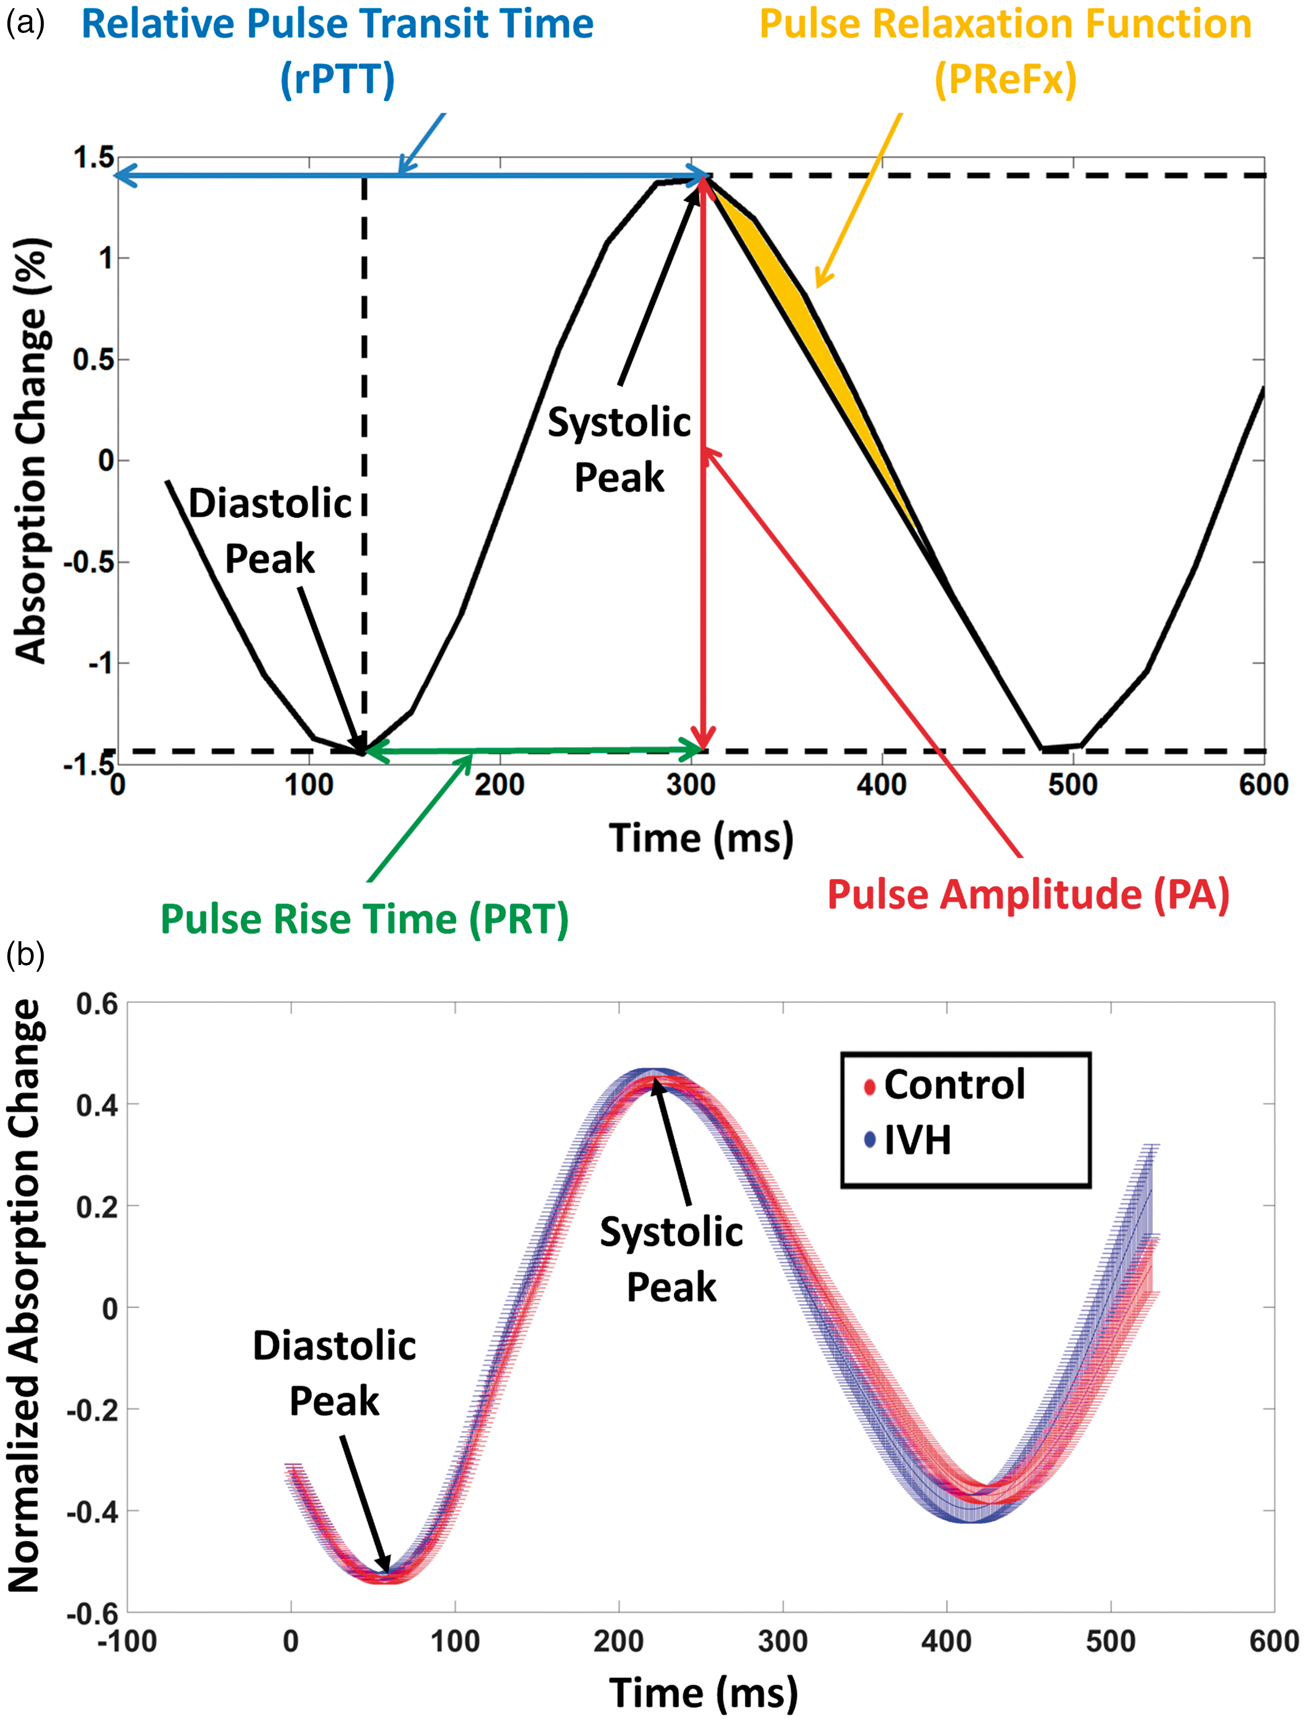
For each voxel and subject, we extracted four pulse-DOT parameters (see Figure 2(a)):
PA, defined as the peak-to-peak absorption change during the first 700 ms of the averaged pulse waveform of each subject. This interval was long enough to contain a full heartbeat for all the newborns examined (typical heart rate in preterm infants ≈160 beats-per-minutes, BPM, inter-beat interval ≈370 ms). PRT, computed as the time interval from the minimum (diastolic peak) to the maximum (systolic peak) absorption change in the same 700 ms time window. PReFx, defined as the area under the optical absorption pulse waveform between the maximum absorption value (peak systole) and the next minimum absorption value (the following peak diastole) normalized by both time and amplitude and subtracted by a constant value of 0.5. This value was subtracted to compare the area of the measured pulse relaxation response to the area of a hypothetical pulse relaxation modeled as a linear decay after the systole. Relative PTT (rPTT), defined as the latency of the peak absorption change (systolic peak) in the same time window used for PA. In our previous adult studies,
11
PTT was anchored to the peak of the EKG R-wave (with the EKG and optical measures recorded concurrently and time-locked to each other). In these infants, EKG was monitored for clinical purposes but was not synchronized with the optical measures. Therefore, we used the earliest peak across all voxels for each individual as the time origin for the computation of PTT (Figure 2(a)). While this measure changed in base value across infants, it was still possible to time-lock the pulse-DOT waveforms obtained from different voxels in the same subject to that of the voxel in which the waveform had the earliest peak, so that the relative timings of peaks and troughs could be compared across voxels. This rPTT cannot be used for between-subject comparisons but it still allows for meaningful comparisons across voxels within a subject, since the same time reference was used for all voxels. This approach allowed us to generate maps of the relative timing of the spread of the pulse wave throughout the brain (with the voxel with the earliest peak value being set to 0 ms). Note that, because of the high SNR of the procedure and reliability of PTT estimates, the spatial localization of the earliest peak was highly stable. Moreover, since an average map across subjects was computed, the influence of between-subjects variability, which could be caused by both error in the manual placement of the optical patch and real anatomical differences, was minimized. (a) Average optical pulse waveform from a representative voxel and infant, showing relative changes in NIR light absorption related to the heart pulsation. The four pulse-DOT parameters, pulse amplitude (PA), relative pulse transit time (rPTT), pulse rise time (PRT), and pulse relaxation function (PReFx) are shown on the waveform. Note that computation of PReFx also involved a normalization step not shown in this figure (i.e. dividing the area by both systolic-diastolic peak interval and PA). (b) Time course of the optical pulse waveform averaged across voxels and infants, separately for infants with (blue) and without IVH (red). The spread of the waveforms represents the standard error of the mean for each data point.
MCA TCD
In addition to the optical data, the RI was also calculated for each of the 30 preterm infants from clinical TCD measurements. TCD was carried out on either the left or right MCA 34 by an expert clinician. These data were used as a reference to validate the optical estimates. Specifically, we compared the receiving operating characteristic (ROC) 35 curves obtained with the two methods to assess their ability to detect changes as a function of IVH status. ROC curves were created by plotting the true positive rate (sensitivity) against the false positive rate (or fall-out, calculated as 1−specificity) at various threshold settings.
Results
Pulse rate, heart rate variability, and average pulse waveform
Pulse rate (i.e. heart rate) was, on average, 161.6 BPM (SD: 8.2) for infants in the control group and 167.2 (SD: 7.0) BPM for those in the IVH group; however, this difference was not significant, t(28) = −1.81, p < .10. Heart rate variability (HRV, a sign of maturity of the vagal system, measured as the percent ratio between the standard deviation and the average of the inter-beat interval) was greater in the control (7.0%, SD = 2.3%) than in IVH group (5.2%, SD = 1.8%), t(28) = 2.21, p < .05.
Figure 2(b) reports the pulse waveforms for preterm infants with (blue) and without (red) IVH diagnosis, averaged across voxels and subjects. The ranges of the red and blue waveforms in Figure 2(b) represent the standard error (SE) of the mean (computed across subjects for each group). The narrow SE ranges of these waveforms reflect the high SNR of pulse-DOT data. In order to take advantage of signal averaging and increase the temporal resolution of the estimated waveforms, the original waveforms (sampled every 26 ms), were oversampled at 1 ms intervals by cubic spline interpolation. Note that the grand average pulse waveforms in Figure 2(b) do not appear to return to the diastolic baseline after the systole. This is due to variability in inter-beat interval duration, both across individual pulses within each infant and across infants, which causes the second diastolic peak to be misaligned in the grand average waveform.
To assess the reliability of measurements of the preterm pulse-DOT parameters, we separated the recording time in two blocks (first and second half of the measurement), thus creating two average pulse waveforms for each subject. Pulse parameters were extracted for these two waveforms, and their values were compared. For all parameters, the split-half reliability was good (PA: r = 0.93, PRT: r = 0.65, PReFx: r = 0.70, rPTT: r = 0.83, all p < .0001). Moreover, we assessed the independence of the different parameters. As in the adult, the parameters were generally uncorrelated with each other, with only PA and PRT exhibiting a significant association (r = 0.40, p < .05). This indicates that they provide largely independent information about the physiology of cerebral arteries.
Spatial distribution of optical pulse parameters
Figure 3(a) shows spatial maps of PA for each hemisphere, averaged across all infants. As a reminder, PA reflects the distension of the arteries due to the passing of the pulse pressure wave. Since this distension depends on arterial blood pressure, larger arteries such as the MCA should exhibit larger changes in PA, as demonstrated in adults.
11
Note that the highest average values of PA were obtained at ∼10 mm from the head surface. Thus, this procedure can be considered to be maximally sensitive to pulsations occurring at this depth. Preterm skull thickness and distances between preterm brain and scalp have been recently investigated by coregistration of MRI and CT scans in premature infants. Skull thickness is less than 4 mm and the distance between brain and scalp at 30 wGA is less than 6 mm regardless of brain area (except for the insula, where this distance is ∼10 mm).
36
Thus, the observed depth for the maximum PA effect is consistent with measuring superficial sections of the MCA and its major collaterals (which run along the cortical surface of the insula).
(a) Map of the average pulse amplitude (PA) and (b) Map of the average relative pulse transit time (rPTT) overlaid onto the template infant brain. PA and rPTT were computed only for voxels with data from at least half of the infants.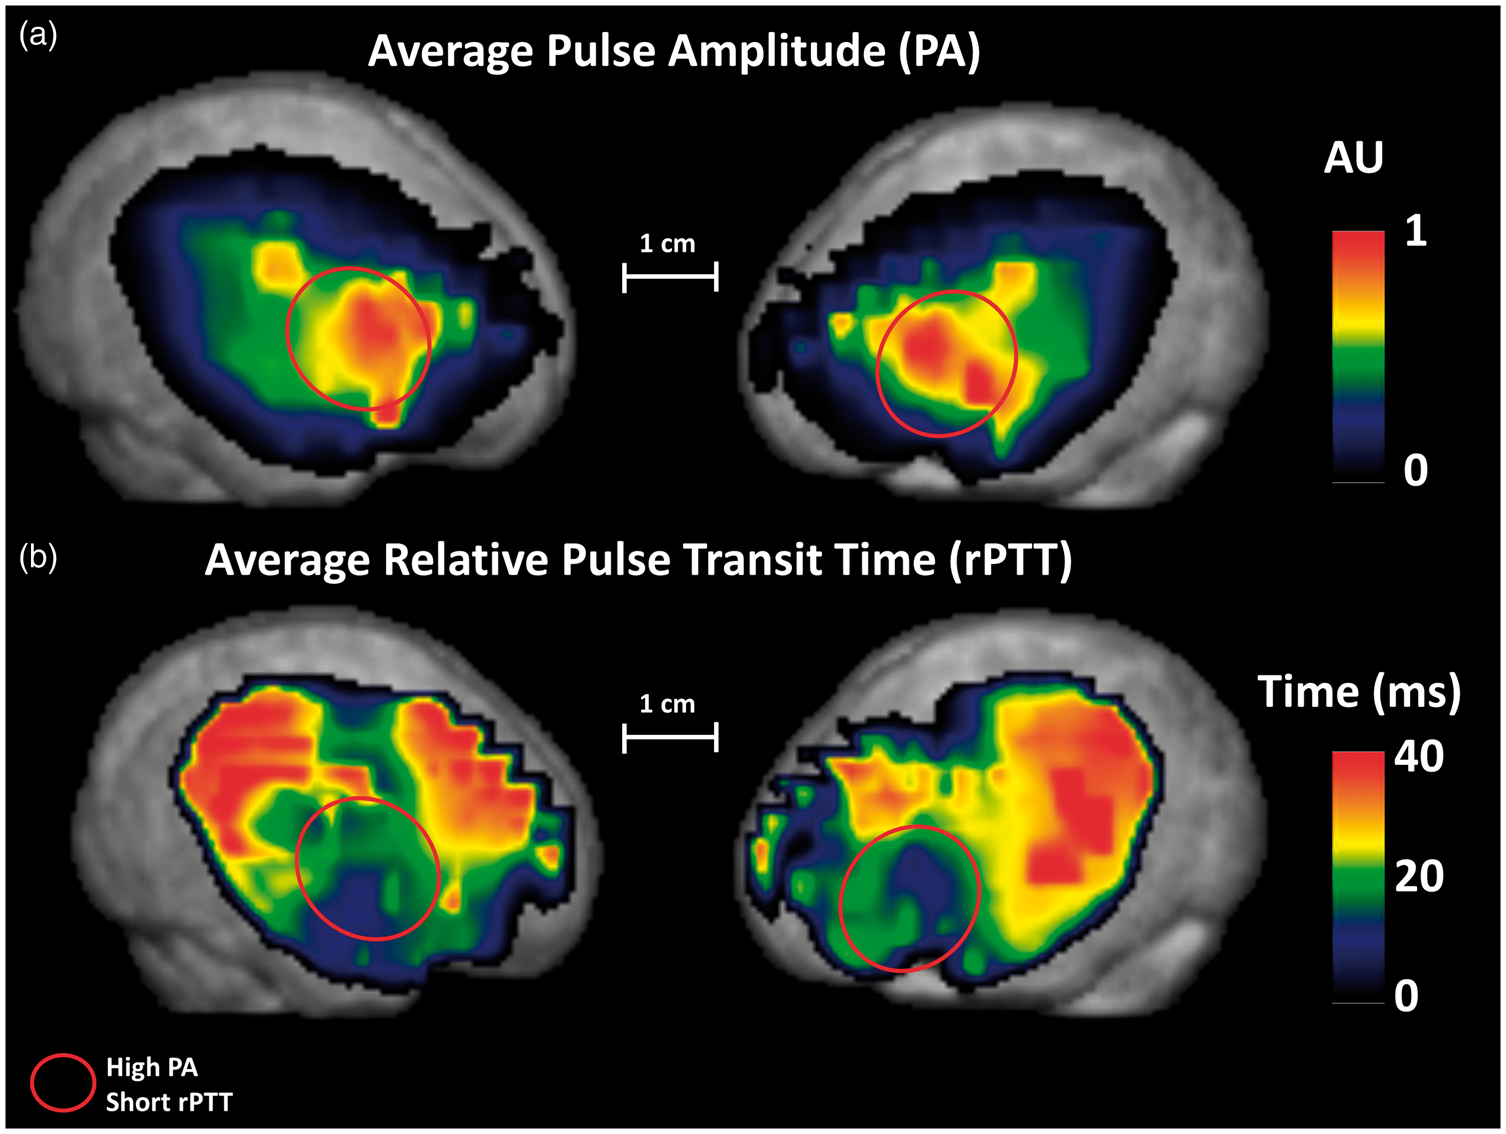
Figure 3(b) shows spatial maps of rPTT for each hemisphere, averaged across all infants. The rPTT should follow the known direction of flow for major arteries in the brain, in this case the MCA, which emerges at the cortical surface near the anterior portion of the Sylvian fissure (shortest rPTT) and then spreads superiorly, anteriorly, and posteriorly (longer rPTTs) to perfuse lateral frontal and posterior temporal and parietal regions. 34 Consistent with the emergence of the MCA at the Sylvian fissure, Figure 3(b) indicates that anterior temporal/inferior frontal regions have the largest PA and the shortest rPTT.
Relationship of pulse parameters with GA and IVH
Figure 4(a) presents a scatter plot of PA as a function of GA, showing a reduction of PA as infants mature; however, although this relationship was present in both the IVH and control groups, it did not reach significance in either (r(8) = −.36, p = .38 and r(18) = −.10, p = .70, respectively; r(28) = −.20, p = .30 when both groups were combined). Figure 4(b) shows a plot of PReFx values as a function of GA. There was a strong relationship between PReFx and GA at the time of measurement (r(28) = .61, p < .001). This relationship was more evident in the control group (r(18) = 0.72, p < 0.001) than in the IVH group (r(8) = .28, p < .10), but the difference between these two correlations was not significant (z = 1.38, p = .16). Finally, the relationship between PRT and GA (Figure 4(c)) was positive and significant (r(28) = 0.38, p < 0.05), but smaller than that between PReFx and GA. Interestingly, this correlation was much stronger when computed including only infants with IVH (r(8) = .76, p < 0.01). The difference between the correlations for the IVH and control groups was significant (z = −1.99, p < .05). This was due to a very low value of PRT (indicating very low arterial elasticity) in the youngest infants in the IVH group; however, for the more mature infants, the difference between IVH and control groups was less pronounced. This may reflect the fact that the optical measurements were taken some time after the onset of the IVH episode, and that this interval was likely shorter in the youngest IVH infants. In other words, the association between IVH and reduced arterial elasticity (as measured by PRT) was evident even though the PRT measures were taken at variable times (up to 88 days) after birth and after the IVH episode (which typically develops within 72 h from birth). This in turn suggests that the temporal variability between IVH onset and pulse-DOT measurements may mask a stronger and more diagnostic relationship between PRT and IVH.
Scatter plots of (a) pulse amplitude (averaged across all voxels) vs. gestational age (days/weeks) at the time of optical recording; (b) pulse relaxation function (averaged across all voxels) vs. gestational age (days/weeks) at the time of optical recording; (c) pulse rise time (averaged across all voxels) vs. gestational age (days/weeks) at the time of optical recording; and (d) resistivity index (measured from the middle cerebral artery with TCD) vs. gestational age (days/weeks) at the time of the Doppler measurement.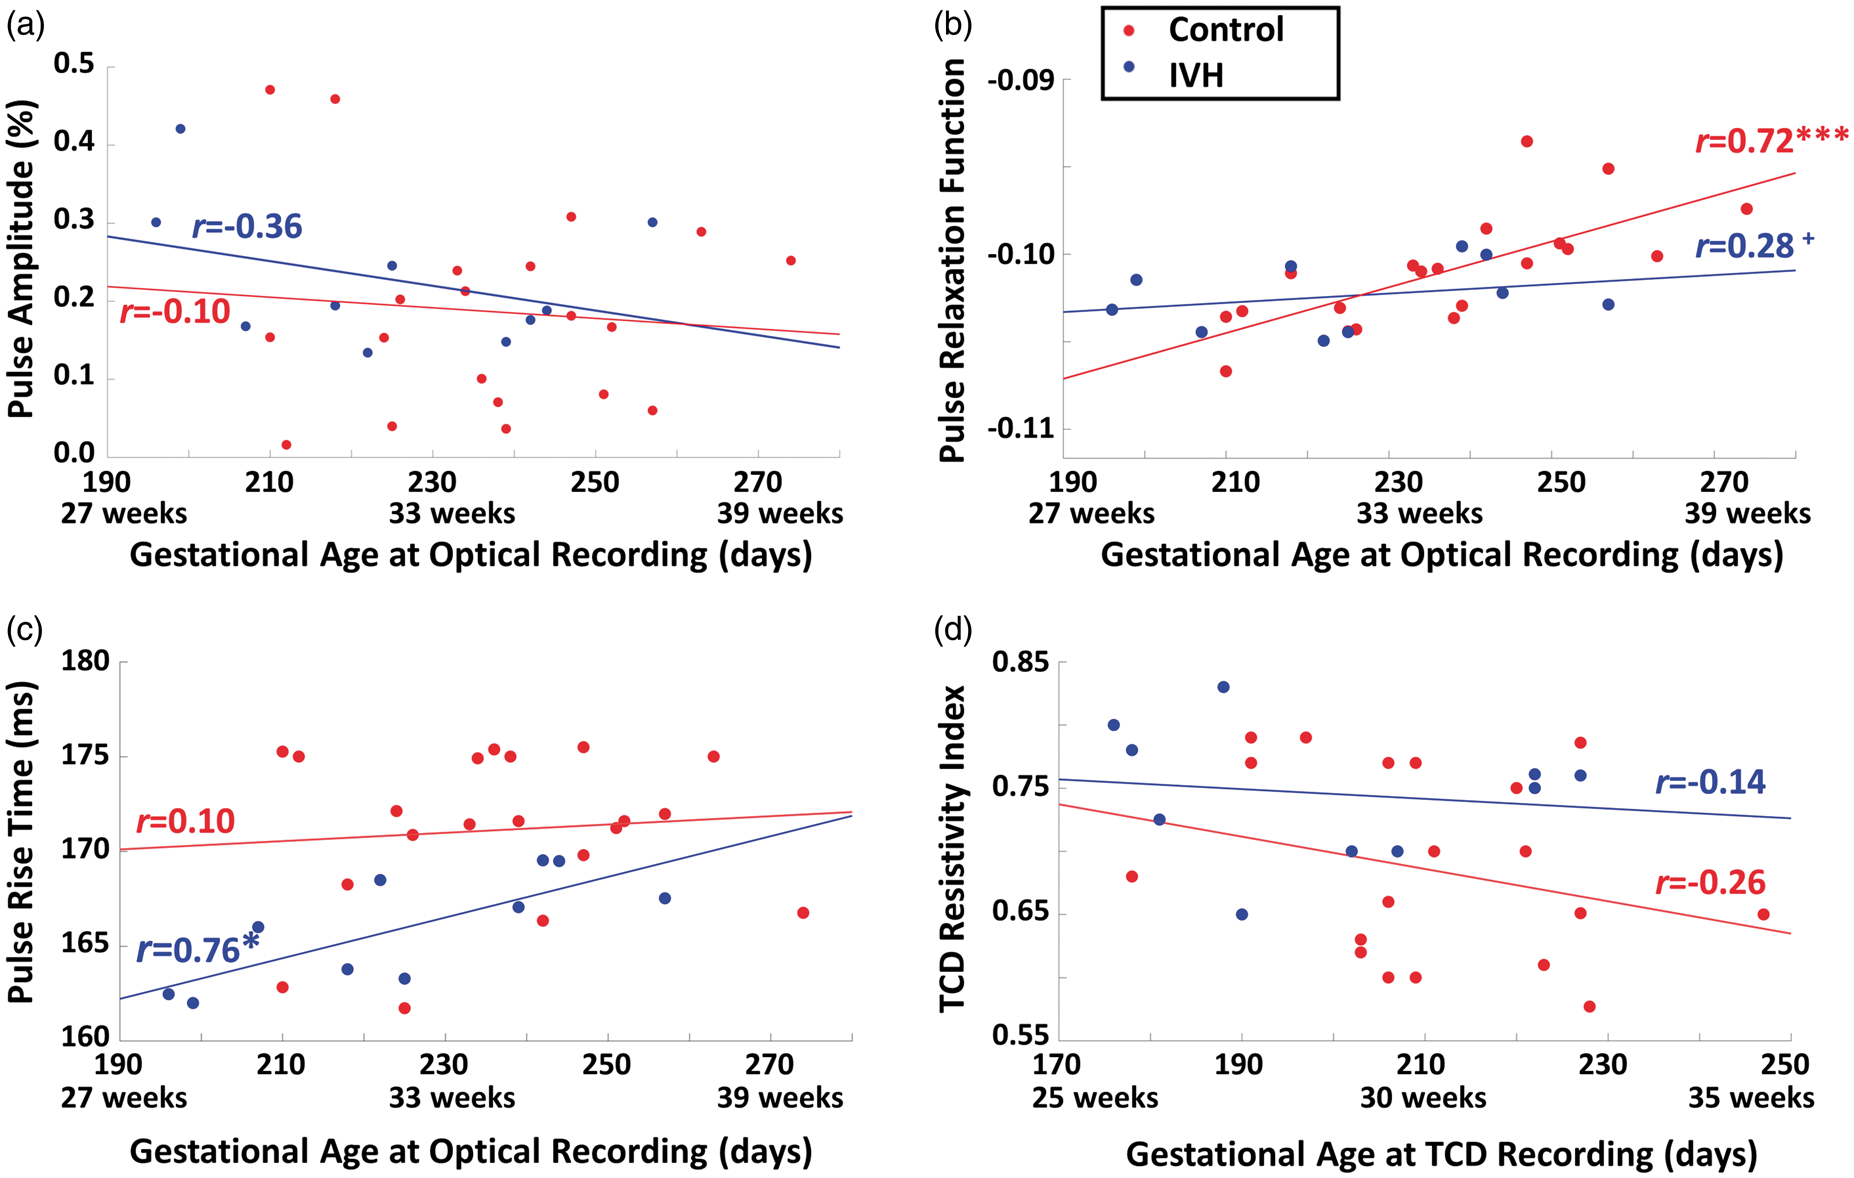
Figure 5(a) reports a comparison between the average PRT in healthy infants (171.1 ms, SD: 4.1 ms) and those with concurrent IVH (165.9 ms, SD: 2.9 ms). The PRT was significantly longer in healthy than in IVH infants, (t(28) = 3.53, p < .005, effect size = 0.66). This group difference remained significant even after regressing out GA and heart rate (both ps < .005). Importantly, although PRT was significantly correlated with HRV (r = 0.461, p < .01), the group difference in PRT remained significant when HRV (which, as mentioned above, was also significantly different in the two groups) was regressed out (t(28) = 2.48, p < .05). The effect size (i.e. the ratio of the difference between the two group means – 5.2 ms – and the within-groups standard deviation – 3.8 ms) was 1.35. In contrast, it is important to note that neither PA nor PReFx provided a statistically significant classification of healthy and IVH infants (PA: t(28) = −0.90, p = 0.38; PReFx: t(28) = 1.26, p = 0.21). However, for both parameters, the sign of the statistical test was the one expected (negative for PA, with controls having a smaller PA; positive for PReFx, with controls having a larger PReFx, each suggesting higher elasticity for control infants).
(a) Box plot of pulse rise time (averaged across all voxels) for infants with and without IVH. (b) Box plot of the resistivity index (measured from the middle cerebral artery with transcranial Doppler) for infants with and without IVH. (c) ROC curves reporting the ability of PRT and RI to correctly classify infants with IVH as a function of different classification thresholds.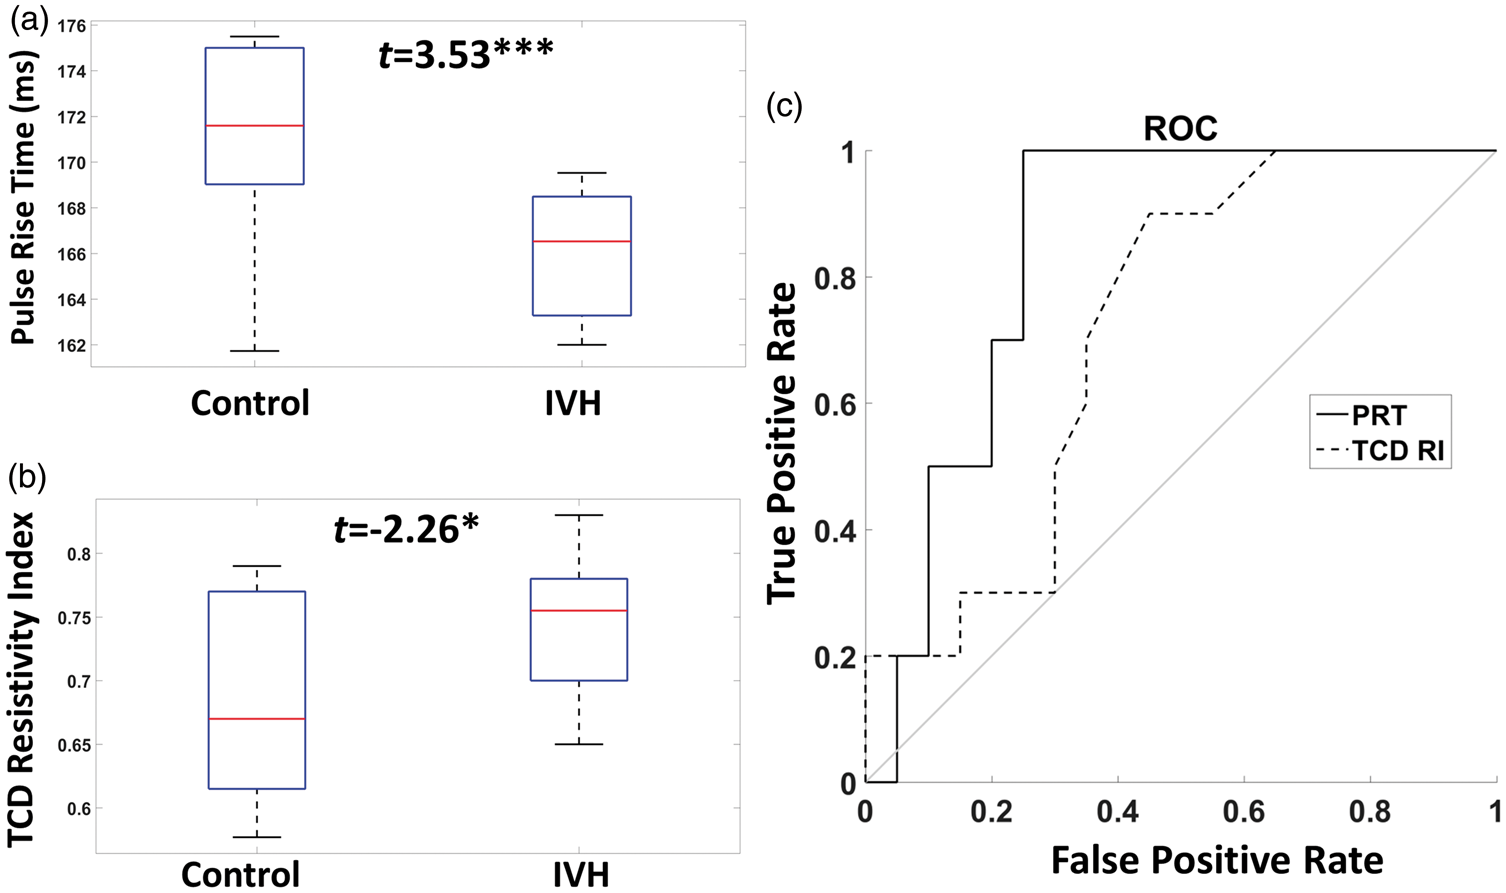
The PRT results were compared with those obtained from a TCD-derived measurement, the MCA RI (Figure 5(b); see also Figure 4(d) for a scatter plot of the RI vs. GA at the time of ultrasound recording). As expected, a smaller RI was found for the control (0.68, SD: 0.075) compared to the IVH infants (0.74, SD: 0.053; t(28) = −2.26, p < 0.05, effect size = 0.39). The effect size appeared smaller for TCD than for the optical PRT results (even though the RI was obtained at a time much closer to the onset of the IVH). However, there was no significant difference between the two methods in their ability to discriminate between IVH and control infants, probably due to the relatively small number of infants in each group.
We also performed receiver operating characteristic (ROC) analyses, 35 assessing the respective sensitivity and specificity of PRT and TCD as function of different classification criteria (Figure 5(c)). These curves indicate that, independently of the criterion, a better (although not statistically significant) classification of IVH vs. control infants was obtained with the optical PRT than with the TCD RI parameter (area under the curve (AUC), PRT: 0.80, TCD RI: 0.67, a 76% higher classification difference with respect to the random value, 0.5).
To better determine the significance of this association, we performed some additional analyses. First, we examined the correlation between GA at birth (used as a proxy for the time of IVH onset) and the time at which the optical PRT measurements were taken in the IVH patients. This correlation was positive (r = .56, p < .005), indicating that the lower PRT value found in infants with IVH was more evident for those infants in which the optical measures were taken at a time close to IVH onset, and was less evident when the optical measures were taken at a longer distance from the IVH episode. This result rules out the possibility that the PRT-IVH relationship might be due to a slowly developing phenomenon, consequent to the IVH itself (which would lead to the prediction of a stronger relationship at longer intervals from IVH onset). Second, we estimated what would have been the PRT parameter if it had been measured at birth (by regressing back the effect of age from birth from the PRT parameter – with the same slope for age-from-birth for all subjects), and used these estimates to compare the two infant groups (IVH vs. controls). For both groups, the between-subject variability was smaller when age-from-birth was regressed out, whereas the PRT measure difference between the two groups remained virtually unchanged. As a consequence, the t value for the IVH-control comparison grew from t(28) = 3.53, p < .005 to t(28) = 3.72, p < .001. This finding indicates that the time interval between the IVH episode and the optical measurement likely reduced the diagnostic properties of PRT with respect to IVH status, and that the effects would have been more evident had the optical measures been taken closer to the time at which the IVH episode occurred.
Finally, to determine which brain areas significantly contributed to the relationship between PRT and IVH, t-tests comparing the values of PRT in the two groups were conducted separately for each voxel. Figure 6 shows a thresholded map of voxels with values exceeding t(28) > 2.50 (p < 0.01, uncorrected) overlaid onto the average brain. These thresholded maps identify an inferior frontal/anterior temporal region overlaying the superficial segments of the MCA in both hemispheres.
34
Maps displaying voxels for which a contrast between the pulse rise time (PRT) values in infants with and without IVH yielded a t-value exceeding 2.5 (p < 0.01, uncorrected), overlaid onto the template brain.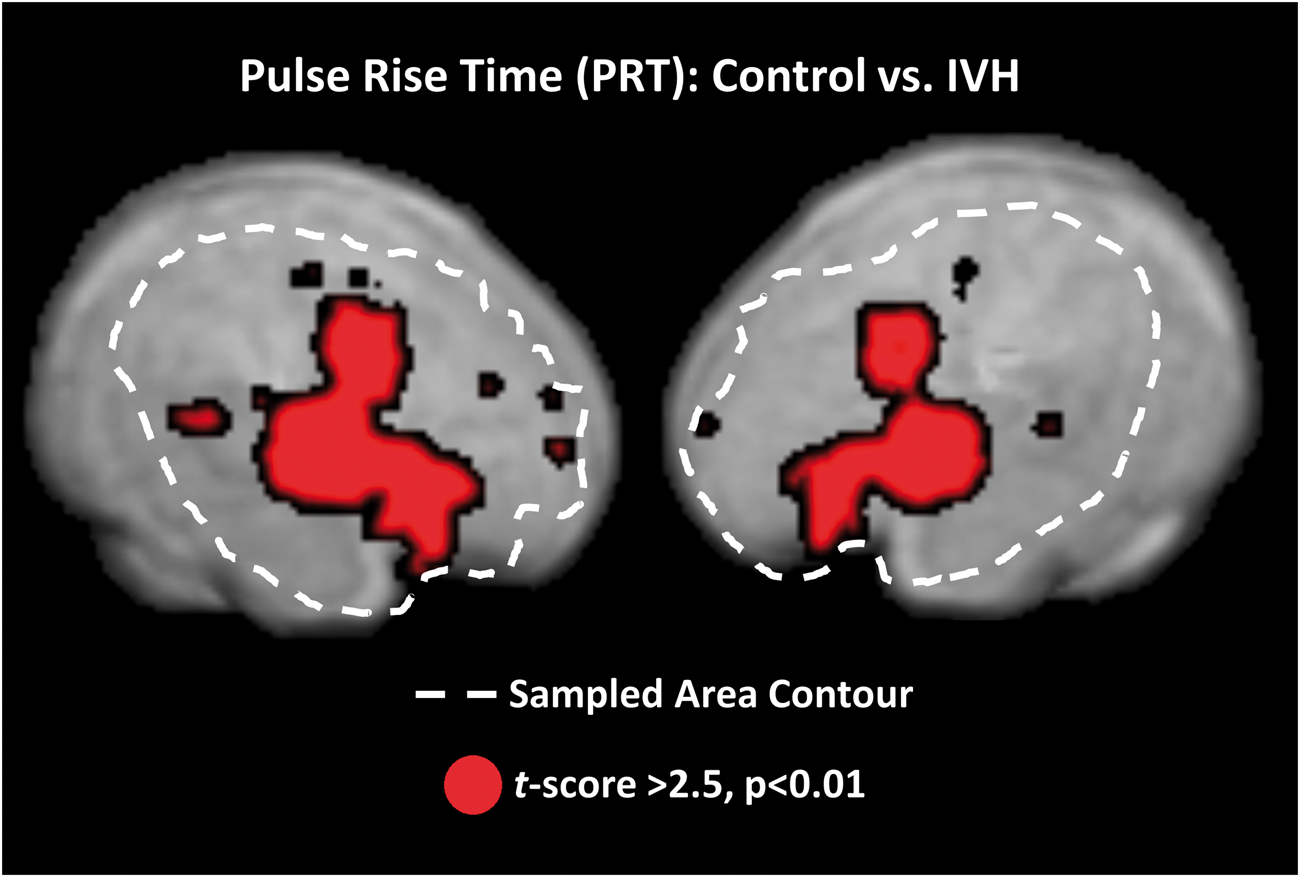
Discussion
Here we investigated optical pulse parameters related to arterial elasticity 11 in preterm infants. Pulse-DOT parameters provide useful estimates of brain arterial health in adults together with the ability of mapping the trajectory and flow velocity of major superficial arteries at low levels of resolution.11–13 In preterm infants, optical estimates of arterial health and development can be extremely useful because this population is particularly prone to vascular immaturity, often leading to brain insult. 8 Low arterial elasticity may lead to both IVH and hypoxia, though in different ways. First, reduced elasticity is likely associated with increased fragility of the immature vasculature, which may break in response to large variations in cerebral blood pressure. As mentioned in the introduction, this is one of the hypothesized mechanisms of IVH (especially for grade 4 IVH, which is the most dangerous). Second, reduced elasticity may result in diminished vascular reactivity in response to exogenous or endogenous stimuli. This may constitute the pathophysiological basis of recurrent relative tissue hypoxia under conditions of high metabolic demand in the brain. In turn, this may lead to a weakening of the functional wiring of the immature neural network, thus resulting in long-term damage and developmental cognitive deficits.
An important feature of pulse-DOT is that, because of its high SNR, it is possible to characterize the pulse waveform with high levels of accuracy and reliability, enabling the estimation of a number of parameters related to arterial function. As shown in adults, these parameters provide separate estimates of different aspects of arterial status, and include (a) PA (a measure of the volumetric expansion of the arteries from the diastolic to the systolic peak, which is largely influenced by the difference between systolic and diastolic blood pressure at the systemic level); (b) two measures of pulse latency, rPTT (a measure of the time of pulse peak at a particular location in the brain), and PRT (a measure of the rise time of the systolic wave), both of which are related to PWV and therefore to arterial elasticity up to the point where the measurements are taken; and (c) PReFx (a measure of pulse shape, related to both elasticity in the area fed by the artery being measured and to peripheral resistance). Taken together, these measures provide substantial information about cerebrovascular function, how it develops with age, and how it relates to pathology (the occurrence of IVH in the current study). In addition, the portability and flexibility of this optical technology make it suitable for use in the NICU environment, as measurements can be taken within the incubator thus avoiding the need to move these highly fragile infants. These characteristics make pulse-DOT a promising tool for investigating arterial health in preterm infants. If applied during the first 24 h after birth and/or monitored over critical periods, these measures could help to identify risk factors for and/or severity of IVH and, perhaps, cerebral hypoxia, and guide toward therapeutic choices (such as careful management of respiration/oxygenation and blood pressure) that may help prevent cerebrovascular accidents. Of course, the efficacy of such interventions remains to be demonstrated within a large clinical trial.
Here we reported the first study assessing the feasibility of measuring pulse-DOT in preterm infants. The results showed that two pulse parameters (PReFx and PRT) in perisylvian regions (perfused by the MCA) correlated with the infants’ GA at recording, with larger PReFx and longer PRT indexing higher arterial elasticity and therefore cerebrovascular development. Of particular interest was the relationship between PRT and IVH. Overall, a longer PRT was found for healthy compared to IVH infants. This result remained significant after controlling for possible confounding factors including GA, heart rate, and HRV. In particular, controlling for HRV was important since HRV was significantly different between the two groups. Thus, PRT measures provide important additional information that is not available through HRV alone. This is not surprising as HRV is a general measure of vagal function, whereas PRT is a cerebral measure of arterial elasticity – two logically distinct concepts, although both related to the maturity of the vascular system.
As shown by ROC analyses, the sensitivity of PRT in discriminating IVH infants was higher than that of the RI of the MCA based on TCD (AUC 0.80 vs. 0.67), with a true positive rate of 1 coupled with a false positive rate of 0.3. This indicates that while reductions in PRT occur in all IVH infants, not all infants with low PRT values belonged to this group. Thus, low arterial elasticity (as measured with PRT) could be considered a risk factor for IVH, directly related to low cerebrovascular elasticity that goes beyond the immaturity of the vagal system (estimated from HRV).
Spatial analyses of the sensitivity of PRT showed increased effects in areas compatible with the emergence and flow direction of the MCA. This result may be due to the higher SNR in bigger arteries. Alternatively, it may reflect a loss of specificity of the PRT measure in the smaller branches of the MCA. Note that, as mentioned above, PRT measures arterial elasticity up to the point where measures are taken. In this sense, it is different from TCD-RI, which is a measure of elasticity in the particular point where measures are taken, and from PReFx, which instead measures arterial elasticity downstream with respect to the point of measurement.
This paper is based on the idea that elasticity of the MCA (or lack thereof) can be considered as a proxy for the elasticity of arteries feeding deep, periventricular regions of the brain, where IVH and/or hypoxia are most likely to occur. Indeed, a parallel exists for cerebral small vessel disease (CSVD) in older adults, with results that support a similar relationship. 37 In either case, it is possible that the elasticity of other arteries, such as the anterior cerebral artery (ACA), which are more directly involved in the perfusion of periventricular regions, could be even better predictors of IVH than the elasticity of the MCA. Note that MCA (the main artery measured in the current study) has little direct role in the perfusion of the sub-cortical periventricular regions where IVHs occur. Therefore, it is not surprising that, of the three measures of arterial elasticity considered in this study, PRT is the one best correlated with the presence of an IVH (see also Perlman and Volpe 38 for a similar account of the lack of a close relationship between TCD-RI and IVH). If this account is correct, PReFx measurements taken from the anterior cerebral artery, which is more directly involved with the perfusion of these deep regions, might be more diagnostic than PReFx measures taken from the MCA. Future studies should investigate this possibility.
The separation between IVH and control infants based on PRT was particularly evident when the optical measures were taken at an earlier GA, closer to the moment at which the IVH occurred. This may reflect the fact that, as infants mature, their arterial elasticity improves even in those infants who suffered from IVH. This may be a useful clue to determine whether the PRT-IVH association reflects the fact that low arterial elasticity (producing a short PRT and faster PWV) increases the IVH risk or instead whether the faster PRT is caused by the IVH (perhaps because of the presence of inflammation, increased intracranial pressure, or other reasons). Since PRT measurements were taken, on average, more than a month after birth, while IVH typically occurred within 72 h from birth, in the current study, it is impossible to discriminate if this parameter is a predictor of IVH or a symptom of its presence. However, the data indicate that even in IVH infants, PRT was positively correlated with the age at which the optical measures were taken, suggesting that IVH may not by itself prevent arteries from becoming more elastic with infant maturation. Thus, these results are encouraging for future studies designed to further assess the clinical monitoring and diagnostic capabilities of pulse-DOT, with recordings performed closer to birth/IVH onset as well as in a longitudinal fashion. Of special interest may be to monitor/predict the evolution from low grade IVH (1–3) to severe IVH (grade 4). Such studies may make it possible to determine whether a short PRT can be observed in advance of the onset of a severe IVH episode, thus suggesting that low arterial elasticity may be predictive of the occurrence or evolution of IVH, in a manner that it is not possible with the current cross-sectional study. In fact, it needs to be highlighted that, although both RI and PRT had good levels of sensitivity and specificity to the presence of IVH, neither RI nor PRT could predict the gravity of the IVH (grade 1 to 4), within the IVH infants. This is likely due to the small number of IVH infants in this study and to the skewed distribution of the RI and PRT values (with very few – three infants – having an IVH grade level >2). An alternative possibility is that low arterial elasticity is merely a risk factor for the occurrence of IVH, but not a determinant of its gravity once it occurs.
The results presented here emphasize that analyses of volume-averaged pulse parameters can provide useful information about the development of the arterial system. For instance, they revealed a significant correlation between PReFx and GA at recording in healthy preterm infants. As PReFx is due to the interaction between arterial elasticity and peripheral resistance, this correlation may be due to an increase in arterial elasticity as a function of age (or, alternatively, to a reduction in peripheral resistance, which, however, has not been documented). Interestingly, all healthy preterm infants in our study showed a negative PReFx (average value around −0.1; see Table 1), whereas in our previous adult studies, this same parameter had almost always positive values (albeit smaller in older than in younger adults11–13). This is consistent with idea that the arteries of even the most mature preterm infants in our study were still less elastic than those of adults (or, alternatively, that their peripheral resistance was much higher). PRT also showed a correlation with recording GA. As PRT is related to the elasticity of the arterial wall, this finding is consistent with the idea that arterial elasticity grows during this period of development, and that pulse-DOT measures are sufficiently sensitive to pick up these maturational changes within this relatively short time window (∼80 days).
Some limitations should also be noted. The optical recording montage used in this study covered only perisylvian brain regions, which are perfused by the MCA and its collaterals. This limitation could be overcome in future research matching the extensive montages used in adults,11–13 especially as wearable electronics become more readily available for testing and long-term monitoring.39–41 Further, the spatial resolution of pulse-DOT is limited by the use of diffuse optical imaging (approximately 1.5–2 cm) with a maximum penetration of about 3 cm. 22 However, the mapping data indicate that, similarly to our prior work with adults, 11 the optical pulse was larger (as evidenced by the PA parameter) and peaked earlier (as evidenced by the rPTT parameter) in the anterior portion of the Sylvian fissure, corresponding to the point at which the MCA reaches the cortical surface (Figure 3). From there, the peak latency measures appeared to follow the known direction of flow of the MCA and its collaterals spreading both superiorly, anteriorly, and posteriorly to feed lateral frontal and posterior temporal and parietal regions. These maps lend support to the notion that it is possible to study specific arteries in the brain, albeit at a low level of resolution, using pulse-DOT. It should also be noted that in our study, PRT was calculated on the basis of averaging estimates obtained across different voxels and/or subjects. This allowed us to measure differences in PRT between groups that were shorter than the temporal sampling used in the study (26 ms). In future work, it would be important to increase the sampling rate, as this may help to further increase estimation accuracy.
This study presents an initial observation based on a relatively small sample (N = 30, with only 10 infants with IVH), and the clinical utility of the approach is still to be determined. It is also unclear whether the quality of the recordings can be replicated in a large-scale clinical trial. However, the observed PRT sensitivity and specificity values for IVH are encouraging. Potentially, measures of PRT could be used as a screening method to detect individual variations in cerebral arterial elasticity, in itself a risk factor for IVH. Further research is also needed to determine whether pulse-DOT parameters can be predictive of the severity of IVH.
Notwithstanding these limitations, the results of the current study clearly indicate that pulse-DOT can provide useful data about arterial function in preterm infants, making it of potential clinical interest in the NICU setting, where a flexible non-invasive technology for monitoring preterm cerebrovascular development is desirable.
Footnotes
Funding
The author(s) disclosed receipt of the following financial support for the research, authorship, and/or publication of this article: This work was supported by a grant to Dr. Gratton (PI) from the Center for Nutrition, Learning, and Memory (CNLM) at the University of Illinois at Urbana-Champaign, funded by Abbott Nutrition.
Acknowledgments
We are grateful to the parents of preterm infants and NICU personnel for their help and support for this project.
Declaration of conflicting interests
The author(s) declared no potential conflicts of interest with respect to the research, authorship, and/or publication of this article.
Authors' contributions
Conception and design of the work: Antonio M Chiarelli, Mahdi Mahmoudzadeh, Kathy A Low, Edward L Maclin, Monica Fabiani, Fabrice Wallois, Gabriele Gratton.
Data collection: Mahdi Mahmoudzadeh, Fabrice Wallois, Guy Kongolo, Sabrina Goudjil.
Data analysis and interpretation: Antonio M Chiarelli, Mahdi Mahmoudzadeh, Kathy A Low, Edward L Maclin, Monica Fabiani, Fabrice Wallois, Gabriele Gratton.
Drafting the article: Antonio M Chiarelli.
Critical revision of the article: Antonio M Chiarelli, Mahdi Mahmoudzadeh, Kathy A Low, Edward L Maclin, Monica Fabiani, Fabrice Wallois, Gabriele Gratton.
Final approval of the version to be published: All authors.