
Abstract
We investigated the expression of the Alzheimer’s disease-related metabolic brain pattern (ADRP) in 18F-FDG-PET scans of 44 controls, 27 patients with mild cognitive impairment (MCI) who did not convert to Alzheimer’s disease (AD) after five or more years of clinical follow-up, 95 MCI patients who did develop AD dementia on clinical follow-up, and 55 patients with mild-to-moderate AD. The ADRP showed good sensitivity (84%) and specificity (86%) for MCI-converters when compared to controls, but limited specificity when compared to MCI non-converters (66%). Assessment of 18F-FDG-PET scans on a case-by-case basis using the ADRP may be useful for quantifying disease progression.
Introduction
Mild cognitive impairment (MCI) marks the transition between normal cognitive function and Alzheimer’s disease (AD) dementia. However, some MCI patients remain stable throughout their entire observed clinical course, and may even revert to normal cognition. 1 Discriminating between non-converters and patients with pre-dementia AD is important for patient management and for future clinical trials. However, this is not easily achieved by clinical evaluation alone.
18F-Fluoro-deoxyglucose positron emission tomography (18F-FDG-PET) may aid in this differentiation. 2 18F-FDG-PET provides an index of brain glucose metabolism, which reflects synaptic activity and integrity. 3 AD pathology induces synaptic dysfunction in specific, connected brain regions. These downstream brain changes result in decreased 18F-FDG uptake in posterior temporo-parietal regions.
Patterns of altered 18F-FDG uptake can be extracted with the Scaled Subprofile Model and Principal Component Analysis (SSM/PCA), a well-studied multivariate method. 4 Disease-related patterns identified by SSM/PCA not only delineate the disease topography, but can also be used to quantify new 18F-FDG-PET scans. For quantification, normalized scans are projected onto a previously identified disease pattern to calculate a subject score. The subject score reflects the degree to which the pattern is present in a subject’s scan. This method was previously shown to be successful in the differential diagnosis of Parkinsonian disorders,5,6 in predicting disease onset in prodromal individuals with Parkinson’s disease, 7 and in evaluating disease progression and treatment effects.8–10
In a previous study, we identified an AD-related pattern (ADRP) in 15 AD patients and 18 controls studied at the University Medical Centre Groningen using SSM/PCA. The ADRP was characterized by relative hypometabolism of the posterior temporo-parietal cortical areas (Figure 1), and was expressed in new patients with AD, but not in healthy elderly. In addition, ADRP subject scores correlated significantly with neuropsychological test performance.
11
The ADRP has also been identified by two other groups.12,13 It has been shown that the ADRP is superior at identifying AD patients compared to univariate, region-of-interest approaches.
12
Further validation of our ADRP
11
in a larger cohort is necessary. Moreover, it is unknown whether ADRP subject scores can discriminate between non-AD and AD at the MCI stage.
Topography of the ADRP. The ADRP was identified in 18F-FDG-PET data (anatomically registered to an 18F-FDG-PET template) as described previously.
11
Stable voxels in the ADRP were overlaid onto a T1 MRI template to show the most salient regions in the pattern. Stable voxels in the ADRP were determined with bootstrap resampling.
12
In this procedure, the pattern identification process (SSM/PCA) is repeated multiple times on randomly sampled data with replacement. This yields multiple slightly different patterns and thus a distribution of weights per voxel. Using this distribution, confidence intervals (CIs) per voxel can be determined. Voxels with CIs straddling zero can be interpreted as non-informative and are therefore excluded from the visualization. Here, we performed 1000 repetitions and applied a one-sided CI threshold of 90% (percentile method). For a discussion of pattern topography, we refer to a previous publication.
11
L = Left. Relatively hypermetabolic areas are color-coded red, and relatively hypometabolic areas are color-coded blue. ADRP: Alzheimer’s disease-related metabolic brain pattern.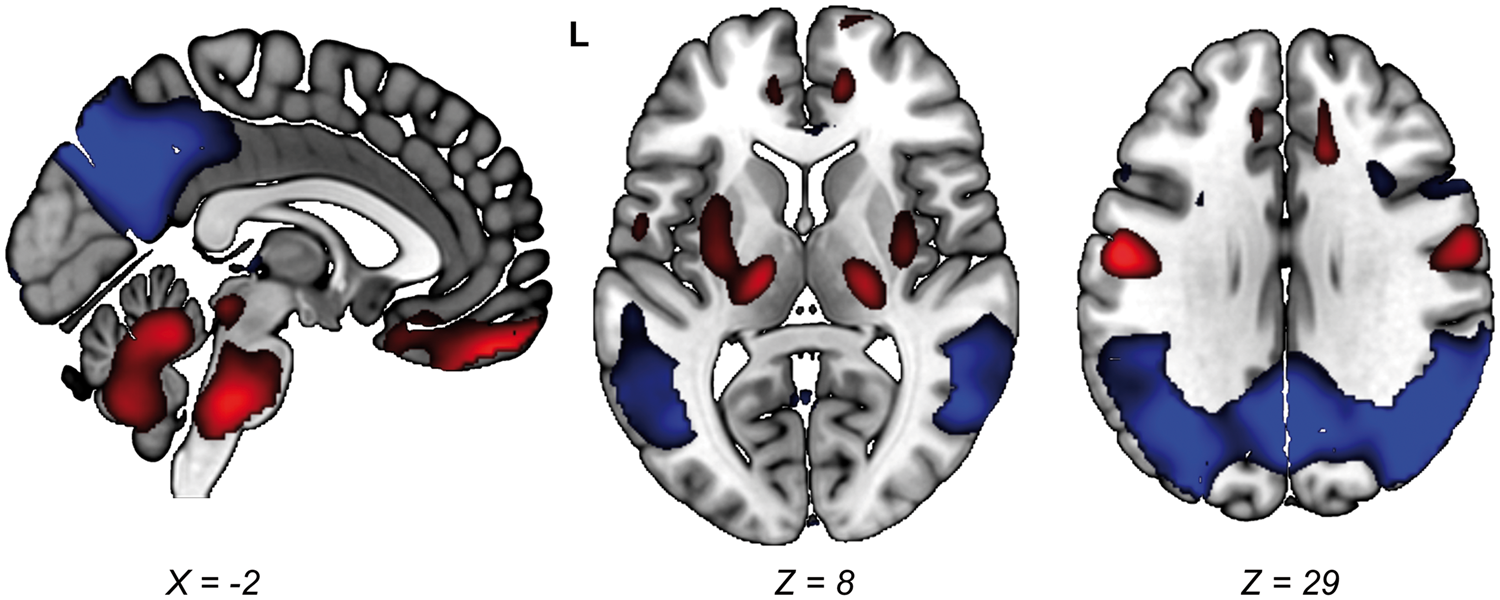
In this study, we further validate the ADRP 11 by computing its expression in a large cohort of healthy controls, MCI patients with long-term clinical follow-up, and AD patients. Our main objective was to determine whether ADRP subject scores could discriminate between MCI-converters and MCI non-converters at baseline.
Material and methods
Participants
18F-FDG-PET data from healthy aged subjects (NA; n = 42), patients with MCI (n = 122), and patients with AD dementia at the time of the PET scan (n = 55) were analysed from a previous study (Supplementary Table 1).14,15 Patients with MCI (n = 122) were separated into three groups: patients who did not progress during follow-up (non-converter MCI; ncMCI, n = 27), patients who progressed to AD after ≥ 2 years of follow-up (early MCI; eMCI; n = 34), and MCI patients who progressed to AD within two years of follow-up (late MCI, lMCI; n = 61). The study was approved by the institutional review board of the University of Genoa, and all subjects gave written informed consent to undergo 18F-FDG-PET in the framework of a long-term observational study, in accordance with the Declaration of Helsinki.
18F-FDG-PET data analysis
18F-FDG-PET data were acquired and pre-processed as described previously. 14 We calculated ADRP subject scores in all 18F-FDG-PET scans as follows: First, 18F-FDG-PET images were masked to remove out-of-brain voxels. Next, each image was log-transformed and both the subject mean and reference group mean were removed. The reference group mean was previously determined in the ADRP identification cohort. 11 These operations resulted in a subject residual profile (SRP) for each scan. Finally, a subject score (SS) for each subject was computed based on the ADRP by taking the inner product of the two vectors, the ADRP and SRP (SS = SRP × ADRP). For further details, we refer to an excellent overview of the method by Spetsieris and Eidelberg. 4
The 18F-FDG-PET data investigated in this study were acquired on a different PET system than the cohort which was originally used for ADRP identification. 11 To account for the effect of camera differences on ADRP expression, ADRP subject scores were z-transformed to the NA group, such that the NA mean was 0 with a standard deviation of 1.
In the ADRP identification cohort, 11 we determined the threshold ADRP z-score with optimum sensitivity and specificity using a receiver-operating curve. This threshold was determined to be z = 0.8 and subsequently applied to the new ADRP z-scores in this study. ADRP z-scores ≥ 0.8 were considered to be indicative of AD. A visual representation of the ADRP 11 that was used in this study is provided in Figure 1.
Statistical analysis
ADRP subject z-scores were compared across NA, ncMCI, eMCI, lMCI, and AD subjects with a one-way analysis of variance (ANOVA) with post hoc Bonferroni corrections. With the threshold of z = 0.8, we identified the number and percentage of subjects correctly classified in each group. Sensitivity, specificity, accuracy, and area under the receiver-operating characteristic curve (AUC-ROC) were determined for the comparisons: NA versus AD patients, NA versus MCI-converters + AD patients, NA versus MCI-converters alone, ncMCI versus MCI-converters + AD patients, and finally, ncMCI versus MCI-converters alone.
Pearson’s R correlation coefficient was used to test the correlation between the parametric variables of ADRP z-scores and age. Correlations between ADRP z-scores and non-parametric variables (MMSE corrected for educational level and age, time to conversion, and education) were tested for significance with a Spearman rank correlation coefficient. All analyses were performed using SPSS software version 23 (SPSS Inc., Chicago, IL), and results were considered significant when P < 0.05 (two-tailed).
Results
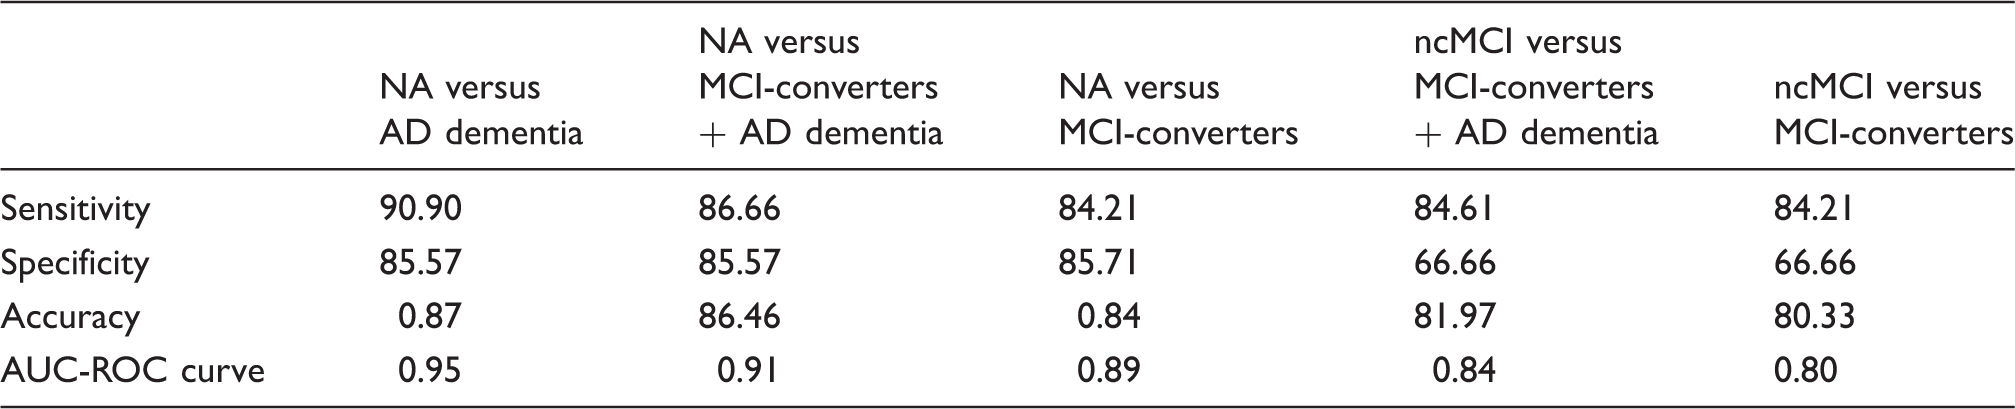
ADRP z-scores were significantly different between groups (F = 36.33, P < 0.0001). ADRP z-scores were significantly higher in MCI-converters and AD patients compared with both NA and ncMCI patients (Figure 2). Table 1 shows the sensitivity, specificity, accuracy, and AUC-ROC for the different group comparisons. Specificity in the ncMCI category was limited (66.66%).
ADRP z-scores across groups. All ADRP subject scores were z-transformed to NA. Group differences were tested for significance with a one-way ANOVA; post hoc comparisons were Bonferroni-corrected. AD: Alzheimer's disease; ADRP: Alzheimer’s disease-related metabolic brain pattern; MCI: mild cognitive impairment; NA: normal ageing; ncMCI: non-converting MCI; eMCI: early MCI; lMCI: late MCI. Diagnostic performance of the ADRP. MCI: mild cognitive impairment; AD: Alzheimer’s disease; ADRP: Alzheimer’s disease-related metabolic brain pattern; ncMCI: non-converting MCI.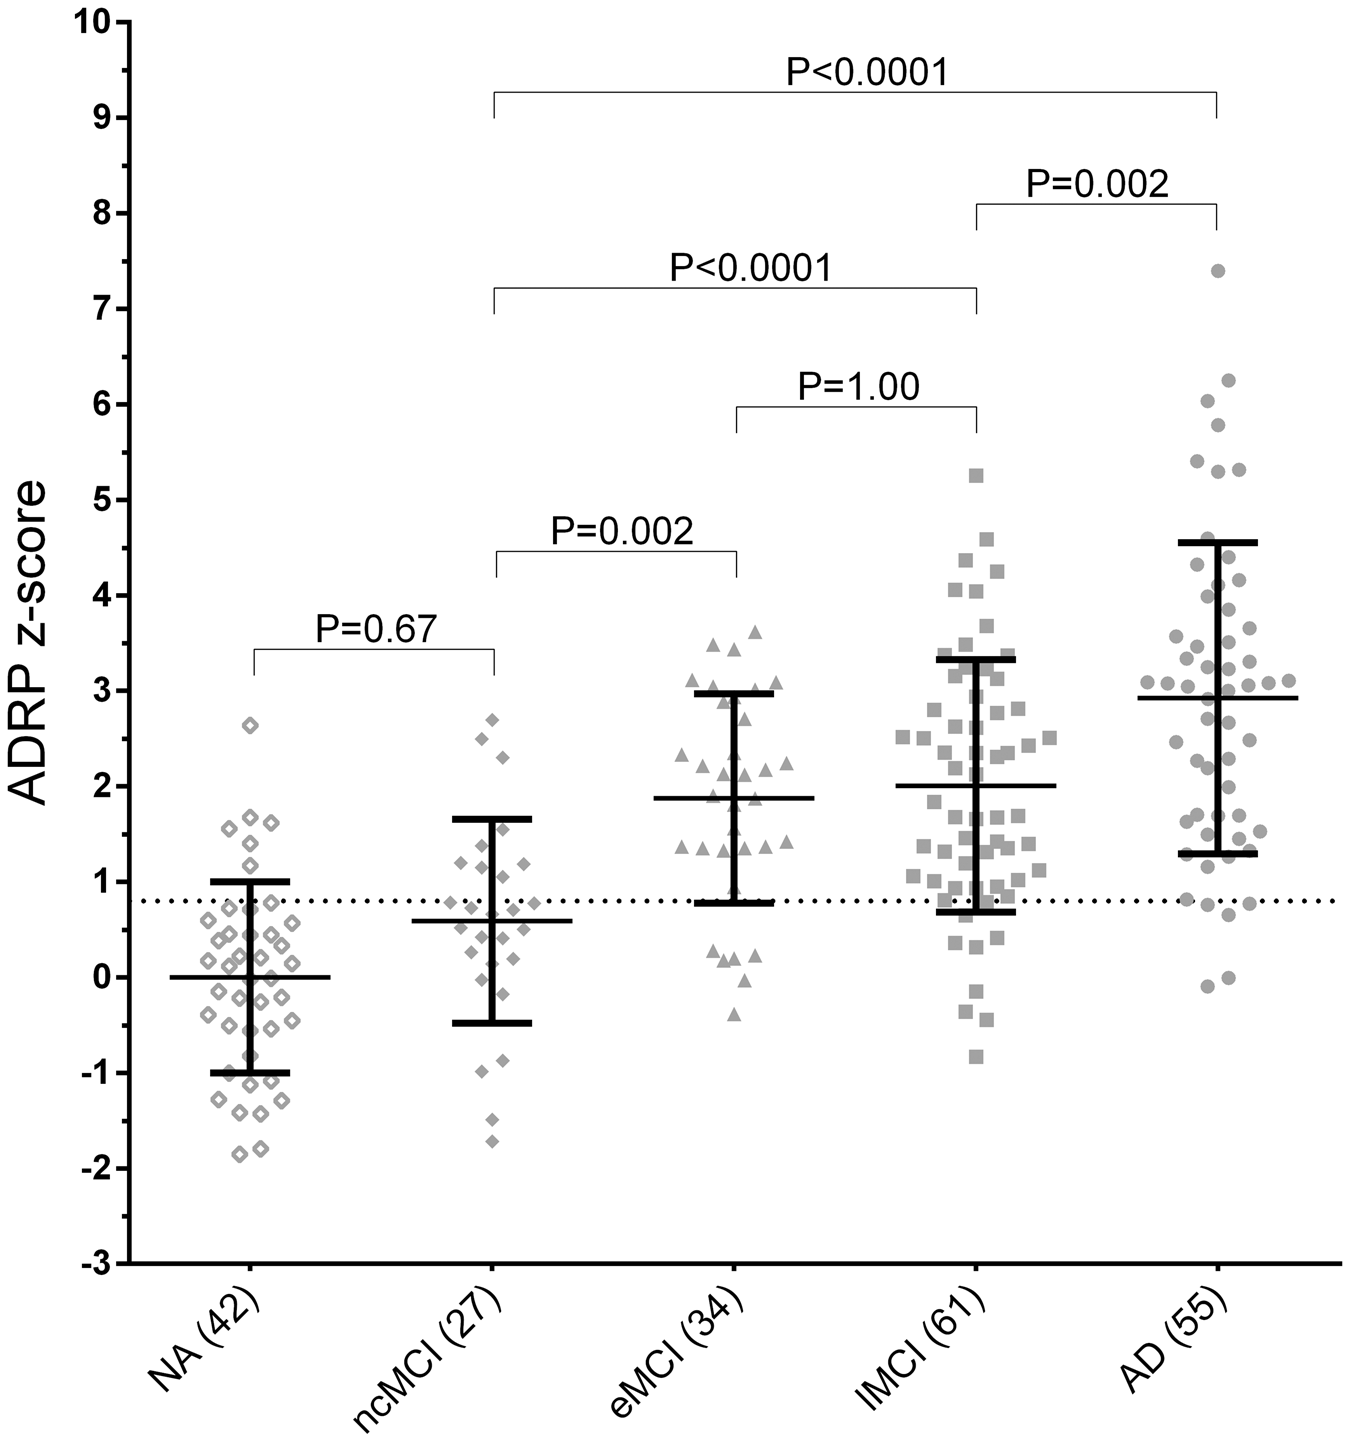
Supplementary Table 1 shows the percentage of correctly classified subjects per category based on ADRP z-scores. Nine out of 27 ncMCI had a supra-threshold ADRP z-score. Follow-up time in these nine individuals ranged from a minimum of 6.8 to a maximum of 9.8 years.
ADRP z-scores were not significantly correlated to time-to-conversion in MCI-converters (ρ = −0.05, P = 0.66). A significant relationship was observed between ADRP z-scores and MMSE (MCI-converters + AD patients; ρ = −0.341; P < 0.0001; Supplementary Figure 1).
In the ncMCI group, ADRP z-scores appeared to be higher in patients with a higher education (Supplementary Figure 2(a)), with borderline statistical significance (ρ = 0.375, P = 0.054). Furthermore, a significant relationship between age and ADRP z-scores was only present in the ncMCI group (r = 0.502, P = 0.008; Supplementary Figure 2(b)). ADRP z-scores did not correlate significantly to age or education in the other groups.
Discussion
We studied expression of the ADRP in baseline 18F-FDG-PET scans of a large cohort of MCI patients with clinical follow-up. ADRP subject z-scores were significantly higher in MCI patients who progressed to AD dementia compared with both healthy elderly and non-converting MCI patients. In line with a previous study, ADRP z-scores were significantly correlated to disease severity in AD (measured by the MMSE score). 11 Compared to healthy elderly, we found good sensitivity (84.2%) and specificity (85.7%) of the ADRP for the detection of early brain dysfunction in AD (i.e. NA versus MCI-converters).
Specificity of the ADRP was limited in the non-converting MCI group (66.7%), as one-third of ncMCI patients (9/27) had a supra-threshold ADRP z-score. Even though clinical follow-up in these patients was long (6.8–9.8 years), such cases cannot simply be interpreted as false-positives. Some may still develop AD dementia on further follow-up. To illustrate, one late-converting MCI patient had a baseline ADRP z-score of 3.11 and only developed clinical AD eight years later.
It could also be hypothesized that non-converting MCI patients with a supra-threshold ADRP score have a larger cognitive reserve. Such individuals are able to maintain a certain level of cognitive functioning, despite having temporo-parietal hypo-metabolism. 16 Individuals with a higher education have a larger cognitive reserve, and are thought to have the ability to recruit compensatory networks involving the dorso-lateral prefrontal cortex. 17 In line with this, we found higher ADRP z-scores in MCI non-converters with a higher education. The non-linear relationship between hypo-metabolism and the clinical manifestation of the disease may also explain why ADRP z-scores did not correlate significantly to time-to-conversion in the pre-dementia AD group.
An alternative explanation for the limited specificity in the ncMCI group may be that the ADRP reflects the underlying abnormalities in neuronal networks in AD, but is not pathology-specific. 2 MCI is a common manifestation in many conditions. 18 The finding that ADRP z-scores were only correlated to age in the ncMCI group may indicate that ncMCI patients with a supra-threshold ADRP score have a non-AD pathology which progresses with age, and affects cortical areas which partially overlap with the ADRP topography. Although patients who met the criteria for vascular cognitive impairment were excluded, 14 mild cerebrovascular disease in combination with other factors (drug therapy, chronic disease, and depression) may have resulted in ADRP-like metabolic changes in the ncMCI group.
While our main objective was to examine whether ADRP scores could adequately differentiate between MCI-converters and non-converters, a second objective of this study was to validate the ADRP which was previously identified in a cohort of AD patients and controls in Groningen. 11 We successfully applied the ADRP to a completely independent dataset. We note that other multivariate approaches were also applied to the data presented in this study,14,15 and gave similar sensitivity and specificity for AD. An important advantage of the current approach is that the ADRP could be applied to new subjects on a single case-by-case basis, despite these subjects having been scanned on a different PET system.
Along with anatomical brain imaging, amyloid PET, and cerebrospinal fluid analysis, expert visual reading of 18F-FDG-PET scans is an accepted ancillary investigation in the diagnostic work-up of cognitive decline.2,19 A single-case analysis in which separate brain regions are identified where 18F-FDG uptake levels deviate from normal can also be achieved with univariate, semi-quantitative SPM-based methods. 20 A limitation of semi-quantitative methods is that it is difficult to objectively quantify progression of metabolic changes. The ADRP may be especially useful to measure disease progression, and may thus provide important complementary information to a semi-quantitative visual reading of 18F-FDG-PET in clinical practice.
Footnotes
Funding
The author(s) received no financial support for the research, authorship, and/or publication of this article.
Acknowledgements
We thank Rosalie V Kogan for proofreading the manuscript. We thank the Dutch ‘Stichting ParkinsonFonds’ for financial support.
Declaration of conflicting interests
The author(s) declared no potential conflicts of interest with respect to the research, authorship, and/or publication of this article.
Authors’ contributions
SKM designed the study, analysed the data, and drafted the manuscript; MP designed the study, acquired the data, and revised the manuscript critically for important intellectual content; DA designed the study, acquired the data, and revised the manuscript critically for important intellectual content; FDC designed the study and acquired the data; BD designed the study and acquired the data; SM designed the study and acquired the data; GS designed the study and acquired the data; CJ designed the study and acquired the data; KLL supervised interpretation of data and revised the manuscript critically for important intellectual content; FN designed the study, supervised interpretation of data, and revised the manuscript critically for important intellectual content.
References
Supplementary Material
Please find the following supplemental material available below.
For Open Access articles published under a Creative Commons License, all supplemental material carries the same license as the article it is associated with.
For non-Open Access articles published, all supplemental material carries a non-exclusive license, and permission requests for re-use of supplemental material or any part of supplemental material shall be sent directly to the copyright owner as specified in the copyright notice associated with the article.