
Abstract
Lesion volume measurements with magnetic resonance imaging are widely used to assess outcome in rodent models of stroke. In this study, we improved a mathematical framework to correct lesion size for edema which is based on manual delineation of the lesion and hemispheres. Furthermore, a novel MATLAB toolbox to register mouse brain MR images to the Allen brain atlas is presented. Its capability to calculate edema-corrected lesion size was compared to the manual approach. Automated image registration performed equally well in in a mouse middle cerebral artery occlusion model (Pearson r = 0.976, p = 2.265e-11). Information encapsulated in the registration was used to generate maps of edema induced tissue volume changes. These showed discrepancies to simplified tissue models underlying the manual approach. The presented techniques provide biologically more meaningful, voxel-wise biomarkers of vasogenic edema after stroke.
Introduction
Magnetic resonance imaging (MRI) is the method of choice to noninvasively detect ischemic brain tissue damage both in preclinical and clinical research. A severe consequence of focal cerebral ischemia is vasogenic edema, which is caused by breakdown of the blood–brain barrier and influx of water into surrounding tissue. Since free extracellular water increases the tissue T2 relaxation time, lesion volume measurements on T2-weighted (T2w) MR images in the subacute phase when edema peaks around 24–48 h after a stroke 1 has evolved as one of the most important readouts in rodent stroke studies.
One confounder when assessing volumes on T2w images after stroke is that the increase of extracellular water leads to tissue swelling in the ischemic territory and in turn to a compression of tissue outside this territory. As a consequence, brain structures and ventricular spaces change volumes and are dislocated from their original anatomical position, which can most strikingly be seen in a shift of midline. Lesion volume is overestimated since it refers to the volume of the damaged tissue in absence of this space occupying effect. Furthermore, edema itself is an important component in the pathophysiology of stroke and the volume of tissue swelling may be a more specific readout, e.g. when studying interventions to reduce edema. 2
A vast amount of studies investigated various markers to detect the lesion in histology3–9 and how these relate to in vivo imaging data.10–12 Edema correction schemes for histological brain slices have been developed,13–15 one of the most popular approaches dates back to Swanson et al. 16 and measures edema-corrected lesion volume indirectly by subtracting healthy ipsilateral tissue volume from the contralateral hemispheric volume. However, ex vivo correction schemes are generally not applicable to in vivo images since the skull acts as an external barrier and the intracranial pressure is released once the skull is opened to excise the brain for histology.
Lesion volume derived from in vivo imaging data can be corrected by manually delineating the lesion and both hemispheres and assessing tissue compression on the healthy hemisphere, which is assumed to not contain any infarcted tissue.17,18 The correction further relies on the assumption that compression is homogenous across all (ipsi- and contralateral) healthy brain tissue inside the skull, which acts as a stiff barrier. In the following, this approach will be termed “manual lesion volume correction” (MLC). Despite the popularity of this analysis, it relies on certain assumptions that may not necessarily be taken into account when setting up a study. One drawback is that the lesion needs to be restricted to one hemisphere, which is not always the case. For example, larger lesion territories in the photothrombosis (PT) model can cross the midline. Moreover, MLC assumes whole brain coverage by MR images. This imposes challenges on the hardware (large radiofrequency coils) and acquisition (large field of view (FOV) of the pulse sequence). Little attention has previously been paid to this problem including our own studies when experimenters used an FOV covering the lesion but not all compressed tissue outside the lesion. This condition, however, is necessary for a proper correction. The error arising from analyzing partial vs. full brain FOV data has not yet been assessed systematically and an alternative mathematical framework to retrospectively re-analyze small FOV data is missing. Moreover, even if the manual correction is applied to a dataset that includes the entire brain, it does not provide the information on where exactly edema occurs and which anatomical regions are most affected by swelling and compression.
Atlas registration is a powerful technique to assign anatomical labels to MR images, e.g. for automated region of interest analyses or to do spatial group statistics on MRI data from cohorts of subjects. It calculates a 1:1 transformation from an individual to an average MR dataset (or vice versa) that minimizes differences in image intensity or structural features. 19 Image warping allows for nonlinear terms in the transformation and can correct for local deformations of tissue. Spatial group statistics on tissue volume changes encapsulated in these nonlinear terms is a group of techniques termed deformation- or voxel-based morphometry (DBM/VBM).20,21 DBM/VBM are very popular types of MR image analysis, e.g. in the context of atrophy. 22 To our knowledge, they have not been used yet to correct lesion volume changes due to edema in stroke models.
In this study, a novel MATLAB toolbox for nonlinear atlas registration for T2w mouse brain MR images is presented. Its performance in assessing corrected lesion volumes, termed herein atlas registration-based lesion volume correction (ALC), was evaluated by comparison to MLC in a mouse middle cerebral artery occlusion (MCAO) model. Further advantages of atlas registration were tested in three situations, in which MLC fails: (i) non-whole brain coverage of the MRI scan, (ii) the PT model for which the lesion can cross the midline, and (iii) assessment of tissue swelling and compression on a voxel-wise basis.
Materials and methods
Animals
Male stroke C57/BL6 J mice (Janvier, Germany) from a previous stroke study 23 were reanalyzed, retrospectively. Animals were randomly assigned to undergo MCAO, PT, or a sham procedure at the age of 10–12 weeks. One MCAO animal was excluded due to low image quality, one was excluded since no lesion was visible on the MRI, two were excluded since they were scanned with a different MRI protocol leading to final numbers of n = 17 (MCAO), n = 9 (PT), n = 16 (sham). Experimenters were blinded to the condition of the animals. In order to compare ALC and MLC to histology, a separate group of animals underwent MCAO, MRI 24 h after surgery, and was sacrificed directly after the MR scan. One animal was used for testing different histological protocols and excluded from further analysis, leading to a final number of n = 11 in that group. All experiments were approved by the Landesamt für Gesundheit und Soziales (registration number G 0197/12) and conducted in accordance with the German Animal Welfare Act and the ARRIVE guidelines. 24 Mice were housed in a temperature (22 ± 2℃), humidity (55 ± 10%), and light (12/12-h light/dark cycle) controlled environment. All surgeries were performed under 1.5%–2% isoflurane in a 70:30 nitrous oxide:oxygen mixture and core body temperature was maintained at 37 ± 0.2℃ with an automated rectal probe and heat blanket. After surgery, topical application of 1% bupivaccain gel was performed on surgical wounds. Animals were allowed to recover from anesthesia in a warming box set at 30–31℃ before they were transferred back into their home cage.
MCAO
After anesthesia induction, a midline incision was made in the neck, and the left carotid artery was carefully exposed. A filament (190 µm diameter, Doccol, Sharon, MA/USA) was introduced into the common carotid artery (CCA) and carefully advanced to the origin of the left MCA via the internal carotid artery and withdrawn after 45 min. For sham animals, the filament was advanced to the MCA and withdrawn immediately. The CCA as well as the ECA were ligated and remained occluded during reperfusion. 25 A single, experienced surgeon performed MCAO.
PT
PT was modified from Watson et al. 26 After anesthesia induction, mice were placed in a small animal stereotaxic frame (David Kopf Instruments, Tujunga, CA, USA). Then, the mouse was given two 100 µl injections of Rose Bengal (5 mg/ml; Sigma-Aldrich) dissolved in a 0.9% NaCl solution aimed at the left and right intraperitoneal area. A midline skin incision with a scalpel exposed the dorsal part of the skull with bregma and lambda sutures visible. After Lambda and Bregma were at a level, a pencil mark was made at the coordinates Bregma 0.0 mm and medial-lateral extent 1.5 mm. Five minutes after the injections, a cold light source (KL1500, Schott AG, Mainz, Germany) in combination with an aperture (2 × 4 mm) was placed the center of the pencil mark on the skull. The light source was set to maximum intensity and the illumination lasted 15 min. After the hole aperture and light source were removed, the skin was sutured.
MRI measurements
Anesthesia was achieved using 1–2% isoflurane in a 70:30 nitrous oxide:oxygen mixture, and body temperature and respiration rate were monitored with MRI compatible equipment (Small Animal Instruments, Inc., Stony Brook, NY). T2w images were acquired 24 h post stroke surgery on a 7 T MR scanner (Bruker BioSpin, Ettlingen, Germany) and a 20 mm inner diameter transmit/receive volume coil (RAPID Biomedical, Rimpar, Germany). A 2D RARE sequence was used (repetition time/echo spacing/effective echo time = 4.2 s/12 ms/36 ms, RARE factor = 8, slice thickness 0.5 mm, FOV = (25.6 mm) 2 , image matrix = 256 × 196 zerofilled to 256 × 256, 4 averages, 6:43 min). For comparison of ALC and MLC and to assess error for varying the FOV, all MCAO and PT animals were scanned with 32 slices covering the whole brain including olfactory bulb and cerebellum. Since we only recently became aware of the problem of non-whole brain coverage for MLC, sham animals were scanned using our old standard protocol with 20 slices covering mid- and forebrain only. 27 In plane directions are termed x (lateral) and y (ventral-dorsal), whereas slice selection direction z is referring to the caudal-rostral axis.
Histology
Animals were deeply anesthetized using isoflurane, decapitated, and the brain was removed. A metal brain matrix was pre-cooled on ice, the brain was placed in the matrix, cooled down, and cut in 1 mm thick slices using a razor blade. Slices were incubated in freshly prepared 2% 2,3,5 Triphenyltetrazolium Chloride (TTC, T8877 Sigma-Aldrich, St Louis, USA) in PBS for 30 min, washed for 10 min in PBS, mounted on slides, and 1200 dpi 24-bit RGB color images were acquired using a scanner (Perfection V850 Pro, Epson, Suwa, Japan).
Data analysis
MLC
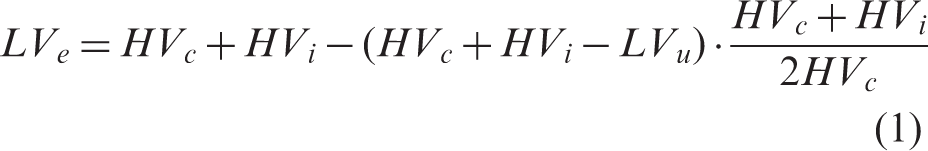
The lesion and both hemispheres were manually delineated by an experienced researcher using ANALYZE 5.0 software (AnalyzeDirect, Overland Park, KS, USA) and masks of same dimensionality as the T2w image were exported in NIFTI format and further processed in MATLAB (version 2011b, MathWorks, Natick, USA). The edema-corrected lesion volume
Histological determination of edema-corrected lesion volume
The lesion and both hemispheres were manually delineated in ImageJ (https://imagej.nih.gov/ij/) on each TTC stained slice by an independent experienced researcher blinded to the MRI experiments and analysis.

Atlas registration
Atlas registration was performed in ANTX, a custom MATLAB toolbox which was developed in-house and includes functions generously provided by the Medical Physics department of the University of Freiburg.28,29 The procedure is described in detail in Supplementary Figure S2. Briefly, tissue probability maps (TPMs) from the SPM8 (Welcome Department of Imaging Neuroscience, London, UK) toolbox SPMMouse30,31 (http://www.spmmouse.org/) were transformed to the Allen mouse brain atlas using SPM8's unified segmentation and warping approach 32 which transformed the SPMMouse framework into the coordinate system of Allen atlas, termed herein “Allen space”. Coordinate system of individual mice will be termed “native space”. T2w images in native space were segmented with the modified SPMMouse into tissue compartment maps of gray matter, white matter, and cerebrospinal fluid (GM, WM, CSF). Two synthetic images with artificial contrasts were than generated from (i) individual T2w-based TPMs in native space and (ii) TPMs in Allen space. To deal with lesion-based high-intensity, the native space artificial image intensity was downscaled inside lesion territory. Finally, ELASTIX33,34 (http://elastix.isi.uu.nl/) was used to bring the artificial image from native space to Allen space using a 12-parameter affine transformation followed by nonlinear image warping (details provided in Supplementary Figure S2 and Supplementary Table 1). The found transformation was used to bring any other native space images and masks of interest to Allen space and the inverse was used to bring Allen atlas labels into native space. The toolbox can be downloaded at https://github.com/philippboehmsturm/antx. Histological data and all relevant images before and after registration are publicly available at http://doi.org/10.5281/zenodo.742264. 35
Evaluating the accuracy of atlas registration
Atlas registration was qualitatively evaluated by transparent overlay of the color-coded atlas on grayscale T2w images using MRIcron (http://www.mricro.com). To assess the performance of nonlinear terms in the registration, manually delineated hemisphere masks were transformed into Allen space. The capacity to compensate the edema induced midline shift was assessed by comparing the hemispheric brain asymmetry (

Atlas registration-based lesion volume correction
Manually delineated lesion masks were transformed to Allen space using the transformation function from T2w images and their volume was calculated in Allen space. To correct for possible global volume differences of brains within our group of mice and the average brain underlying the Allen atlas, we generated brain masks in native space using 3D-PCNN, an automatic brain extraction tool optimized for T2w images. 36 For each mouse, a volume correction factor was calculated by dividing the volume of the transformed brain mask in Allen space (using the transformation function from the T2w image) with the volume of the brain mask in native mouse space. We validated this approach within our MCAO group using manually delineated brain masks and observed no statistical differences regarding the volume correction factor derived from automatically generated brain masks and brain masks generated by an experienced researcher (T(16) = −1.089, p = 0.292). This analysis indeed revealed that, on average, the Allen brain template was (11.19 ± 6.15)% larger than brains of our mice.
Assessing error of MLC for small FOV
To assess the error of MLC for smaller FOVs that do not cover the whole brain, we simulated various FOVz in the z (caudal-rostral) direction by artificially removing slices from the original full brain image stack. Substacks were iteratively generated from the T2w images, hemispheric masks and lesion masks in the following way. The first substack contained only one slice through the center of the lesion (median of lesion volume). The second, third, etc. substacks were generated by subsequently adding neighboring slices alternating in the +z –z direction. When the added slice did not cover brain tissue, e.g. in –z direction, this slice was skipped, i.e. a slice in the +z direction was added and the skipped slices were added in the end. The procedure was repeated until the original number of slices (32) was reached. For each substack (32 image substacks, FOVz = 0.5 mm to 16 mm), equation (1) was used to calculate edema-corrected lesion volume. To express FOVz in units of the lesion size (in %), it was divided by extent of the lesion in z direction under full FOV. This process was performed for each animal.
Voxel-wise mapping of tissue swelling and compression
Since a nonlinear image warping was used, the deformation field contained nontrivial information on morphometric changes between groups. Here, we used the determinant of the Jacobian matrix
Results
Accuracy of nonlinear atlas registration in presence of edema
For qualitative evaluation of atlas registration performance, Figure 1 shows a T2w image of a mouse before (native space) and after (Allen space) registration with a pronounced infarction and midline shift, Allen atlas overlaid transparently in color. After registration, the brain is more symmetric and the outlines of the brain match well, so do the white matter structures.
Transformation into Allen space. Coronal T2w image of a mouse 24 h after MCAO with a large infarct on the left hemisphere (a), overlaid lesion mask (b, blue) and hemispheric masks in native space (c, dark and light red). After nonlinear transformation into Allen space, the ipsilateral hemispheric swelling is reduced (e) while preserving the shape but not the size of the lesion (d). Based on the Allen atlas, anatomical labeling of mouse data becomes feasible in Allen space (f). Numbers on top of images in Allen space represent distance to Bregma in mm.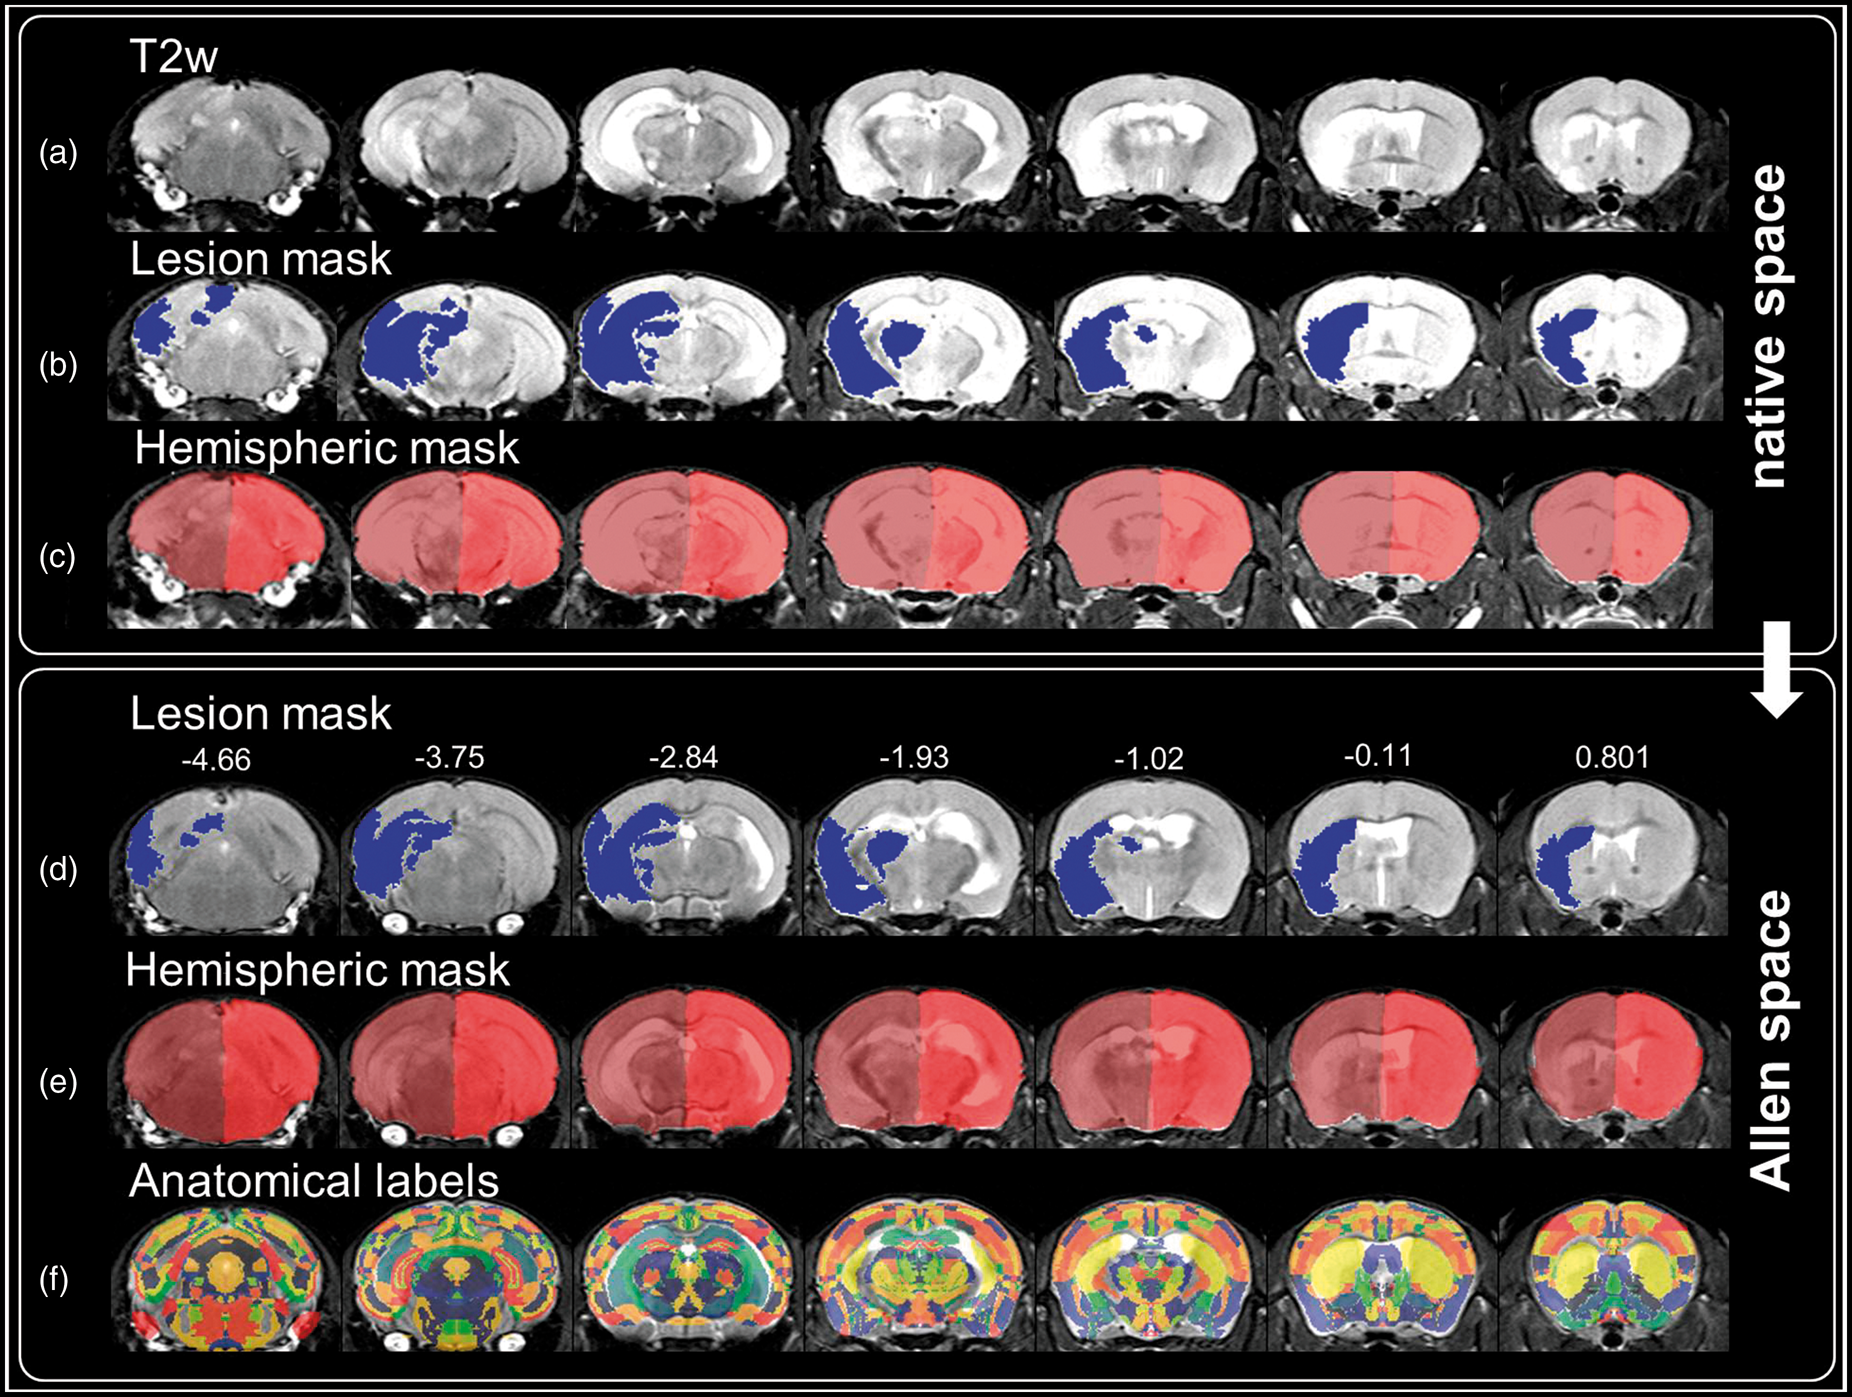
Quantitative comparison of atlas registration-based edema correction with manual correction
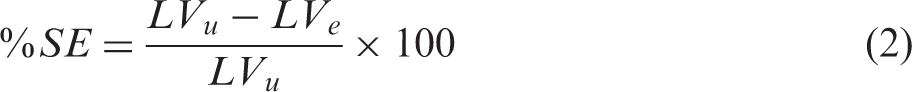
A comparison of ALC and MLC was carried out in MCAO animals undergoing a full brain MRI scan. The space occupying effect in percent of the original lesion volume when applying MLC was %SE = 30.06% ± 14.09% (mean ± SD). ALC also significantly reduced lesion size by %SE = 27.67 ± 6.79% (mean ± SD, T(16) = −16.78, p = 1.405e-11). After correcting for edema by subtracting the space occupying effect with each method, no statistical differences in lesion size were found between MLC and ALC (T(16) = −0.79, p = 0.44) and final lesion volumes correlated well (Pearson r = 0.976, p = 2.265e-11, Figure 2). Furthermore, edema-related hemispheric asymmetry was significantly reduced by ALC from 3.74 ± 3.38% (mean ± SD) to below 1% (0.65 ± 0.74% mean ± SD, T(16) = −4.392, p = 4.539e-04).
Comparison of atlas registration based (ALC) and manual lesion volume correction (MLC). Left panel: ALC and MLC show strong correlation (r = 0.976, p = 2.265e-11) of corrected lesion volumes. Regression angle of 48.7° indicates that lesion volume is slightly more reduced by MLC compared to ALC. Gray dots denote lesion volumes of individual mice (n = 17). Black line and adjacent dashed lines show regression line and 95% confidence intervals, respectively. Middle panel: MLC and ALC significantly reduced the lesion size compared to the uncorrected lesion volumes in all mice and no statistical difference in the degree of lesion correction was found between the two approaches. Right panel: ALC reduced hemispheric asymmetry to below 1%.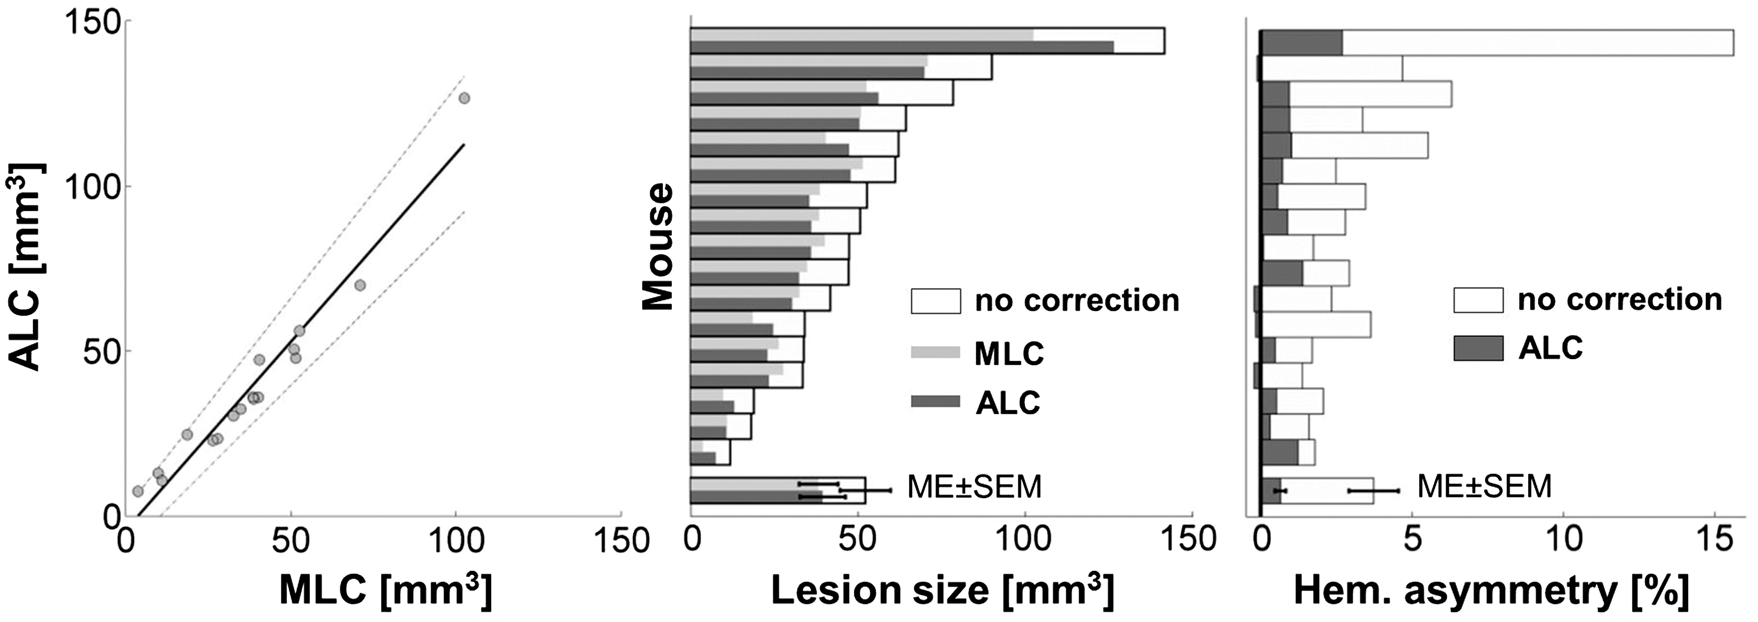
Comparison to histology
A second group of mice (n = 11) underwent the before mentioned MCAO protocol and MRI measurements. In order to compare ALC and MLC to a gold standard, this group of mice additionally underwent histological analysis using TTC staining. The lesion and both hemispheres were delineated on images of stained brain slices. From these, infarct volume and the space occupying effect were calculated using an ex vivo edema correction scheme. 16
The space occupying effect in percent of the original lesion volume was %SE = 18.84% ± 19.26% (mean ± SD) for TTC, %SE = 28.95% ± 13.91% (mean ± SD) for MLC and %SE = 30.34% ± 5.46% (mean ± SD) for ALC. For MLC and ALC, these results are comparable with the group of MCAO animals in which no histological information was available. Correlation of %SE derived from histology was higher to ALC (Pearson r = 0.697, p = 0.012) than for MLC (Pearson r = 0.495, p = 0.098).
Figure 3 shows that the edema-corrected lesion volumes were highly correlated with those derived from TTC staining (MLC: Pearson r = 0.835, p = 7.218e-04; ALC: r = 0.825, p = 9.61e-04) though lesions on TTC-stained sections were systematically larger. In line with the previous results in the MCAO group for which no histology was available, MLC and ALC showed a tight relationship regarding the corrected lesion volumes (Pearson r = 0.994, p = 6.405e-11).
Correlation analysis of edema-corrected lesion volumes obtained via MLC and ALC to those obtained from TTC stained brain sections in a separate group of MCAO animals. Left panel: Representative TTC stained brain slice with MCAO-induced ischemic tissue and corresponding coronal slice of the same mouse in native space and after transformation into Allen space (top to bottom). Ischemic brain tissue appears white to light-red after TTC incubation due to diminished enzymatic dehydrogenases to 1,3,5-triphenylformazan, compared to the intact tissue (saturated red color). Right panel: Corrected lesion volumes obtained from MRI-based MLC and ALC methods correlate positively and equally well with those obtained from histology. Note, however, that TTC-based lesion volumes were systematically higher than those derived from T2w MR images as indicated by a regression angle of 33.6° for MLC and 30.5° for ALC.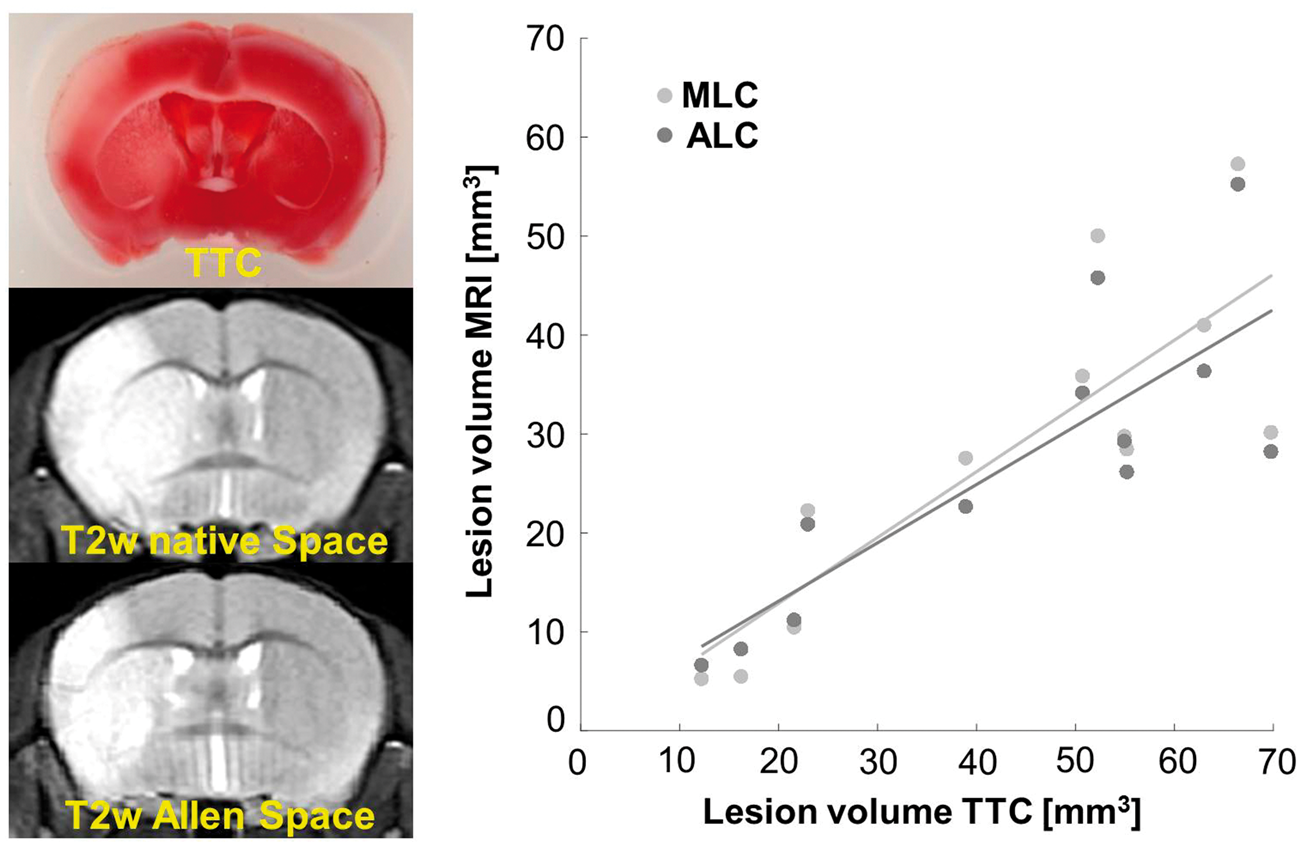
Error of manual edema correction using non-whole brain coverage by the MRI scan
MLC in its original form strongly depends on the volume of healthy tissue that is assumed to be compressed, which in turn makes it susceptible to errors when not covering all brain tissue within the stiff boundaries of the skull by the MRI scan. We therefore assessed the error of values produced by equation (1) when using non-whole brain coverage compared to full brain coverage. For this, we used MRI scans with 32 slices (FOV = 16 mm). This was sufficient for full brain coverage, including the olfactory bulbs and cerebellum, since the size of brains in the rostral caudal direction was (13.62 ± 0.49) mm (mean ± SD) in our cohort as measured on manually delineated whole brain masks. Figure 4 shows MLC lesion size calculations applied to artificially generated subsets of slices of the original MR scan with increasing number of slices added starting from the center of the lesion. FOVz is expressed either in mm in rostral-caudal direction (Figure 4, left panel) or in percent of the true lesion size when FOVz covers the whole brain (FOV = 16 mm, Figure 4, right panel). As expected, the lesion volume was underestimated when FOVz did not cover the whole lesion (FOVz < 4 mm), which is the trivial case. Expressed in percent of the lesion volume using all slices (whole brain coverage), this underestimation of LVe is evident for FOVz below 70% of the lesion volume. Less intuitively, we found an overestimation of lesion size of 17.87 ± 20.01% (mean ± SD) when the lesion was fully covered but compressed healthy tissue outside the lesion territory was omitted. This overestimation was significant for a large range of FOVz = 4.5–13.5 mm, equivalent to FOVz = 70–190% of the lesion size.
FOV-dependence of manual lesion correction. The left panel depicts the relationship between FOVz in z-direction (rostral-caudal) and lesion size (LVe) calculated with equation (1). LVe is given for each FOVz in percent relative to the standard of reference using whole brain coverage. A scan with FOVz = 16 mm equivalent to 32 slices covered the whole brain for all mice in our cohort (black arrow). Dots represent LVe for a single mouse for each FOVz, black line and bars depict mean ± SEM. The right panel additionally expresses FOVz in percent of the lesion size in z for each mouse before calculation of mean ± SEM. Note that, as expected, LVe is underestimated (LVe < 100%) when FOVz is smaller than the lesion volume. More importantly, when FOVz fully covers the lesion but omits compressed tissue outside the lesion territory LVe is overestimated by up to 18% (statistically significant overestimation for FOVz 4.5–13.5 mm range, equivalent to FOVz 70–190% of the lesion size, right panel). For our study an FOVz of at least 14 mm (∼twice the lesion size, right panel) was necessary to statistically reject LVe overestimation (shaded area).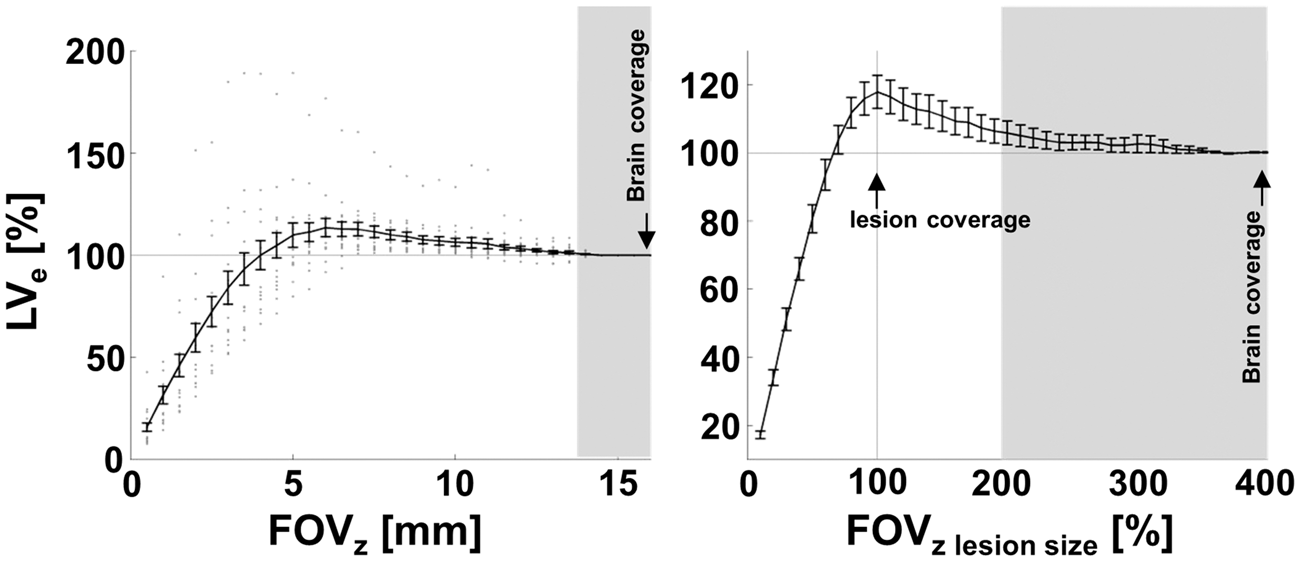
Atlas registration-based edema correction using non-whole brain coverage by the MRI scan
Registration was repeated for the same data using fewer slices (20 slices) covering most of the brain but excluding cerebellum and olfactory bulbs. This value was chosen since it corresponds to standard MRI scans previously used in our own lab and widely used in the literature to assess lesion volume (see systematic review in the discussion). Using results of Figure 4 (20 slices correspond to FOVz = 10 mm), this would lead to a significant overestimation of lesion size by 6.24 ± 8.05% (mean ± SD), compared to full brain FOV (T(16) = 3.20, p = 5.61e-3). To assess whether ALC could be used to edema correct the data despite partial brain coverage, we therefore compared lesion volume and hemispheric asymmetry for ALC using 20 vs. 32 slices. For volumes of 20 slices, ALC significantly reduced lesion volume by 27.83 ± 8.86% mean ± SD (T(16) = −12.954, p = −6.733e-10). Importantly, in contrast to MLC, no difference in lesion reduction was observed for ALC with 32 and 20 slices (T(16) = 0.256, p = 0.801). Similarly, initial stroke-related hemispheric asymmetry of 3.75 ± 3.38% (mean ± SD) was significantly reduced (T(16) = −4.434, p = 4.167e-04) to below 1% (0.56 ± 0.74% mean ± SD) when using ALC with 20 slices and the reduction was similar for ALC with 20 and 32 slices (T(16) = −0.978, p = 0.343).
Atlas registration-based edema correction in the PT stroke model
Figure 5 shows an animal with a large PT lesion overlapping the midline into the contralateral hemisphere. Since MLC depends on manual delineation of the hemispheres and strongly relies on the assumption that the contralateral hemisphere remains unaffected, the manual approach would not have been possible in all PT animals. In the PT mice (n = 9), ALC significantly reduced lesion sizes by %SE = 18.43 ± 6.62% (mean ± SD) compared to the original lesion size (T(8) = −9.27, p = 1.486e-05).
PT lesion before and after transformation into Allen space. Coronal slices of a mouse with PT lesion crossing the midline (panel 1, focal white area), i.e. for which the manual lesion volume correction cannot be applied. Overlaid lesion mask shown in native space (panel 2, blue). After nonlinear transformation into Allen space the lesion-induced swelling is reduced (panel 3 and 4) and hemispheres are more symmetric. Numbers above images in Allen space denote distance to Bregma (mm).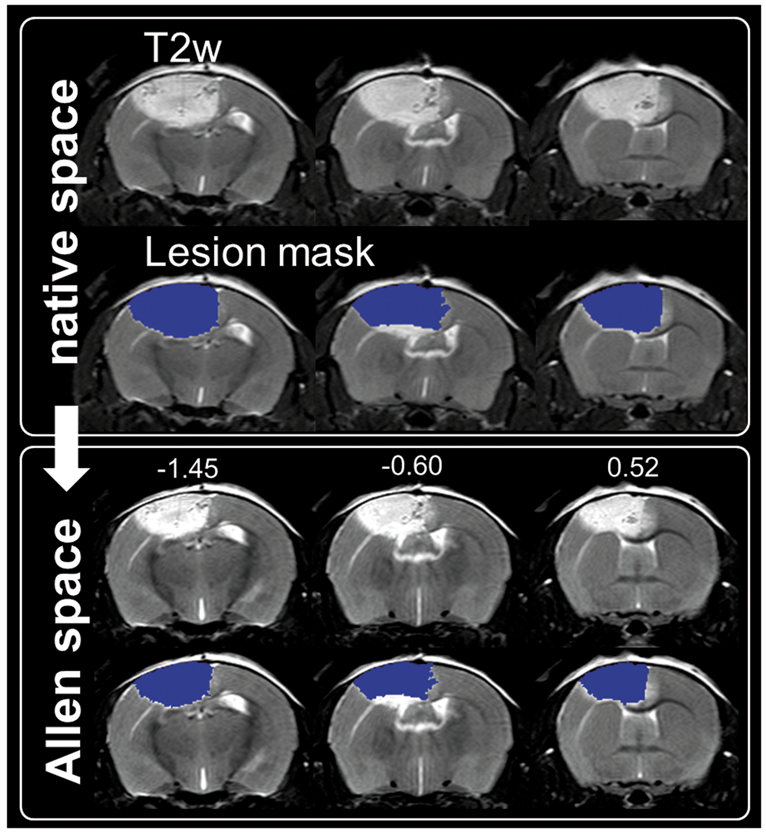
Local mapping of edema induced tissue volume changes
The determinants of the Jacobians of the transformation were compared to sham animals in Allen space and yielded maps of local tissue volume changes for MCAO animals (Figure 6) and PT animals (Supplementary Figure S3). Tissue swelling was most prominent in the center of the lesion territory. For MCAO animals, most prominent compression was found in the ipsilateral ventricle. Tissue compression was most pronounced in a halo of a few mm around the lesion territory, i.e. less pronounced far away from the lesion. Local volume expansion inside the lesion and volume compression (ventricle) were statistically confirmed by voxel-wise two-sample t-statistics for the clusters of contrasts MCAO lesion territory and local tissue swelling and compression. Incidence maps depict the lesion territory across MCAO mice after transformation into Allen space (panel 1). Color code refers to the number of animals with a lesion in the corresponding voxel. Numbers above slices denote the distance to the Bregma (mm). Panel 2 depicts the voxel-wise mean edema induced volume changes across MCAO mice. While voxels in green represent local volume preservation, voxels in blue and red represent a local volume compression and volume expansion, respectively. Voxel-wise t-statistics over maps of MCAO and sham mice (panel 3) confirmed non-homogeneous volume changes and identified with high spatial correspondence tissue swelling in the region of the lesion (red) and tissue compression in the left lateral ventricle (blue).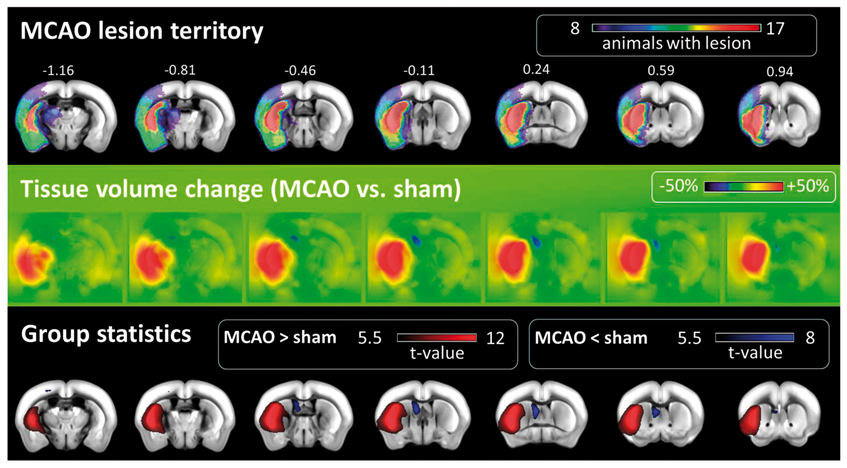
Discussion
While edema correction is routinely used for histological studies, the necessity to correct MRI lesion sizes for edema is still matter of debate with a majority of rodent stroke MRI studies using no correction, reviewed by Milidonis et al. 37 In agreement with a previous study in rats undergoing permanent MCAO, 18 we found that ∼30% of MRI lesion volume in this model could be attributed to the space occupying effect suggesting that the error would be large when neglecting a correction. No correction may be legitimate when looking at a single time point after stroke and comparing different groups of animals since larger strokes will generate a larger edema and larger space-occupying effect. Probably in many cases the two effects (ischemic damage and space occupying effect) are in tight relation, i.e. the space occupying effect would represent a constant, systematic overestimation. Indeed, in our experimental setting, the standard deviation of corrected lesion size in percent of the original lesion size was small (<10%) despite a large range of absolute lesion sizes indicating we could have replaced our correction schemes by simply subtracting 30% from the uncorrected lesion size in MCAO animals 24 h post stroke. This number would change, however, when using a different time point, model, strain, or species. Supportive of this statement, we found a less pronounced space occupying effect (∼20%) in PT animals. More importantly, such simplified correction would not be applicable when studying an intervention that specifically impacts edema or intracranial pressure, e.g. using osmotherapeutics, hyperventilation, tromethamine, hypothermia, or barbiturate coma. 2 Such intervention could change the space occupying effect while the anatomical lesion size corrected for edema remaining constant.
Our theory and data have two very practical consequences for choosing the correct MRI protocol and analysis. First, the most widely used edema correction scheme developed by Swanson et al. 16 for post mortem data is not applicable to in vivo imaging since opening of the skull leads to a decompression and subsequent nontrivial volume change of healthy tissue. MLC should be used instead. Second, when using MLC, whole brain imaging is a prerequisite when assessing absolute lesion volumes or the space occupying effect. In the theory provided in the Supplementary Information, we show that this can be circumvented when edema-corrected lesion sizes are only needed in relative units of a brain region, e.g. mid-plus forebrain. Our according modification of the theory presents a way to correctly reanalyze data acquired with non-whole brain coverage by the MRI scan. In the original MLC work of Loubinoux et al., 17 a slice-wise correction was performed, which completely neglected swelling and compression in the third (rostral-caudal) dimension. The follow-up work by Gerriets et al. 18 also did not use a whole brain MRI scan. We systematically reviewed all Pubmed listed original research studies citing these two original papers. Twenty studies made use of the manual correction in mouse, rat, or canine MRI. 4/20 falsely applied formulas for histological edema assessment to MRI data. For the remaining, only 3/16 (3 unclear) reported full brain coverage (see Supplementary Table 2).
Atlas registration can replace approaches based on manual delineation with similar performance in correcting for edema while being more robust to changes in FOV. Currently, our atlas registration pipeline only needs a manually delineated lesion mask and is thus less user-biased. Inclusion of an automated lesion detection was beyond the scope of the study but it would represent the last step in a fully user-independent data analysis. We have introduced several novelties in our atlas registration. First, SPMMouse was transformed to the original Allen mouse brain atlas space, which represents a much more widely used coordinate system. Second, we did not use the atlas registration provided by SPMMouse but rather used the tissue segmentation to generate a synthetic image which was then transformed using the ELASTIX toolbox. The rationale for using ELASTIX was due to the better image registration performance regarding T2w images from mice with large lesion territories and PT-related surgery wounds. One drawback of nonlinear image warping is that it introduces a large number of parameters that can influence the result of the registration and that possibly need to be optimized for each study. Interestingly, we were able to use the same settings (see Supplementary Table 1) in two very different stroke models. Differences in signal to noise ratio and gray matter to white matter ratio could potentially influence registration result but no major deviations between groups and the atlas were found (Supplementary Table 3). Another limitation originating from the complex algorithms underlying tissue segmentation and image warping is that several factors can influence the quality of the atlas registration in a manner that is hard to predict. In our case, varying image intensity in the lesion or morphological differences between our cohort of animals and the atlas could have led to systematic errors. Indeed, the Allen atlas brain volume was substantially larger than in our cohort. Since we used the same strain and age of animals, we attributed this to differences between animal suppliers and artefacts originating from the histological preparation of tissue for the Allen atlas. Another problem is the lack of an independent, automated measure of the goodness of the transformation based on the original and atlas images. 38 From this point of view, the good correlation between ALC and MLC is an indicator that the registration performed well. Qualitative inspection and reduction of hemispheric asymmetry supported this. In analogy to a previous study in rats, 18 using post mortem TTC staining we could validate our in vivo imaging results on the level of two compartments: lesion and healthy tissue. However, a voxel-wise validation of edema and tissue damage using histology remains difficult since removal of the stiff boundary of the skull for tissue preparation strongly changes local tissue expansion/compression and fixation techniques can lead to tissue shrinkage. In contrast to the rat study, lesion territory was systematically larger on TTC stain in our setting. We attribute this to user-bias since MRI and histology analyses were performed manually by two independent, blinded researchers. Semi-quantitative approaches, e.g. using thresholds based on signal comparison to the contralateral hemisphere 39 could help to reduce user interaction.
For the first time, we show voxel-wise maps of edema and tissue compression after stroke in the mouse. This adds an important, quantitative readout which can not only be used to assess pathology but also the relation between mechanical stress due to swelling and tissue response. Combination with other methods that assess mechanical properties of tissue, e.g. MR elastography, could be used to develop better tissue models. 40 Our results challenge the simplified model underlying MLC that assumes tissue expansion inside and constant tissue compression outside the lesion17,18 although a final conclusion is not possible in the present study due to lack of histological methods to assess deformations voxel-wise ex vivo. In our MCAO cohort, tissue compression was strongest in healthy tissue close to the lesion and in the lateral ventricle and less pronounced far away from the lesion. Tissue expansion was strongest in the core of the lesion with a smooth transition to a halo of surrounding compressed healthy tissue. In order to discriminate the lesion from healthy tissue, the physiologically more meaningful tissue volume change map itself could replace T2w images. Last but not least, tissue compression due to increased intracranial pressure is a life-threatening consequence of edema and tissue compression is generally neglected in explaining functional outcome in rodent stroke. In future studies, it would thus be interesting to test the hypothesis if, especially in large strokes, tissue compression values in relevant structures outside the lesion such as brain stem could serve as a new biomarker that explains outcome and sickness behavior.
Conclusions
Atlas registration provides a robust way to correct lesion sizes for the space occupying effect in mouse stroke models in the subacute phase. It outperforms time-consuming methods based on manual delineation. Furthermore, it can be used to quantitatively assess tissue swelling and compression voxel-wise, which could in the future be used to generate physiologically more meaningful correlates of stroke pathophysiology.
Footnotes
Funding
The author(s) disclosed receipt of the following financial support for the research, authorship, and/or publication of this article: This work was supported by the Federal Ministry of Education and Research (BMBF) (grant number 01EO0801, Center for Stroke Research Berlin) and Deutsche Forschungsgemeinschaft (DFG) (Excellence Cluster NeuroCure, Excellence Cluster BrainLinks-BrainTools).
Declaration of conflicting interests
The author(s) declared no potential conflicts of interest with respect to the research, authorship, and/or publication of this article.
Authors’ contributions
PBS planned the study. SM, MF, FK, TDF, RB, MD, AR, CH, UD planned and performed the animal experiments. SM, MF, MD, AR and PBS acquired the MRI data. SK, SM, TB and PBS analyzed the MRI data. MF, MD, AR performed and analyzed histological experiments. TB and DvE provided and adapted parts of the MATLAB toolbox. All authors edited the manuscript.
References
Supplementary Material
Please find the following supplemental material available below.
For Open Access articles published under a Creative Commons License, all supplemental material carries the same license as the article it is associated with.
For non-Open Access articles published, all supplemental material carries a non-exclusive license, and permission requests for re-use of supplemental material or any part of supplemental material shall be sent directly to the copyright owner as specified in the copyright notice associated with the article.