
Abstract
Global synchronization across specialized brain networks is a common feature of network models and in-vivo electrical measurements. Although the imaging of specialized brain networks with blood oxygenation sensitive resting state functional magnetic resonance imaging (rsfMRI) has enabled detailed study of regional networks, the study of globally correlated fluctuations with rsfMRI is confounded by spurious contributions to the global signal from systemic physiologic factors and other noise sources. Here we use an alternative rsfMRI method, arterial spin labeled perfusion MRI, to characterize global correlations and their relationship to correlations and anti-correlations between regional networks. Global fluctuations that cannot be explained by systemic factors dominate the fluctuations in cerebral blood flow. Power spectra of these fluctuations are band limited to below 0.05 Hz, similar to prior measurements of regional network fluctuations in the brain. Removal of these global fluctuations prior to measurement of regional networks reduces all regional network fluctuation amplitudes to below the global fluctuation amplitude and changes the strength and sign of inter network correlations. Our findings support large amplitude, globally synchronized activity across networks that require a reassessment of regional network amplitude and correlation measures.
Keywords
Introduction
After early years in which time averaged or stimulated modulation of function were emphasized, neuroimaging research has increasingly recognized that correlated fluctuations of activity are important for studying and understanding normal and pathologic brain function.1,2 Blood oxygenation level dependent (BOLD) functional MRI has been particularly widely used for the observation of correlated fluctuations within imaging defined resting state networks. Despite its success, BOLD does not provide a quantitative measure of brain physiology and it is vulnerable to systematic sources of fluctuations including motion, systemic physiologic changes and experimental instabilities.3–5 We have recently reported results using arterial spin labeling (ASL) perfusion MRI for quantifying modulations of cerebral blood flow (CBF) in resting networks. 6 ASL is less vulnerable to most sources of systematic noise because background suppression7,8 and short timescale subtraction of images with different CBF sensitivity9,10 make it robust to the many factors that modulate the background signal. In addition to correlated fluctuations within resting state networks, we observed a larger, global modulation of the CBF signal. The focus of this current work is a detailed characterization of global fluctuations and their relationship to potential systemic factors and previously reported resting networks.
Demonstration that globally correlated fluctuations were strongly related to blood flow regulation and systemic factors would have important implications for both the methods of functional neuroimaging and the study of cerebrovascular control. For example, global fluctuations are a dominant noise source for both ASL 6 and BOLD11,12 studies. Recognizing the links to systemic factors such as heart rate and blood pressure modulations could lead to better methods for the removal of this noise by gating or post-processing. Accurate removal of nonneural global fluctuations is essential for identifying true negative correlations between regions and resting state networks. 12 Statistical methods for analysis of neuroimaging studies would need to incorporate these very large-scale noise correlations into algorithms for extracting and assessing the significance of changes. On the other hand, observing the interaction between systemic factors and regional CBF could help characterize the complex interactions between local vascular tone and more distant cardiovascular supply.
Alternatively, demonstration that globally correlated fluctuations were largely independent of hemodynamic factors would suggest they represent the largest and strongest correlated metabolic activity in the brain.6,11,13 The implications for neuroscience would be substantial. Global correlations would support particular models of neural network interaction where rising correlations with spatial scale are predicted.14,15 Global metabolic fluctuations would complement global correlations of oscillatory phase 16 as an indicator of large scale interactions between regions. The ability to sensitively measure the fluctuations could be used to study their relationship to vigilance,17–19 attention,20,21 conscious perception 22 and other factors. Accounting for the global network and its modulating effects would be required in the interpretation of smaller and more functionally specific networks. Studying alteration of the global network by external factors23,24 or disease 25 would be merited.
Here we combine time-resolved ASL perfusion imaging in healthy volunteers with simultaneous monitoring of systemic factors previously demonstrated to modulate BOLD5,26–29 or Doppler ultrasound30–32 measures of blood flow to assess the magnitude of their contribution to global CBF fluctuations and determine the characteristics of any remaining, potentially brain activity mediated, correlations.
Materials and methods
In-vivo studies
In this study, 10 healthy volunteers (male/female 5/5, average age 32.8 ± 9.1 and 3 left hand dominant) were imaged on a 3 Tesla EXCITE HDxt MRI scanner (GE Healthcare, Waukesha, WI) using an eight-channel head receive coil and the body transmit coil. All studies followed a protocol compliant with state and federal regulations governing the conduct of human subject research (45 Code of Federal Regulations(CFR) Part 46 and 21 CFR Parts 50 and 56), adhering to the ethical principles set forth in the Belmont Report and approved by the Beth Israel Deaconess Medical Center Committee on Clinical Investigations. Written informed consent was obtained from all subjects.
The protocol began with a three-plane localizer to define the region of interest: a 3D volume from the base of the cerebellum to the top of the head. Anatomic information was acquired by a T1-weighted magnetization prepared rapid gradient echo (MPRAGE) sequence in approximately 4.5 min (120 slices with matrix 256 × 192, slice thickness 1.5 mm, TE min full and TR 25 ms, flip angle 15°, TI 1100 ms, field of view (FOV) 24 cm, receiver bandwidth (BW) ± 31.25 kHz).
Arterial spin labeling (ASL) was performed with pseudo continuous labeling (PCASL), background suppression, and a 3D stack of spiral fast spin echo image acquisition.33,34 PCASL was performed with an average radiofrequency (RF) amplitude of 1.7 uT, an average gradient of 1 mT/m, a repetition rate of 1156 us, and a ratio of the peak to the average gradient of 9. A similar pattern of pulses was performed during periods where no inversion labeling was desired but with the sign of the RF pulses alternated and the average gradient set to zero. This change controls for RF effects while effectively preserving the positive magnetization of inflowing blood. Inversion labeling or control RF pulses were applied at a labeling plane approximately at the base of the cerebellum.
The fairly complicated schedule of the labeling and suppression pulses is detailed in Figure 1. A labeling duration of 2 s and a post-labeling delay of 1.8 s were selected. Background suppression was performed interleaved with the labeling.
34
This interleaving requires switching from inversion to control, or vice versa, after each selective background suppression inversion pulse. Saturation at 3.8 s before imaging and then selective inversion pulses at 3023 ms and non-selective inversions at 1648 ms, 637 ms and 137 ms were optimized to minimize background signal. Spatial saturation inferior to the brain was performed to attenuate inflowing spins at 1785 ms, 1081 ms and 287 ms before the acquisition. A brief vessel suppression sequence was performed just before imaging to limit the maximum vessel velocity to 1 cm/s. All images were acquired as single-shot acquisitions with a FOV of 240 mm, 32, 4 mm slices, and an effective axial in-plane resolution of 5.3 mm.
The schedule of labeling and suppression pulses for the positive labeling ASL preparation. Interleaved labeling and background suppression require changing from control to inversion labeling after the first, selective, background suppression inversion pulse. For the negative labeling image, control and inversion labeling were switched.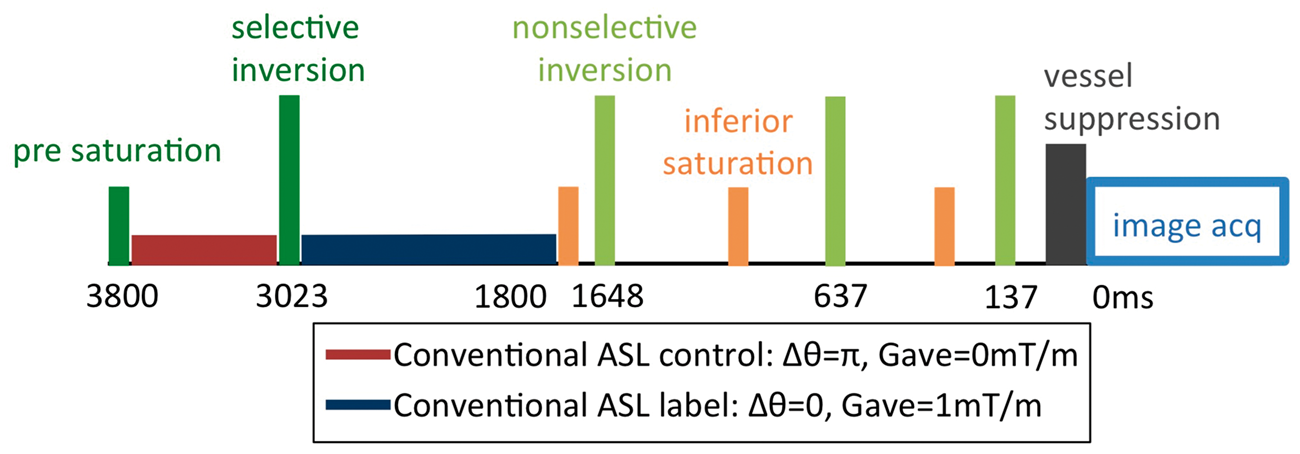
Our acquisition with background suppression alters the conventional interpretation of ASL blood flow sensitivity. Usually, ASL MRI is conceptualized as the difference in brain signal between a blood flow sensitive image after magnetic labeling of arterial blood water, where PCASL labeling inverts the inflowing blood, and a control image, where inflowing blood is not inverted and blood flow sensitivity is minimized. However, the interpretation of the two images becomes more complicated when RF pulses are also applied to the tissue, as in background suppression.
Background suppression pulses applied to the tissue modulate the tissue magnetization and consequently alter the blood flow sensitivity of both ‘control’ and ‘label’ images. In general, ASL blood flow sensitivity is achieved when the inflowing magnetization of blood is different than the magnetization of tissue. With background suppression, both ‘control’ and ‘label’ images include blood flow contrast and they are sensitive to blood flow at a level determined by the timing of the background suppression pulses. For our background suppression timing, physical simulations indicate the sensitivity of the two images to flow fluctuations was nearly equal in magnitude (a ratio of positive to negative labeling sensitivity of 0.99) but opposite in sign. This equivalence is largely a result of the high level of background suppression, because the tissue magnetization is maintained near zero during the labeling period. Further complicating the terminology is that interleaved labeling and background suppression required alternating between labeling and control PCASL during the preparation of each image. 34 Accordingly, in this paper, we have replaced the standard “label” and “control” terminology with “positive labeling” and “negative labeling” based on the sign of blood flow sensitivity for the two images(Figure 1).
Although alternating acquisition of positive and negative labeled images is typically performed even in resting state ASL studies, acquisition of just one image can increase the temporal resolution and simplify the interpretation of the image time series. Alternating acquisition can remove contamination from blood oxygenation sensitivity by shifting flow fluctuations to higher frequency. However, our high level of background suppression and the use of spin echo images effectively eliminate sensitivity to blood oxygenation and other forms of contrast so this alternation was unnecessary. Since simulations suggested that both positive and labeling schemes produce nearly identical perfusion effects just with opposite sign, we elected to acquire them separately for comparison.
After a quick 25 s ASL scan to confirm image quality, an acquisition was performed to measure average baseline blood flow. Baseline ASL was acquired with 20 repetitions in approximately 3.5 min. For this scan, positive and negative labeling was acquired in a temporally interleaved fashion to enable absolute blood flow quantification. Next, resting state fluctuation acquisitions were performed. For these acquisitions, just one of the labeling configurations (positive or negative) was repeated every 5 s for 230 repetitions over 19.2 min. First one labeling was used and then a second acquisition with the other labeling configuration was acquired. The order of positive and negative labeling was randomized across volunteers.
During resting state scans, volunteers were instructed to keep eyes closed and try not to fall into sleep. Cardiac cycle and respiratory cycle were measured by pulse oximeter and respiratory bellows and data were automatically stored to synchronized data files.
Image analysis
Image reconstruction and normalization
All images were reconstructed offline by customized software implemented in IDL (Harris Geospatial Solutions, Broomfield, CO). Images were reconstructed by a standard gridding algorithm in-plane and interpolated to a matrix of 128 × 128. Baseline perfusion images were reconstructed by subtraction between positive and negative labeling pairs. The phase information of the baseline images was used to combine multiple coil images from the positive labeling and negative labeling resting state scans.
The reconstructed images were converted into 4D NIfTI format by a customized program in MATLAB 2015a (The MathWorks Inc., Natick, MA, USA). Resting state images were normalized to standard space by the statistical parametric mapping brain imaging analysis software (SPM12, Wellcome Trust Centre for Neuroimaging). First, resting state images were aligned in the temporal domain to correct rigid brain motion. The first frame was removed because of transient instabilities. Second, images of positive labeling were registered with images for negative labeling, to remove the motion between scans. Then, the gray matter map segmented from T1-weighted images and baseline ASL images were registered with the subtraction of averaged positive and negative labeling images. Finally, the registered gray matter map was used to calculate the transformation, which normalized all images to the standard Montreal Neurological Institute (MNI) space.
Global signal extraction and characterization
The global signal was calculated as the mean image signal within a spatial brain mask, which was obtained from the probability map used in normalization of SPM12. This global signal was calculated independently for each acquired image, producing a time series with 5 s temporal resolution for each resting state acquisition. The resulting signal was then divided by half the difference between the baseline ASL (difference between positive and negative labeling) scans to normalize to resting blood flow. The standard deviation (SD) of this normalized signal was used as a measure of correlated global fluctuations. The amplitudes of the fluctuations measured with positive and negative labeling were tested for significant differences by paired t-test across subjects.
A second measure of fluctuations was also calculated. Analogous to the ALFF measure of BOLD, this measure first calculated the SD in each voxel and then averaged the SD across the whole brain mask. 35 This mean standard deviation (mSD) value was also normalized by the baseline perfusion signal.
Physiological signals were extracted from the raw physiologic data as follows. The cardiac phase was calculated using spline interpolation between the neighboring peaks of the pulse oximeter signal. The durations between neighbor peaks were used to calculate the cardiac rate, based on what the cardiac rate at the imaging time was obtained by spline interpolation. The respiratory phase was calculated from respiratory bellows data in a similar way to cardiac phase. The respiratory volume per unit time was calculated following the methods of Birn et al.3,36
To measure the association between physiological signals and the resting state signal, the global resting state signal was fit to systemic physiological fluctuations by a second order Fourier expansion. The delay between physiological signal and global resting state signal was varied from 0 to 15 s with a step size of 50 ms for each physiological signal of each subject. The optimal delay was chosen as the delay time with the largest correlation coefficient magnitude. All the pixels of the brain were assumed to have the same delay. The physiological signals were individually regressed out from resting state images by extracting the amplitudes of voxel-wise signal with the same temporal response as the physiological signal. The resulting regression coefficients were used as estimates of the association between the global signal and the systemic physiologic factors. Versions of the global signal with each and all the physiologic contributions removed were calculated and the resulting SD tabulated.
Spectral analysis was used to further characterize the contributions to global fluctuations. After linear detrending, the global signal of each subject was Fourier transformed and squared to calculate a power spectrum. The mean power spectrum was averaged across subjects to show the contribution of each physiological signal.
To assess the spatial contribution of the global signal, the amplitudes of the global signal and pixel-wise signal with the same temporal response were determined before and after removing the physiological signal. The inner product between the two time series was used to determine the contribution. The resulting contribution maps were divided by the SD of the global signal. A mean baseline blood flow map was calculated for comparison. The blood flow maps for each subject were divided by the mean global blood flow level and then averaged across subjects. The ratio between these two maps was also calculated.
Global fluctuations and brain networks
To assess the effect of the global signal on inferred brain networks, we performed independent component analysis (ICA http://cnl.salk.edu/∼tony/ica.html) on resting state images after regressing out the component of signals associated with systemic physiologic factors. Images of positive and negative labeling were combined together, which increased the temporal dimension and, therefore, improved the accuracy of ICA. Resting state images were spatially undersampled by a factor of 2 to speed up the ICA. Since images were interpolated in the reconstruction, this process did not degrade image resolution. Fifteen independent networks were extracted from the image time series without global signal removal. Ten standard networks were identified by visual comparison of the component spatial distributions with prior work using BOLD. Binary masks for each of the brain networks were obtained by thresholding the IC spatial maps with a constant value. These masks were used to quantify the amplitude of the temporal fluctuation of the mean signal in each brain network with and without global signal removal. Pearson correlations among recognized networks were assessed on data from the two labeling configurations both with and without global signal removal.
Results
Whole brain average (global) CBF measured at 5 s intervals in 10 volunteers demonstrated considerable temporal variability. Images obtained with positive labeling and negative labeling demonstrated very similar fluctuations. Fractional SD of global average blood flow was 12.71% (across subject SD 6.56%) for positive labeling and 12.85% (across subject SD 6.60%) for negative labeling (p = 0.90). This level exceeds the blood flow fluctuation levels previously reported for individual resting state networks. 6 No significant gender differences in fractional SD were observed. We next examined the relationship between these fluctuations and physiologic measures of systemic cardiac and respiratory phenomena.
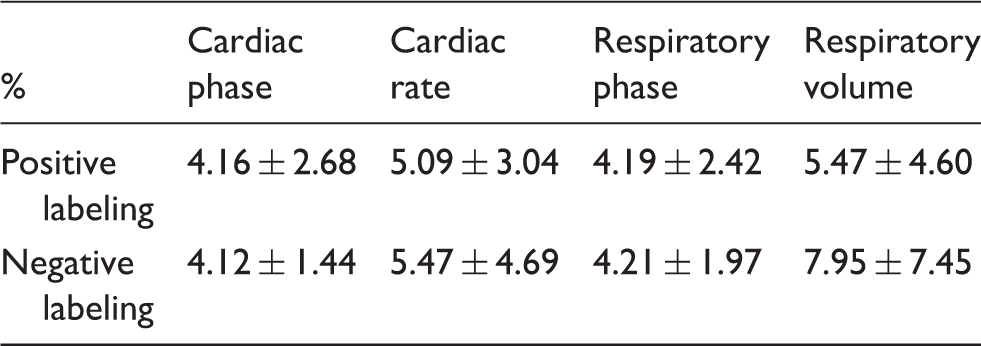
Global blood flow fluctuations showed little association with cardiac and respiratory variables, Figure 2 and Table 1. In addition to simple cardiac and respiratory cycle associations, we examined the relationship between global blood flow and cardiac rate and respiratory volume measures previously studied3,5 as indicators of systemic blood flow control and correlates of functional brain imaging fluctuations.4,5,37 The greatest association was observed for respiratory volume fluctuations, but this effect accounted for no more than 7% of the global flow noise power. Increasingly lower levels of association were observed for cardiac rate, cardiac phase, and respiratory phase. Removal of all these components decreased the global blood flow fluctuations by a very small factor to 11.62 ± 5.78% for positive labeling and 11.67 ± 5.90% for negative labeling (p = 0.96). Much of this reduction represents just the reduced degrees of freedom after the fitting, so the contribution of random noise removal to the global fluctuation reduction could be substantial. It should be noted that more substantial cardiac cycle associated variability was observed in a pilot study
38
when dephasing gradients to attenuate arterial blood signal were not applied. The elimination with dephasing gradients argues that this association represented arterial velocity and blood volume effects that are not reflective of capillary level blood supply.
Absence of major association between global blood flow and cardiac phase, cardiac rate, respiratory phase and respiratory volume. Blood flow data acquired with negative labeling is shown. Similar results from positive labeling are not shown. Contribution of physiological signal to global fluctuation.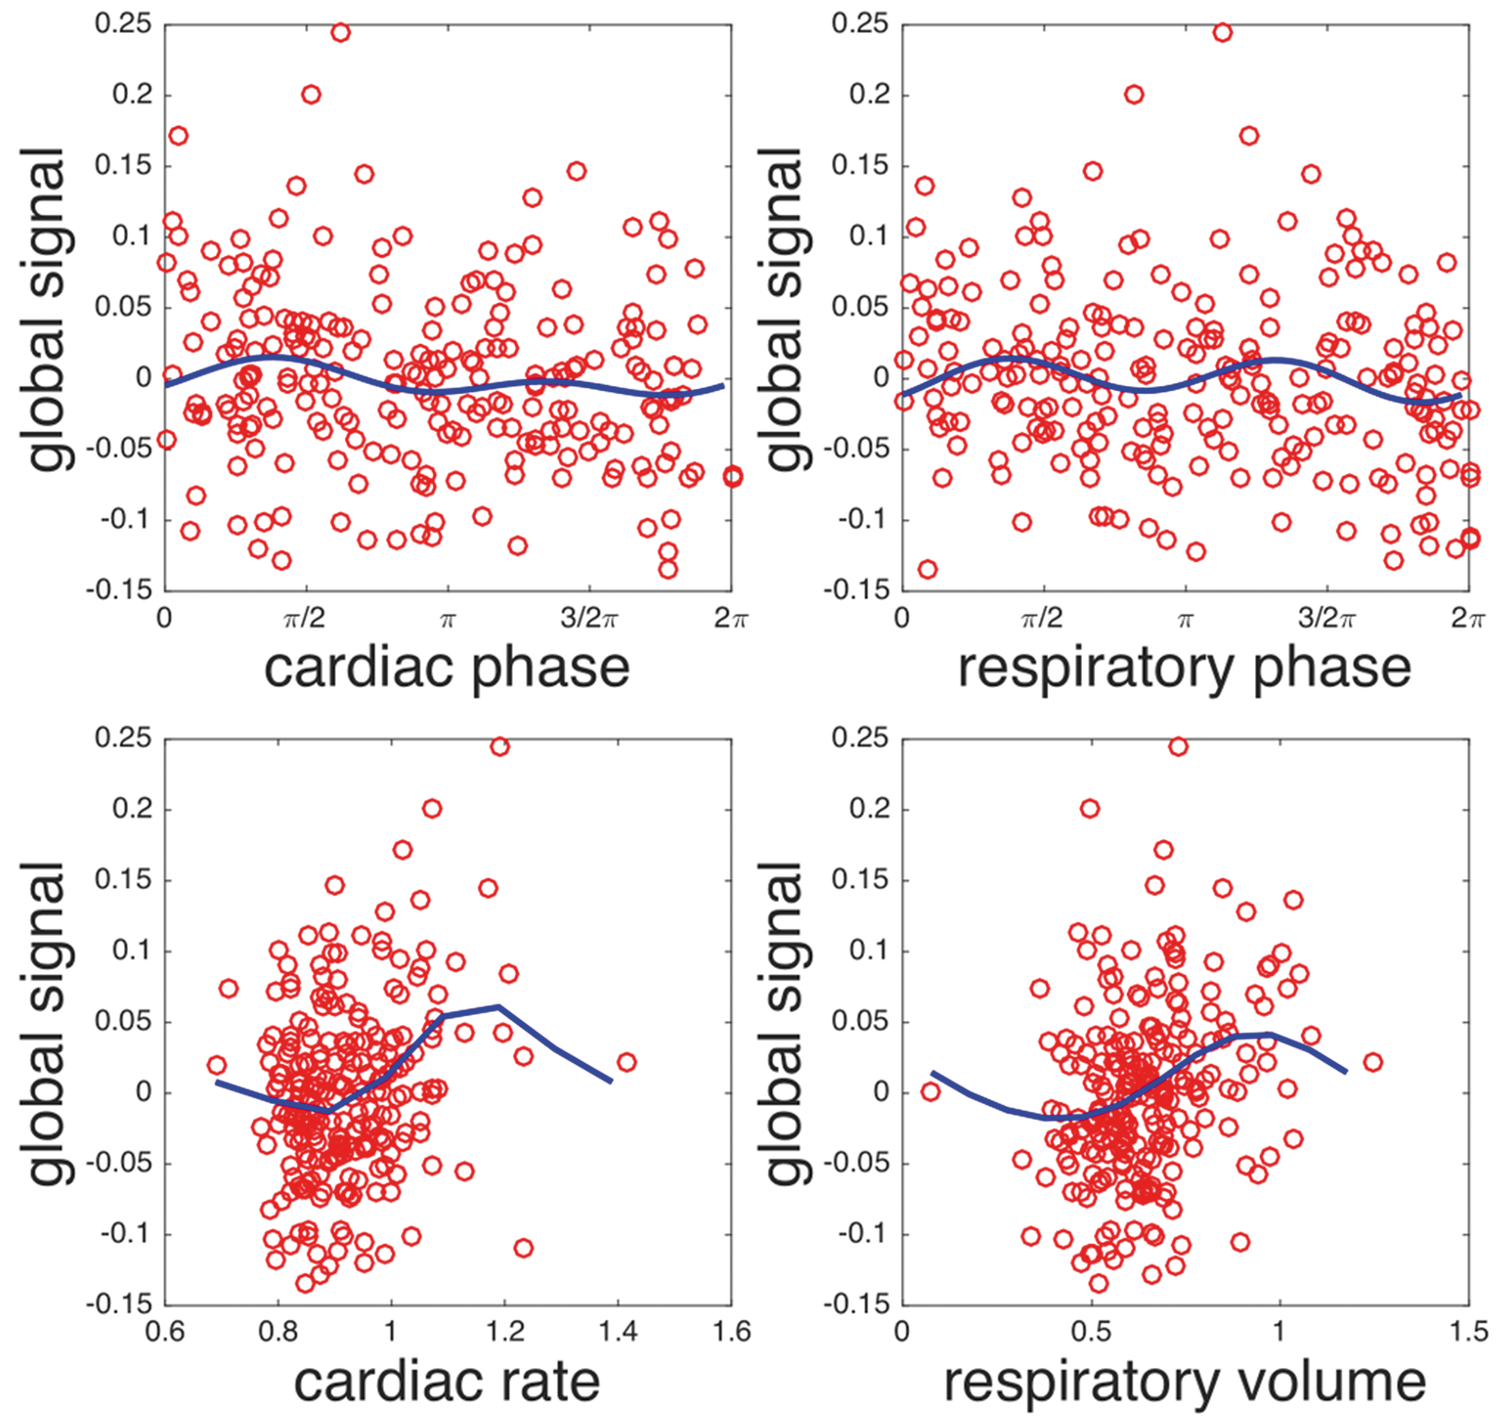
The power spectrum of the global flow fluctuations was studied for further insights into the nature of the fluctuations. With almost 20 min continuous data acquisition at 5 s sampling, the spectrum from 0.01 to 0.1 Hz could be measured. Power spectra with and without cardiac and respiratory associated signals removed were calculated, Figure 3. All spectra demonstrated reduced amplitude above 0.05 Hz. Removal of cardiac and respiratory effects slightly reduced the overall power. In particular, removal of the respiratory volume factor appeared to attenuate some peaks near 0.03 Hz. These peaks were more pronounced in blood flow and respiratory volume measures of two of the subjects. After removal of physiologic correlates, a relatively flat spectrum from 0.01 to 0.04 Hz remained. The low power at higher frequencies and the absence of major effects when removing cardiac and respiratory phenomena that occurred faster than our 5 s blood flow sampling rate, suggest that aliasing of high frequency physiologic fluctuations is not a major problem for our data. This spectrum is quite consistent with previously reported measures of resting state network power spectra.39,40
Spectrum of global resting state signal (negative labeling) before and after regressing out physiological signals (a. original signal, b. remove cardiac phase, c. remove cardiac rate, d. remove respiratory phase, e. remove respiratory volume and f. remove all cardiac and respiratory associated signals).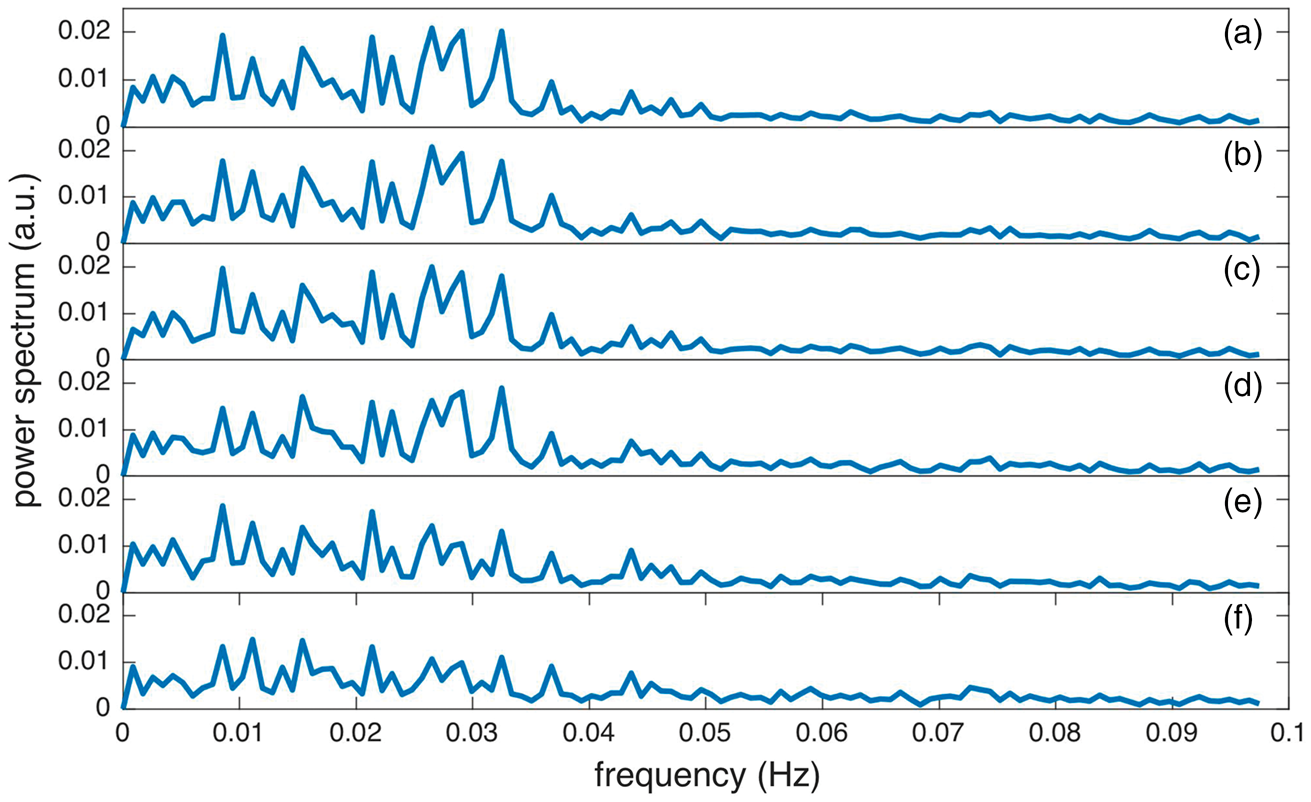
The degree to which fluctuations across the brain are synchronized can be assessed by comparison of the fluctuations of the global average blood flow and the global mean of the temporal SD of each voxel (mSD). This second measure is similar to the amplitude of low-frequency fluctuations (ALFF) that has been used to assess overall fluctuation amplitude in BOLD 41 and ASL 42 studies. mSD measures all fluctuations at a voxel, regardless of whether they are correlated with other regions. mSDs were 24.69 ± 7.63% for positive labeling and 24.73 ± 7.80% for negative labeling (p = 0.97). After removing cardiac and respiratory associated signals, mSDs were slightly reduced to 23.24 ± 6.91% for positive labeling and 23.25 ± 7.04% for negative labeling (p = 0.99). Global average fluctuations represent approximately half of the SD and one-quarter of the overall fluctuation power in the image series.
The spatial distribution of the global average fluctuations was assessed by extracting the amplitude of the voxel-wise signal with the same temporal response as the global signal. The spatial distribution was fairly consistent with the time averaged mean blood flow, Figure 4, with gray matter contributing much more to the global average effect than white matter regions. The most notable difference between the spatial distributions of the global fluctuation and time averaged blood flow was in the choroid plexus, highlighted by arrows. The much lower choroid plexus participation in the global fluctuations supports a neural, rather than systemic, effect on blood flow. No significant differences were found between hemispheres when fractional fluctuations were calculated separately. Alhough other regions including the occipital visual cortex, cerebellum, and posterior cingulate also appear slightly reduced, a more detailed study will be required to assess any significant differences in spatial distribution.
Spatial distribution of globally correlated fluctuations and time-averaged blood flow. The regression coefficients for fits of each individual voxel time course to the global average time course is shown for data with (a) and without (b) cardiac and respiratory contributions. The ratio of contribution map (b) to normalized mean flow map (c) is shown in (d).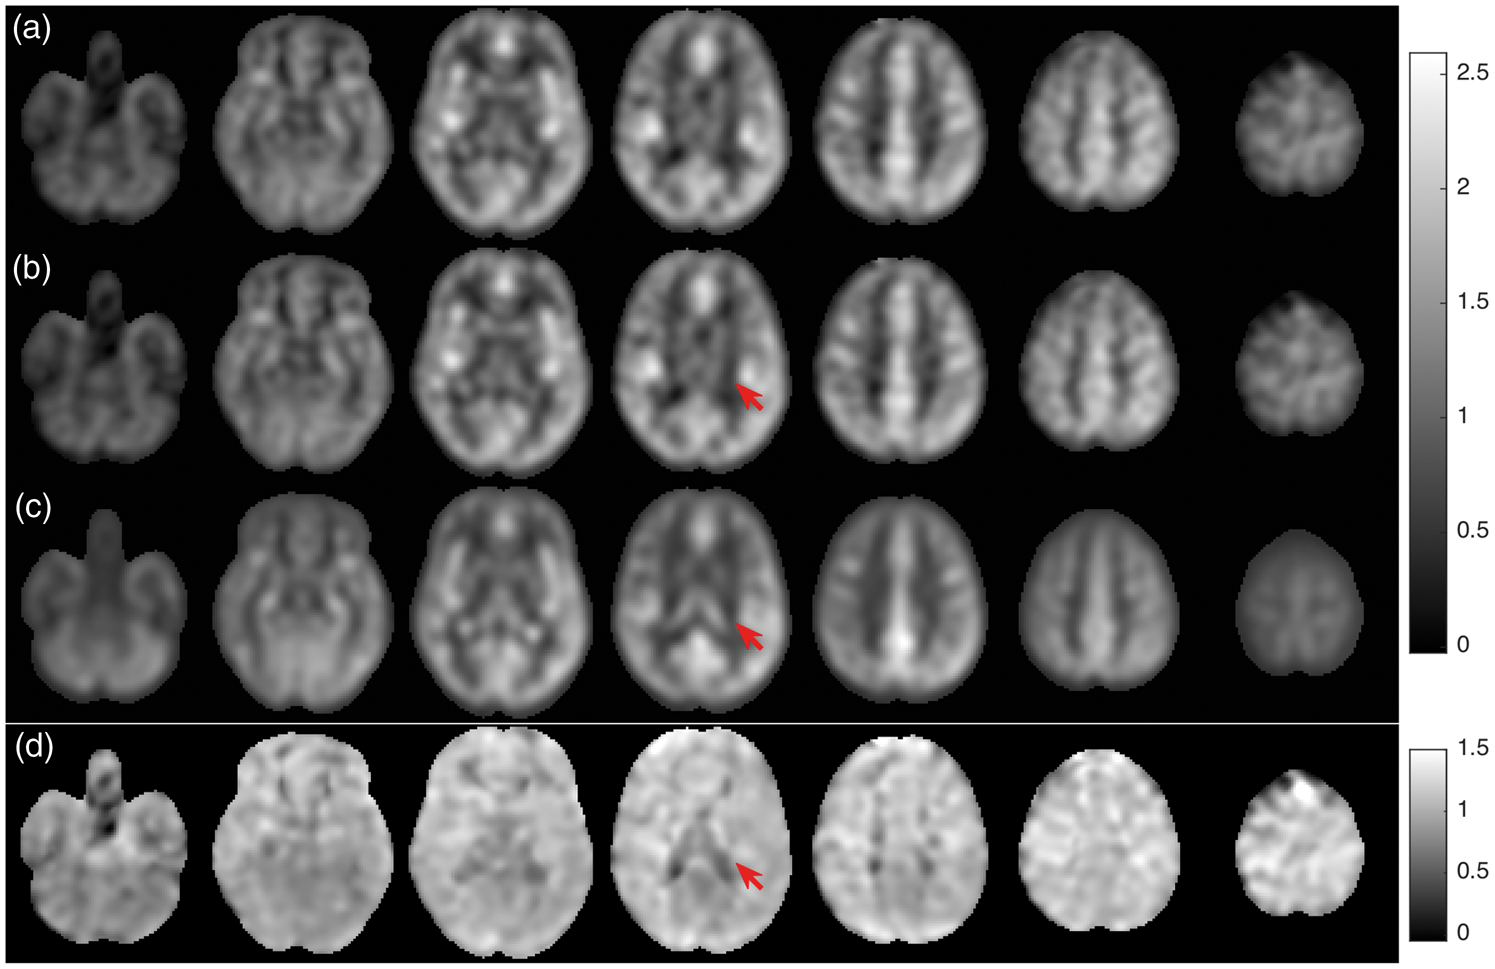
Amplitude of fluctuations within resting networks identified by ICA analysis.
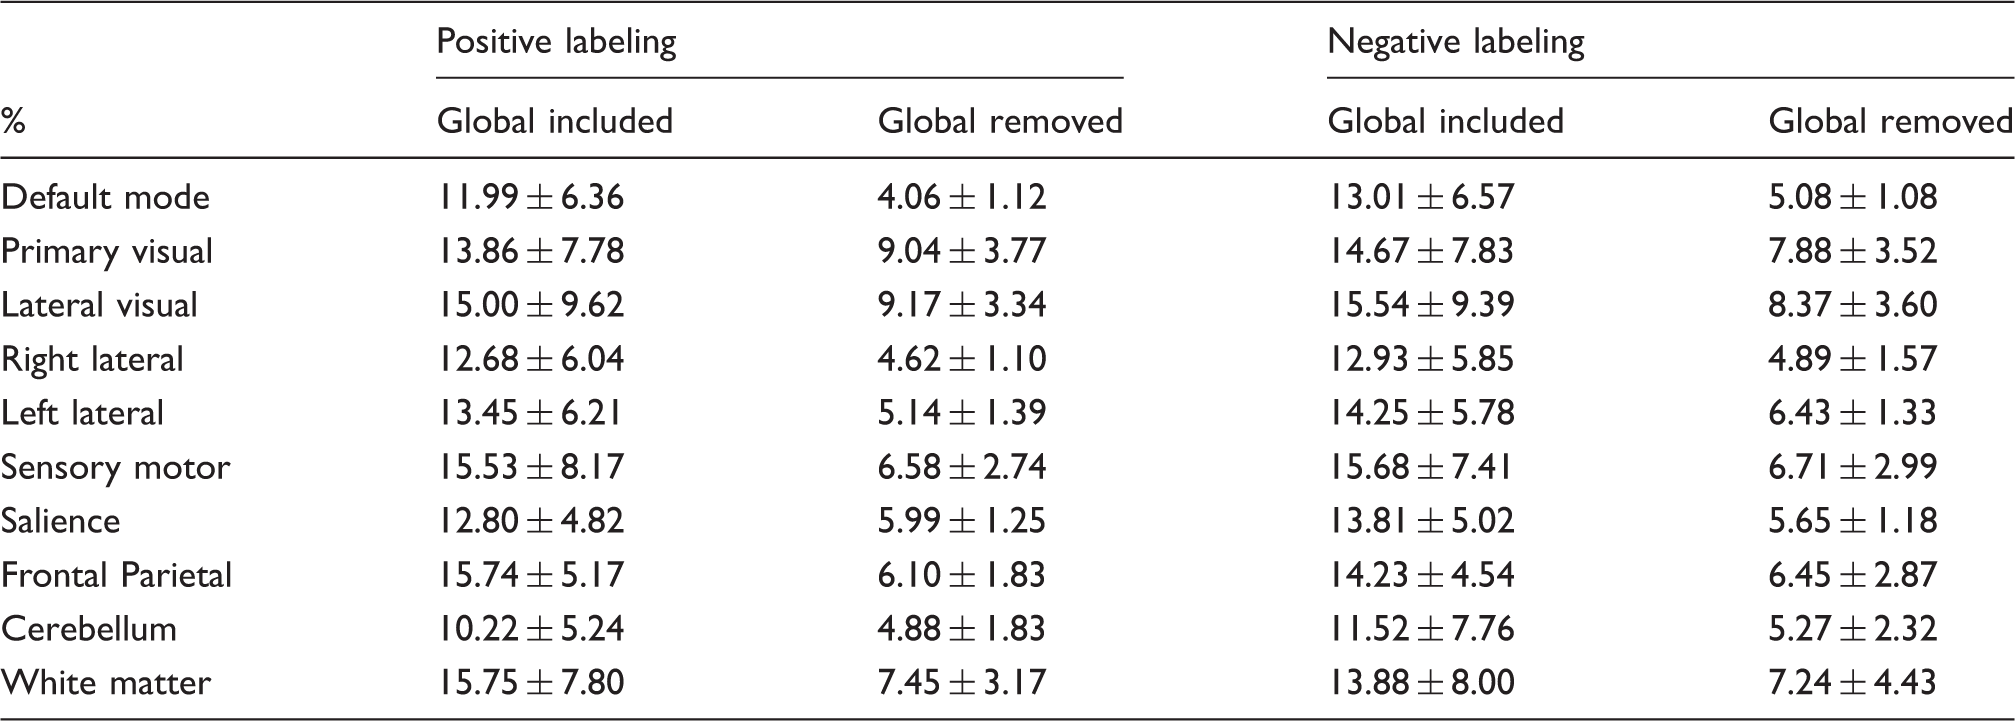
ICA: independent component analysis.
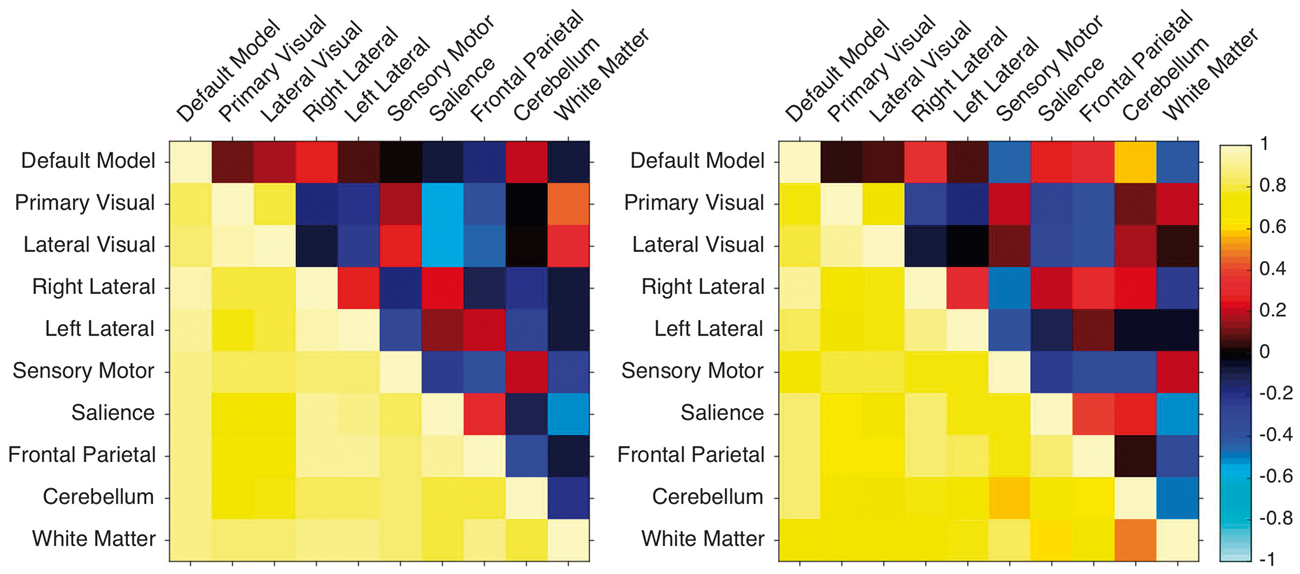
Correlations between brain networks. Values below/above the diagonal were calculated using data without/with global fluctuation removal. Values were derived from data sets using positive labeling, left, and negative labeling, right.
Discussion
Limited contribution of systemic factors to CBF fluctuations
Our results showed almost no relationship between systemic factors and whole brain blood flow modulation as measured with ASL. This finding was at first surprising. For example, it is known that blood flow through the cerebral arteries is strongly modulated by the cardiac cycle. Simulations of the ASL labeling process, which extends across the cardiac cycle, however, suggest a much weaker variation with the cardiac cycle. 44 Still, our findings and those of others 45 suggest an even weaker dependence. Another attenuator of blood flow into tissue may be arterial compliance that temporarily stores blood volume in distended vessels. We observed greater cardiac dependence when dephasing gradients to attenuate vascular signal were not employed. Indeed, a technique for measuring arterial cerebrovascular compliance using ASL comparing vascular signal across the cardiac cycle has been proposed. 46 This vascular compliance may also explain the absence of Mayer wave 47 type low frequency oscillations around 0.1 Hz in our power spectra and their association with heart rate modulation. 47 Most studies of this coupling employ ultrasound or other measures of flow in major vessels, before the compliant arteries and arterioles. Changes of arterial diameter at the ultrasound measurement location have also been suggested as a source of error in such studies. 30 A small but significant relationship between respiratory volume, a measure closely related to arterial CO2 pressure, was observed. These respiratory volume changes were highly variable across subjects and still represented a small percentage of the global blood flow modulation.
Relationship to prior ASL study of global flow fluctuations
The SD of the global fluctuations of resting state ASL reported here, 12.7%, is higher than the 7.59% reported in our group’s earlier work. 6 We believe this discrepancy can be explained by experimental differences. The ASL images in Dai et al. 6 were acquired at a temporal resolution of 30 s using paired label and control ASL with three interleaves of spiral that tend to average the global signal over that time interval. In the current study, we used a 5 s temporal resolution. If the fluctuations were white noise that had a flat power spectrum, then we would expect square root of the temporal resolution ratio, 2.45, times greater SD in this study. However, as shown in Figure 3, the power spectrum of global fluctuations is band limited to below 0.05 Hz, corresponding to an approximately 10 s correlation time. Therefore, the 30-s temporal averaging of Dai et al. 6 should reduce the SD by approximately a factor of square root of 3, or 1.73. The ratio of 1.67 between the two results is consistent with this expectation. Since our current temporal resolution is already faster than the 10-s correlation time, we do not expect that further increasing the sampling rate should affect the global SD.
Different sensitivity to sources of global signal modulation in BOLD and background suppressed ASL
Sources of physiologic fluctuation in resting state BOLD studies have been extensively studied with heart rate variability, cardiac rate, respiratory rate and volume, and subject motion all significant contributors.4,5,37 Because the functional signal in BOLD is only a few percent of the total signal, it is vulnerable to many sources of fluctuation that modulate the larger background signal. In addition to tissue oxygenation, vascular volume, CBF and cerebrospinal fluid fluctuations are all observable. Evidence for systemic contributions to the BOLD signal and resting state correlations, perhaps representing Mayer waves and related fluctuations, has been reported. 48 ASL, on the other hand, can be made insensitive to many of the fluctuations through carefully optimized background suppression. Contributions of subject motion are minimized, signal amplitudes of vascular blood and CSF are greatly attenuated, and the flow effect itself can be averaged over the cardiac cycle by an extended duration of flow labeling. 44 Although BOLD is likely sensitive to the flow effects observed here and robust global correlations are observed, 12 it must be separated from many other sources of physiologic fluctuation. 11 ASL also permits quantification of fluctuations in terms of a direct physiologic quantity, blood flow, and as a fraction of time-averaged blood flow. These properties suggest that ASL is particularly well suited to studying global fluctuations and the strength of correlations across regional networks.
Possible implications of highly correlated functional activity across the entire brain
The presence of globally correlated functional activity would not be surprising. Evidence of global synchronization in brain electrical activity is extensive. 16 Resting state functional MRI 13 and near infrared spectroscopy 49 have demonstrated highly correlated activity across large distances within the brain, although truly global effects are not frequently studied. Our measurements provide a quantitative measure of the degree of functional correlation that suggests global interconnection is a major priority for brain function, likely reflecting a significant fraction of its metabolic activity.
The global fluctuations in blood flow we observed may reflect modulations of the waking brain state 50 associated with fluctuations in cortical excitability, pupillary diameter, task performance, behavior, and neurotransmitter activity. 51 Fluctuations of both locus coeruleus noradrenergic activity and basal forebrain cholinergic activity are strongly associated with these global modulations, but cholinergic activity fluctuations appear more dominant at the lower frequencies at which our blood flow fluctuations were observed. 51 This global modulation of neurotransmitter activity may control integration of network activity52,53 with corresponding effects on network connectivity and performance. 54
Implications for analysis of resting state fMRI data
The impact of global correlations and their removal on measurements of resting state networks has been extensively discussed.12,55,56 Our findings support the strong correlation of blood flow fluctuations between all networks that may reflect globally synchronized neural activity. Given the dominant contribution of global correlations to the signal fluctuations we observed in all networks, anti-correlations observed after global signal removal should be interpreted carefully. Blood flow and BOLD measures are crude, low spatial and temporal resolution measures of overall activity that comprised numerous coherent processes with different spatial, temporal, and neurochemical characteristics. Combination of observations with different techniques and at different spatial scales will be required to fully understand the interactions between the phenomenological brain networks identified with resting state fMRI. Indeed, some support for coherence at difference frequencies across networks and spatial scales has been reported. 57 Still, the large amplitude of our measured global signal fluctuations and the potential association with arousal, attention, and network integration suggest that ignoring and removing them may lead to simplistic interpretations of network activity.
Conclusions
Fluctuations in global blood flow measured with ASL are consistent with a globally correlated resting state network. This network is readily detectable by ASL because of the high stability and robustness of the technique. The spatial amplitude of these global fluctuations exceeds those of other regional networks and complicates interpretation of correlations and anti-correlations between networks. This global network may be mediated by cholinergic and noradrenergic activity fluctuations that modulate arousal, attention, and performance across the cortex.
Footnotes
Funding
The author(s) disclosed receipt of the following financial support for the research, authorship, and/or publication of this article: This work was supported by grant R01MH080729 from the National Institutes of Health.
Declaration of conflicting interests
The author(s) declared the following potential conflicts of interest with respect to the research, authorship, and/or publication of this article: DCA is an inventor of PCASL and receives post-market royalties through his institution from GE Healthcare, Philips Healthcare, Siemens Healthineers, Hitachi Medical, and Animage LLC. He also receives research support from GE Healthcare. JAD receives research support from Siemens Healthineers.
Authors’ contributions
LZ and WD designed the protocol, acquired the data, analyzed the data, interpreted the data and drafted the paper; DCA designed the protocol, interpreted the data, and revised the paper; and JAD interpreted the data and revised the paper.