
Abstract
The purpose was to assess the difference of collaterals in symptomatic versus asymptomatic patients with unilateral middle cerebral artery (MCA) stenosis by comparing cerebral blood flow (CBF) at two post labeling delays (PLD) using three-dimensional pseudo-continuous arterial spin labeling (3D pCASL). Eighty-one patients (49 symptomatic and 32 asymptomatic) with unilateral MCA stenosis ≥50% who underwent pCASL with two PLDs were included. Mean CBF and CBF subtraction images between two PLDs of MCA territories were compared in symptomatic and asymptomatic groups, respectively. Compared with the asymptomatic group, patients with symptomatic MCA stenosis had significantly lower CBF in the MCA territory of stenotic side at each PLD. The CBF of stenotic territory showed greater increase than that of normal side from PLD 1.5 to 2.5 s. The CBF of asymptomatic MCA territory increased similarly with that of symptomatic MCA territory from PLD of 1.5 to 2.5 s in stenotic side, while symptomatic patients experienced significantly slower antegrade flow. On CBF subtraction images, asymptomatic patients showed larger volume of differences between PLD of 1.5 and 2.5 s compared with those of symptomatic patients (p = 0.037). The results suggest that more robust collateral perfusion on two-delay 3D pCASL is present in asymptomatic patients compared with symptomatic patients.
Introduction
Collateral blood flow plays a pivotal role in supporting the cerebral circulation in the setting of cerebral ischemia. 1 A series of studies focusing on acute stroke or symptomatic intracranial artery stenosis showed that patients with the same extent of stenosis or occlusion have dramatically different outcomes based on their ability to recruit collateral pathways to maintain and/or restore blood flow to the downstream region at risk of ischemia.2–4 For patients with asymptomatic middle cerebral artery (MCA) stenosis, their lower stroke risk compared to those with symptoms may be related to the gradual development of collateral circulation.5–7 However, the lack of an ideal noninvasive imaging modality to unequivocally categorize collateral status in intracranial atherosclerosis has limited the ability to probe collateral perfusion and effectively translate the potentially pivotal information regarding underlying pathophysiology into logical treatment strategies.
Arterial spin labeling (ASL) technique is noninvasive and can quantify regional cerebral blood flow (CBF) values of the whole brain with high reproducibility. 8 As a novel technique, three-dimensional pseudo-continuous arterial spin-labeling (3D pCASL) offers a high signal-to-noise ratio and spatial resolution, whereas the use of 3D readout approaches minimizes ghosting and signal loss. 9 One study has demonstrated that the arterial transit artifact (ATA) revealed by ASL may identify and grade collateral circulation in patients with intracranial arterial stenosis. 10 Several recent studies have also evaluated the clinical utility of 3D pCASL in acute ischemic stroke through comparison with the reference standard of DSC PWI.11,12 These studies showed that 3D pCASL is largely consistent with DSC for detecting/delineating hypoperfused brain regions. However, appropriate choice of post labeling delay time (PLD) is essential for CBF measurement because it is possible that the labeled bolus may not have reached the imaging plane, leading to underestimation of CBF. Single delay 3D pCASL may miss small lesions and may overestimate perfusion/diffusion mismatch due to prolonged arterial transit time (ATT) in stroke. 12 3D pCASL with multiple PLDs has potential advantages over single delay pCASL scans, including improved accuracy of CBF quantification, 11 visualization and quantification of collateral flow through dynamic image series.13,14
The purpose of this study was to quantify and determine the distinction of collateral perfusion in symptomatic versus asymptomatic patients with unilateral MCA stenosis by comparing CBF maps acquired with 3D pCASL at two PLDs.
Materials and methods
Subjects
The institutional ethnic committee of Chinese PLA General Hospital and Beijing Tiantan Hospital approved the study under the guidelines of the Helsinki Declaration of 1975/1983. Written informed consent was obtained before each MR examination.
From May 2012 to February 2016, we prospectively screened consecutive patients from two centers with M1 segment of the MCA ≥ 50% stenosis confirmed by DSA or CTA or MRA. Symptomatic patients were considered for inclusion if there was an ischemic stroke or transient ischemic attack in the distribution of the stenotic MCA within the preceding two weeks. Asymptomatic patients were those referred by their primary care physicians or other specialists for a brain MR examination due to an MCA ≥ 50% stenosis detected by transcranial Doppler and CT angiography, and were considered for inclusion if there was no history of cerebrovascular events.
Diffusion-weighted imaging (DWI), structure imaging using 3D fast spoiled gradient recalled echo (FSPGR) or T1-weighted imaging (T1WI), 3D MR angiography (MRA), and 3D pCASL perfusion imaging were acquired for each patient. Patients with any of the following conditions were excluded from the final analysis: (1) Co-existent > 50% ipsilateral extracranial or intracranial internal carotid artery stenosis; (2) Age below 30 years old or have non-atherosclerotic vasculopathy, such as dissection, vasculitis or moyamoya disease; (3) Evidence of cardioembolism; (4) Poor image quality that prevented further analysis; (5) Vasoactive medications that could affect the CBF and metal in the body that could not be removed; (6) Contraindication to MR examination.
MRI protocol
All patients were scanned on GE 3.0T MR scanners (Discovery MR 750 System, GE Healthcare, Milwaukee, WI) with an 8-channel head coil. DWI of the whole brain was performed in the axial plane with b-values of 0 and 1000 s/mm2 by using a single-shot spin-echo echo planar imaging (EPI) sequence with following parameters: repetition time (TR)/echo time (TE) = 6500/110 ms, 128 × 128 matrix, 24 cm field of view (FOV), 1 number of excitation (NEX), and 5-mm thickness with a 0.5-mm gap. 3D FSPGR was performed using TR/TE = 8.2/3.2 ms, TI = 450 ms, FOV =24 × 24 cm, matrix = 256 × 256, slice thickness =1.2 mm, NEX = 1, number of slices = 156. 3D Time-of-flight MRA was obtained using TR/TE = 21/3.2 ms, FOV = 16 × 16 cm, thickness = 1 mm, matrix =256 × 256, and NEX = 1. T1WI was performed using TR/TE = 1750/23 ms, FOV = 24 × 24cm, matrix =320 × 320, NEX = 1, number of slices = 20 and 5-mm thickness with a 0.5-mm gap.
3D pCASL perfusion imaging was performed with pseudo-continuous ASL, background suppression, and an interleaved 3D spiral fast spin echo sequence for image acquisition with the following parameters: 512 sampling points on eight spirals, spatial resolution = 3.64 mm, TR = 4590 ms (PLD = 1.5 s)/5285 ms (PLD = 2.5 s), TE = 10.5 ms, bandwidth = 62.5 kHz, slice thickness = 4 mm, number of slices = 36, labeling duration = 1500 ms, acquisition time = 4:29 (PLD =1.5 s)/5:09 (PLD = 2.5 s) min, FOV = 24 × 24 cm, and NEX = 3. Total acquisition time was approximately 20 min.
Imaging processing
The CBF map of 3D pCASL was post processed using Function Tool (AW 4.5 Workstation, GE Healthcare). Subtraction images were obtained by subtracting the CBF map of PLD 1.5 s from that of PLD 2.5 s using the Subtraction tool on GE ADW 4.5 workstation. After the subtraction, CBF maps were co-registered to the T1WI sequence or T1 FSPGR, then spatially normalized to the standard Montreal Neurological Institute template space (with a spatial resolution 2mm) and smoothed (with an FWHM 6mm kernel) using SPM8 (Statistical Parametric Mapping, University College of London, www.fil.ion.ucl.ac.uk/spm/software/Spm8). T1 FSPGR was also spatial normalized and segmented into grey and white matter as masks to calculate mean CBF of grey and white matter, respectively. Grey matter and white matter volumes were also calculated to detect potential structural alternations. All co-registration and normalization were checked by experienced readers and manual corrections were performed when necessary.
Masks of bilateral MCA territory volume were extracted from Automated Anatomical Labeling template by referring to the work of Tatu (see supplementary Figure 1). 15 The masks mainly covered leptomeningeal region of the MCA territory, and basil ganglia region and deep white matter were not covered. Masks were then applied to the normalized CBF map to obtain mean CBF of each MCA territory.
Collateral perfusion signals were obtained on CBF subtraction maps between the PLD of 1.5 and 2.5 s. The collateral perfusion areas were determined by boundaries of residual CBF signal after the subtraction. The threshold identifying residual signals was determined by nulling signals in contralateral normal MCA territorial subtraction maps. Then the collateral perfusion volumes were measured as the sum of areas with residual perfusion signals on the subtraction slices by two neuroradiologists (X.L. and J.H.L.) independently.
Imaging review
The degree of stenosis was estimated on maximum intensity projection (MIP) images of MRA by diameter stenosis. 16 Two expert neuroradiologists (X.L. and L.M.) measured diameters on both the MIP images and source images quantitatively. To maintain uniformity in choosing the location of the vessel wall, the outermost margin of the vessel was selected on both MR angiographic and source images. When measurements were made on the MIP images, the projection that showed the greatest stenosis was chosen. In patients with available CT angiography (CTA) or DSA, the degree of stenosis was also verified by CTA or DSA.
DWI lesion was defined as an area of high signal intensity. ADC maps were also reviewed to exclude the hyperintensity caused by T2 shine-through effect. Poor image quality was defined as images with severe motion artifacts or severe artifacts produced by 3D spiral readout, background suppression, susceptibility or severe signal loss, judged by the two radiologists (X.L. and L.M.) with consensus.
A neuroradiologist (J.H.L.) collected and reviewed all clinical information of the cohort. Two neuroradiologists (X.L. and L.M.) who were blinded to clinical findings independently reviewed all the MR images from the sites of stenosis/occlusion and collateral images.
Statistical analysis
All statistical analyses were performed using the Statistical Program for Social Sciences (SPSS) statistical software (version 18, Chicago, IL, USA). Quantitative data were described with mean ± SD. Interobserver agreement for the measurements of the degree of stenosis and perfusion volumes was determined using intraclass correlation coefficient (ICC). Multivariate ANOVA was performed on CBF measurements to detect significant differences between two PLDs, stenotic and normal MCA territory, symptomatic and asymptomatic patients and their interaction effects, respectively. Two-way ANOVA was performed on CBF for symptomatic and asymptomatic patients, respectively, to evaluate the factors of hemisphere (stenotic and normal side), PLD time (repeated measures at 1.5 and 2.5 s) and the interaction effect between hemisphere and PLD. Student t test or Mann–Whitney U test (when continuous variables had skewed distributions) was used to identify difference of age, the degree of stenosis, the mean CBF values, and the collateral perfusion areas between two groups. Difference in each categorical variable between groups was tested with the κ statistic or Fisher exact test (when the expected cell frequency was < 5). A two-sided α level of 0.05 was used to infer statistically significant difference.
Results
Demographic data of symptomatic and asymptomatic patients with MCA stenosis.
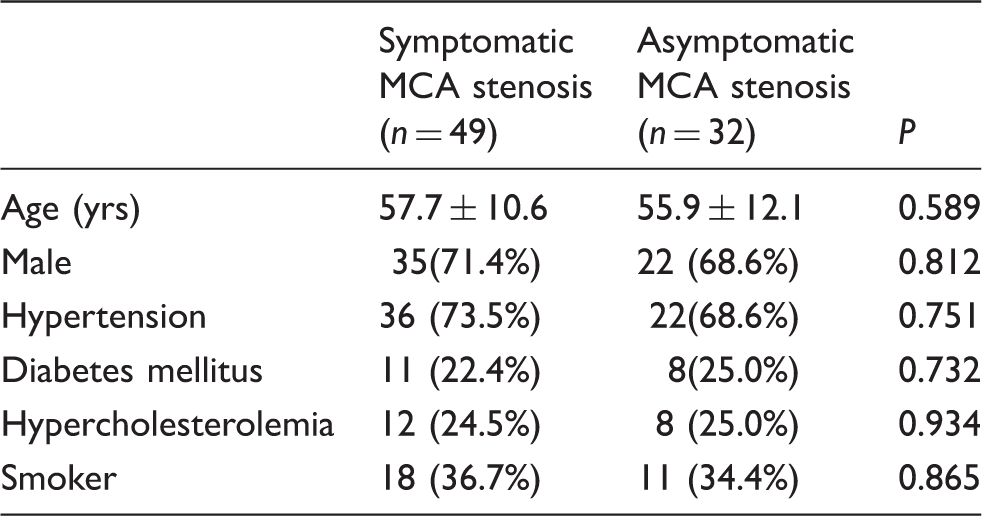
MCA: middle cerebral artery.
The degree of M1 segment of MCA stenosis, measured on DSA, CTA, and MRA by two independent readers (ICC = 0.916; 95% CI: 0.878-0.946), was similar between symptomatic and asymptomatic groups (66.5% vs. 64.1%, p = 0.397); 20 with right MCA and 29 with left MCA stenosis in symptomatic patients, 18 with right MCA and 14 with left MCA stenosis in asymptomatic patients.
Of the 49 patients in symptomatic group, 38 (77.55%) showed DWI lesions in the MCA territories, whereas no patients showed DWI lesions in asymptomatic group.
Mean CBF of symptomatic and asymptomatic patients with MCA stenosis.
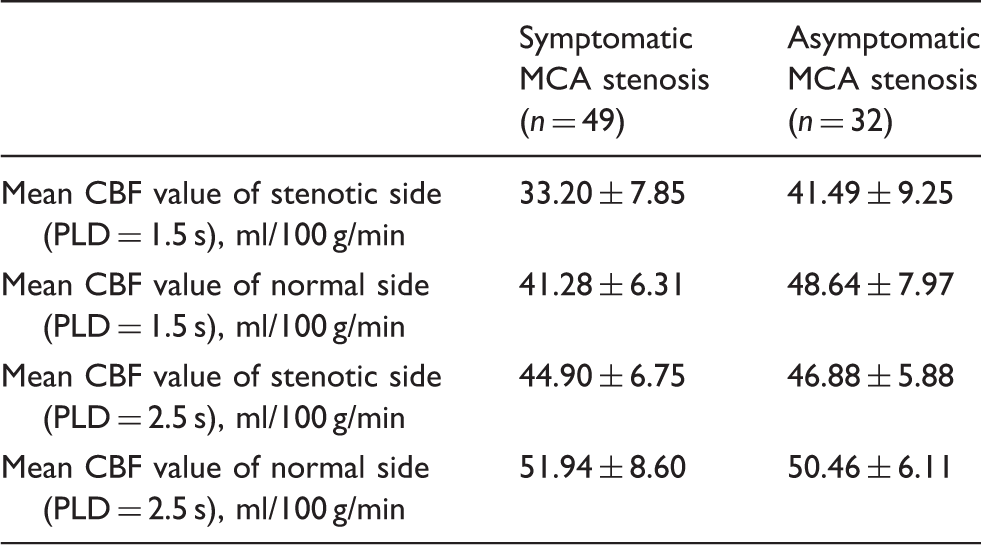
CBF: cerebral blood flow; MCA: middle cerebral artery; PLD: post labeling delay.
Mean CBF of grey matter and white matter segmentation as well as grey matter and white matter volume in symptomatic and asymptomatic patients with MCA stenosis.
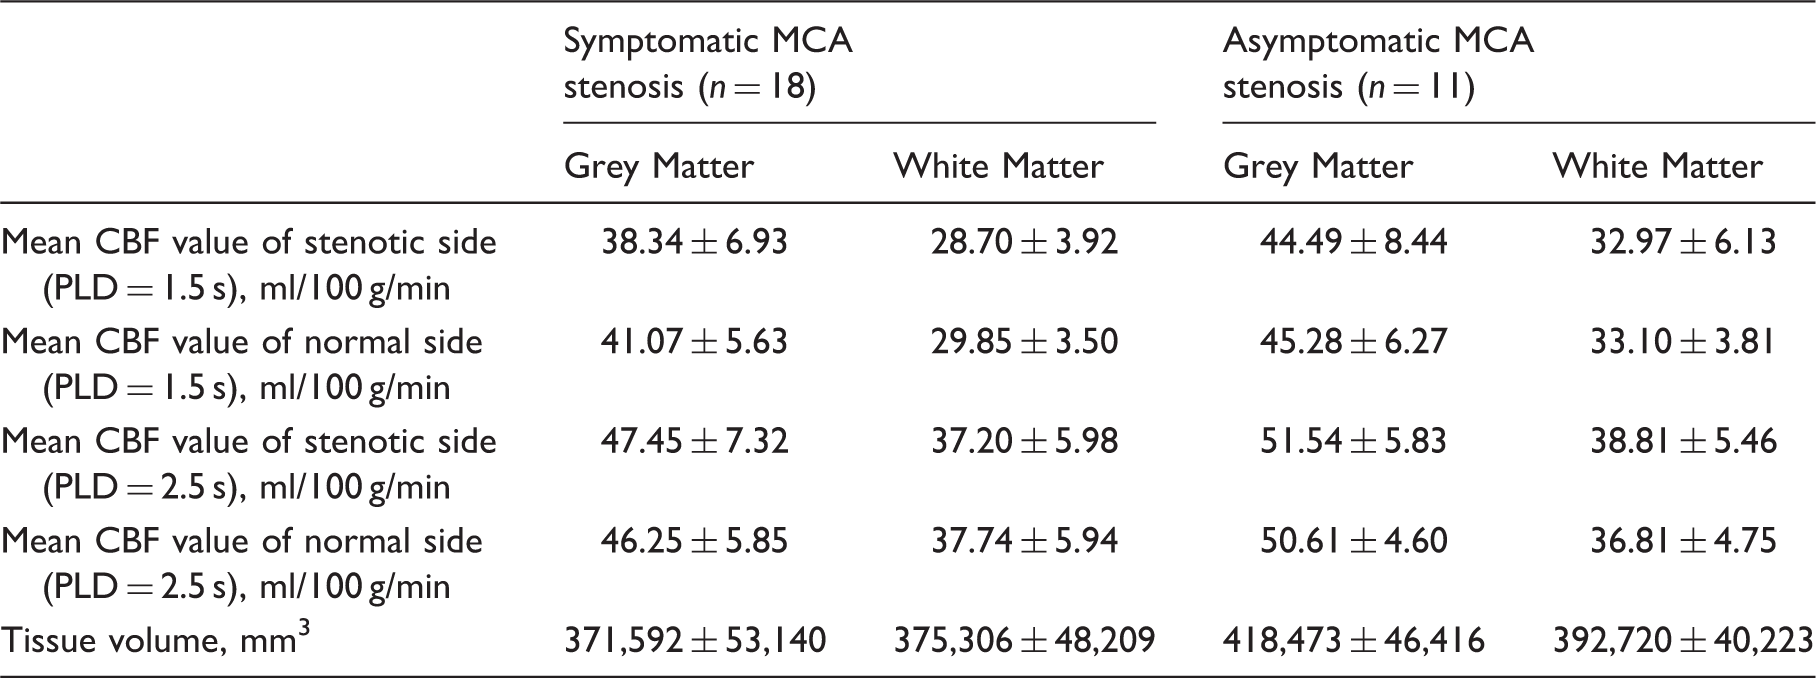
CBF: cerebral blood flow; MCA: middle cerebral artery; PLD: post labeling delay.
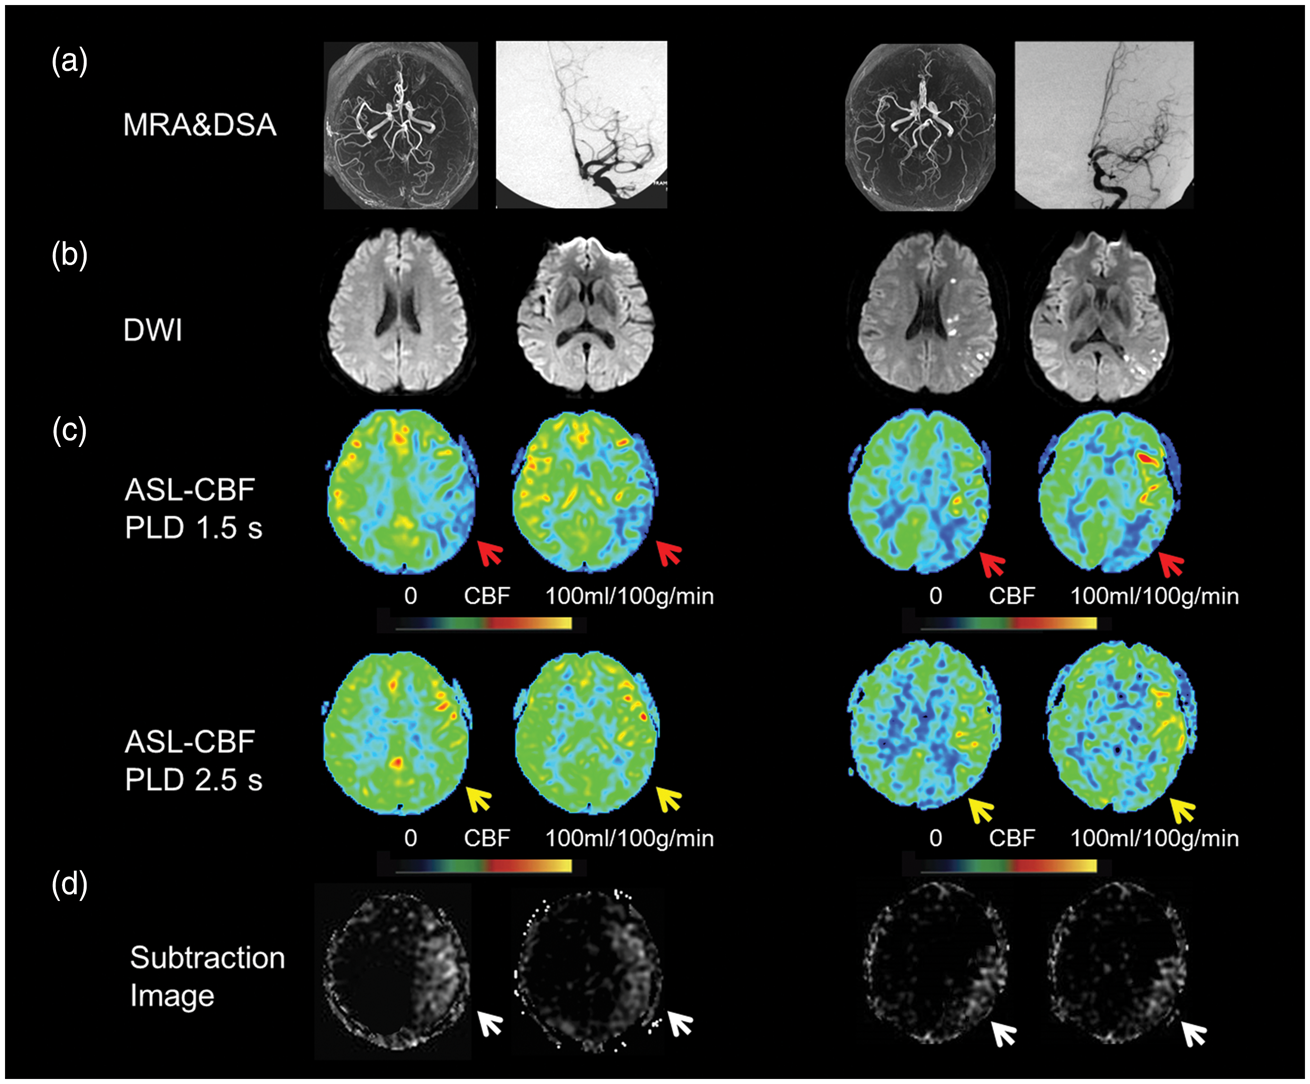
Compared with the asymptomatic group, patients with symptomatic MCA stenosis had significantly lower CBF in the MCA territory of stenotic side (F(1, 158) = 35.838, p < 0.001). Mean CBF of 2.5 s was significantly higher in the MCA territory than that of 1.5 s (F(1, 158) = 325.197, p < 0.001). The CBF of stenotic territory showed greater increase than that of normal side from PLD 1.5 to 2.5 s (F(1, 158) = 80.584, p < 0.001). The CBF of asymptomatic MCA territory increased similarly with that of symptomatic MCA territory from PLD 1.5 to 2.5 s on the stenotic side, while the CBF of asymptomatic MCA territory showed less increase than that of symptomatic MCA territory from PLD 1.5 to 2.5 s on the normal side (F(1, 158) = 9.378, p = 0.003). This result indicates that symptomatic patients experienced significantly slower antegrade flow. Figure 1 shows multivariate ANOVA results on CBF of stenotic and normal side MCA territory from PLD 1.5 to 2.5 s in symptomatic and asymptomatic patients respectively, and representative cases are shown in Figure 2.
Multivariate ANOVA on CBF for stenotic and normal side MCA territory from PLD 1.5 to 2.5 s in symptomatic and asymptomatic patients. The CBF of stenotic territory showed greater increase than that of normal side from PLD 1.5 to 2.5 s. The CBF of asymptomatic MCA territory increased similarly with that of symptomatic MCA territory from PLD 1.5 to 2.5 s on the stenotic side, while the CBF of asymptomatic MCA territory showed less increase than that of symptomatic MCA territory from PLD 1.5 to 2.5 s on the normal side. CBF: cerebral blood flow; MCA: middle cerebral artery; PLD: post labeling delay. Two delay ASL presentation of an asymptomatic patient (the first two columns) and symptomatic patient (the last two columns). Severe stenosis of left MCA was shown on MRA and DSA (a) in a 32-year-old asymptomatic patient and a 34-year-old symptomatic patient. Multiple DWI lesions located in cortical, subcortical regions and periventricular white matter were observed in the symptomatic patient (b). Decreased CBF was noted on ASL with PLD 1.5 s (C, red arrows) but normal CBF with PLD 2.5 s (C, yellow arrows) in the asymptomatic patient, whereas decreased CBF with PLD 2.5 s (C, yellow arrows) was still noted in the symptomatic patient. The total collateral perfusion area on the presented two slices was 65.5 cm2 and 32.7 cm2 on subtraction images between PLD 1.5 s and 2.5 s (D, white arrows), respectively. DWI: diffusion weighted imaging; CBF: cerebral blood flow; MCA: middle cerebral artery; PLD: post labeling delay.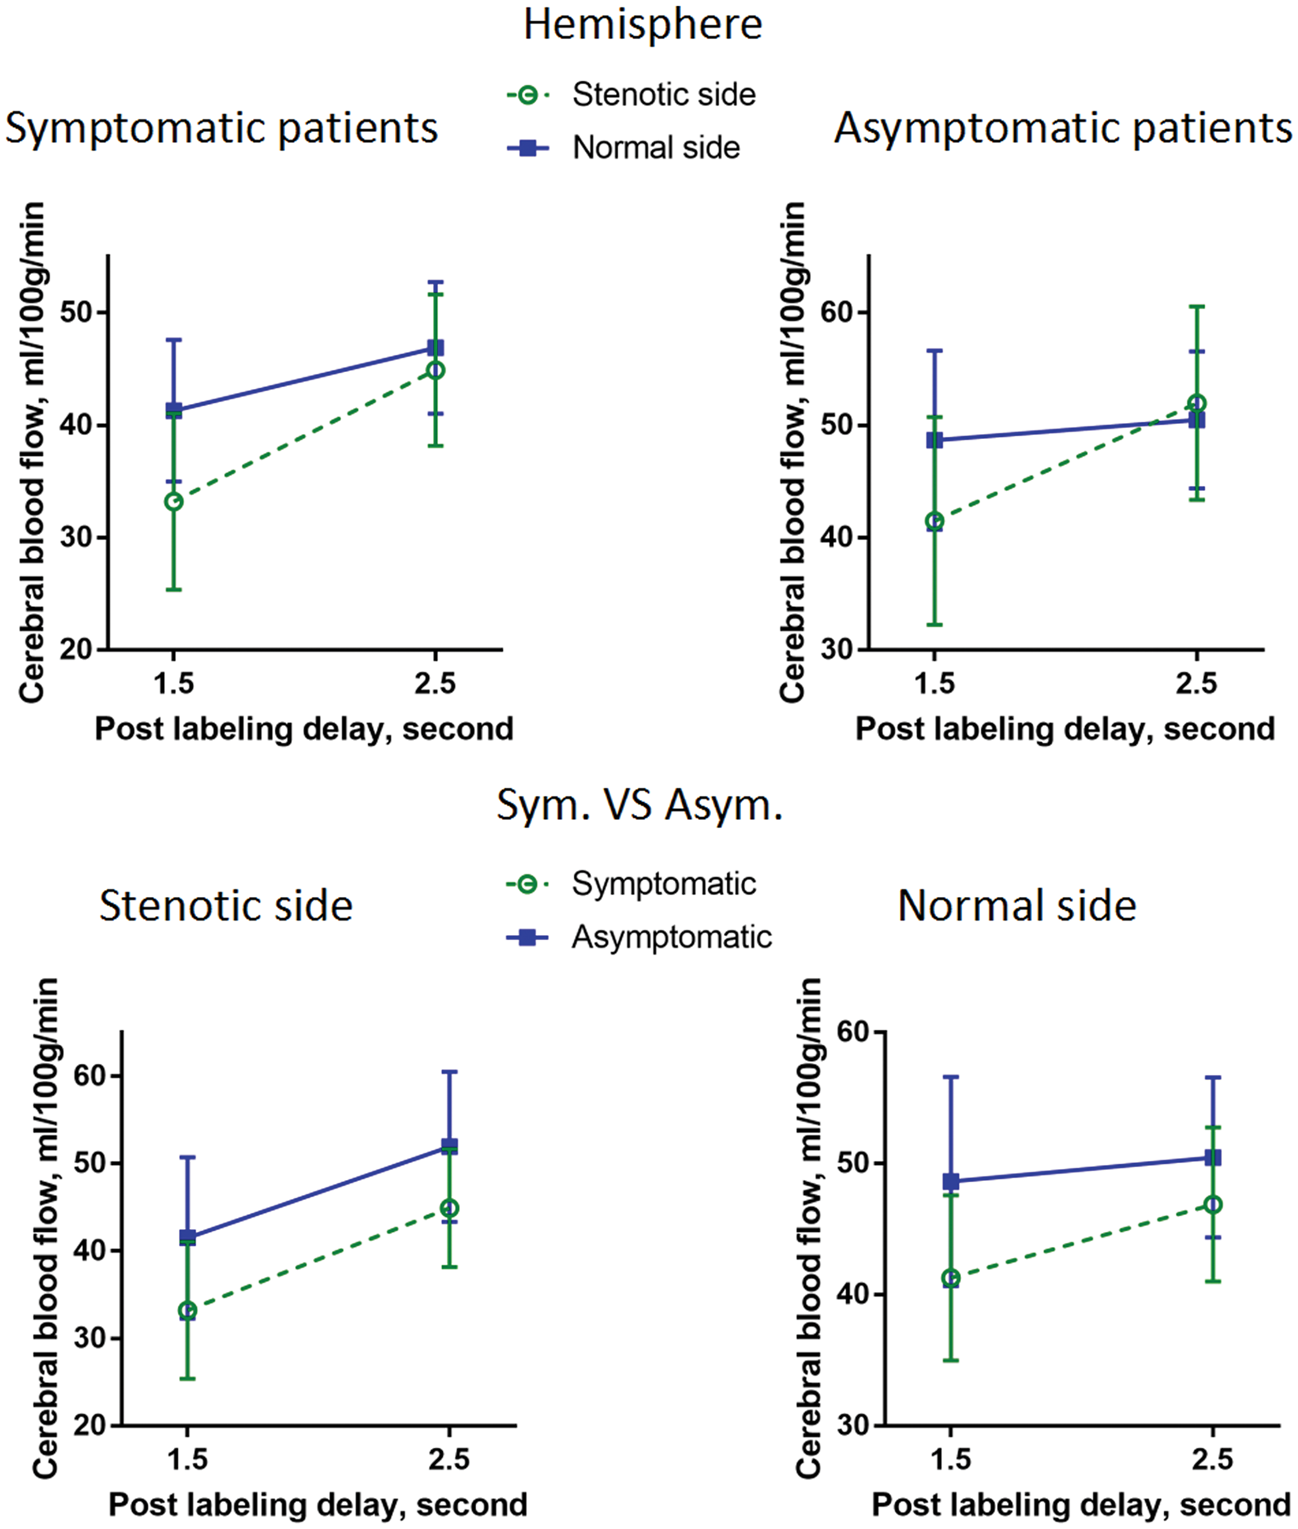
In symptomatic patients, the mean CBF value of stenotic side was significantly lower than that of normal side (F(1, 96) = 16.348, p < 0.001). The mean CBF value of 1.5 s PLD was significantly lower than that of 2.5 s PLD (F(1, 96) = 248.332, p < 0.001). There was a significant interaction effect between hemisphere and PLD (F(1, 96) = 30.894, p < 0.001), indicating that the CBF of stenotic territory showed greater increase than that of normal side from PLD 1.5 to 2.5 s. Mean CBF of 1.5 s PLD was significantly lower than that of 2.5 s PLD for segmented grey and white matter regions in patients with available 3D FSPGR (see Supplemental Figure 2).
In asymptomatic patients, the mean CBF value of 1.5s PLD was significantly lower than that of 2.5 s PLD (F(1, 62) = 116.88, p = 0.000) whereas no significant differences were detected between stenotic hemisphere and normal hemisphere (F(1, 62) = 2.139, p = 0.149). There was a significant interaction effect between hemisphere and PLD (F(1, 62) = 57.637, p < 0.001), indicating that the CBF of stenotic territory showed greater increase than that of normal side from PLD 1.5 to 2.5 s. Representative cases are shown in Figure 3. Mean CBF of 1.5 s PLD was significantly lower than that of 2.5 s PLD for segmented grey and white matter regions in patients with available 3D FSPGR (see Supplemental Figure 3).
Two delay ASL presentation of an asymptomatic patient. A severe stenosis of left MCA was shown on DSA (not shown) in a 42-year-old asymptomatic patient. Decreased CBF was noted on ASL with PLD 1.5 s (A, color and source imaging, red arrows). Increased CBF indicating collaterals was noted on ASL with PLD 2.5 s (B, color and source imaging, yellow arrows). The total collateral perfusion area on the presented two slices was 128.9 cm2 on subtraction images between PLD 1.5 s and 2.5 s (C, white arrows). CBF: cerebral blood flow; MCA: middle cerebral artery; PLD: post labeling delay.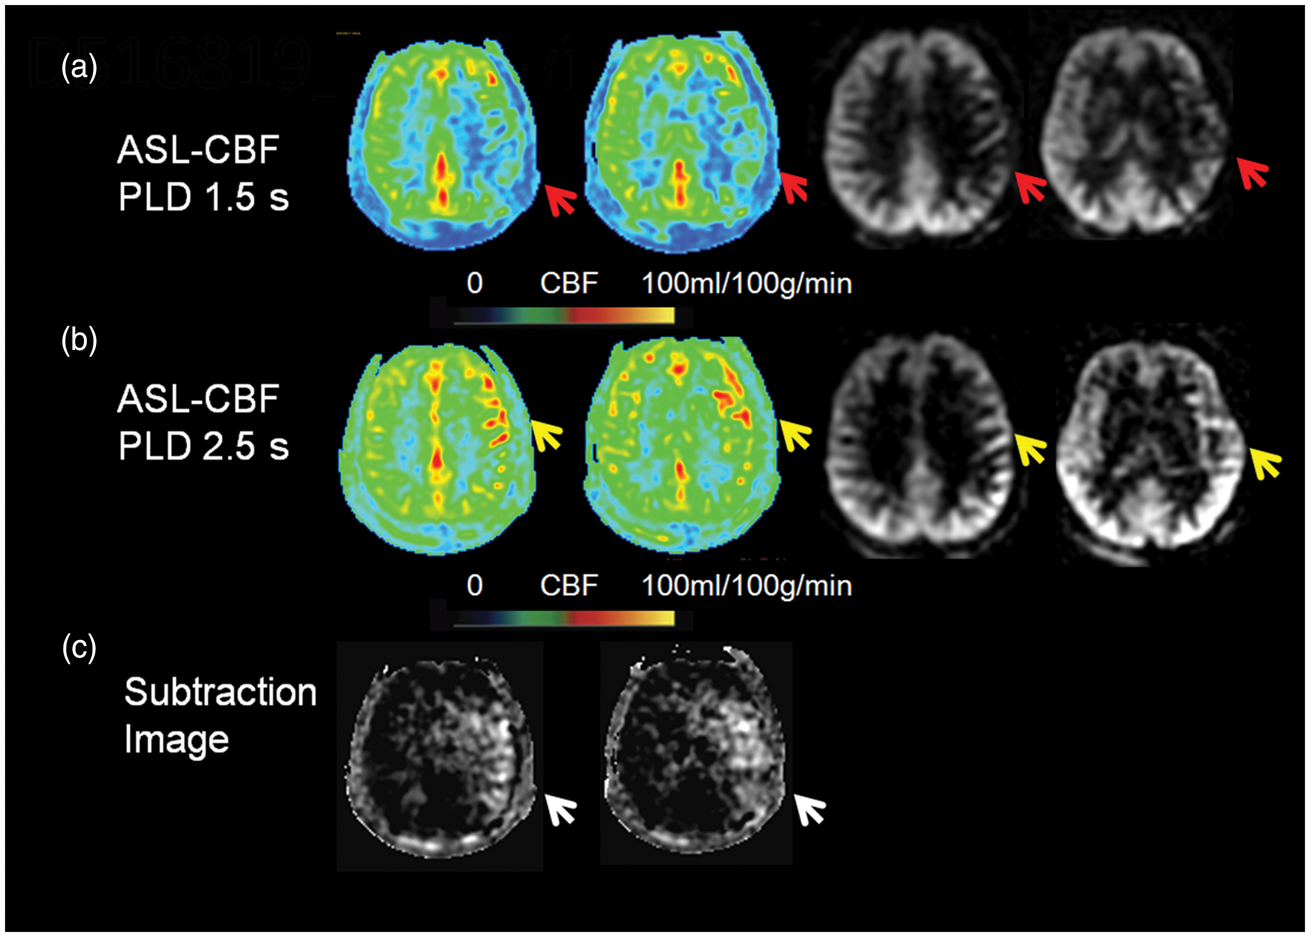
On CBF subtraction images, the volume of collateral perfusion was significantly larger in asymptomatic patients (median: 30.53, interquartile range: 12.80–45.3 ml) than symptomatic patients (median: 17.55, interquartile range: 10.10–33.00 ml) (p = 0.0377). The interobserver ICC for collateral perfusion volume measurements was 0.854 (95% CI 0.772–0.906) (see Supplemental Figure 4).
In patients with available 3D FSPGR, grey matter volume of asymptomatic patients was significantly larger than that of symptomatic patients (p = 0.0243), while white matter volume showed no significant differences between groups (see Supplemental Figures 5 to 6).
Discussion
3D pCASL perfusion MRI demonstrates the degree of collateral perfusion measured by quantitative CBF in intracranial atherosclerotic disease, delineating the overt distinction between blood flow values in patients based on their symptomatic status. Compared with the asymptomatic group, patients with symptomatic MCA stenosis had lower CBF ipsilateral to the side of the arterial stenosis and a smaller collateral perfusion area on subtraction images between the two PLDs. This reflects the fact that collateral perfusion in asymptomatic patients is quantitatively more robust than that in symptomatic patients. Although all cases demonstrate decreased antegrade blood flow inferred by the absence of differences at the shorter PLD of 1.5s, the perfusion status may be compensated by retrograde blood flow via pial arteries from the ipsilateral anterior cerebral artery or posterior cerebral artery quantified at the later PLD. To the best of our knowledge, this is the first study to quantitatively evaluate and compare collateral circulation of patients with asymptomatic and symptomatic MCA stenosis.
In this study, we noticed that antegrade flow might be also delayed in normal side MCA territory in symptomatic patients, which might indicate the slow down of antegrade flow in bilateral hemisphere. 13 Delayed perfusion from PLD 1.5 to 2.5 s might contain slower antegrade flow than that of asymptomatic patients, reflecting the fact that collateral perfusion in asymptomatic patients was quantitatively more robust.
We also demonstrated that quantitative evaluation of collateral flow in patients with intracranial stenosis may be feasible with 3D pCASL MRI. ASL provides some unique features for the evaluation of collateral circulation. It is sensitive to both temporal (arterial bolus arrival) and perfusion information with varying PLD. Antegrade flow traverses a shorter path to the target downstream territory supplied by the stenotic vessel, so the early CBF predominantly reflects perfusion resulting from antegrade flow across the arterial stenosis. Whereas retrograde collateral flow travels through relatively longer and circuitous routes, and the later CBF reflects the combination of both retrograde collateral perfusion via pial anastomoses and some possible slow antegrade flow. 13 The subtracted difference of CBF between early and later PLDs therefore may reflect the relative contribution of retrograde collateral circulation and possible slow antegrade flow. There are a number of imaging methods to assess cerebral collateral flow, yet the vast majority utilize potentially subjective or qualitative grading scales for collateral assessment.17,18 CTA permits visualization of the extent of collateral flow. Its independent predictive value and interobserver agreement have been confirmed by several studies.19,20 CTA-source images can also reflect different profiles of cerebral collateral flow. Recently, in ischemic stroke, studies have shown that four-dimensional CTA better estimates the presence of collateral vessels than conventional CTA. 21 Quantifying collateral flow on CTA reconstructed images, CTA-source images or four-dimensional CTA remains difficult, especially for more distal occlusions.21,22 Fluid-attenuated inversion recovery (FLAIR) vascular hyperintensities due to retrograde flow in leptomeningeal vessels can provide some insights on collateral circulation.23,24 However, its inference is only qualitative and leptomeningeal enhancement on post-contrast imaging is difficult to quantify on FLAIR. 25 The reference standard for the anatomic evaluation of collateral circulation is DSA, which assesses all three major routes: extracranial to intracranial, through the circle of Willis, and via leptomeningeal vessels.4,26 The primary limitation of DSA is its invasive nature, as well as its reliance on iodinated contrast and ionizing radiation. Compared with these imaging modalities, ASL technique can avoid the invasive and ionizing radiation characteristics of DSA, and provides a potentially useful approach to stratify those individuals at risk of recurrent stroke in patients with symptomatic intracranial stenosis.
In the present study, we found significantly decreased grey matter volume in symptomatic patient group compared with asymptomatic patient group. The result may suggest a relationship between chronic ischemia and cortical atrophy. However, more studies are needed to validate the finding and further explore the pathophysiological effect of intracranial artery stenosis on the structural alternation of the brain.
In this study, there are no differences in the age, sex, risk factors, and the degree of stenosis between patients with asymptomatic and symptomatic MCA stenosis. In Asian population, asymptomatic patients with vascular risk factors frequently have significant degrees of intracranial stenosis, as reported by a TCD study that demonstrated MCA stenosis in 12.6% of at-risk individuals. 25
Additionally, the degree of stenosis was measured by DSA and/or CTA in this study. It is acceptable to measure the extent of intracranial stenosis with MRA, but overestimation occurs.26,27 For the detection of >50% stenosis, MRA offers good equivalency with DSA with reported sensitivity, specificity, and accuracy of 92%, 91%, and 91%, respectively, but falls short of the 100% and 99% sensitivity and specificity of CTA. 25
Several limitations to our study must be considered. Firstly, selection of symptomatic patients was based on clinical examinations and imaging evidence from symptom onset whereas asymptomatic patients cannot be determined except for clinical history. Delay from ischemic onset to imaging was eight days for symptomatic patients. However, this period cannot be determined for asymptomatic patients.
Secondly, the selected PLDs at 1.5 s and 2.5 s utilized in this study provide an initial empirical protocol for discerning flow status among these cohorts, yet the specific parameters in a given individual may be tailored to delineate the exact contributions of antegrade flow and collateral perfusion. Multi-delay ASL ATT maps derived from post-processing may be a useful method to resolve the optimal PLD of such blood flow sources.12,14
Thirdly, blood T1 is another parameter which will significantly affect the quantification of CBF in ASL besides PLD. With prolonged PLD, the label decays with blood T1, which may lead to SNR reduction and affect CBF quantification. In patients with intracranial artery stenosis, intra-arterial ASL signal accumulation, which is termed as ATA, is commonly seen and may result in overestimate of CBF, whereas blood T1 decay may decrease the degree and intensity of ATA. 28 Our previous work has demonstrated good intra- and interscanner reliability and reproducibility of CBF quantification with PLD of 1.5 s and 2.5 s, though the reproducibility was lower at shorter PLDs of 1.5 s. 8 Nevertheless, it is critical to minimize these effects resulting from PLD and blood T1 for CBF quantification in further investigations. Besides, these parameters will also affect the subtraction step. The reduction of SNR of 2.5 s PLD may produce unexpected subtracted signals especially in white matter because of its relative low flow and long transit time. We have adjusted the threshold of affected territory based on the unaffected territory to minimize this potential confounding factor.
Forth, it is hypothesized in our study that CBF acquired at early PLD reflects antegrade blood flow and CBF acquired at late PLD reflects both slow antegrade and retrograde collateral blood flow. Visualization of collateral perfusion may be achieved by subtracting perfusion images of two PLDs. However, we cannot differentiate slow antegrade flow from retrograde collateral flow using the two-delay ASL methodology in this study. Another promising ASL technique for assessing antegrade and collateral flow is vessel-selective or vessel-encoded ASL.29,30
Fifth, there may be potential confound induced by normalizing CBF maps of the relatively older population in this study onto the standard MNI template based on young adults. It is possible that patients with cerebrovascular diseases may have variations of cortical thickness or brain volume as revealed by the present study. The interpretations of results rely on the effectiveness and accuracy of the spatial registration algorithm for the common MNI template. Finally, the CBF was acquired in patients with unilateral MCA stenosis and this approach may be limited for those patients with multifocal intracranial atherosclerosis. Vessel-encoded ASL will also help to evaluate collateral perfusion in patients with multifocal stenosis.29,30
The current study demonstrated that two-delay 3D pCASL can quantitatively distinguish the role of collateral perfusion in intracranial atherosclerosis, differentiating symptomatic from asymptomatic individuals. Prospective studies are indicated to investigate whether this technique can effectively stratify therapeutic strategies for those individuals at high risk of recurrent stroke.
Footnotes
Funding
The author(s) disclosed receipt of the following financial support for the research, authorship, and/or publication of this article: This work was supported by The National Key Research and Development Program of China (Contract grant number: 2016YFC01001004 to X.L.) and The National Natural Science Foundation of China (Contract grant number: 81671126 to X.L., and Contract grant number: 81471390 to N.M.).
Acknowledgments
We thank Bing Wu, PhD, Yingkui Zhang, PhD, and Kaining Shi, PhD, at Applied Science Laboratory GE Healthcare, for their help in improvement of MRI protocol. We thank Dr Linfeng Zhang, MD, PhD, at Department of Epidemiology, the Cardiovascular Institute, Fu Wai Hospital of the Chinese Academy of Medical Sciences and Peking Union Medical College, and the National Center for Cardiovascular Disease Control and Research, Beijing, China, 100037, for his help in statistical analysis.
Declaration of conflicting interests
The author(s) declared no potential conflicts of interest with respect to the research, authorship, and/or publication of this article.
Authors' contributions
Guarantors of integrity of entire study, XL and LM; study concepts/study design or data acquisition or data analysis/interpretation, all authors; manuscript drafting, XL, XXM, and DSL; approval of final version of submitted manuscript, all authors; literature research, XL; clinical study, XL, XXM, LM, NM, CLT, J H L; statistical analysis, XL, XXM, and LM; and manuscript editing, XL, XXM, DSL and DJJW.
References
Supplementary Material
Please find the following supplemental material available below.
For Open Access articles published under a Creative Commons License, all supplemental material carries the same license as the article it is associated with.
For non-Open Access articles published, all supplemental material carries a non-exclusive license, and permission requests for re-use of supplemental material or any part of supplemental material shall be sent directly to the copyright owner as specified in the copyright notice associated with the article.