
Abstract
Cognitive impairment is an inevitable feature of cerebral autosomal-dominant arteriopathy with subcortical infarcts and leukoencephalopathy (CADASIL), affecting executive function, attention and processing speed from an early stage. Impairment is associated with structural markers such as lacunes, but associations with functional connectivity have not yet been reported. Twenty-two adults with genetically-confirmed CADASIL (11 male; aged 49.8 ± 11.2 years) underwent functional magnetic resonance imaging at rest. Intrinsic attentional/executive networks were identified using group independent components analysis. A linear regression model tested voxel-wise associations between cognitive measures and component spatial maps, and Pearson correlations were performed with mean intra-component connectivity z-scores. Two frontoparietal components were associated with cognitive performance. Voxel-wise analyses showed an association between one component cluster and processing speed (left middle temporal gyrus; peak −48, −18, −14; Z
Introduction
Cerebral autosomal-dominant arteriopathy with subcortical infarcts and leukoencephalopathy (CADASIL), the most common monogenic cerebral small vessel disease (SVD), is a systemic vasculopathy caused by mutations of the NOTCH3 gene, which encodes a receptor expressed in vascular smooth muscle cells and in pericytes of brain arteries and capillaries. 1 The disorder manifests clinically as a diffuse leukoencephalopathy with liability to recurrent stroke and mood disturbance. CADASIL is associated with cognitive impairment, principally in the domains of processing speed, executive function and attention.2–4 Cognitive deficits in CADASIL have been shown to correlate with structural brain measures including lacunes and atrophy,5–8 echoing findings in patients with sporadic SVD.9–11 White matter tract integrity on diffusion tensor imaging is associated with cognitive function in CADASIL 12 and other diffuse white matter pathologies including sporadic SVD and multiple sclerosis (MS),11,13–15 and it has been proposed that this reflects ‘disconnection’ of cognitive networks.13,16
Speed, attention and executive function depend on subcortical-frontal and frontoparietal networks.17,18 With the advent of connectivity analysis methods being applied to resting state functional magnetic resonance imaging (fMRI) data, it has been possible to delineate a number of intrinsic functional networks that are found consistently in healthy subjects at rest.19,20 Connectivity within these networks correlates with behavioural measures obtained outside the scanning environment.21–23
There are, however, few studies of functional connectivity and cognition in patients with white matter disease. Functional connectivity has potential to be an informative biomarker for cognitive function in CADASIL, since structural MRI changes evolve slowly.24–26 CADASIL may also serve as a model to understand the relationship between cerebrovascular pathology and cognitive impairment: in patients with sporadic SVD, this association is likely to be confounded by age and comorbid cerebral pathology (e.g. of Alzheimer’s type), 27 whereas patients with CADASIL show cognitive impairment in middle adulthood even in the absence of other risk factors. Research in the CADASIL population may enable clearer conclusions to be drawn about the direct effects of SVD on cognitive function, thereby elucidating causal mechanisms and potential targets for prevention or treatment.
Our research questions were:
In patients with CADASIL, is it possible to identify resting state functional networks that correspond to those associated with attention and executive function in the healthy population? Is there an association between functional connectivity in these networks and performance on measures of speed, attention and executive function obtained outside the scanner?
Materials and methods
Participants
Participants were adults with CADASIL who were taking part in an ongoing 3-year longitudinal study of cerebral and peripheral haemodynamics (University of Glasgow, Scotland; UKCRN reference 13794). Inclusion criteria were (a) 18 years of age or older, (b) genetic diagnosis of CADASIL and (c) able to give informed consent. Exclusion criteria were (a) co-existent severe untreated depression or degenerative neurological disease unrelated to CADASIL, (b) contraindications to MRI and (c) treatment with angiotensin-converting enzyme inhibitors or calcium channel blockers (due to vasoreactivity studies in the protocol). The study was conducted in accordance with the Declaration of Helsinki and was approved by the West of Scotland Research Ethics Service (reference WS/12/0295). All participants gave written informed consent.
Clinical assessment
Clinical information, including medical history, history of stroke, cardiovascular risk factors and medication, was recorded on a standardised case report form. Structured neurological examination in the form of the National Institutes of Health Stroke Scale 28 was conducted by a clinical research fellow in neurology (F.C.M.), along with an assessment of disability (modified Rankin scale) 29 and the Hospital Anxiety and Depression Scale (HADS; GL Assessment Ltd, London). 30
Neuropsychological assessment was carried out over one or two sessions by a specialist clinical neuropsychologist (B.C.), and included standardised tests of estimated premorbid ability, global cognitive function, processing speed, verbal and visual attention and working memory, verbal and visual episodic memory, visuospatial function, verbal fluency, verbal reasoning and executive function. Because the present study was focused on speed, attention/working memory and executive function, these domains were chosen a priori for analysis. Composite domain scores were derived from individual tests by converting raw scores to standardised scores (corrected for age, or age and education, with reference to published normative tables) and calculating the mean of scores within a particular cognitive domain. Higher composite scores represent better performance.
The processing speed composite score was the mean of z-scores on the Symbol-Digit Modalities Test (SDMT, written version) 31 and Trailmaking Test Part A. 32 The attention/working memory composite score was the mean of scale scores on the forward and backward Digit Span sub-tests from the Wechsler Adult Intelligence Scale (WAIS-IV) 33 and the Symbol Span sub-test from the Wechsler Memory Scale (WMS-IV). 34 The executive function composite score was the mean of z-scores on the Similarities sub-test from the WAIS-IV, 33 FAS letter fluency test, 35 Trailmaking Test Part B 32 and Stroop Neuropsychological Screening Test. 36 Trailmaking B minus A time was also analysed separately (measured in seconds, with higher values indicating worse performance), as this has been shown to correlate with frontoparietal network connectivity in the healthy population. 23
MRI protocol and quantitative measures
Participants underwent MRI on a 3T Signa scanner (GE Healthcare; Waukesha, WI, USA) within several weeks of the neuropsychological assessment (mean interval = 45 days, SD = 30).
A 10-minute T2*-weighted EPI BOLD scan was acquired at rest (repetition time = 2000 ms, echo time = 30 ms, flip angle = 78°, slice thickness = 3.5 mm, interslice gap = 1.0 mm, matrix = 64 × 64 × 40; FOV =224 × 224 × 179 mm3), with participants instructed to close their eyes and stay awake.
Structural scans performed as part of the main study protocol were used to quantify lesion load and brain volume. These included a three-dimensional T1-weighted BRAVO sequence (repetition time = 9000 ms, echo time = 3.6 ms, inversion time = 450 ms, flip angle = 12°, matrix = 320 × 320 × 156, FOV = 240 ×240 × 156 mm3; acquisition time = 4 min 28 s) and fluid-attenuated inversion recovery sequence (T2-FLAIR; repetition time = 10 s, echo time = 140 ms, inversion time = 2250 ms, flip angle 90°, slice thickness = 5 mm, interslice gap = 1.5 mm, matrix 384 ×256, FOV = 240 × 240 mm2; acquisition time = 3 min 20 s).
Lacunes were defined radiologically as hypointense areas between 3 and 15 mm on T1-weighted and FLAIR sequences. 37 Enlarged perivascular spaces, identified as fluid-filled cavities which were dot-like (<3 mm) when perpendicular and linear when parallel to the imaging plane, were excluded. 38 Lacunes were identified and their volume calculated on T1-weighted images using 3D thresholding tools (Analyze v11.0; http://analyzedirect.com/); this was performed by one rater (F.C.M.) on two occasions (intraclass correlation (ICC) = 0.94; 95% confidence interval (CI) 0.85, 0.97) and the second rating was used in the analysis. Lacune volume was normalised to intracranial cavity volume (nLV, %), which was calculated using tools from FMRIB Software Library (FSL v5.0; http://fsl.fmrib.ox.ac.uk/fsl/). 39 Signal abnormalities in white matter, grey matter and brainstem showing hyperintensity on FLAIR were termed subcortical hyperintensities (SH). A skull-stripped FLAIR image was created,39–41 and the mode intensity of this image, multiplied by 1.3, was used to threshold the image, with manual editing if required 42 to create SH maps. This was performed by one rater (F.C.M.); reliability of repeat measurements on a sub-sample of five scans was high (ICC = 0.99; 95% CI 0.99, 1.00). SH volume was normalised (nSH, %) to parenchymal volume. Normalised brain volume (nBV), normalised for subject head size, was calculated on T1-weighted images using SIENAX, 43 part of FSL. 39
Independent components analysis
The resting state fMRI scans were pre-processed using SPM8 (http://www.fil.ion.ucl.ac.uk/spm/). For each participant, the functional images were realigned, co-registered to the participant’s 3D T1-weighted image, segmented and spatially normalised to 2 mm cubic voxels in MNI space, and smoothed with an 8 mm full-width at half-maximum Gaussian kernel.
Spatial independent components analysis (ICA) was then performed on the group data; this identifies temporally coherent functional networks by decomposing linearly mixed signal timecourses into maximally independent spatial sources. As a purely data-driven method, ICA does not depend on prior knowledge about expected signal timecourse 44 and it avoids the need for a priori selection of regions of interest, as required in seed-based methods. 45 Group ICA was conducted using the GIFT toolbox (http://mialab.mrn.org/software/gift/); further details are provided in the Supplementary Methods. This analysis produced individual subject spatial maps and timecourses for each independent component (IC), as well as mean maps and timecourses for the whole sample.
For identification, the mean IC maps were visually compared with components identified in a previous study by Allen et al. of a large sample of healthy subjects, 46 to identify components of interest within attentional and executive networks. This was done by two authors independently (B.C. and F.C.M.), followed by consensus discussion with a third author (R.K.). Spatial correlations were also computed in GIFT between our components of interest and unthresholded t-maps of the corresponding components from the Allen et al. study 46 to confirm the visual identifications.
Voxel-wise analyses
The individual subject spatial maps for each component of interest were further analysed using SPM8. Each voxel in the spatial map has a z-score value, which represents the strength of that voxel’s contribution to the timecourse of the component; voxel values can be taken as indicating the strength of connectivity within a particular component. Voxel-wise regression analyses were performed between each component map of interest (unthresholded) and each cognitive score (processing speed, attention/working memory, executive function and Trailmaking B minus A). Although the SPM8 regression model assigns the spatial map data as the dependent variable, bivariate analyses can be interpreted as correlations. The threshold for statistical significance was p < 0.05 with family-wise error (FWE) correction and a minimum extent of five contiguous voxels.
Region of interest analyses
For each attentional/executive component of interest, a one-sample t-test was carried out in SPM8 to determine the threshold that was statistically significant (FWE-corrected p < 0.05) across all individual subject component maps. For all voxels that were above this threshold, the mean voxel z-score value was then computed for each subject, using a program implemented in MATLAB v2014a (http://uk.mathworks.com/products/matlab/). This provided a single overall measure of connectivity within a particular component for each participant, allowing us to treat the component as a region of interest (ROI) in subsequent analyses. Pearson correlations were computed between these mean connectivity scores and each cognitive measure. Correlations were also computed among the structural MRI measures (nLV, nSH, nBV), mean connectivity scores and cognitive scores. The threshold for statistical significance was p < 0.05. These analyses were conducted in Stata 13 (http://www.stata.com/stata13/). Exploratory mediation analyses were conducted to analyse relationships between structural, functional and cognitive measures, using the PROCESS macro (http://www.processmacro.org/) for SPSS v22 (https://www-01.ibm.com/software/analytics/spss/products/statistics/features.html); further details are provided in the Supplementary Methods.
Effects of motion artefact
Framewise displacement (FD) 47 was calculated using a program implemented in MATLAB (http://becs.aalto.fi/∼eglerean/bramila.html). FD is a time series of the sum of the absolute values of the derivatives of the six realignment parameters that were generated during fMRI image pre-processing, and provides an overall indication of head motion during scanning for each participant. No participant had a mean FD value exceeding 0.25. No significant correlations were observed between mean FD and any of the cognitive measures, or between mean FD and mean connectivity values in the components of interest. Motion parameters were therefore not included in analyses involving the mean connectivity values (i.e. ROI analyses). For some individual participants, significant correlations were seen between the FD time series and the timecourse of some components of interest. Significant voxel-wise analyses were therefore repeated with mean FD included as a regressor of no interest.
Results
Sample characteristics
Demographic and clinical characteristics of the sample.
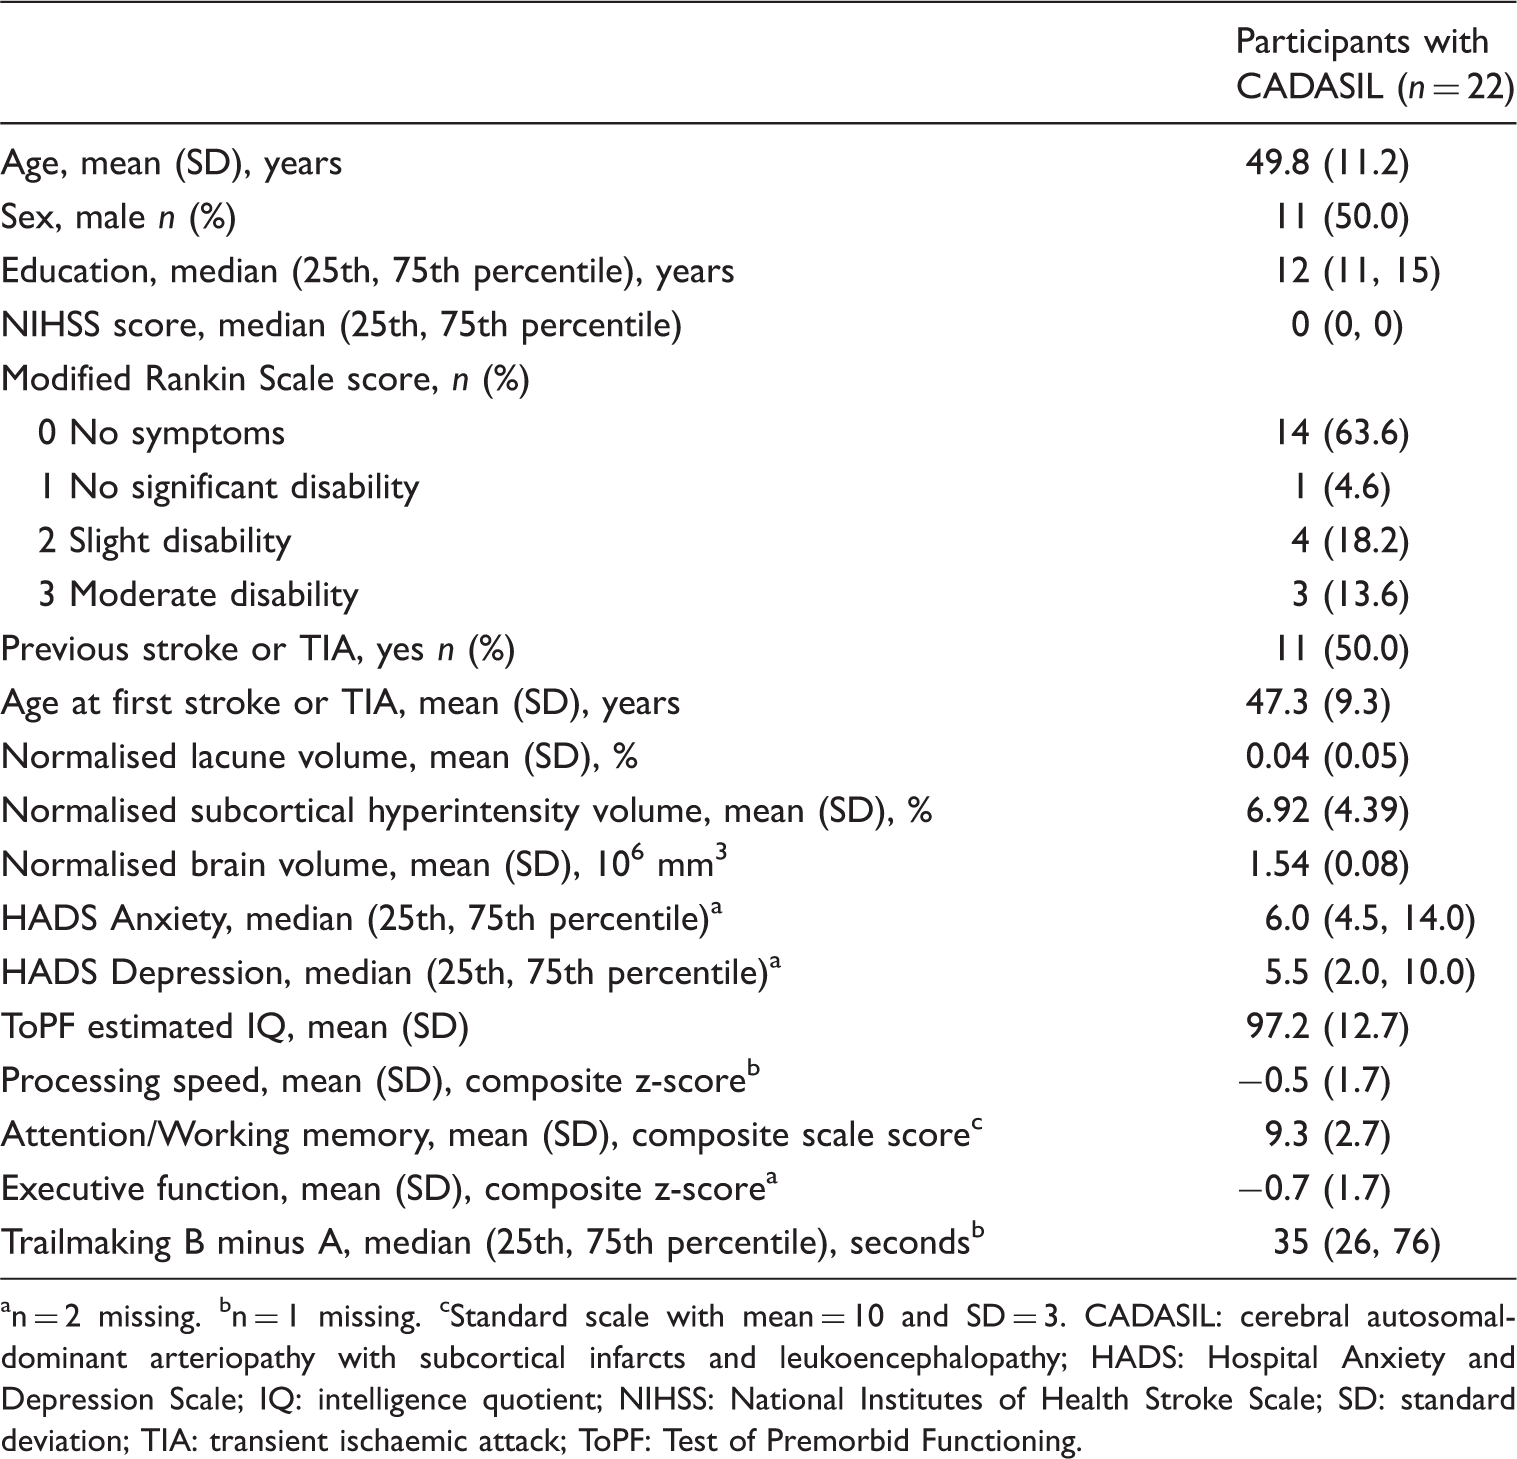
n = 2 missing.
n = 1 missing.
Standard scale with mean = 10 and SD = 3.
CADASIL: cerebral autosomal-dominant arteriopathy with subcortical infarcts and leukoencephalopathy; HADS: Hospital Anxiety and Depression Scale; IQ: intelligence quotient; NIHSS: National Institutes of Health Stroke Scale; SD: standard deviation; TIA: transient ischaemic attack; ToPF: Test of Premorbid Functioning.
Since cognitive scores were already adjusted for education and/or age, and scores did not differ by sex, no statistical adjustment for these variables was necessary in the analyses reported below.
Independent components analysis
Peak activations of component spatial maps.
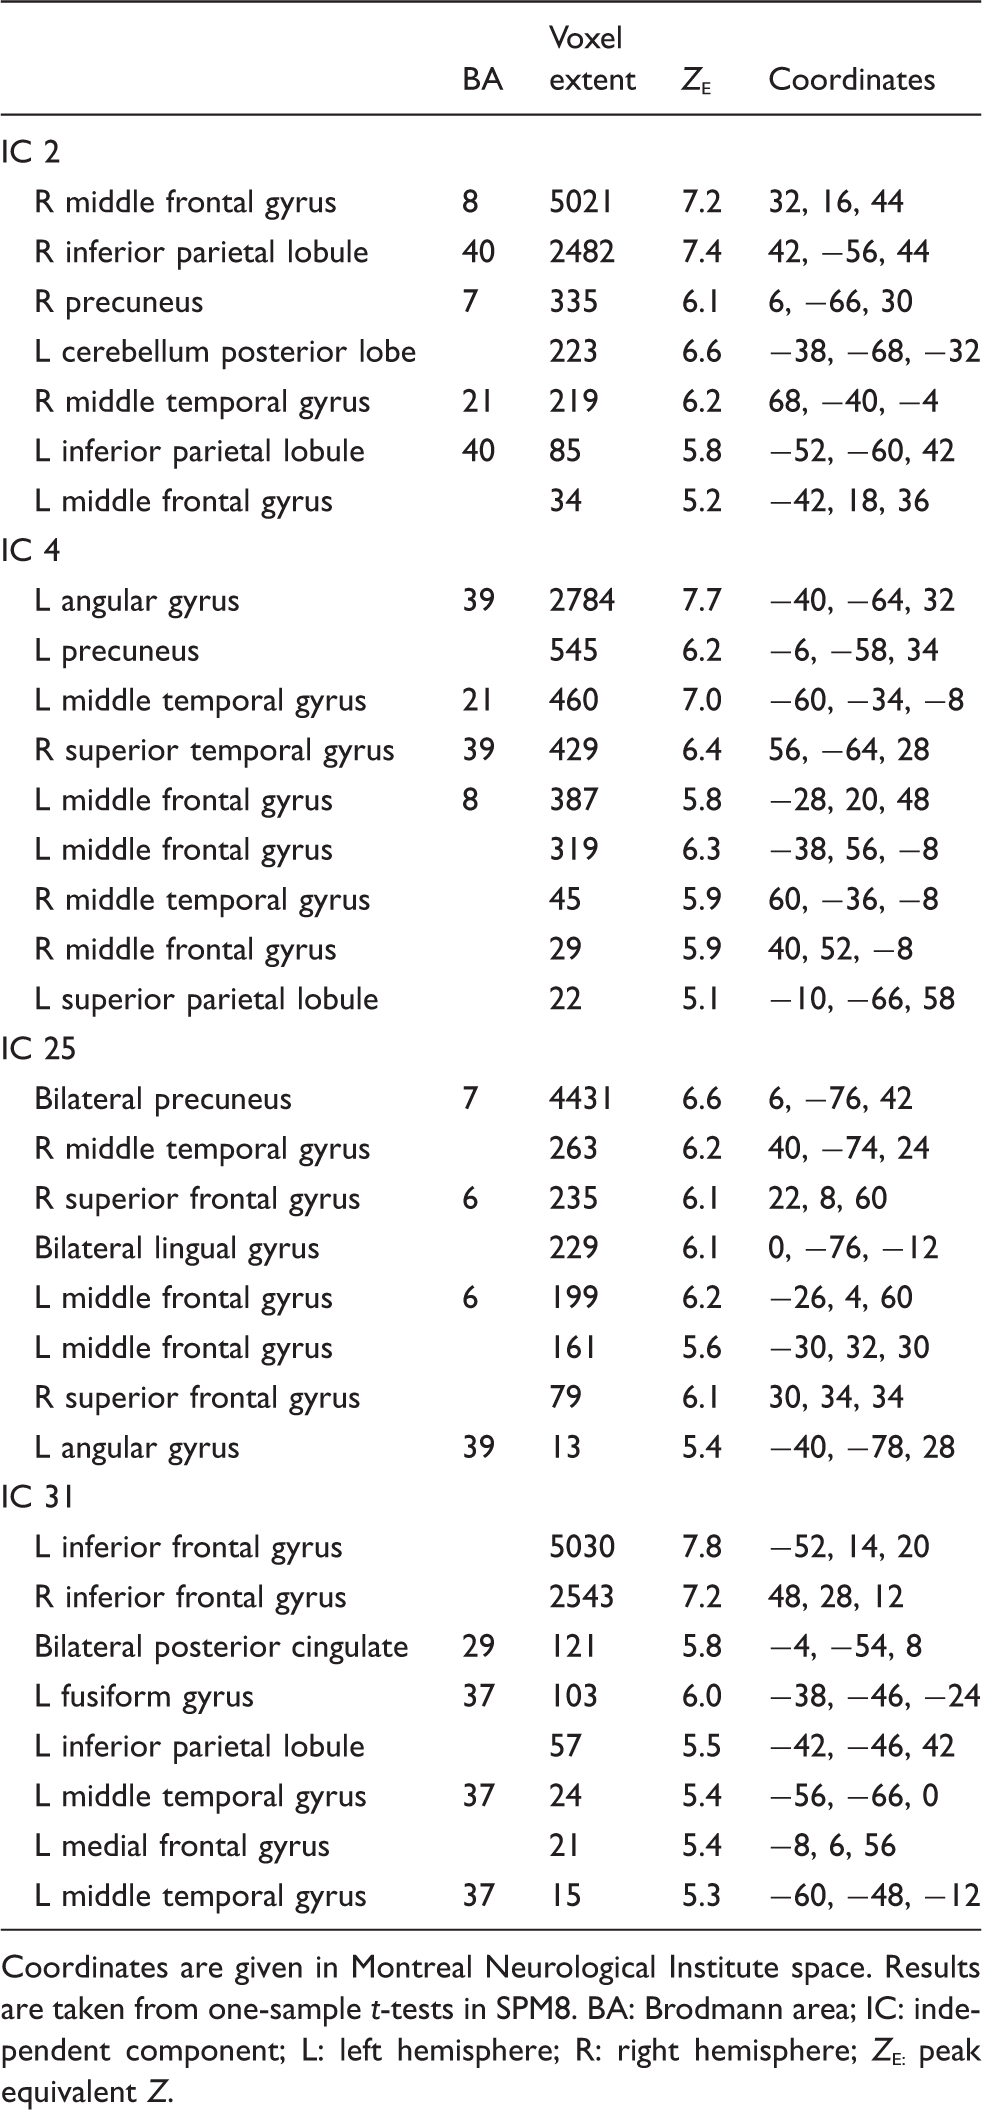
Coordinates are given in Montreal Neurological Institute space. Results are taken from one-sample t-tests in SPM8.
BA: Brodmann area; IC: independent component; L: left hemisphere; R: right hemisphere; Z
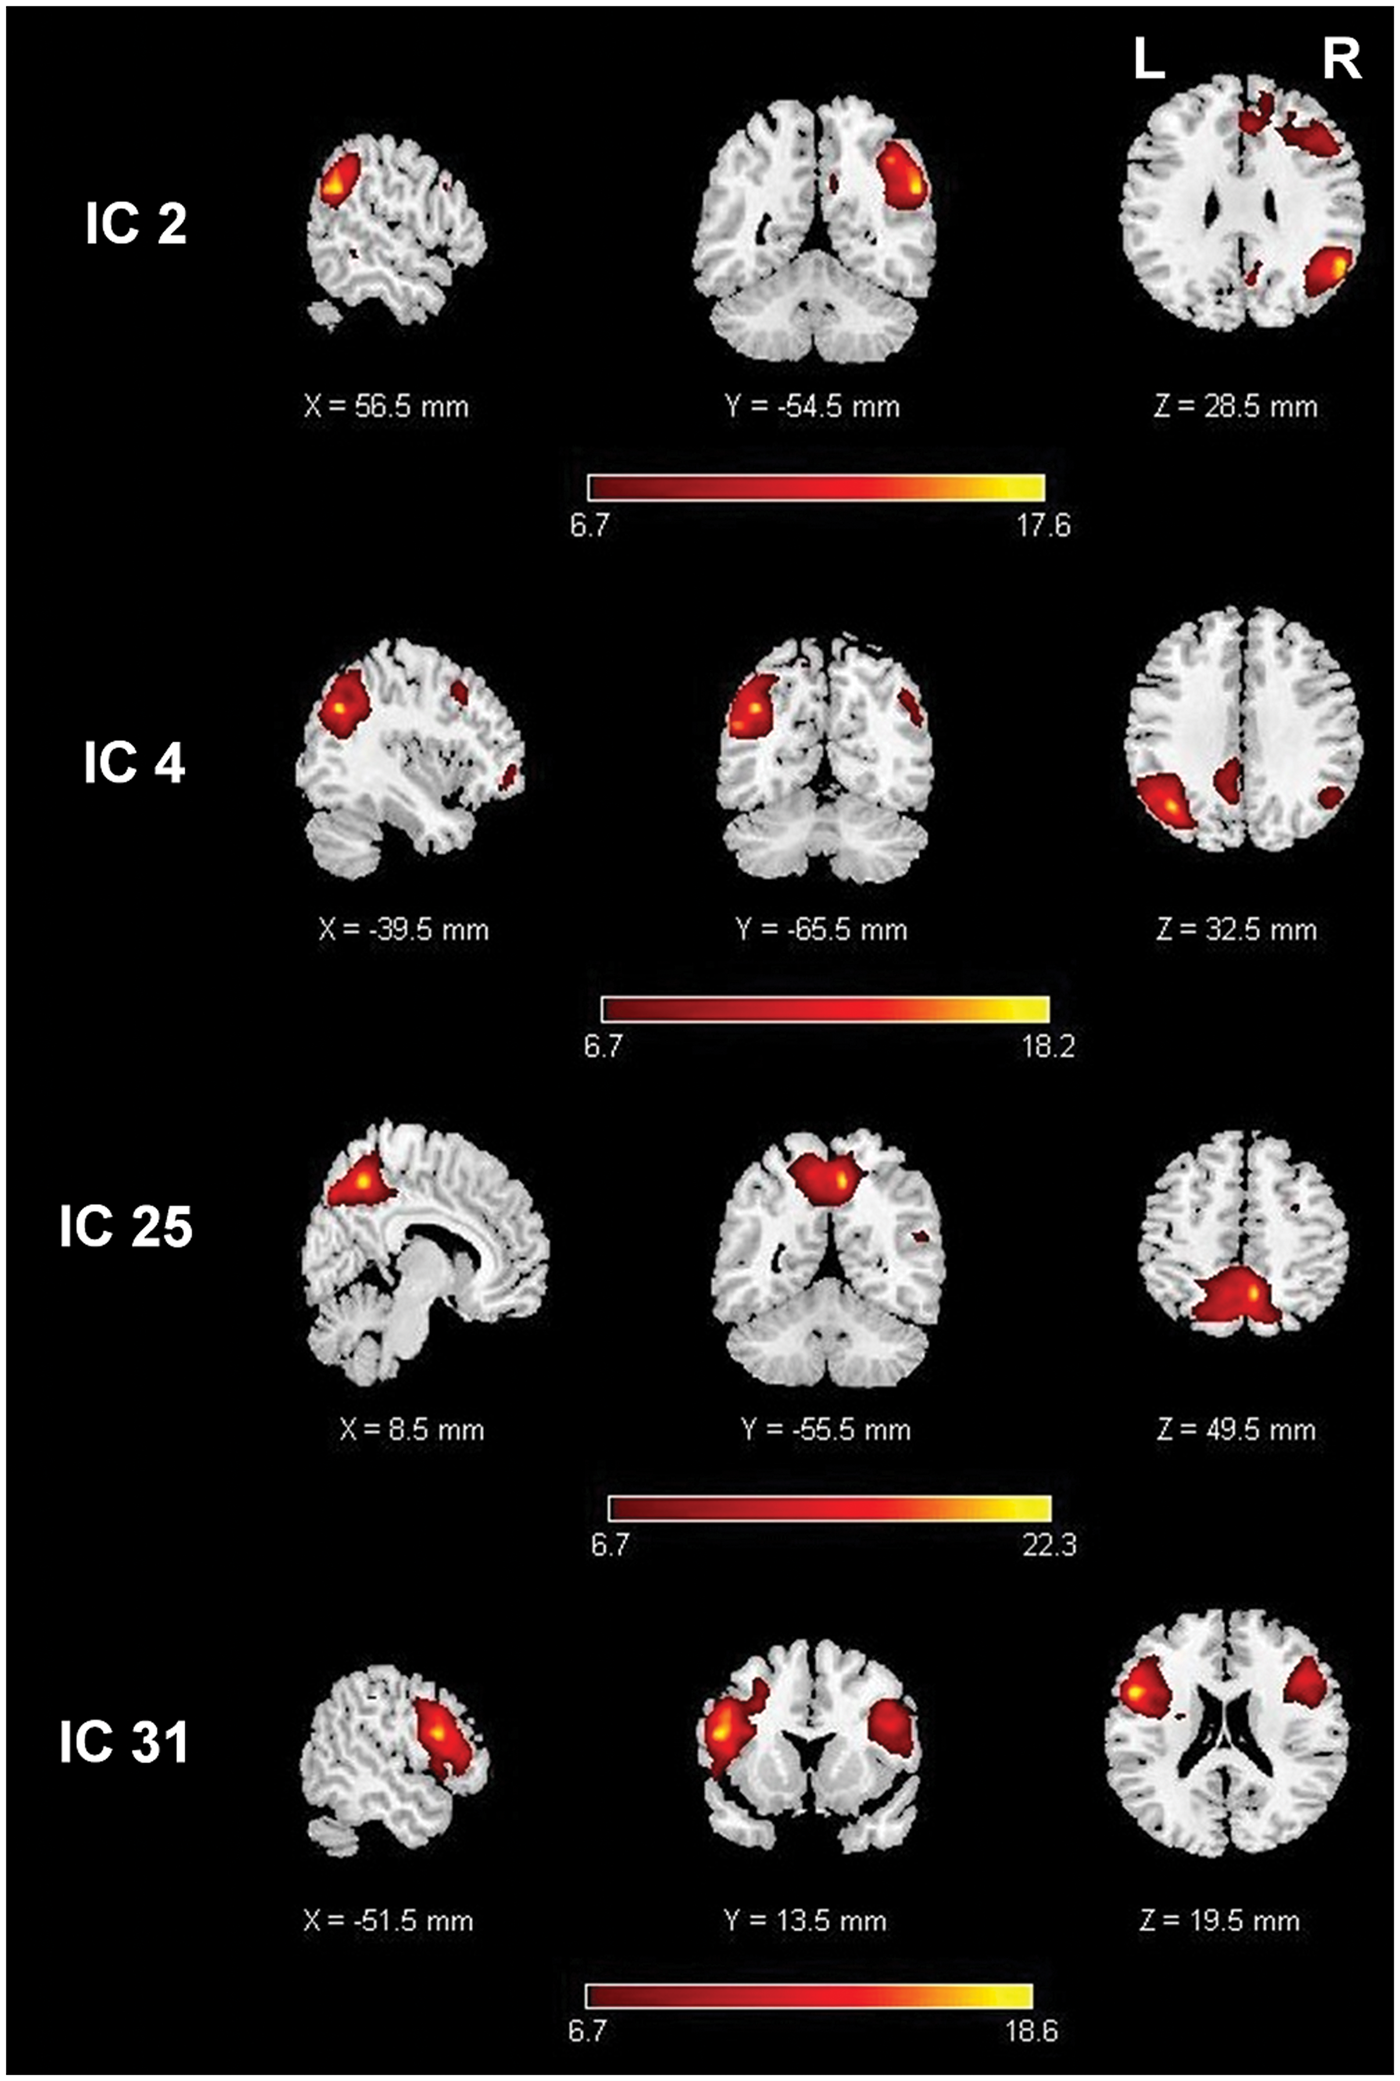
Independent component spatial maps. Images are t-maps, thresholded at the statistically significant value from the one-sample t-test.
Voxel-wise analyses
Regression analyses of subject spatial maps for each component with each cognitive measure yielded no significant associations for IC 2, IC 25 or IC 31. IC 4 connectivity was associated with faster processing speed (left middle temporal gyrus; peak coordinates −48, −18, −14; Z
Region of interest analyses
Correlations between structural, connectivity and cognitive measures.
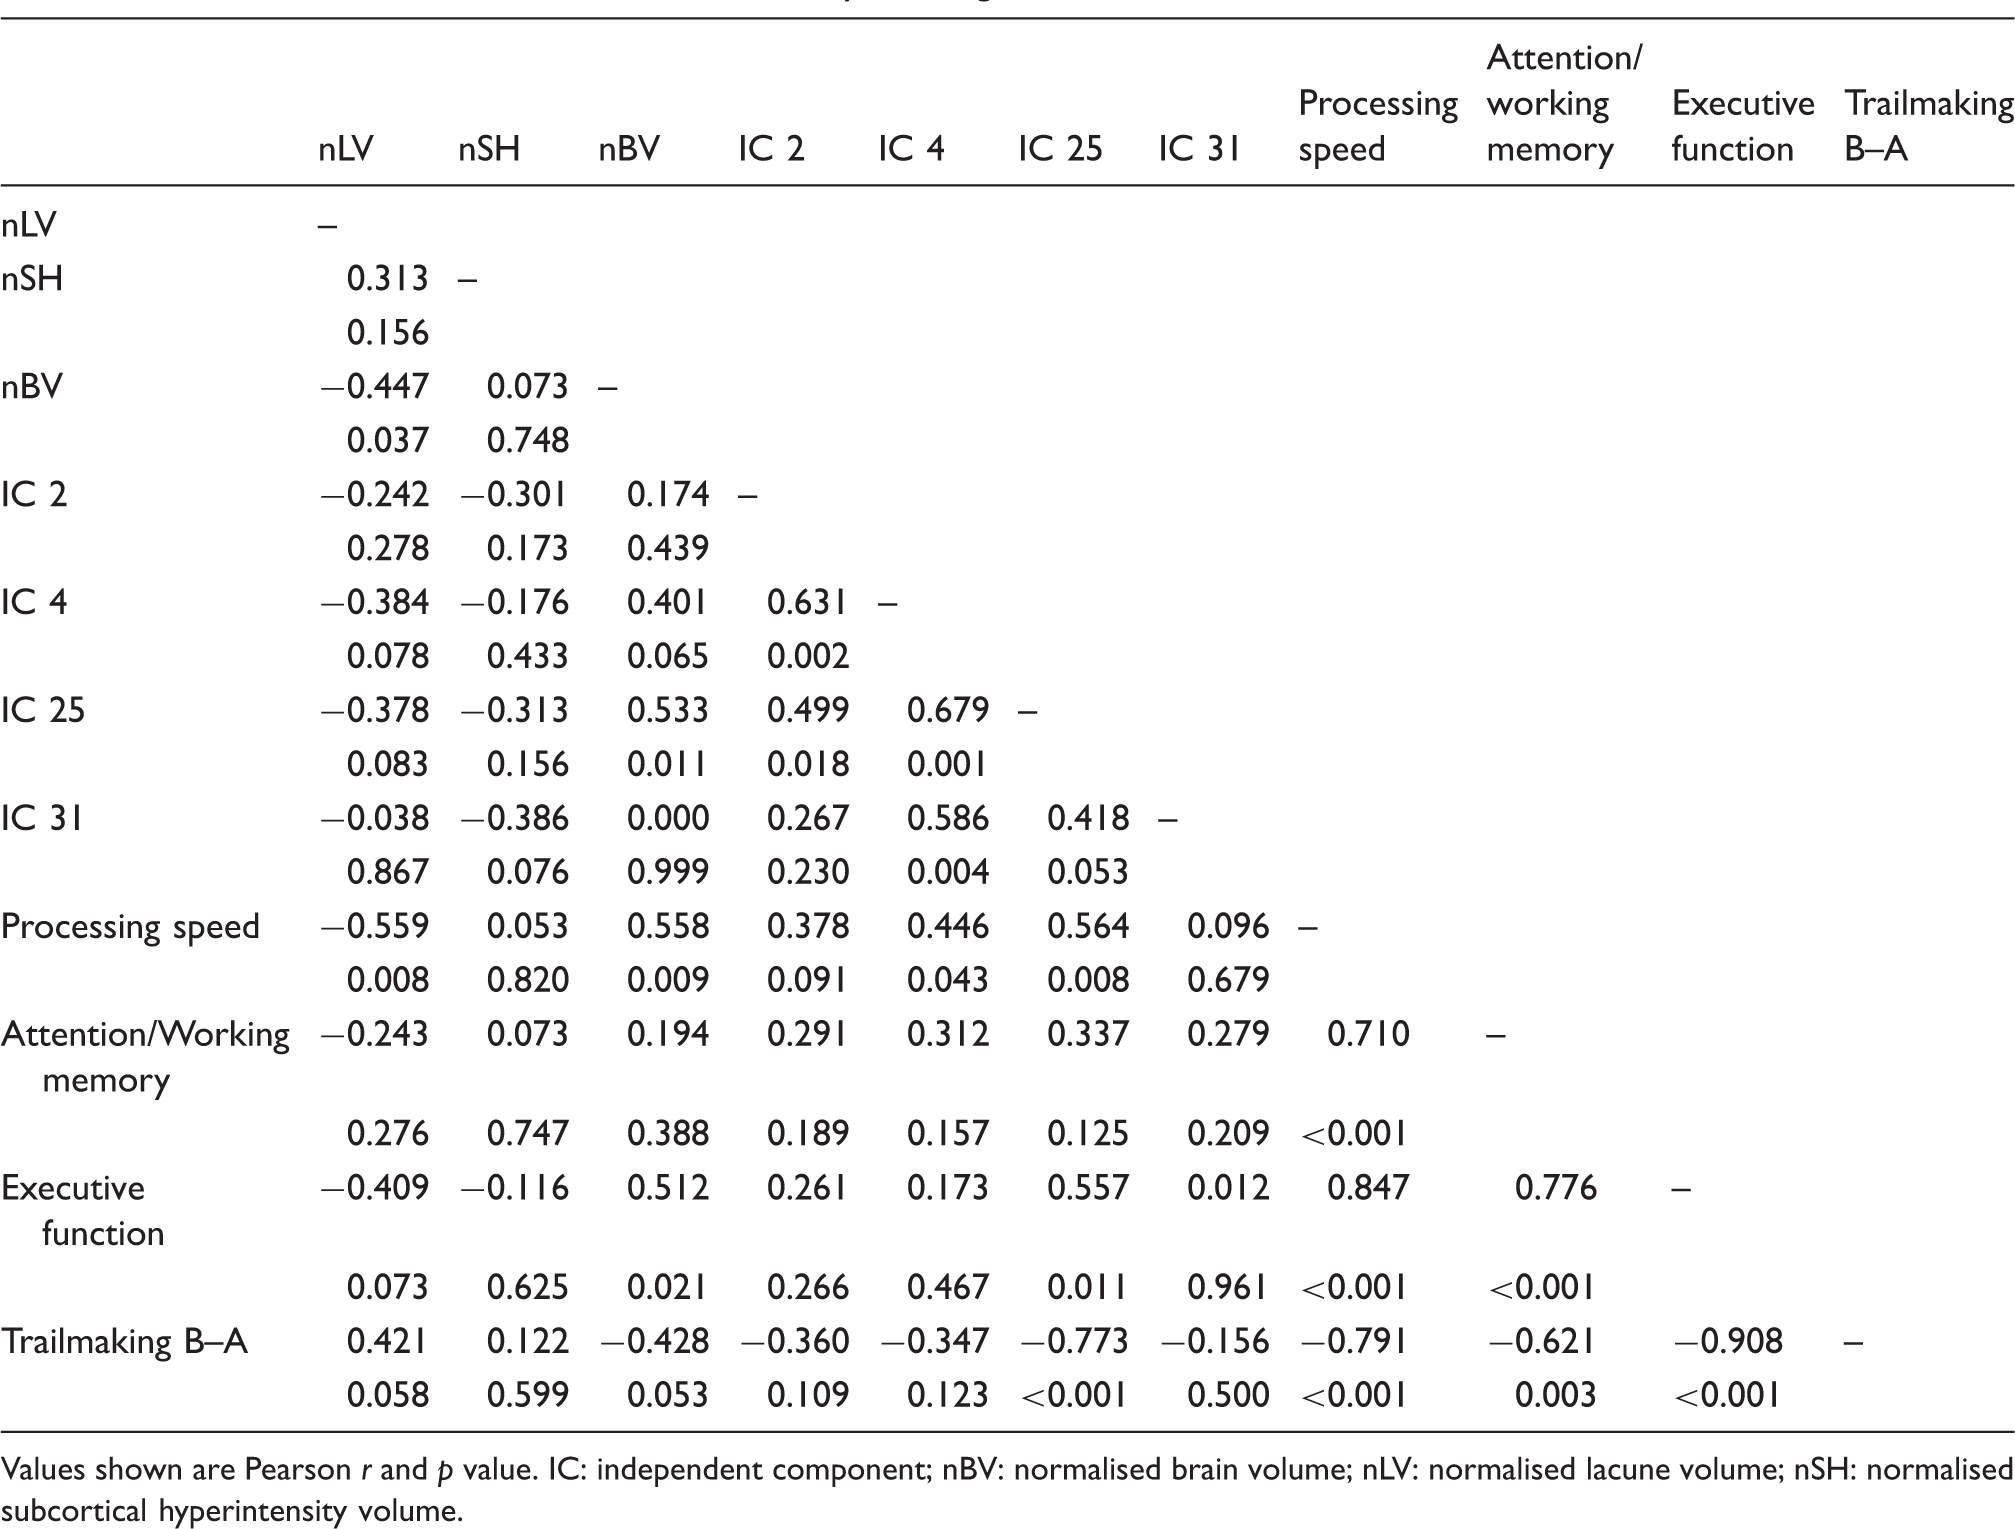
Values shown are Pearson r and p value.
IC: independent component; nBV: normalised brain volume; nLV: normalised lacune volume; nSH: normalised subcortical hyperintensity volume.
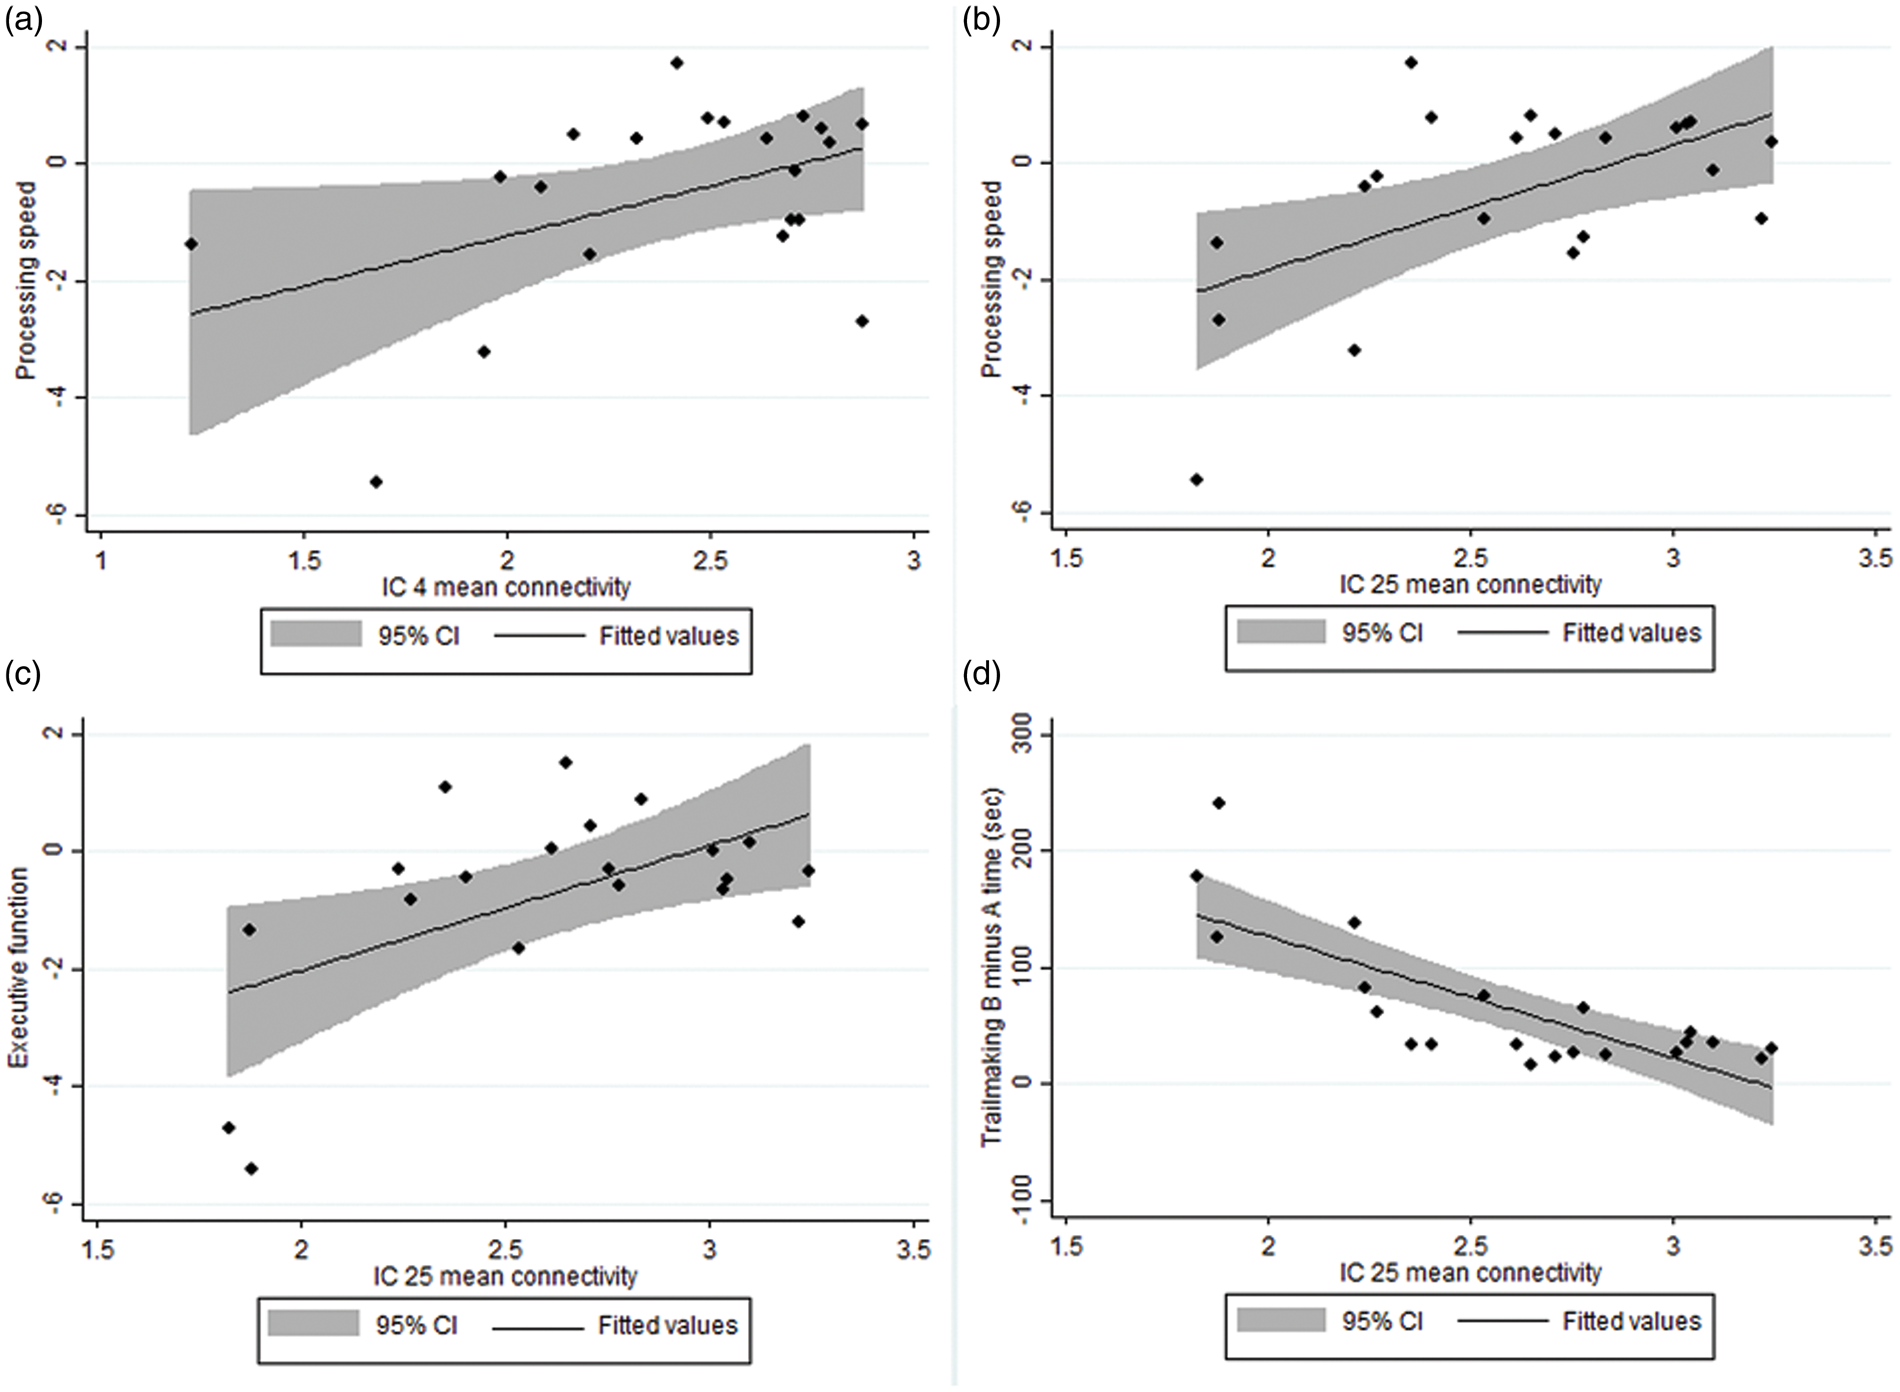
Significant correlations between mean connectivity z-scores and cognitive measures. (a) IC 4 and processing speed; r = 0.45, n = 21, p = 0.043. (b) IC 25 and processing speed; r = 0.56, n = 21, p = 0.008. (c) IC 25 and executive function; r = 0.56, n = 20, p = 0.011. (d) IC 25 and Trailmaking B minus A time; r = − 0.77, n = 21, p < 0.001.
Mediation analysis was used to explore the nature of these relationships, by modelling a path between the structural measure and cognitive performance, with functional connectivity as the intermediate variable. In light of the small sample size, these analyses were exploratory in nature. One model provided evidence of a mediation effect: the association between normalised lacune volume and Trailmaking B minus A time was attenuated after controlling for IC 25 connectivity (Figure 3).
Association between normalised lacune volume and Trailmaking B minus A time, as mediated by IC 25 mean connectivity. Coefficients are standardised beta values. Coefficient c is the total effect of normalised lacune volume on Trailmaking B minus A time, and c’ is the direct effect after controlling for IC 25 mean connectivity. The indirect effect (a*b) is 0.33 (bootstrapped standard error = 0.23).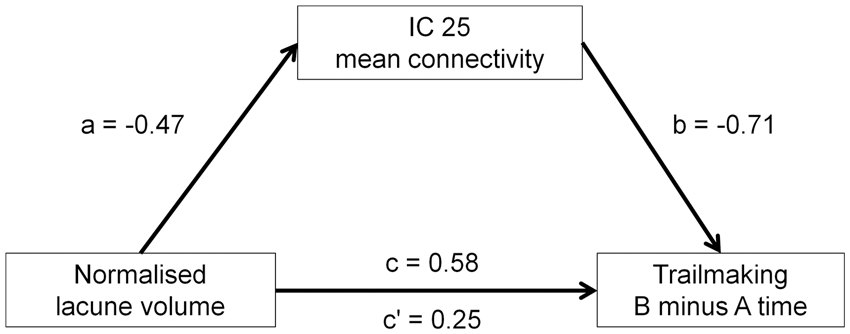
Discussion
This is the first study to investigate the relationship between resting state functional connectivity and cognitive performance in CADASIL. Associations between cognitive measures and frontoparietal network connectivity in our sample were consistent with previous studies in healthy adults and those with sporadic SVD. Seeley et al. 23 showed that in healthy adults, connectivity within a frontoparietal network at rest was significantly associated with Trailmaking test performance outside the scanner, and Reineberg et al. 22 demonstrated distinct patterns of connectivity associated with overall and set-shifting aspects of executive function. Research in patients with cerebral SVD has indicated that reduced functional connectivity in frontoparietal and cingulate regions correlates with neuropsychological dysfunction.48,49 Our findings demonstrate that intrinsic frontoparietal functional networks are also detectable in patients with CADASIL and are associated with similar cognitive measures, particularly tests of speed and executive ability.
We also found that structural brain changes were correlated with cognitive performance. In line with the previous literature, greater lacune volume and smaller brain volume were associated with impaired processing speed and executive function in our sample. It has been postulated that ‘disconnection’ underlies the cognitive impairment commonly observed in diffuse white matter disease,13,16 and we would suggest that reduced functional connectivity can be conceptualised as an intermediate stage on the causal pathway between structural lesion development and cognitive dysfunction. Our study lacked power to investigate these relationships robustly, but we did find preliminary support for a mediating effect of connectivity in a bilateral frontoparietal network (IC 25) on the association between lacune volume and Trailmaking performance. Modelling the proposed pathway from structural pathology to functional disconnection to cognitive impairment will be an important goal for future studies. Our results indicate that informative measures can be derived for each stage of the pathway, and the addition of other intermediate measures such as diffusion tensor imaging and tractography will allow the relationship between structural and functional connectivity to be better delineated.
We note that the results of our voxel-wise and ROI analyses differed from each other in some respects. This may be a consequence of the thresholds applied: the mean component z-scores for the ROI analyses were thresholded with the one-sample t-test result (i.e. strictly defined), whereas the whole-brain voxel-wise analyses were not. Relatively weaker associations on ROI analysis may indicate that effects are confined to certain small clusters only, and hence are only detectable in voxel-wise analyses. Conversely, relatively stronger results on ROI analysis (as seen for IC 25) may suggest a widely dispersed effect across the component but without attaining significance at the required level in any single cluster. We also note that confounding effects of motion artefact need to be considered, particularly in research with clinical populations. Motion may be associated with clinical indices (e.g. if patients who are more disabled are less able to tolerate scanning). This may potentially confound associations between functional MRI data and outcome measures of interest, even when data have been collected at different times, as was the case in the present study.
There were a number of limitations to this study. The absence of a healthy comparison group meant we were unable to assess whether functional connectivity measures were abnormally reduced in the patient sample. The small sample size reduced the power to detect significant effects, and precluded robust multivariate analyses. Multiple statistical tests were conducted between the various structural, functional and cognitive measures, although we aimed to reduce the likelihood of spurious results by choosing cognitive scores a priori and limiting the analyses to only those networks that clearly matched attention or executive networks reported in a previous large study. 46 Reduced dexterity may have affected participants’ performance on the processing speed tests—thereby reflecting physical rather than cognitive dysfunction—but written tasks were not administered to participants who had clear problems using a pen. The use of a z-score transformation to produce composite cognitive scores has limitations where the original score distribution was skewed. The MRI and neuropsychological assessments were conducted several weeks apart, but progression of CADASIL over such a short interval is highly unlikely in the absence of clinical stroke or hospital admission, which affected none of our patients between the two visits. Our findings will not necessarily be replicable in other CADASIL patients, e.g. those with more severe structural brain pathology where ICA methods may not be successful.
Future studies in larger samples will be able to use multivariate methods to model the proposed causal pathway from structural integrity to functional connectivity to cognitive outcome. It will also be possible to investigate changes in these measures longitudinally, which we aim to do by following up this sample annually. If future research shows functional connectivity to be predictive of cognitive status, then resting state connectivity may be a useful biomarker of neuropsychological outcome in CADASIL; not all patients with CADASIL will be capable of undertaking cognitive assessment, but resting state fMRI could be a quick and potentially informative way to measure the integrity of distributed brain systems that underpin cognitive performance.
Footnotes
Funding
The author(s) disclosed receipt of the following financial support for the research, authorship, and/or publication of this article: This study was funded by the Scottish Executive Health Department (Chief Scientist Office), reference ETM/244.
Declaration of conflicting interests
The author(s) declared no potential conflicts of interest with respect to the research, authorship, and/or publication of this article.
Authors' contributions
Study conception and design: Cullen, Moreton, Krishnadas, López-González, Santosh, Schwarzbauer, Muir; acquisition of data: Cullen, Moreton, López-González, Santosh; analysis and interpretation of data: Cullen, Moreton, Stringer, Krishnadas, Kalladka, Schwarzbauer, Muir; drafting the article and revising it critically for important intellectual content: all authors; final approval of the version to be published: all authors.
References
Supplementary Material
Please find the following supplemental material available below.
For Open Access articles published under a Creative Commons License, all supplemental material carries the same license as the article it is associated with.
For non-Open Access articles published, all supplemental material carries a non-exclusive license, and permission requests for re-use of supplemental material or any part of supplemental material shall be sent directly to the copyright owner as specified in the copyright notice associated with the article.