
Abstract
Cerebrovascular disease (CVD) remains a leading cause of death and the leading cause of adult disability in most developed countries. This work summarizes state-of-the-art, and possible future, diagnostic and evaluation approaches in multiple stages of CVD, including (i) visualization of sub-clinical disease processes, (ii) acute stroke theranostics, and (iii) characterization of post-stroke recovery mechanisms. Underlying pathophysiology as it relates to large vessel steno-occlusive disease and the impact of this macrovascular disease on tissue-level viability, hemodynamics (cerebral blood flow, cerebral blood volume, and mean transit time), and metabolism (cerebral metabolic rate of oxygen consumption and pH) are also discussed in the context of emerging neuroimaging protocols with sensitivity to these factors. The overall purpose is to highlight advancements in stroke care and diagnostics and to provide a general overview of emerging research topics that have potential for reducing morbidity in multiple areas of CVD.
Introduction
Stroke, defined as a severe interruption or reduction in blood supply to the brain, remains a leading cause of death, and the leading cause of adult disability, in most developed countries. Approximately 87% of strokes are ischemic, originating from an obstruction within a blood vessel, whereas the remainder are hemorrhagic, or caused by vessel rupture. Cerebrovascular disease (CVD) more broadly comprises conditions that affect the blood supply to the brain and can lead to overt stroke when severe or inadequately managed. Despite progress in acute stroke treatment, 20–30% of strokes result in death within one month and 70–80% result in significant long-term disability.1,2 These statistics highlight the need to both improve acute stroke theranostic procedures and address preventative and rehabilitative care comprehensively.
Stroke is often referred to as a cerebrovascular accident, but is associated with many well-defined lifestyle and vascular risk factors. 3 As a result, the majority of strokes might be preventable with appropriate risk factor management and surveillance of cerebrovascular health. Neuroimaging is a critical component of patient care in most stages of CVD: from identification of stroke risk factors to stratifying acute and chronic stroke patients to the most effective revascularization and in some cases rehabilitation treatments.
Here, we outline current and emerging methods for understanding CVD in the settings of: (i) chronic CVD and stroke prevention, (ii) acute ischemic and hemorrhagic stroke, and (iii) stroke recovery. As lifestyle factors contributing to CVD have been characterized extensively, 3 the focus of this work is to summarize major changes to tissue hemodynamics and metabolism that contribute to CVD and stroke risk, along with an overview of established clinical and emerging research tools for characterizing these parameters. The overall goal is to highlight advances in pathophysiological characterization of tissue in each of these stages of CVD, and to identify unmet clinical needs and relevant future directions.
Physiology of ischemia
Macrovascular and tissue-level changes in chronic ischemia
Summary of many relevant physiological parameters for assessing tissue health in stroke.
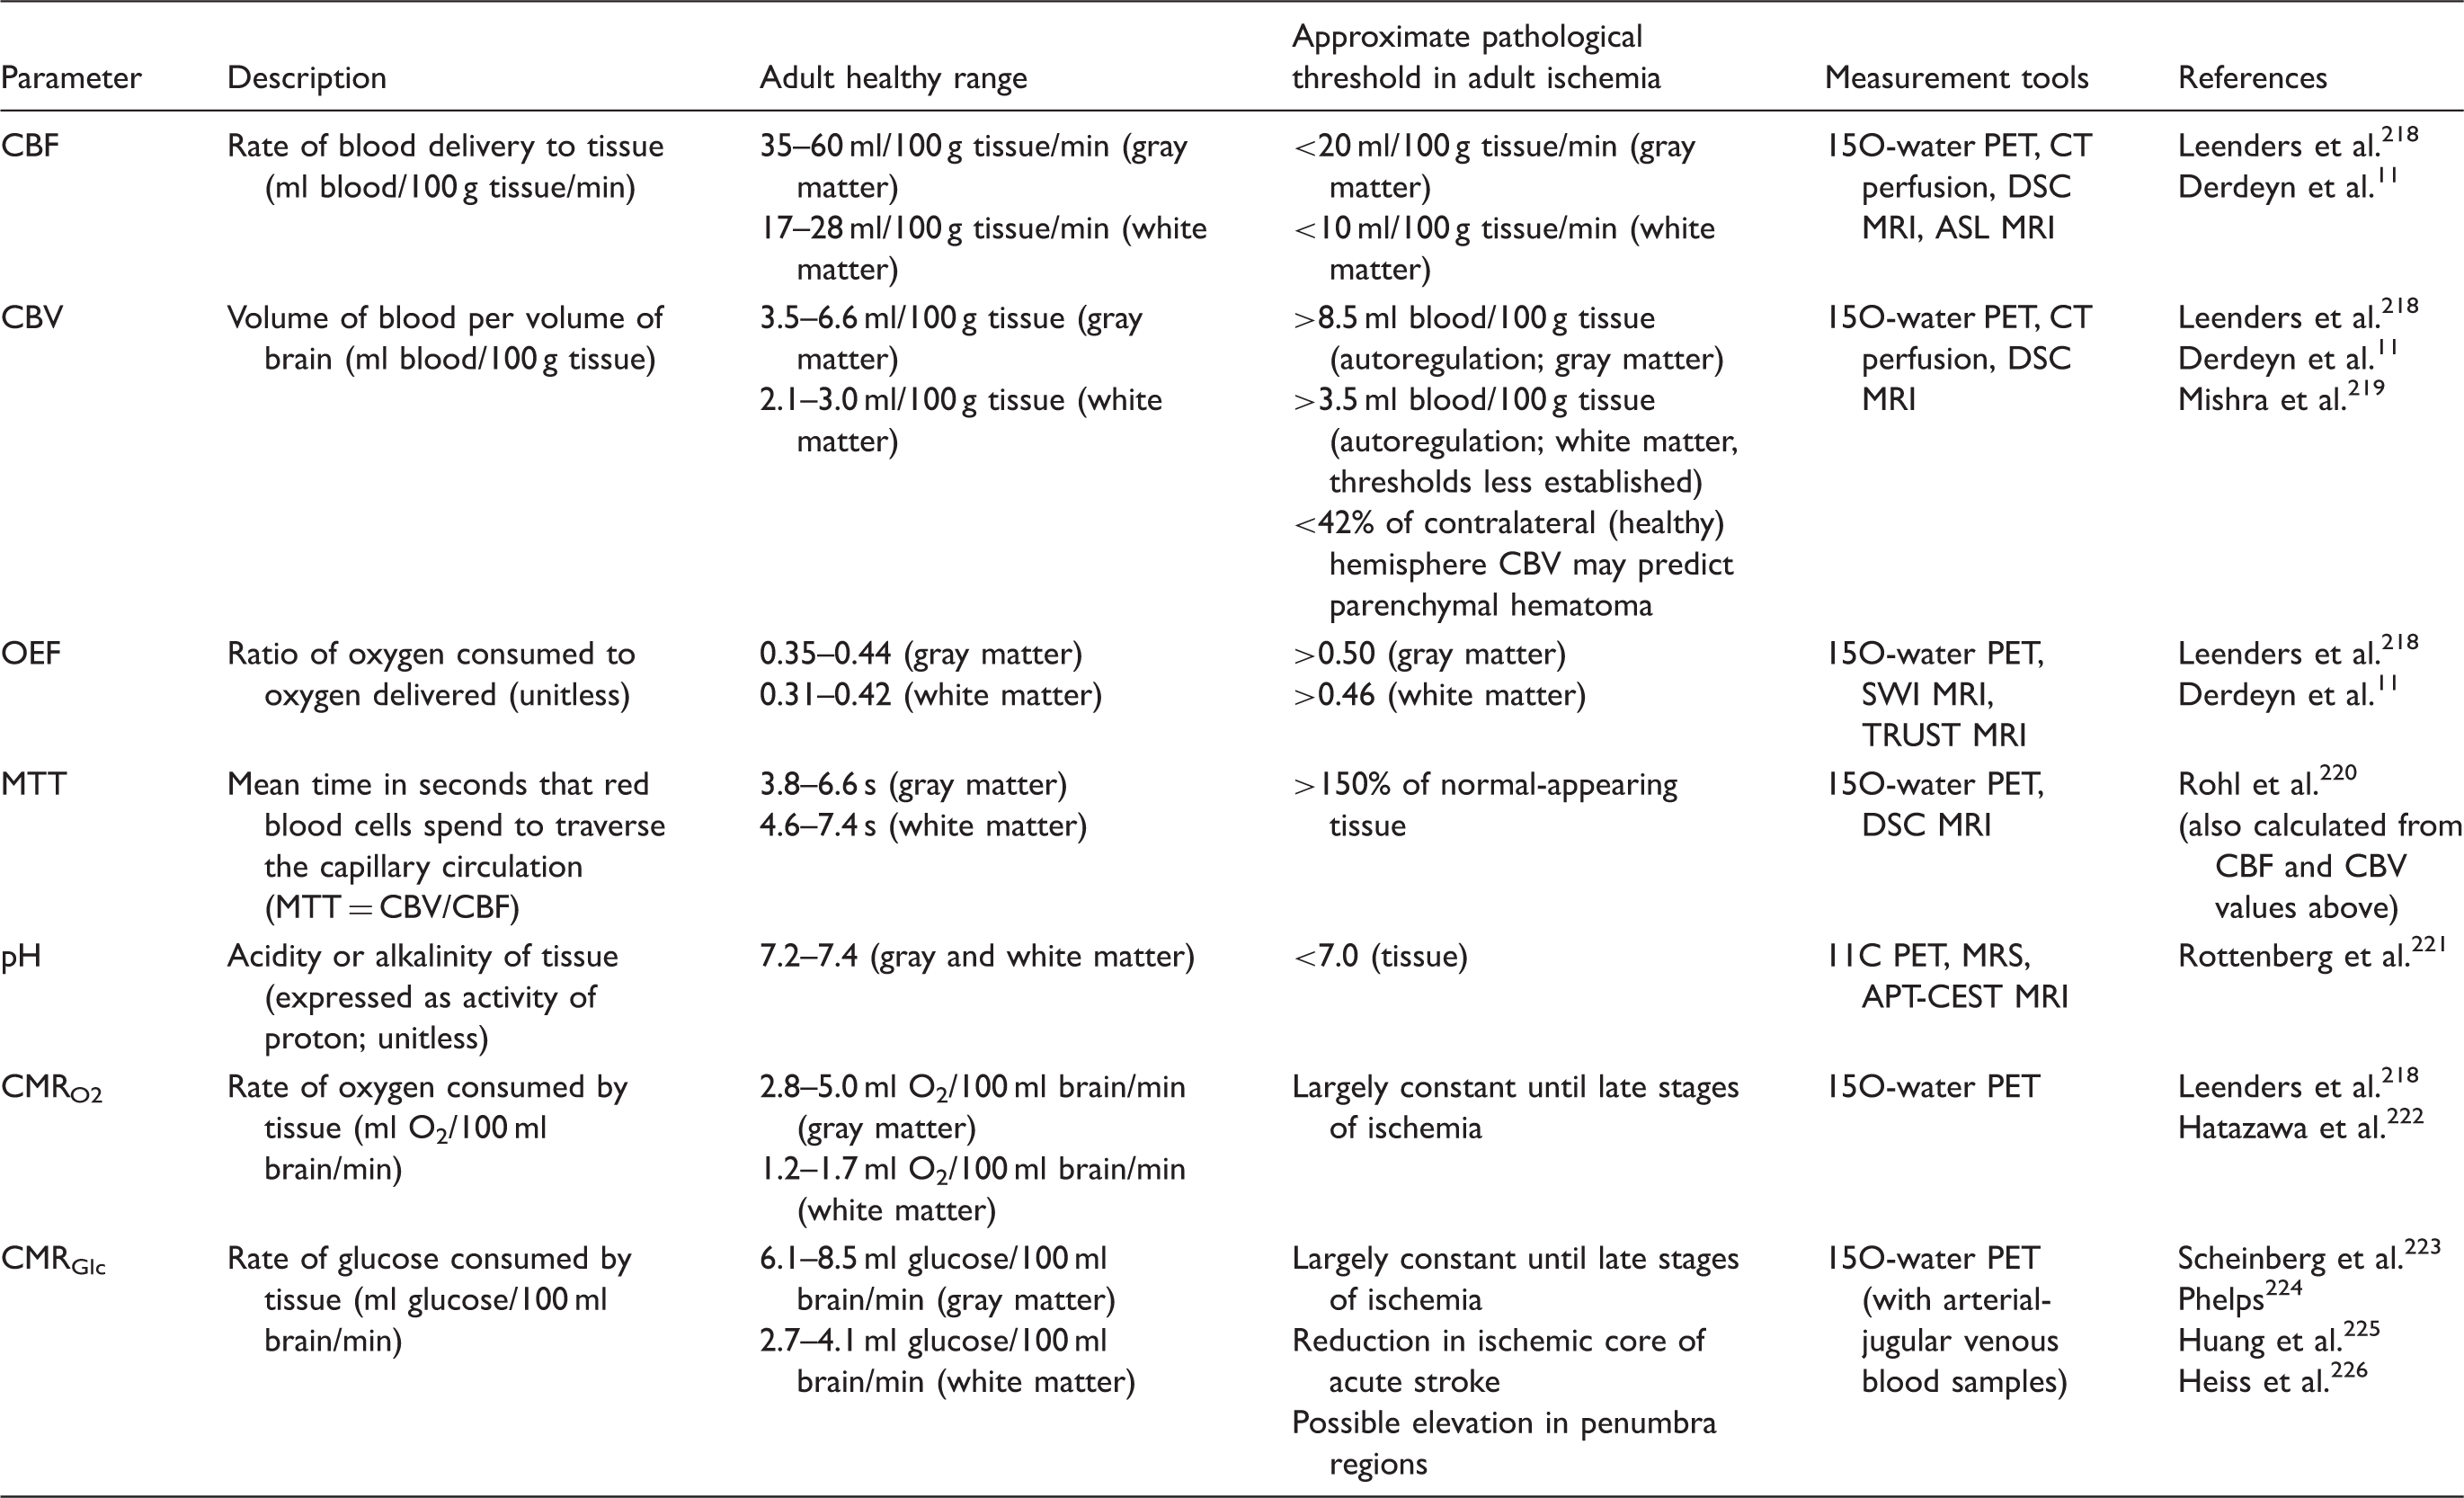
Values represent ranges based on literature studies and are approximate. Measurement tools are not exhaustive, but summarize the most popular methods for each category.
CBF: cerebral blood flow; PET: positron emission tomography; CT: computed tomography; DSC: dynamic contrast susceptibility; MRI: magnetic resonance imaging; ASL: arterial spin labeling; CBV: cerebral blood volume; OEF: oxygen extraction fraction; SWI: susceptibility weighted imaging; MTT: mean transit time; MRS: magnetic resonance spectroscopy; APT: Amide proton transfer; CEST: chemical exchange saturation transfer; CMRO2: cerebral metabolic rate of oxygen; CMRGlc: cerebral metabolic rate of glucose.
Acute ischemic stroke (AIS) occurs when the CBF required to maintain normal tissue function reduces below necessary thresholds (18–25 ml/100 g/min in gray matter and two to three times lower in white matter) and arises during arterial steno-occlusion due to either a thrombosis (vessel obstruction from local mass) or embolism (obstruction due to mass traveling from elsewhere), where the mass is most often a blood clot or cholesterol plaque. In other cases, ischemia may be due to more systemic decreases in blood supply or oxygen delivery as a result of hemoglobinopathies. While the etiology of stroke is well-known compared to most other debilitating neurological conditions, identifying stroke risk factors prior to complete vessel occlusion and the presence or absence of corresponding tissue-level hemodynamic compensation strategies is more complex and an active area of research.
More specifically, in the presence of macrovascular steno-occlusion and corresponding reductions in cerebral perfusion pressure (CPP; difference between mean arterial pressure and venous backpressure), brain parenchyma may adequately compensate for such changes and require minimal or no intervention, or may inadequately compensate and therefore require medical management and/or revascularization therapies. CBF can be maintained at the tissue-level through either collateral flow or autoregulatory increases in cerebral blood volume (CBV; ml blood/100 g tissue). Cerebral autoregulation maintains CPP through vasoconstriction of pial arterioles if mean arterial pressure increases, and through vasodilation if blood pressure decreases, which alters vascular resistance and increases CBV,
8
although these changes can be small in many patients.
9
If these compensatory phenomena are inadequate to maintain oxygen delivery, then a progressive decrease in CBF and concomitant increase in oxygen extraction fraction (OEF; ratio of oxygen consumed to oxygen delivered) to maintain CMRO210–12 occurs (Figure 1). OEF has been postulated to be a more sensitive indicator of critical tissue-level impairment for cerebral ischemia and eventual strokes, compared to CBF or CBV, over a larger range of hemodynamic impairment13,14 and as discussed below, direct OEF measurements using 15O-water positron emission tomography (PET),
15
and more recently indirect OEF measurements using magnetic resonance imaging (MRI), have emerged as relevant tools.
Mechanistic model for increasing stages of hemo-metabolic impairment in (a) ischemia and (b) anemia. In ischemia, as CPP declines the cerebral metabolic rate of oxygen consumption remains constant until CPP is severely reduced. By contrast, CBF at the tissue level may be maintained by collateral flow and/or autoregulation. In moderate disease stages, arteriole cerebral blood volume generally increases via vasodilation to maintain CBF, and CBF begins to increase sharply to maintain adequate delivery of oxygen to tissue. When collateral flow and autoregulation are insufficient to maintain CBF, CBF plateaus or declines and OEF will begin to increase. In anemia, the cerebral metabolic rate of oxygen consumption similarly remains constant until severe impairment. In cases when oxygen can no longer be supplied by these mechanisms, a stroke occurs. Below (c–e) individual cases of structural, CBF, and OEF mapping. (c) A healthy control participant with a normal OEF, and normal findings on anatomical and CBF imaging. (d) A participant with SCA and (e) reduced CPP secondary to bilateral moyamoya disease. The participant with SCA demonstrates elevated CBF in the setting of decreased oxygen carrying capacity of hemoglobin and increased OEF (OEF = 0.48). The participant with bilateral moyamoya with lenticulostriate collaterals, demonstrates right and left anterior and middle cerebral artery territory infarcts seen on FLAIR, bilateral anterior-territory hypoperfusion, and globally elevated OEF (OEF = 0.41) relative to control data. It is possible that ASL MRI, used here, underestimates the true CBF in this patient (see text). Additional details can be found in Watchmaker et al.
50
and Jordan et al.
52
CPP: cerebral perfusion pressure; CBF: cerebral blood flow; OEF: oxygen extraction fraction; SCA: sickle cell anemia; ASL: arterial spin labeling; MRI: magnetic resonance imaging.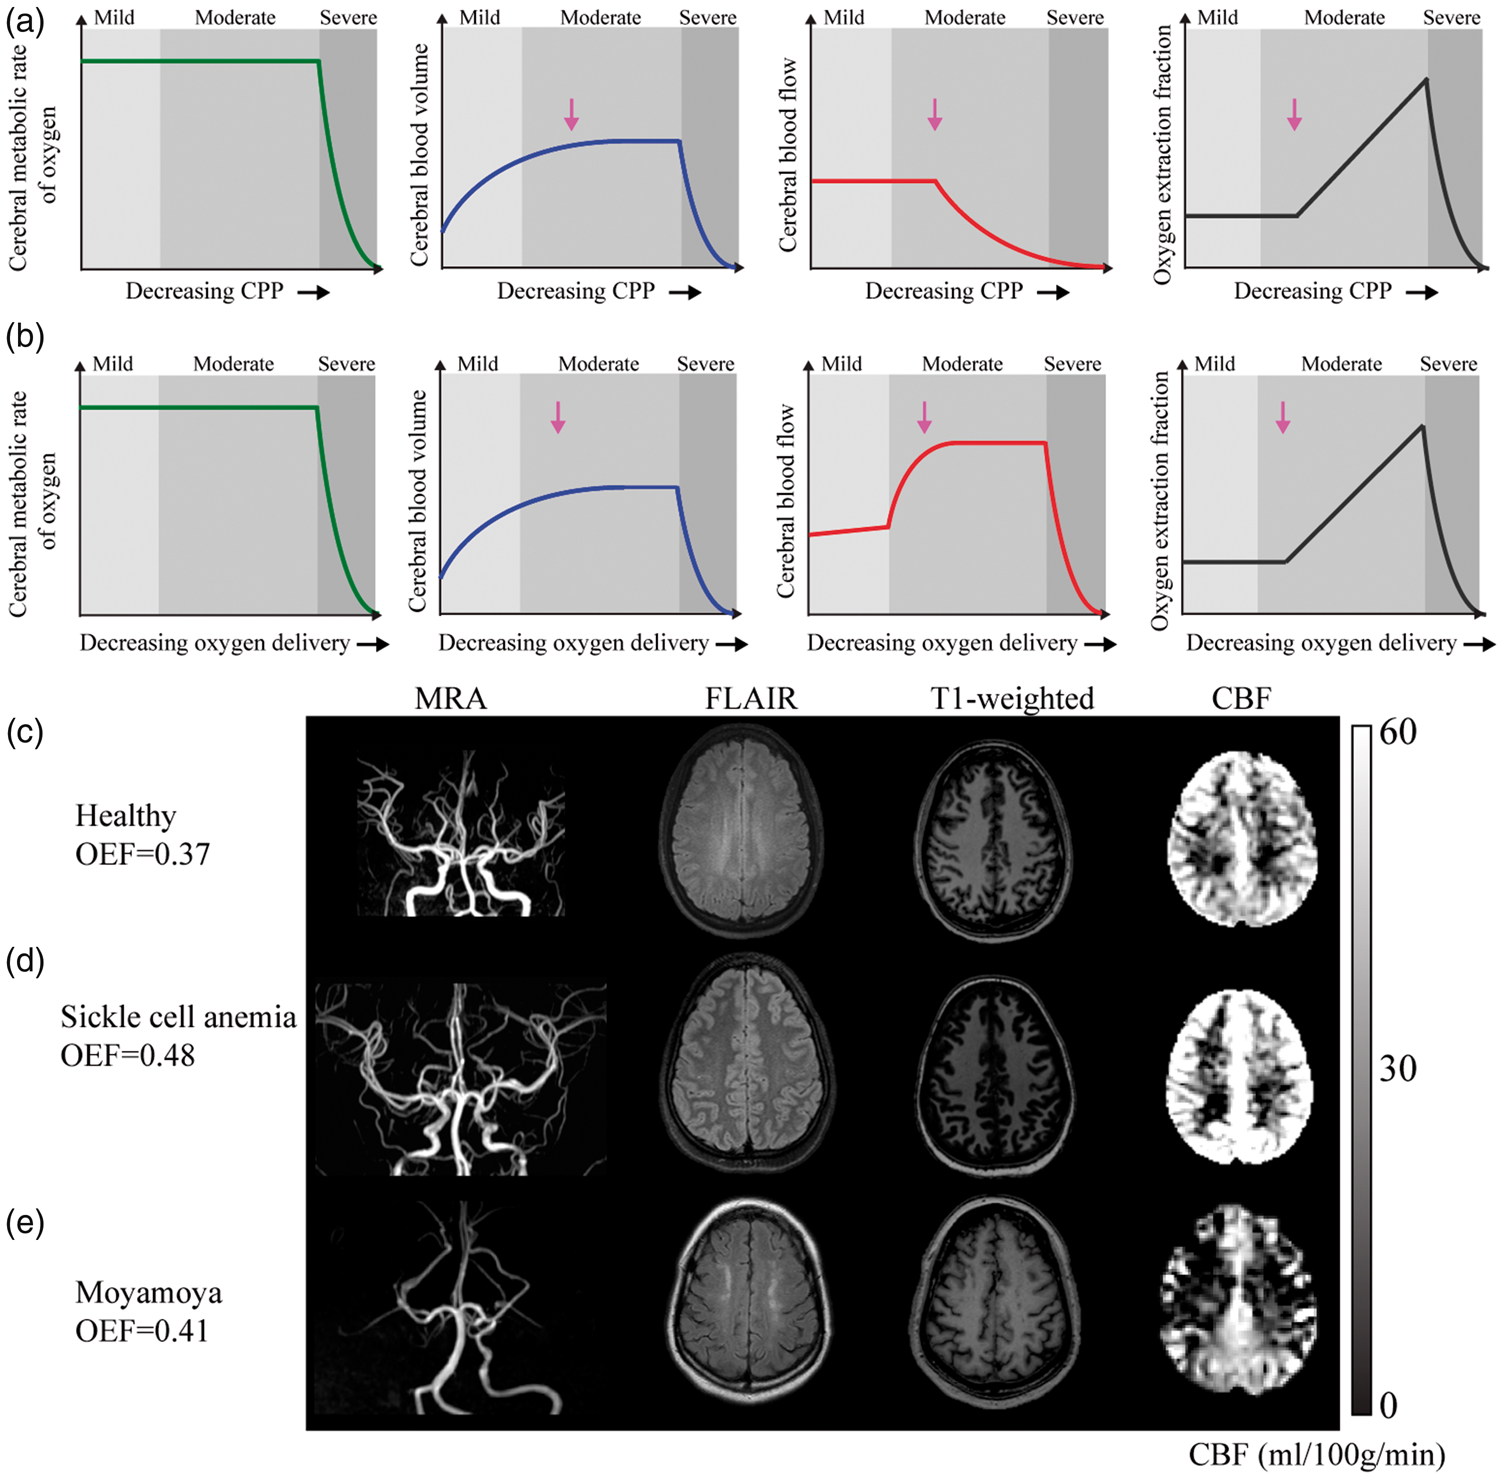
The extent of intracranial vascular stenosis, and the presence or absence of collaterals, measured from angiography, have traditionally been used as surrogates for disease severity and stroke risk. When possible, angiography is complemented with anatomical imaging using computed tomography (CT) or diffusion-, T2-, and T1-weighted MRI to gauge acute ischemia, chronic infarcts, and tissue structure and edema, respectively. While these methods are hallmarks of stroke risk determination, they provide no information on how the arterial stenosis translates to parenchymal impairment at the tissue level. As such, more sophisticated diagnostic tools capable of recording additional observables of hemodynamic impairment are necessary to improve our understanding of CVD pathophysiology. The relevance of these measurements depends on stroke etiology and treatment avenues available.
Visualization of sub-clinical disease processes
Modifiable risk factors
Data from 6844 adults are reproduced from Bos et al.3
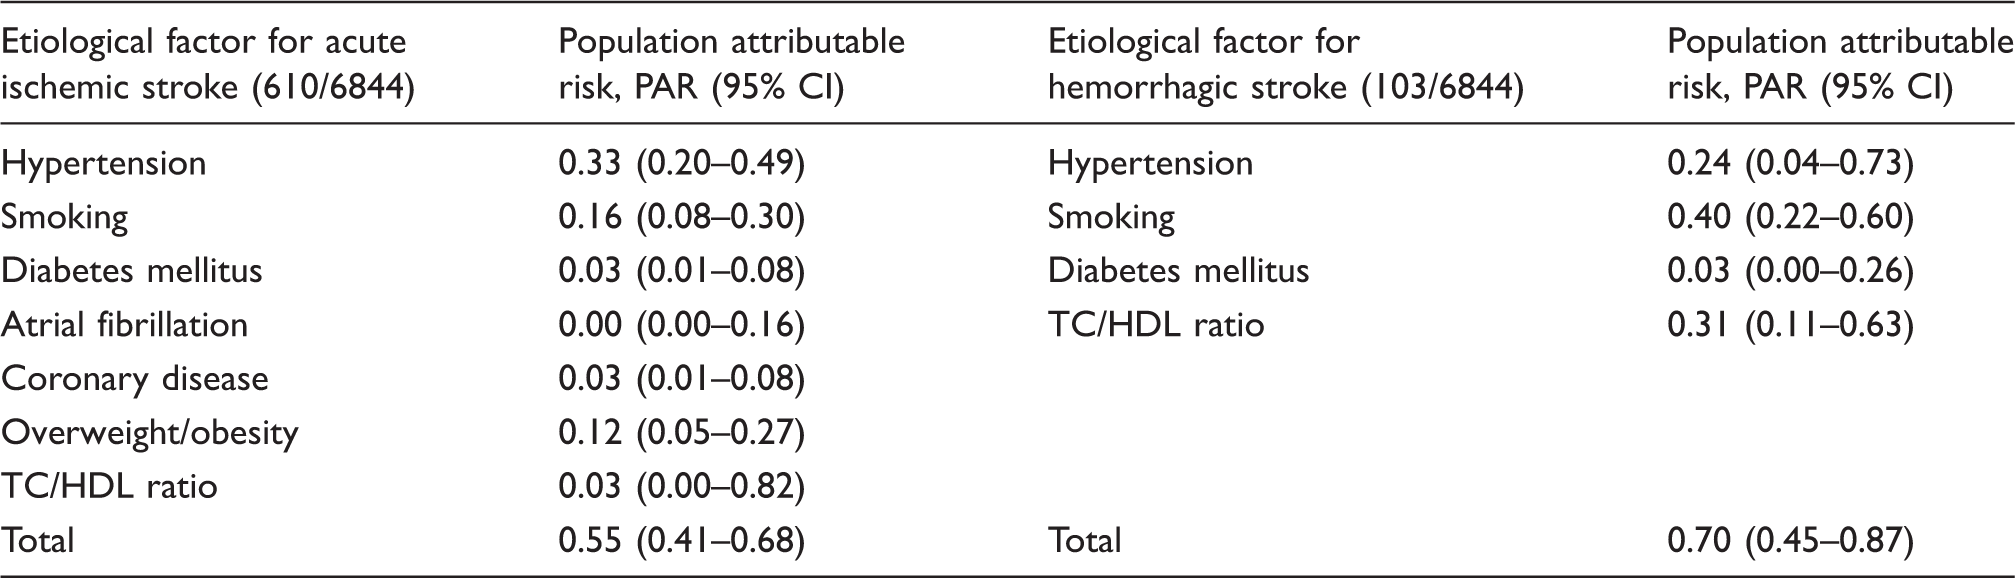
Data show the PAR for various risk factors with respect to any first-ever ischemic or hemorrhagic stroke. The population attributable risk can be interpreted as the percentage of strokes that can theoretically be prevented if that specific risk factor could effectively and completely be eliminated from the population. These PAR values are calculated taking into account possible confounding and interaction effects across each other. Values are presented with 95% CIs. The numbers presented in this table are slightly lower than those reported earlier in literature227,228 since in these data interaction effects and overlap across risk factors are taken into account in the statistical analysis.
PAR: population attributable risk; CI: confidence interval; TC: total cholesterol; HDL: high-density lipoprotein.
Atherosclerotic steno-occlusive disease
Extracranial atherosclerotic disease (ECAD) is a well-known risk factor for stroke. Following the North American Stenting vs. Carotid Endarterectomy Trial (NASCET), patients with symptomatic ECAD of the internal carotid artery (ICA) have been surgically revascularized with carotid endarterectomy, resulting in a 2–4% two-year rate of disabling stroke in patients without perioperative complications and approximately a 17% reduction of stroke compared to similar patients on medical management only.18,19 However, patients with intracranial atherosclerotic disease (ICAD) comprise 7–24% of new strokes20–23 and appropriate treatment for ICAD is less clear, particularly in the wake of the recently halted Stenting vs. Aggressive Medical Management in Patients at Risk for Stroke with Intracranial Stenosis (SAMMPRIS) and Vitesse Intracranial Stent Study for Acute Ischemic Stroke Therapy (VISSIT) trials, which evaluated the efficacy of new intracranial stents.24,25 In these prospective trials, 14–24.1% of patients with ICAD treated with stenting and aggressive medical management (AMM), consisting of anti-platelet and statin therapy, experienced a stroke within 30 days, compared to just 5.8–9.4% of patients receiving AMM alone. Final results from both trials revealed that even in the AMM arms, a high 12.2–15.1% of ICAD patients experienced recurrent stroke in one year. 26 There remains a pressing clinical need to understand stroke risk factors in these patients.
An analysis of the hazard ratio (HR) of SAMMPRIS patients in the AMM arm presenting with stroke showed that patients with recurrent stroke had a higher incidence of (i) being female (HR = 1.9), (ii) diabetes mellitus (HR = 1.8), (iii) not taking a statin at enrollment (HR = 2.6), (iv) Rankin grade ≥1 (HR = 2.3), (v) old infarct in stenotic artery territory (HR = 2.6), and (vi) stenosis >80% (HR = 1.9) at mild (p < 0.10) significance on bivariate analysis, however only (iii) and (v) met rigorous criteria (p < 0.05) on multivariable analysis. 27 The observed link between a lack of statin regimen at time of stroke and subsequent, recurrent stroke partly motivates the need for vessel wall and plaque stabilization imaging. 28 It is thus anticipated that lifestyle, macrovascular, and microvascular changes likely contribute to recurrent stroke risk in patients with ICAD; however, the quantitative relationship between these risk factors and whether short-term changes in these parameters are prognostic for AMM failure remains to be evaluated.
Non-atherosclerotic steno-occlusive disease
Non-atherosclerotic conditions such as moyamoya disease (MMD), characterized by progressive stenosis of the supraclinoid ICA and proximal branches, and the corresponding development of networks of collateral blood vessels, 29 places individuals at more than a seven-fold increased risk of stroke. 30 While such idiopathic MMD is relatively rare (incidence < 0.9 cases/100,000 children in North America), Moyamoya syndrome (MMS), which may be associated with Down syndrome, sickle cell disease, atherosclerosis, cranial radiotherapy, and a number of other conditions, is observed in the general population and shares many phenotypical characteristics with idiopathic MMD.31–34 Such patients have a wide clinical presentation and prognosis, which is hypothesized to depend sensitively on the location and extent of steno-occlusion, parenchymal response via development of collateral vessels, and associated comorbidities.29,35 Moyamoya etiology remains unknown, animal disease models do not exist, biomarkers that may place patients at highest risk for stroke have not been conclusively established, and randomized trials evaluating utility of surgical revascularization have not been performed.
There is currently no treatment that is known to halt or reverse MMS. Treatment focuses on improving CBF through medical therapy with antiplatelet agents, calcium-channel blockers, and more rarely anticoagulants.36,37 More aggressive surgical revascularization using either direct bypass or indirect synangiosis procedures are performed in patients with symptoms unresponsive to medical therapy 37 and are increasingly utilized, despite the absence of formal proof of efficacy. 38 The most pressing clinical question in these patients is whether aggressive surgical procedures are necessary and if so, how tissue-level hemodynamic and metabolic responses may alter stroke risk. Addressing these issues likely requires accurate measurements of how parenchyma compensates for steno-occlusion, including knowledge of (i) vessel lumen and wall morphology, (ii) collateral vessel structure and function, (iii) tissue perfusion and metabolism, and (iv) cerebrovascular reserve capacity.39–42
Sickle cell anemia (SCA) and hemoglobinopathies
SCA is a well-characterized monogenetic disorder with a high prevalence of cerebral vasculopathy, silent cerebral infarct (SCI; infarct on MRI but no focal deficits on neurological exam), and stroke. Hemoglobin S leads to sickled red blood cells, chronic hemolytic anemia, and decreased oxygen carrying capacity. Approximately 40% of children with SCA will have an overt stroke or SCI by age 18 years.43,44 Standard care for children with SCA with either overt strokes or SCIs is regular blood transfusion therapy (approximately monthly) for an indefinite period of time for secondary prevention of cerebral infarct recurrence.45,46 The TWITCH trial 47 recently showed that children with SCA who are receiving monthly blood transfusions for primary stroke prevention can be safely transitioned to oral hydroxyurea after one year. Now a major focus of research in SCA is to identify an optimal strategy for secondary stroke prevention. Despite regular blood transfusion therapy, over a course of five years, 45% of SCA children with overt strokes will have a new infarct recurrence (overt or SCI) 48 and 9.5% of those with SCI will have a new infarct recurrence (overt or SCI). 49 The most pressing clinical problem in this high-risk population of children with SCA is to separate the subgroup with pre-existing cerebral infarcts into those (i) likely to progress despite receiving blood transfusion or hydroxyurea therapy and (ii) that either do not require indefinite blood transfusion therapy or require no therapy. Improved imaging techniques are urgently needed to identify children and adults with strokes or SCI that require more aggressive treatment. Imaging methods that assess aspects of cerebral hemodynamics and metabolism such as CBF, CMRO2, cerebrovascular reserve, and OEF hold promise50–52 (Figure 1).
Diagnostic tests for evaluating AIS risk
Patients with neurological symptoms consistent with CVD, including transient ischemic attacks (TIA), generally undergo anatomical imaging and angiography to identify the source of disease and optimal treatment. Multiple modalities including ultrasound, digital subtraction angiography (DSA), CT, and MRI are available as diagnostic tests in patients with suspected CVD.
Ultrasound is primarily used for stenosis grading of the extracranial segments of the ICAs. The advantages of ultrasound include lower cost relative to other imaging methods and lack of ionizing radiation. A primary drawback of ultrasound is the need for an acoustic window, limiting its application in intracranial CVD, as well as significant inter-user variability. Intracranial Doppler, when used without concomitant echography, may lead to erroneous interpretations of the cerebral hemodynamics.
CT and computed tomography angiography (CTA) are widely applied in imaging of the head and neck and of the intracranial and extracranial arteries, respectively. For the assessment of hemorrhage or the detection of chronic infarcts, non-enhanced CT of the head can be performed. Non-enhanced CT scans may evaluate for the presence of arterial calcifications, which are related to future stroke risk in the presence of atheroma.53,54 CTA is able to detect steno-occlusive disease of the great vessels, cervical and intracranial vasculature. The advantages of CTA include availability in most hospitals, lack of most contraindications, and the visualization of the complete trajectory of the vasculature from the aortic arch to the more peripheral intracranial arteries. Limitations are requirements of ionizing radiation and potential side effects of the use of iodinated contrast (allergic reactions, nephrotoxicity).
DSA may be used for both diagnostic and therapeutic purposes. Diagnostic DSA has largely been replaced by CTA, a less-invasive alternative. Currently, DSA is more often used in these patients for therapeutic interventions, such as thrombectomy, and less often for diagnostic purposes only, although some rare causes of recurrent AIS, such as diaphragms of neck arteries may be missed by CTA. 55 Still, DSA remains the gold standard for assessment of collateral vessels in patients with intracranial steno-occlusive disease and for evaluation of intracranial vascular malformations such as arteriovenous malformations and fistula. Furthermore, it should be noted that the inclusion and stratification of many therapeutic trials (such as the NASCET > 70% stenosis criteria) were based on DSA. The advantages of DSA are its high temporal and spatial resolution. The limitations are that it is an invasive and expensive procedure, ionizing radiation is required, and it carries risks of complications such as stroke or groin hematoma.
Anatomical MRI and magnetic resonance angiography (MRA) are also widely applied in patients with steno-occlusive disease. The role of anatomical MRI is to identify the presence of recent (acute-subacute) and remote infarcts, evaluate the burden of small vessel disease, evaluate for presence of micro- and macrohemorrhage, and exclude alternative etiologies. The location of the cerebral infarcts may help to identify the cause according to the Trial of Org 10172 in Acute Stroke Treatment (TOAST) sub-classifications (cardiac causes, large artery causes, small artery causes, other defined causes, unknown causes), 56 which have recently been refined to reduce the number of patients with stroke of undetermined cause.57–59 Infarcts in multiple perfusion territories may indicate the presence of a cardiac cause of cerebral infarcts, such as emboli in a patient with atrial fibrillation or after cardiac interventions although similar findings might be observed in small vessel diseases. 60 An infarct in the deep gray or white matter may indicate the presence of small vessel disease (arteriolosclerosis). The burden of small vessel disease can be assessed based on the presence of white matter lesions and remote lacunar infarcts.61,62 In recent articles, the standardized assessment of this small vessel disease was explained based on the STandards for ReportIng Vascular changes on nEuroimaging (STRIVE) criteria. 63 This included imaging protocols and the proposed terms and imaging features of white matter hyperintensities of presumed vascular origin, lacunes of presumed vascular origin, recent small infarcts, and perivascular spaces. Furthermore, the presence, location and severity of microbleeds can be assessed with T2* or susceptibility weighted imaging (SWI), or quantitative susceptibility mapping (QSM) with either the hypertensive pattern (deep gray matter region) or cerebral amyloid angiopathy pattern (lobar and posterior region).
MRA allows for assessment of the vasculature without the use of ionizing radiation. Contrast-enhanced or phase contrast MRA of the extracranial vasculature allows for diagnosis of arterial stenosis and aids in management decisions, such as whether to perform carotid endarterectomy. Phase contrast MRA may also be used to quantify the blood flow velocity in milliliters per minute. MRA of the intracranial arteries can either be based on contrast enhanced angiography or high-resolution time-of-flight (TOF) acquisition, which may provide a detailed evaluation of intracranial vasculature.
PET imaging may be relevant in more unique cerebrovascular scenarios. Fluorodeoxyglucose 18F (FDG) PET imaging will show the reduction or absence of glucose metabolism in patients with an acute or chronic infarct. PET imaging with 15O-tracers can directly measure CBF, CBV, and OEF. PET/MRI has also been shown to be feasible in the early stroke period. 64 15O-water PET may show the presence of an increased OEF in patients with chronic arterial occlusion and 15O-water PET has been studied for the selection of patients for extracranial–intracranial bypass surgery in patients with carotid occlusion. 65 Based on functional PET imaging, a classification of brain tissue and patients with different severity of hemodynamic impairment has been proposed, with stage-1 indicating an autoregulatory increase in CBV and stage-2 an increase in OEF. The Carotid Occlusion Surgery Study (COSS) trial 65 evaluated the efficacy of intracranial-extracranial bypass surgery in patients with a carotid occlusion with hemodynamic cerebral ischemia identified by ipsilateral increased OEF, as measured by PET. The COSS study showed no difference in outcome (stroke recurrence) between the operated and the non-operated group, although later re-analysis questioned whether the OEF methodology used was adequate. 66 The COSS study highlights the challenges of PET imaging, including invasive blood sampling, radiation dose, complex procedures, and need for a cyclotron to produce short-lived tracers and motivates development of noninvasive imaging methods to measure tissue physiology. In clinical CVD research, novel PET tracers such as those targeting microglia and macrophages have emerged to assess the regional and global cerebral inflammatory reaction after brain infarcts. An example in clinical research is the use of specific PET tracers to assess the regional and global cerebral inflammatory reaction after brain infarcts. 67
Figure 2 highlights the role of multi-modal imaging in the diagnosis of patients with distinct CVD.
Relevance of multi-modal imaging for diagnosing CVD. (a) Top row left-to-right: CT perfusion (time to peak) shows delayed arrival (blue) in a large area of the left middle cerebral artery perfusion territory. CTA shows an acute stop in the M1 segment of the left middle cerebral artery occlusion (red arrow). Angiography prior to the thrombectomy procedure confirmed the occlusion of the left M1 segment of the middle cerebral artery. Bottom row left-to-right: TOF MR angiography after the thrombectomy showed complete revascularization of the left middle cerebral artery. The high resolution black blood vessel wall MRI sequences before (middle) and after contrast (right) shows faint vessel wall enhancement of the wall of an M2 segment on the side with the recanalized middle cerebral artery. (b) Top row left-to-right: CTP (time to peak) shows delayed arrival in a small area of the right cerebellum (arrows). Contrast-enhanced MR angiography shows no contrast filling of the right distal vertebral artery (arrow heads) and a focal stenosis of the distal left vertebral artery (arrow). Diffusion-weighted imaging shows small focal ischemic regions of the medulla oblongata and right cerebellum (arrows). Bottom row left-to-right: the high resolution black blood vessel wall MRI sequences before (left) and after contrast (middle) shows both before and after contrast a T1 hyperintense occlusive thrombus (arrows) in the center of the right distal vertebral artery. In the more proximal intracranial vertebral artery (image on the right), an atherosclerotic plaque can be seen which is less hyperintense on this vessel wall MRI sequence compared to the thrombus. An occlusive atherosclerotic plaque is present on the right side (arrow) and a non-occlusive plaque is present on the left side (arrowhead). (c) Dissection of the left internal carotid artery. Top row left-to-right: coronal reconstruction of a CTA shows occlusion of the left internal carotid artery (arrows). The occlusion starts a few centimeters after the carotid bifurcation with a tapering of the lumen of the left internal carotid artery. The lumen of the distal intracranial internal carotid artery shows contrast opacification. Axial CT angiographic images show enlargement of the left internal carotid artery just below the skull base (arrow) with no contrast opacification. The right internal carotid artery shows high density signal (arrowhead) due to the contrast opacification. Bottom row left-to-right: the high resolution black blood vessel wall MRI sequences before (left) and after contrast (right) shows both before and after contrast a T1 hyperintense signal due to the mural thrombus with no clear contrast enhancement. CVD: cerebrovascular disease; CTA: computed tomography angiography; TOF: time of flight; MR: magnetic resonance; CTP: computed tomography perfusion.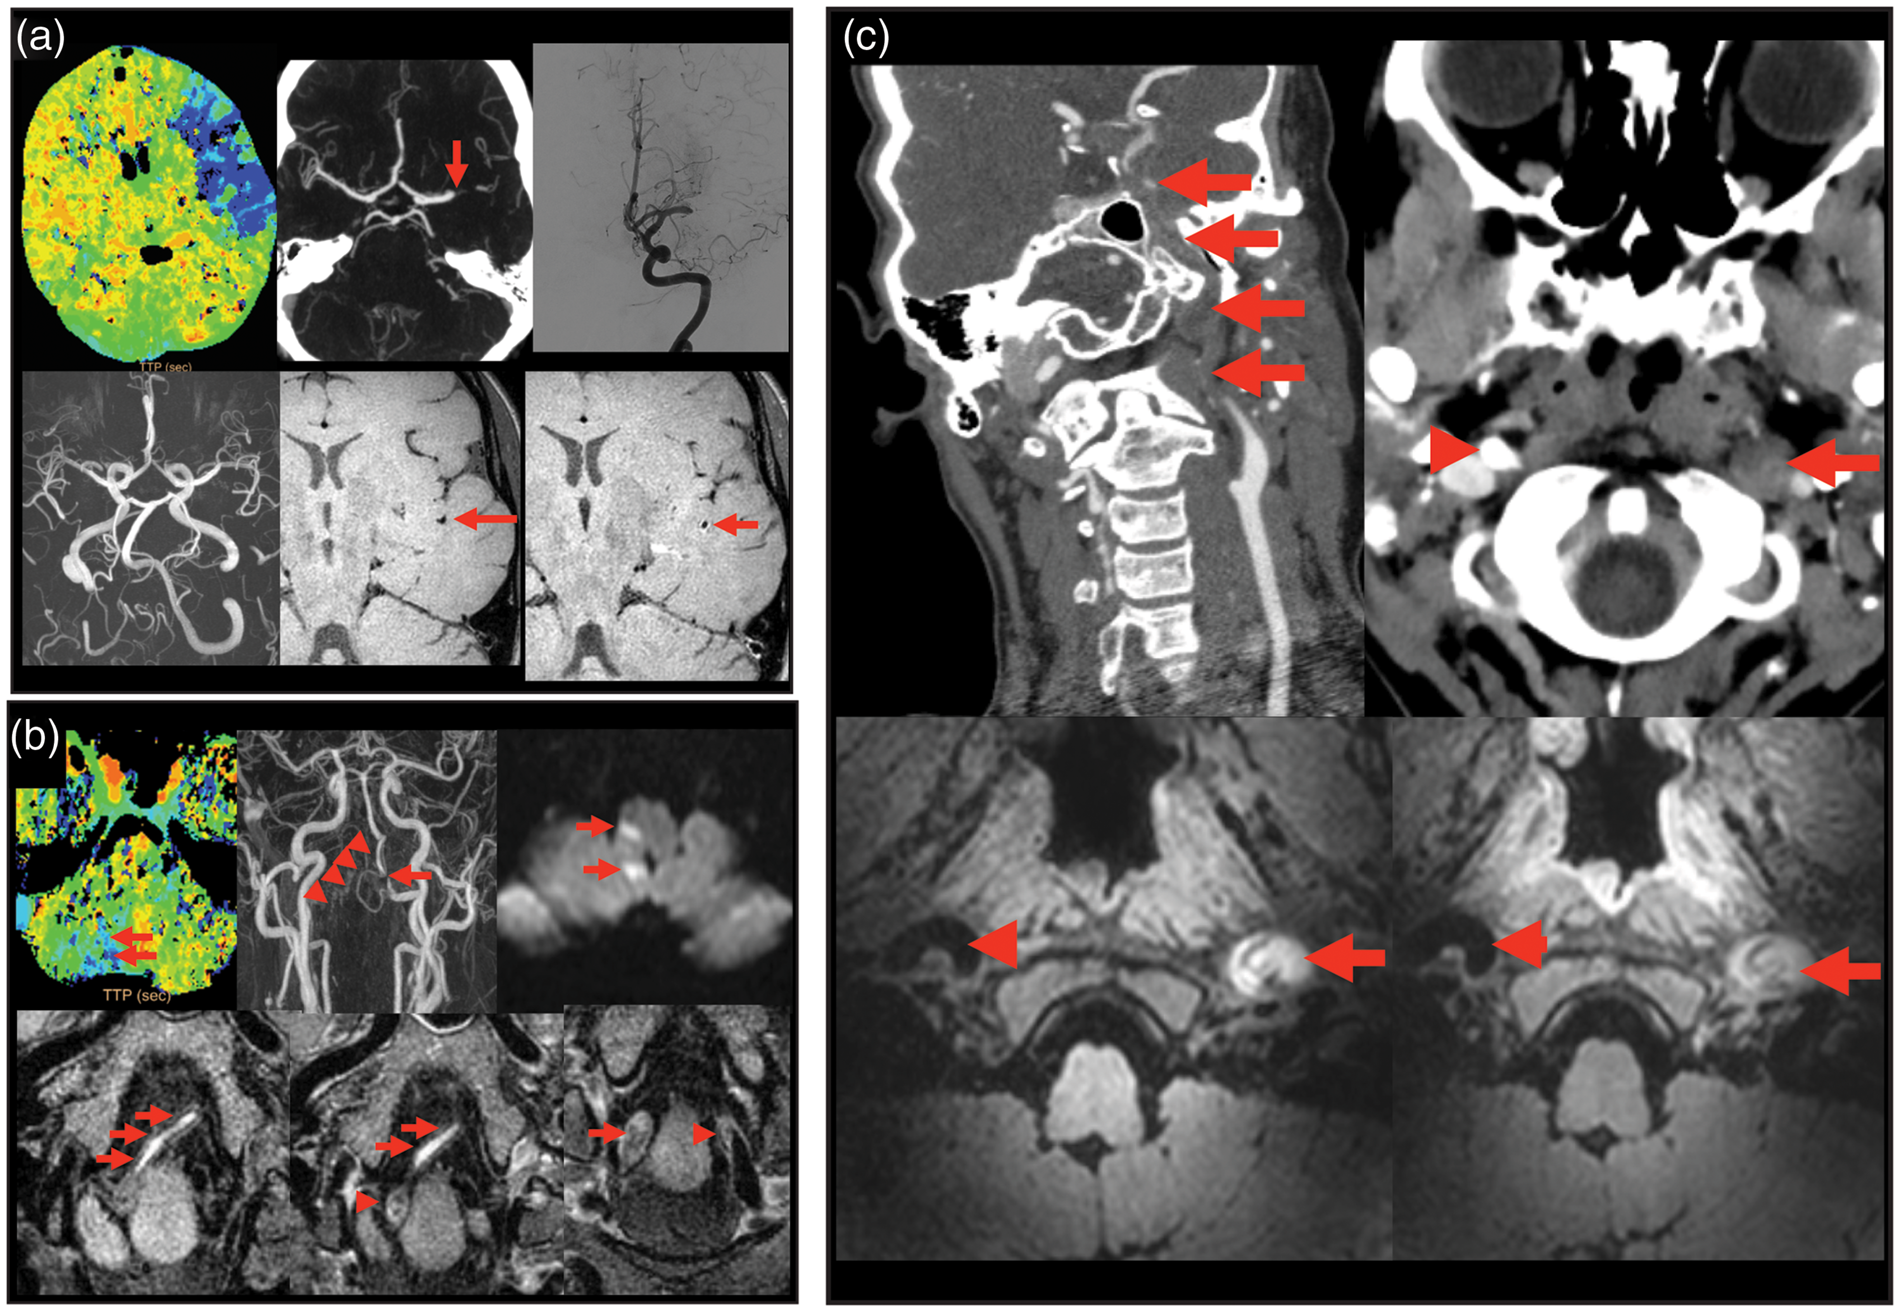
Emerging MR neuroimaging methods
New developments in MRI enable better depiction of all sub-parts of the vascular tree, including the large vasculature, the structure and flow through the microvascular bed, as well as characterization of the intracranial vessel wall.
Recently developed MRI techniques include intracranial vessel wall imaging, which may help to differentiate causes of intracranial stenosis such as arterial vasculitis, reversible vasoconstriction syndrome (RVCS), moyamoya, and atherosclerosis (Figure 2). Intracranial arterial vasculitis will result in enhancement of the vessel walls of intracranial arteries. RVCS will demonstrate arterial stenosis without vessel wall enhancement. 68 Moyamoya will result in circumferential narrowing of the supraclinoid ICAs with collateral formation. Intracranial atherosclerosis may result in enhancing intracranial arterial vessel wall lesions that are most often eccentrically located with typical locations such as the distal ICA just before the bifurcation, the middle cerebral artery (MCA), and the distal vertebral artery.
There has been a recent increase in the use of functional measures of the cerebrovasculature, especially with MRI. One parameter of interest is cerebrovascular reactivity (CVR), defined broadly as the ability of vessels to increase CBV in response to a vasoactive stimulus. Here, either mild hypercapnia (3–6% CO2 administration), breath-holds, or acetazolamide are utilized to alter blood CO2 content, which leads to vasodilation and a concomitant increase in CBF and CBV in compliant vasculature. During this challenge paradigm, quantitative CBF measurements (CT, MRI, or PET) or more recently blood oxygenation level-dependent (BOLD) MRI measurements (Figures 3 and 4) can be used. For instance, for respiratory hypercapnic stimuli, a 0.2–0.4% BOLD increase per mmHg increase in end-tidal CO2 at 3 T is typical for healthy tissue. The BOLD signal provides an indirect marker of this change in CBF and CBV and can be used to assess the reserve and thereby the health status of the smaller intracranial vasculature, not currently visualized with angiography. In pathological conditions, CPP decreases and arterioles at the tissue-level will dilate to increase CBF through autoregulation. When this relaxation becomes maximal, the autoregulatory capacity is exhausted, and any additional vasodilatory challenge leads to a shunted or negligible CBF and CBV increase.
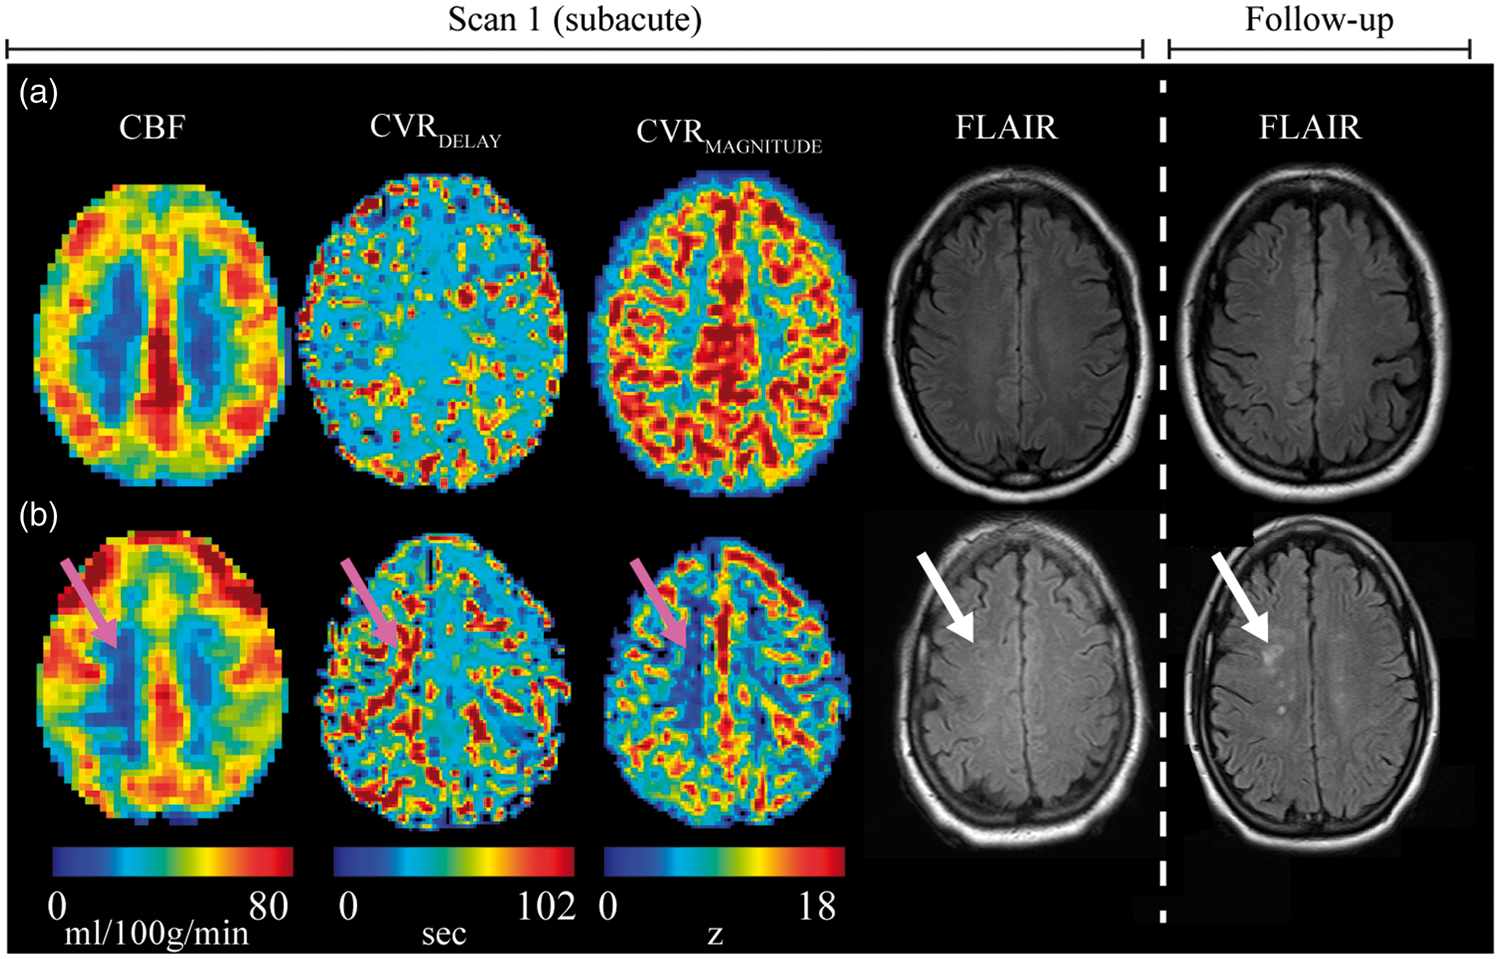
Physiology of CVR-weighted imaging with BOLD MRI. (a) Relaxation of smooth muscle lining arterioles elicits increases in blood flow; for largely isometabolic stimuli such as hypercapnia, this translates to a decrease in paramagnetic dHb concentration in venules and an increase in BOLD signal. The gray shadow surrounding the venules indicates local field (and signal) dephasing from dHb. (b) In pathological conditions with high CPP, smooth muscle relaxation is reduced due to elevated CBV at baseline (i.e. elevated autoregulatory capacity), hyperemia is shunted or negligible, leading to minimal change in venous dHb and a small or negligible BOLD response. (c) Mean CVR-weighted maps from BOLD MRI in healthy volunteers (mean over n = 50) yield largely symmetric CVR; orthogonal representations shown above along with individual axial slices. (d) A patient with bilateral moyamoya disease scanned before and at two time points after right-sided surgical revascularization with EDAS. CVR-weighted increases are seen focally at six months, and larger CVR-weighted increases consistent with more extensive angiogenesis are visible at the second follow-up. CVR: cerebrovascular reactivity; BOLD; blood oxygenation level dependent; MRI: magnetic resonance imaging; dHb: deoxy-hemoglobin; CPP: cerebral perfusion pressure; EDAS: encephaloduroarteriosynangiosis; Ya: arterial oxygen saturation; Yv: venous oxygen saturation; CBF: cerebral blood flow; CBV: cerebral blood volume. Additional information can be found in Donahue et al.215,216 Potential of personalized stroke risk assessment using hemodynamic measurements of CBF from non-invasive arterial spin labeling MRI, time for parenchyma to increase CBF and CBV in response to midly hypercapnic respiratory stimulus (CVRDELAY), and the maximum CVR (CVRMAGNITUDE) obtained from hypercapnic BOLD MRI. Data are shown for two patients scanned within 45 days of AIS (left). (a) Fifty-two-year female with bilateral M2 stenoses and significant left P2 stenosis. CBF, CVRDELAY, and CVRMAGNITUDE are symmetric; 1.3-year follow-up shows no new infarcts. (b) Forty-nine-year female with stenosis of the intracranial right internal carotid artery. CBF and reactivity appear reduced, and CVRDELAY increased, in identical regions, yet there is no infarct present at presentation. At 108 days, new foci of acute infarct within the right centrum semiovale in a watershed distribution are observed (white arrow). The images highlight the possibility of using impaired hemodynamic patterns to predict recurrent stroke, however additional trials in more subjects are required. CBF: cerebral blood flow; MRI: magnetic resonance imaging; CBV: cerebral blood volume; CVR: cerebrovascular reactivity; BOLD; blood oxygenation level dependent; AIS: acute ischemic stroke.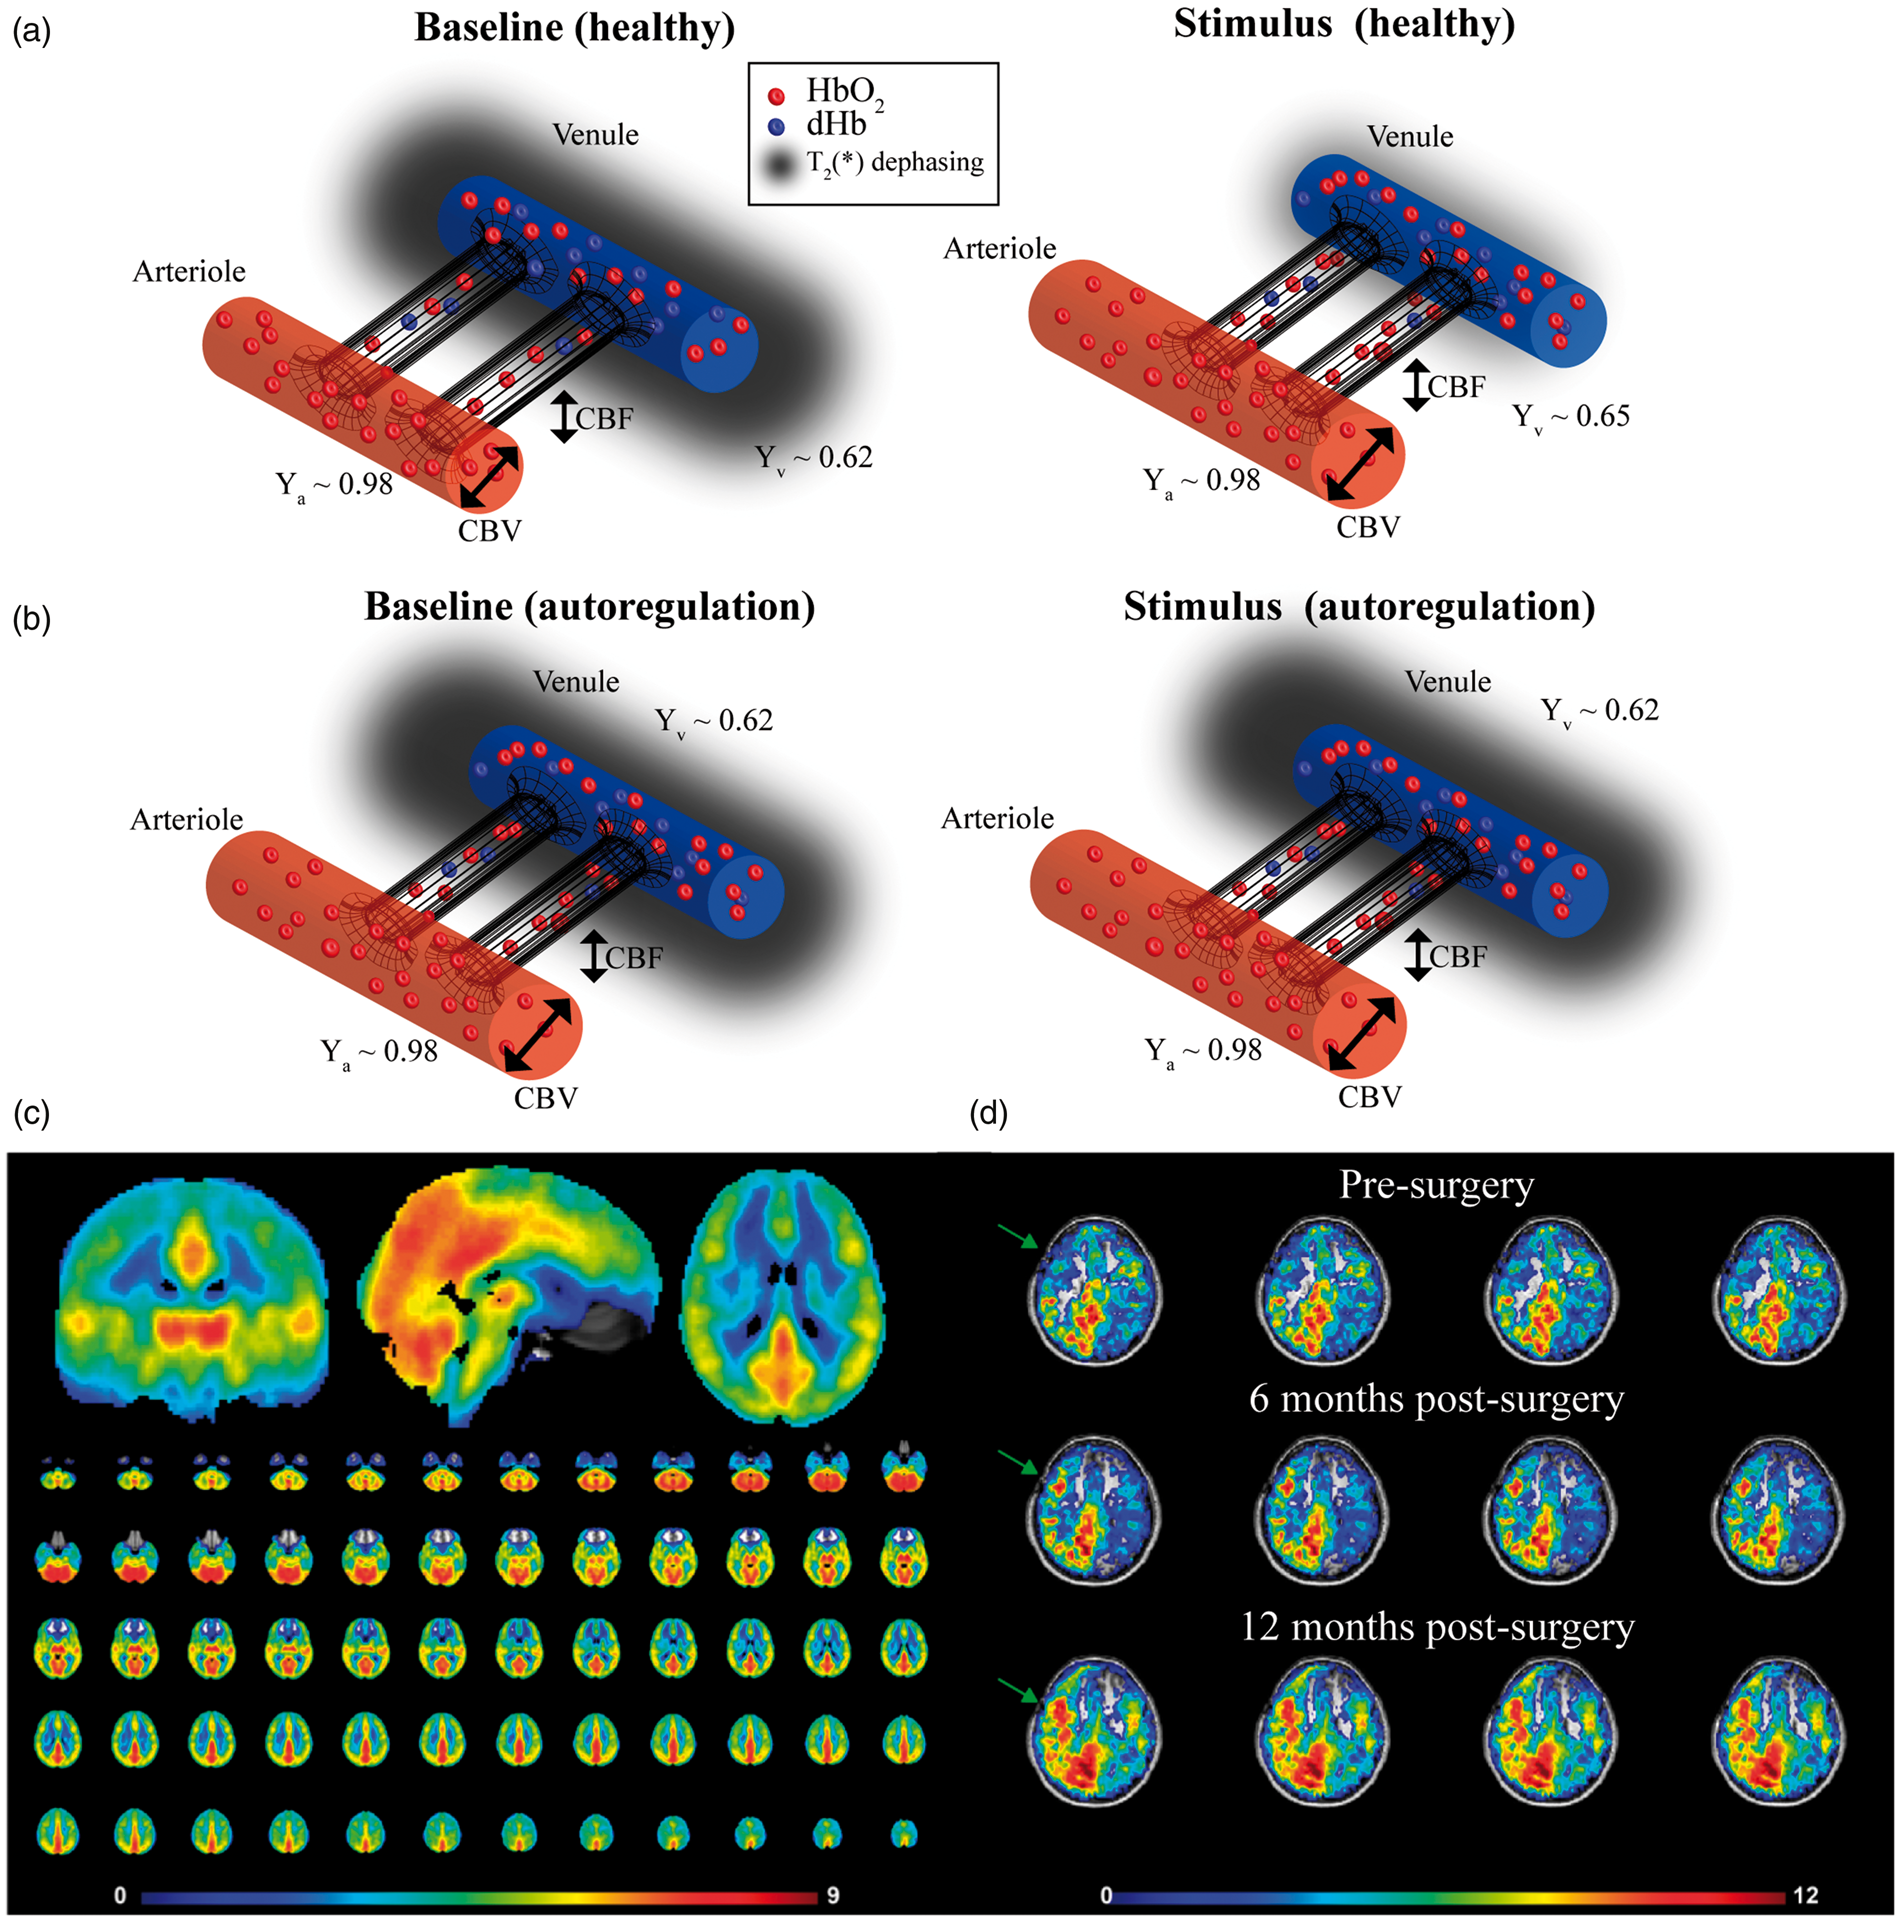
Arterial spin labeling (ASL) CBF-weighted MRI can be used to quantify CBF changes during a physiological challenge more directly. Unlike CBF methods that require injection of an exogenous contrast agent, in ASL endogenous blood water is magnetically labeled non-invasively using a single radiofrequency pulse or a combination of radiofrequency pulses. The SNR of ASL-MRI is much lower than that of BOLD MRI. However, the contrast-to-noise ratio (CNR), for instance in response to vasoactive stimuli, is similar for BOLD and ASL, as the T2* change that underlies the BOLD effect is small (< 10% at 1.5 T–3.0 T) but the CBF change is much larger (20–50% for analogous stimuli). 69 Whereas BOLD provides an indirect measure of CBF and CBV changes through capillary, tissue, and venous water relaxation time changes, ASL provides a more direct measure of CBF.
Technical advancements are also improving the quality of these and related methods. By advanced k-space sharing techniques and compressed sensing, the acquisition of 4D contrast-enhanced MRA data can be performed at ever-higher spatial and temporal resolution.70–72 Cerebrovascular applications of compressed sensing have been limited. However, recent developments in non-contrast enhanced MRA based upon ASL-like sequences have emerged as an attractive alternative enabling high quality 4D MRA within reasonable scan-times. New developments include improved readout strategies, such as golden angle radial reconstructions, which enable postponement of any decision on the trade-off between spatial and temporal resolution from the acquisition to the reconstruction phase of the sequence, thereby offering higher flexibility. Additionally, ASL-MRA has the advantage that it enables the possibility to restrict the labeling to a single artery, thereby allowing selective depiction of the vascular tree.73–75 Recent ASL advancements also allow for the vascular source of the blood to be identified, using vessel-selective ASL,76–78 which should have relevance for visualizing collateralization (Figure 5).
Example of flow territory and collateralization mapping using noninvasive vessel-selective ASL. Left vertebral injection (lateral (a) and AP (b) projections) show filling of left M3 and M6 ASPECTS regions (black arrows). (c) Non-invasive vessel selective ASL with magnetic blood water labeling of left ICA, right ICA, and basilar artery. A fuzzy k-means clustering algorithm was used to cluster the source of the blood flow for each voxel from the different vessels. Mixing is seen between left PCA and MCA territories (white arrow), consistent with angiography. For additional information, see Arteaga et al.
217
ASL: arterial spin labeling; AP: anteroposterior; ICA: internal carotid artery; PCA: posterior cerebral artery; MCA: middle cerebral artery.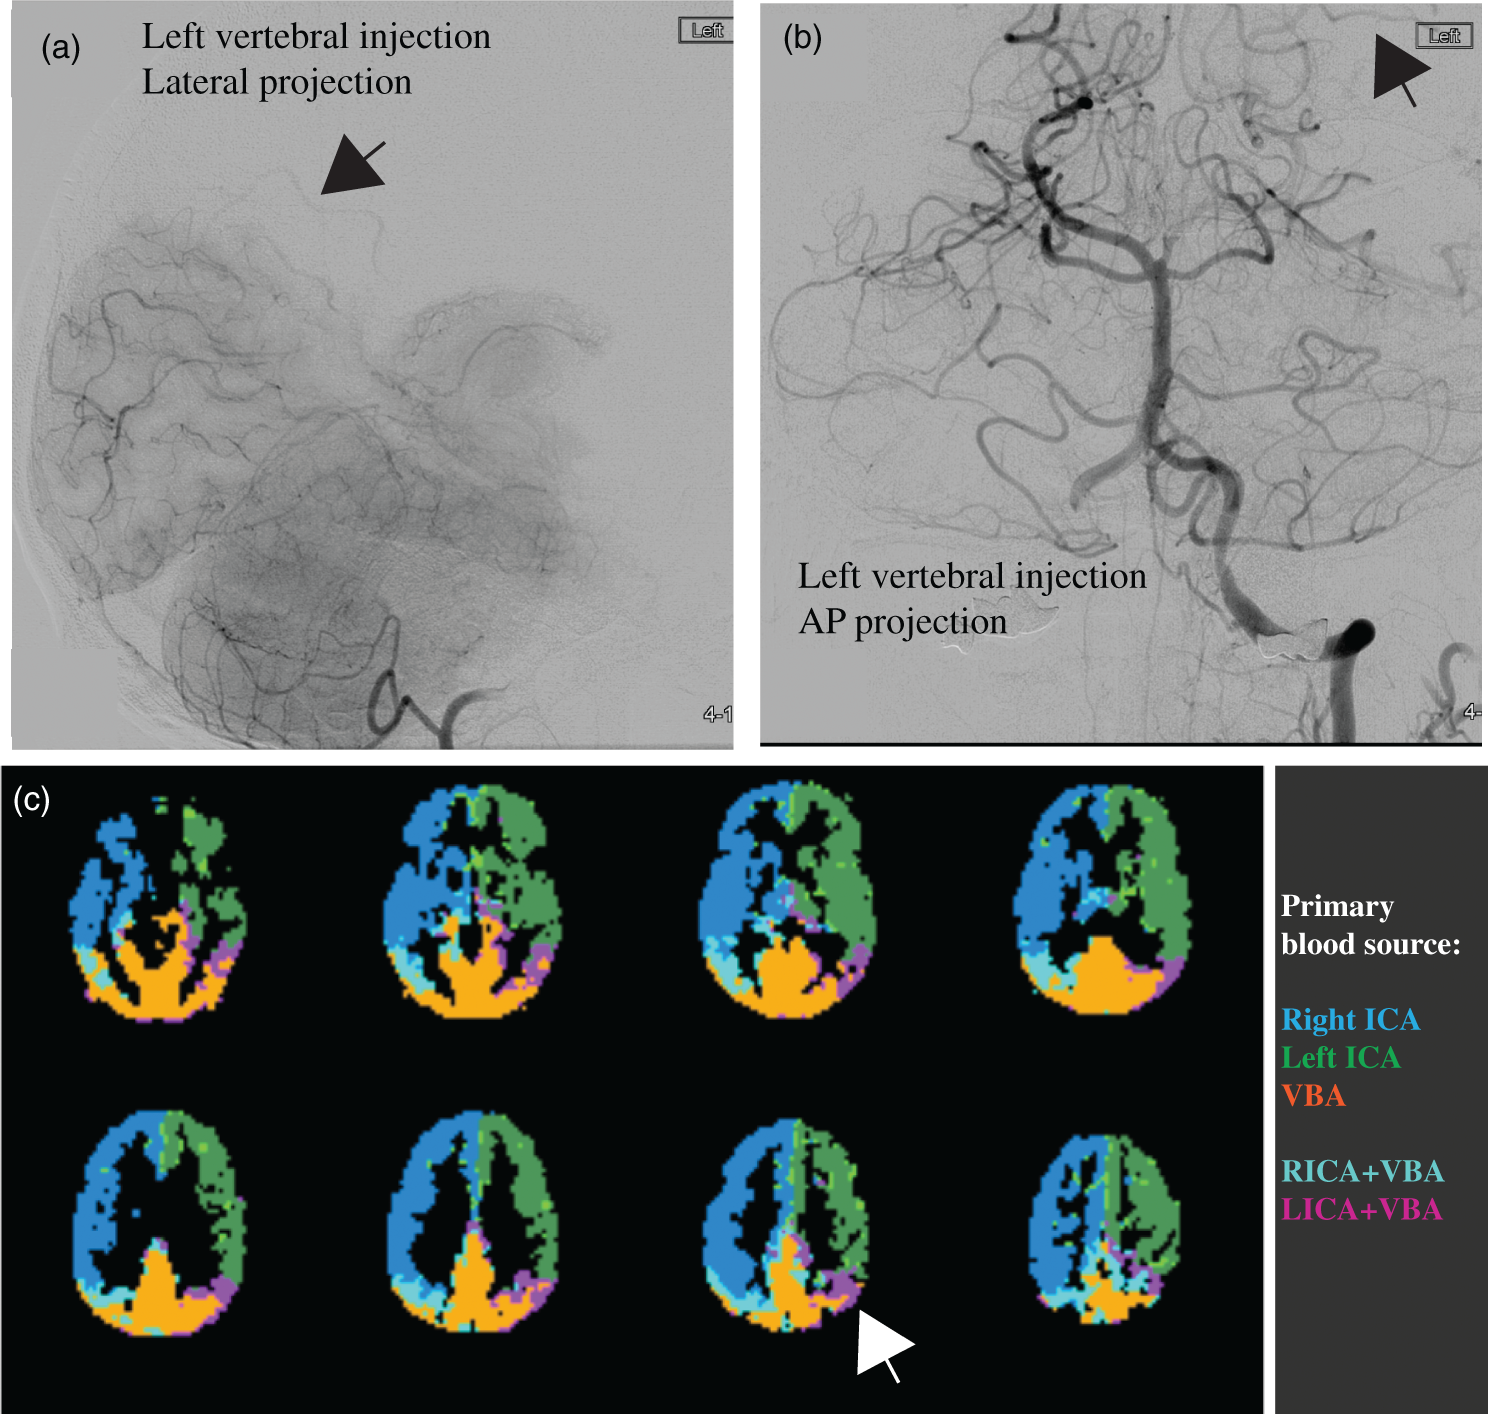
Non-invasive CBF imaging by ASL has been mostly accepted for clinical applications, 79 and includes a consensus statement by the perfusion study group of the International Society for Magnetic Resonance in Medicine (ISMRM) and the European Cooperation in Science and Technology (EU-COST) Action. 79 However, applications of ASL in CVDs are challenging in the presence of unknown and long blood transit times. CBF underestimation may occur if labeled blood water may not yet have reached the imaging slab when the readout commences, and focal overestimation may occur if the tagged spins remain in large vessels and have not yet perfused into the tissue. Velocity-selective or acceleration-selective ASL provides theoretically more accurate, non-invasive CBF imaging in slow flow conditions,80–83 but clinical validation and technical developments are needed to secure widespread clinical acceptance. 84 Alternatively, one can measure the arterial transit time (ATT) as a hemodynamic parameter of interest in itself, mirroring experiences with dynamic contrast susceptibility perfusion MRI (DSC-MRI) that showed timing parameters to be among the most used perfusion parameters in stroke. 85 While measurement of ATT with multiple ASL post-label delays86,87 comes at a cost of longer scan times, newer strategies allow ATT measurements to be performed in a highly time-efficient manner by using time-encoded ASL.88,89
Furthermore, one can foresee a move toward multi-parametric imaging in CVD. One such approach is to obtain a measure for capillary transit time heterogeneity from DSC-MRI.90,91 By using a combined gradient and spin echo readout during DSC-MRI, complementary information on the microvascular architecture can be obtained.92,93 Similarly, CBF MRI can be used to obtain more multi-dimensional microvascular information, for example with MR fingerprinting ASL, 94 vascular fingerprinting, 95 introducing flow crushers to probe the microvascular architecture and extracting multi-dimensional microvascular information. 96
Finally, in recent years, a clear improvement in the depiction of the intracranial vessel wall can be observed, for example by using ultra-high field MRI 97 and careful sequence design. The interested reader is referred to the recent consensus statement by the Vessel Wall Imaging Study Group of the American Society of Neuroradiology. 28
Acute ischemic and hemorrhagic stroke
Prevalence and overview
Acute stroke can be classified into ischemic and hemorrhagic types. Hemorrhagic stroke occurs when rupture of a cerebral artery or vein results in intracranial hemorrhage, and subarachnoid hemorrhage (SAH) and intracerebral hemorrhage (ICH) are the most common causes of hemorrhagic stroke. Non-traumatic SAH affects 30,000 patients per year in the United States (3% of all strokes) and is most commonly caused by rupture of a cerebral artery aneurysm. 98 Ruptured cerebral aneurysms may be treated by microsurgical clipping or endovascular coil embolization, and brain imaging is essential to guiding treatment. 98 Patients with SAH are evaluated by CT given the wide availability and rapidity of this technique; the goals of imaging include identifying the presence and distribution of SAH and the presence of hydrocephalus, which may require emergency and life-saving external ventricular drain placement. 98 Identification and characterization of the ruptured aneurysm is performed by CTA or DSA, and the morphologic appearance of the aneurysm in association with the clinical status of the patient are used to determine whether the patient should undergo surgical or endovascular aneurysm treatment. 98 There has been a notable trend over the past decade toward endovascular treatment of ruptured cerebral aneurysms. Given the lower invasiveness of this technique, 99 it is likely that endovascular aneurysm treatment will continue to increase in numbers in the future.
ICH most commonly results from rupture of a perforating artery in patients with long-standing hypertension, and 63,000 patients per year in the United States (7% of all strokes) suffer from ICH.100,101 Medical therapy remains the mainstay of treatment of ICH, although surgical hematoma evacuation or hemicraniectomy may be performed to decompress large hematomas. 101 CT remains the most commonly used modality for brain imaging in patients with ICH as this modality allows for a rapid and accurate diagnosis. CTA is increasingly used to identify the spot sign (i.e. tiny enhancing foci), an imaging biomarker of ICH growth and a poorer prognosis.102,103 It will be of interest to determine whether the identification of the spot sign may lead to more aggressive surgical treatment and improved patient outcomes in future studies. Other neuroimaging modalities, such as DSA, have a more limited role in the evaluation of ICH unless there is concern for an underlying tumor or vascular malformation as a cause of the hemorrhage. ASL-MRI has been shown to be quite sensitive to identify arteriovenous malformations (AVM) and dural arteriovenous fistulas (dAVF) in the setting of ICH of unknown cause.104–106
AIS commonly results from thrombotic or thromboembolic cerebral artery occlusion, and approximately 795,000 patients per year in the United States suffer an AIS. 107 AIS related to acute occlusion of large arteries may be treated by intravenous thrombolysis and/or endovascular mechanical thrombectomy (EVT). Antiplatelet agents remain largely prescribed in patients treated later than 4.5 h post-symptom onset, particularly in the absence of arterial occlusion. Since the 1995 National Institute of Neurological Disorders and Stroke trial, 108 brain imaging by CT, and more recently by MRI, has become established as an essential tool to guide treatment of AIS. The goals of brain imaging include identifying the size and extent of cerebral infarction, identifying stroke mimics, and identifying contraindications to treatment such as intracranial hemorrhage. 109 More recently, the role of brain imaging in AIS has been expanded to include vascular imaging for the selection of patients for EVT.110–114
Additionally, advanced brain imaging techniques such as collateral vessel imaging and perfusion imaging to identify the tissue at risk of infarction, or ischemic penumbra imaging may play an increasing role in the selection of patients for EVT.109,112,113 The ischemic penumbra represents ischemic tissue that may remain viable but is at risk of continuing to infarction unless CBF can be restored by recanalization therapy (Figure 6). Intravenous or intra-arterial administration of recombinant tissue plasminogen activator (tPA) and EVT have been shown to increase reperfusion rates and to reduce final infarct size when administered within the first 4.5 h of symptom onset115–117 and additional data has recently been provided that EVT can be effective up to 12-h post-stroke.
114
Importantly, recanalization therapy carries the risk of hemorrhagic events, which occur in approximately 6% of patients treated with EVT or tPA.
118
Therefore, fast imaging tools are needed that identify patients most likely to benefit from revascularization, and thereby avoid risks of tPA or EVT in futile cases.
Multi-parameter MRI as a function of time after permanent MCAO in rat. (a) Images of rat in which no T1, T2, and ADC changes were seen, but ischemia was confirmed by hemispheric CBF reduction (obtained using arterial spin labeling) as well as a pH-weighted deficit. Hyperintensity in the T2-weighted image at 24 h gives the final infarction area. (b) Group analysis of ischemic volume evolution for 18 rats with perfusion/diffusion mismatch, comparing areas of pH change and diffusion change as fraction of the perfusion deficit region. The pHw region predicted well the evolution to infarction. (c) Parcellation of ischemic area in terms of three zones, a DWI deficit most likely proceeding to infarction, a pH/DWI mismatch region at risk of infarction and a PWI/pH mismatch not at risk. (d) Processed images for two other animals showing evolution of pHw-deficit (orange) and diffusion deficit (black) with respect to perfusion deficit (purple) as a function of time post-MCAO occlusion. The T2-weighted image at 24 h shows final infarction area predicted well by diffusion + pHw regions. Reproduced in part, with permission, from Sun et al.
155
MCAO: middle carotid artery occlusion; ADC: apparent diffusion constant; CBF: cerebral blood flow; DWI: diffusion-weighted imaging; PWI: perfusion-weighted imaging.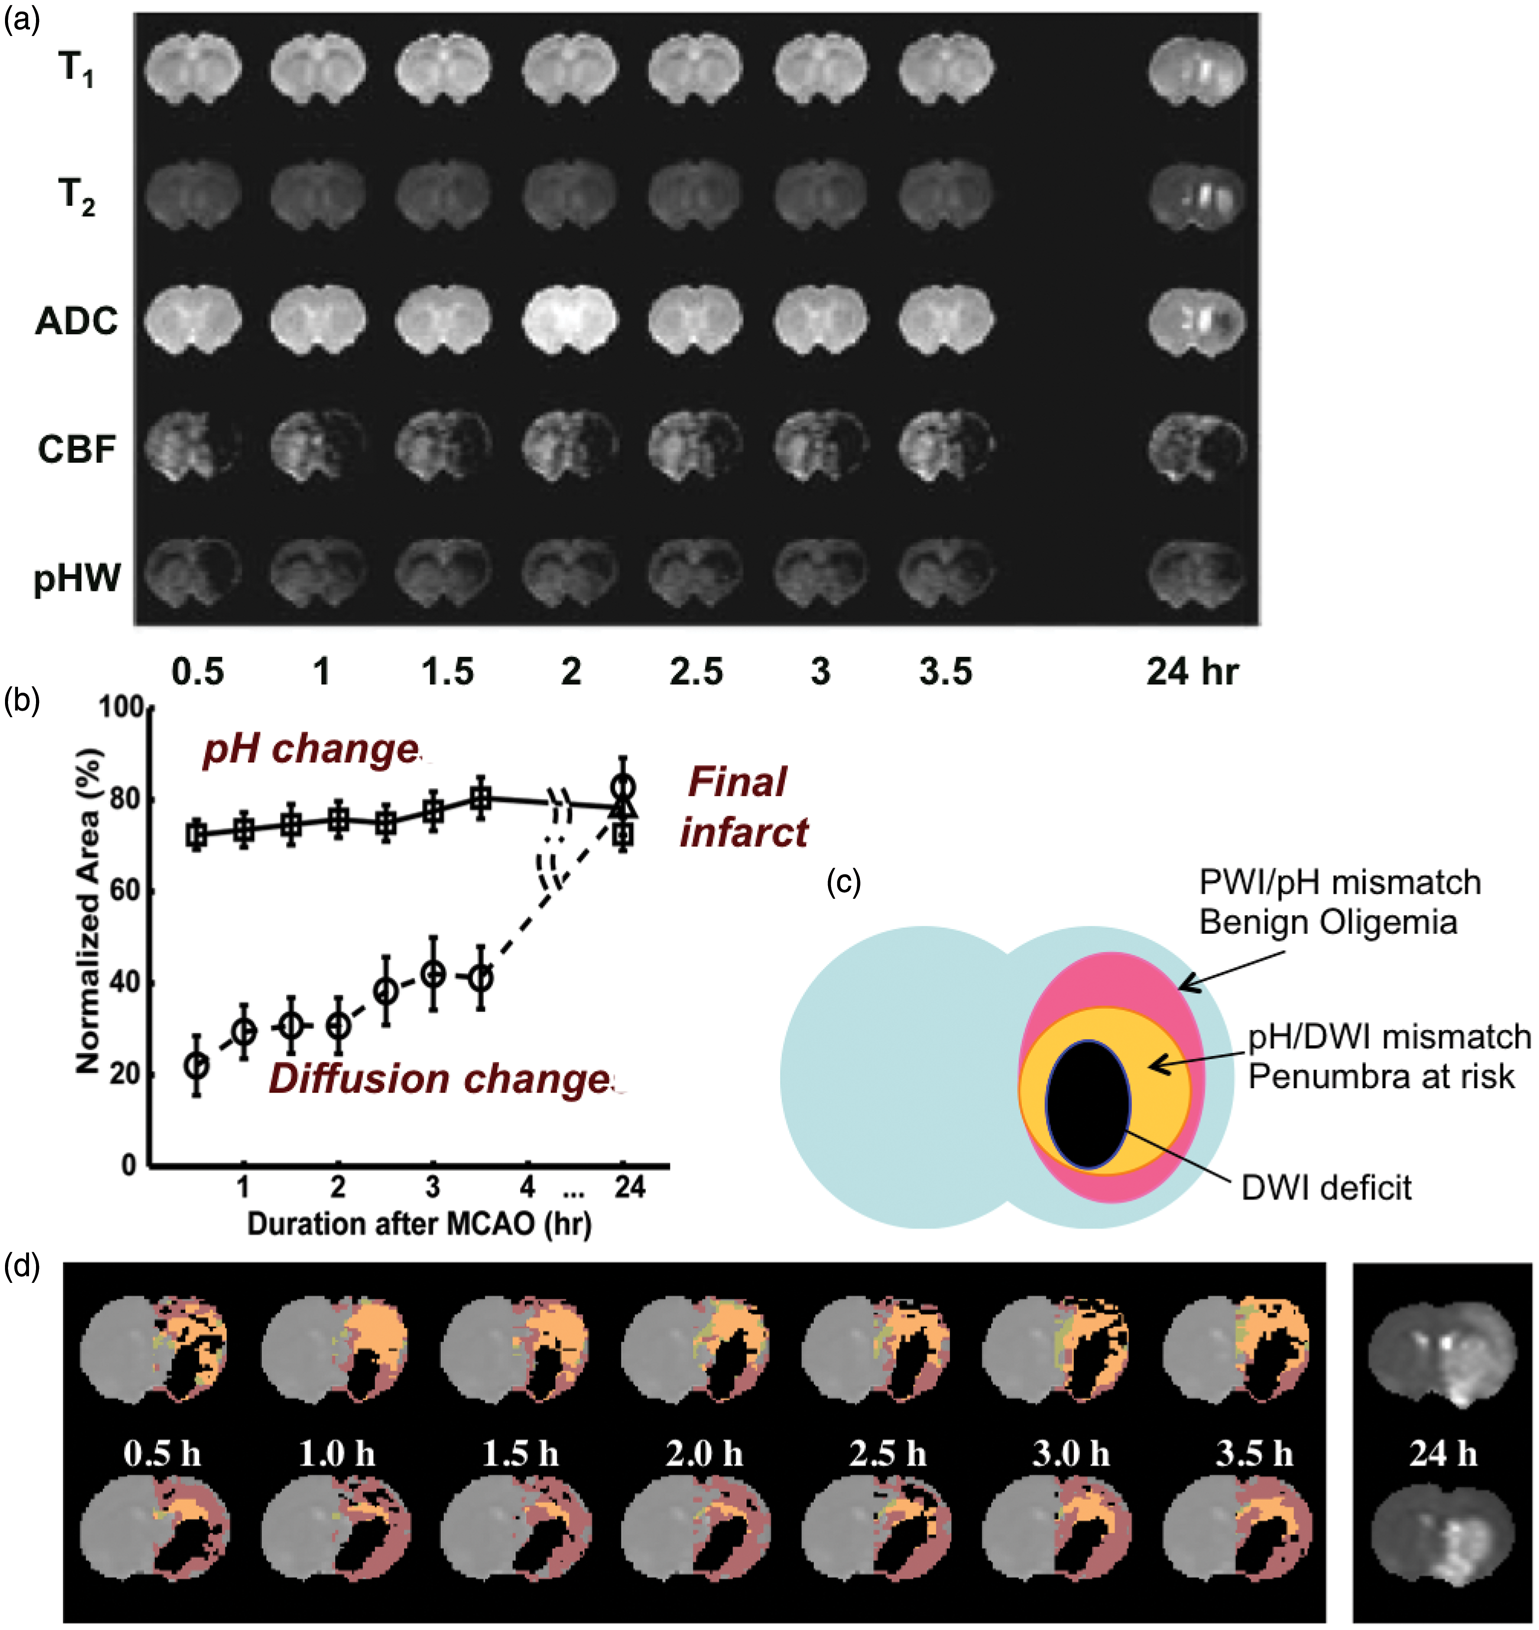
Prior to treatment, the infarct core and penumbra are commonly estimated by computed tomography perfusion (CTP) or perfusion- and diffusion-weighted MRI (PWI and DWI). Hyperintense regions on DWI (or hypointense on apparent diffusion coefficient (ADC) maps) are typically thought to represent the ischemic core, yet in some patients, subregions of the DWI lesion may not progress to infarction.119,120 Hypoperfused regions on DSC-PWI maps typically include core, penumbra, and areas of benign oligemia in which the tissue survives spontaneously without the need of recanalization121–124 and it may be challenging to distinguish these regions in many patients using existing imaging procedures. It is therefore desirable to improve existing and pursue new imaging approaches that may be capable of defining the penumbra more precisely. 125 It will be of interest to determine whether emerging techniques for penumbra assessment, such as intravoxel incoherent motion, resting-state functional MRI, OEF mapping, or pH mapping have a role in AIS imaging.126–128
Evaluation and management of AIS in the future could be based on evidence gleaned from recent clinical trials that have confirmed the important role of collateral circulation and related imaging markers. Although the definition of collaterals has historically been limited to the extent of arterial anastomoses providing compensatory blood flow to the ischemic territory at risk, collateral equivalents or imaging markers are now recognized in acute ischemia. For instance, non-contrast CT patterns of hypodensity such as regional Alberta Stroke Programme Early CT Score (ASPECTS) 129 topography may indirectly reflect the extent of collateral blood flow in proximal arterial occlusion of the anterior cerebral circulation. After the recent establishment of EVT as a proven strategy to improve the outcome of patients with AIS involving large vessel occlusions (which is still only about 25% of the acute stroke populations), the debate has revolved around how to best select patients for treatment in an unbiased manner (i.e. not on treating patients who would do well regardless of intervention). Future research needs to define the best way to select stroke patients for EVT, without excluding patients who might still benefit. Imaging tools will need to be optimized accordingly. 130 Most recently, it has been demonstrated that although the prognosis of patients with more extensive baseline lesions on either CT or MRI may be relatively worse, such patients may still benefit from intervention. 131 Recently, enrollment to the DWI or CTP Assessment with Clinical Mismatch in the Triage of Wake-Up and Late Presenting Strokes Undergoing Neurointervention (DAWN) trial was halted due to overwhelming efficacy of mechanical embolectomy with medical therapy vs. medical therapy alone in patients treated 6–24 h post-stroke. Information on collateral circulation could be used as a gauge for expectations and in the future to tailor the extent or duration of reperfusion efforts. Even after reperfusion, the serial imaging of infarct patterns and compensatory collateral circulation could be used to manage patients in the acute and subacute phase, but this is an area of future investigation.
Diagnostic tests
Non-contrast CT of the brain for detection of cerebral infarcts has been used for more than three decades and remains a first line imaging method in the setting of acute stroke with the primary role to evaluate for the presence of hemorrhage, a contraindication to intravenous tPA.
CTA has become part of the standard work-up of patients with suspected cerebral infarcts. With thrombectomy as a therapeutic option, the addition of CTA is now required for every stroke center to evaluate for the presence of an occluded intracranial artery that would be amenable to such intervention. In particular, the detection of proximal ICA stenosis will allow for evaluation of endarterectomy in addition to thrombectomy. A possible next step in the application of CTA in the work-up of patients with AIS is the inclusion of the heart in the field-of-view to rule out a cardiac cause of stroke such as thrombi from the heart. Furthermore, the more recently developed technique of multiphase CTA may be applied in the setting of arterial occlusion to detect the presence and extent of collateral vessels.
In the setting of hemorrhagic stroke, CTA may detect potential causes such as a vascular malformation or aneurysm with a predominant parenchymal hemorrhage. The spot sign on CTA may be indicative of acute leakage of contrast from the arterial vasculature, which has been found to be related to a growth of the hemorrhage and a worse prognosis. Finally, CTA may suggest an alternative diagnosis such as venous sinus thrombosis, (peripheral) vasoconstriction, AVM, or arterial-venous fistula.
CTP in AIS imaging has been popular in a clinical research setting in the last decade and is now widely applied in clinical practice. CTP allows for the calculation of CBF, CBV, time to peak (TTP), and mean transit time (MTT; mean time red blood cells spend to traverse the capillary circulation). MTT is also equivalent to the ratio, and identification of areas of ischemia/penumbra (prolonged MTT due to increased CBV and/or decreased CBF) and infarcted tissue (prolonged MTT due to very low CBF) are frequently considered. If there is reperfusion, hyperemia can lead to shortened MTT as well in parenchyma that may or may not be abnormal on DWI. By identifying a region of abnormal perfusion, CTP may aid in detection of peripheral intracranial arterial occlusion. Of note, the additional diagnostic information of CTP on top of patient symptoms and CT/CTA information has been questioned. 132 Small cerebral areas of ischemia with cellular depolarization (i.e. mostly destined to infarction) may be missed that are readily visible on MRI with DWI.
A typical MRI protocol in acute stroke patients will consist of the following sequences: DWI, T2-FLAIR, T2*, and possibly TOF-MRA and DSC-PWI. A primary advantage of MRI is the high sensitivity for small ischemic lesions with DWI sequences. Ruling out hemorrhage with T2*-weighted sequences is crucial to allow treatment with intravenous tPA, as this sequence has been shown to be equal to or better than CT for this purpose. 133 Fast TOF-MRA allows for the identification of the site of intracranial arterial occlusion. However, the quality and resolution of the fast TOF-MRA images may be limited and occlusions of smaller, more peripheral, intracranial arteries may be missed. An alternative method, contrast-enhanced MRA has the advantage that with the imaging during the first passage of the contrast bolus, both the extracranial and intracranial arteries can be imaged with higher CNR. DSC-PWI in acute stroke patients may enhance the detection of the location and extent of an area of ischemia and may be used to evaluate for potential perfusion–diffusion mismatches indicative of infarct growth. MTT is also a relevant indicator of the cerebral circulation as discussed above, and can be assessed from DSC-MRI. In recent years, ASL MRI has also been used for perfusion measurements in acute stroke patients.83,134,135 The limitations of MRI in acute stroke patients in many centers are the restricted availability, higher cost, and imaging time, and not all patients are MR-compatible and screening procedures may add time.
Emerging methods in acute stroke imaging
Expanding the acute stroke imaging infrastructure is inherently difficult, primarily due to time sensitivity, precluding potentially beneficial but time-consuming investigations such as those based on PET, and a general difficulty evaluating novel imaging approaches, which could delay treatment. Beyond these difficulties, major interests remain in the ability to estimate the time of onset in those with unwitnessed strokes, and to portend treatment efficacy, either tPA or EVT, on an individualized basis.
The estimation of stroke onset time may be possible using CT-based water quantification techniques 136 or MRI-based relaxometry, 137 enabling treatment to be administered in patients who cannot currently receive it. Triaging patients for treatment beyond currently accepted therapeutic windows would require improved delineation of infarcted tissue (tissue not salvageable), penumbra (tissue at risk but salvageable), and benign oligemia (hypoperfused tissue not at risk). Patients with large penumbra regions may benefit from tPA even after the standard thrombolysis treatment window, but establishing this requires additional clinical trials that likely incorporate neuroimaging. These methods could focus on measuring the extent of collateralization through analyzing DSC source data,138,139 the use of vessel-selective ASL techniques, measuring the extent of collateralization through vessel-encoded angiography or perfusion imaging, or measuring OEF, MTT, CMRO2, and/or pH throughout the ischemic core and penumbra. MR-based methods have been under development for this purpose since the early 1990s.140,141 Emerging MRI methods for evaluating OEF and CMRO2 using quantitative BOLD from asymmetric spin echo (ASE) 142 scans, quantitative blood T2 measurements143–146 (which can then be converted to blood oxygenation level), and T2*-weighted imaging during hyperoxia 147 hold promise but have not been applied in large-scale human studies. Amide proton transfer (APT) chemical exchange saturation transfer (CEST) MRI utilizes a contrast mechanism that depends on water and amide proton exchange. This exchange rate is base-catalyzed over a physiological range and therefore provides pH sensitivity148,149 and may detect ischemic tissue acidosis in the infarct150–152 (Figure 6). It is likely that a fast, multimodal protocol which encompasses measurements of diffusion, perfusion, OEF, MTT, oxygen metabolism, and pH could improve abilities to quantify the spatial extent of the ischemic penumbra, with high apparent ADC indicating tissue likely destined for infarction, but preserved ADC with reduced perfusion, 153 elevated OEF, 154 and/or moderately reduced pH155–157 indicating tissue at risk of infarction but potentially salvageable. Also high and low ADC may indicate infarction, but high ADC can be observed on conventional T2-weighted FLAIR, whereas low ADC is suggestive of cytotoxic edema, and often considered infarct core. Testing such hypotheses will require faster scan times for these methods, perhaps facilitated by recent advances in accelerated imaging.71,158,159
Additionally, recent studies have suggested the relevance of collateral evaluation in triaging patients for stroke treatments. Ongoing endovascular trials and registries will provide important data on how collaterals influence the course of late-presenting patients, even beyond the traditional time windows for acute AIS therapies. It remains unknown whether all such patients have more robust collaterals that have sustained them longer or if the same range of collateral grades and perfusion patterns may be seen at these later time points. As future trials are developed to study novel devices and expanded treatment windows, impact of adjunctive medications, anesthesia and other factors, and collateral status will be a required component of such analyses. Emerging data on large-scale registries in acute stroke will also provide important insight on how collaterals vary around the world and impact in a broad range of acute AIS scenarios.
Stroke recovery
Macrovascular and tissue-level changes after stroke
The majority of stroke survivors are impaired, with nearly 33% institutionalized160–162 and fewer than 25% able to perform pre-stroke equivalent levels of physical activity during the six months post-stroke. 163 Only 10% of stroke patients recover completely. Thus, comprehensive systems of care are necessary which include functional mobility and cognitive rehabilitation. 164 No screening procedures are available in the clinic to guide patient selection for rehabilitative therapy.
Focal brain injury due to stroke affects global brain function through disruption of structural and functional connections between local and remote brain regions. Subsequent remodeling of neural networks, occurring at micro- (e.g. synaptogenesis), meso- (e.g. recruitment of accessory neuronal pathways), and macroscales (e.g. cortical remapping), may contribute to functional adaptation or compensation over time. 165 Yet, it remains largely unknown how specific plasticity processes contribute to functional improvement, and to what degree brain adaptations could be modulated to promote functional recovery. Various therapeutic approaches to improve neurorehabilitation have been suggested, including administration of growth-promoting drugs and stem cells, 166 and non-invasive brain stimulation, 167 but so far none of these have been effectively incorporated into standard clinical practice. It is also likely that more comprehensive surveillance of stroke survivors is required, as summarized in a recent article outlining likely requirements of impactful neural rehabilitative trials post-stroke. 168
Imaging enables measurement of long-term spontaneous or treatment-induced alterations in brain structure and function during recovery from stroke. Functional MRI studies in patients and animal models have demonstrated that functional recovery is associated with preservation or reinstatement of perilesional activity and interhemispheric connectivity within intact networks.169–171 Additionally, diffusion tensor imaging (DTI) studies have shown that functional outcome is linked to the structural integrity of remaining neuronal tracts.169,171 These imaging methods may therefore contribute to outcome prediction, therapy selection, and treatment monitoring in recovering stroke patients.
Neuronal excitability is mediated by glutamate and γ-aminobutyric acid (GABA), the primary excitatory and inhibitory neurotransmitters in adult brain, respectively.172,173 In AIS, extracellular GABA may increase, resulting in increased tonic inhibition and excitability thresholds.174,175 This increase in tonic inhibition is likely a safety mechanism imposed by the brain as a means to minimize neuronal damage during the initial stroke. However, as this increase in inhibition persists through sub-acute and chronic stages, it influences long-term potentiation and depression and hinders plasticity, or cognitive remapping. If the neurochemical environment can be modulated, spared peri-infarct tissue offers increased potential for plasticity. Adjuvant therapeutic modulation of excitability in both hemispheres has been shown to enhance recovery following stroke through both upregulation of excitability in the lesioned hemisphere176,177 and downregulation of excitability in the intact hemisphere178,179 using transcranial magnetic stimulation (TMS) or transcranial direct-current stimulation (tDCS). Recent work has also demonstrated recovery effects following pharmacological manipulation of tonic inhibition post-stroke.174,180,181 However, fundamental gaps in our knowledge persist regarding optimized implementation of these therapies and details of the physiological changes they elicit. 182 Due to the biphasic role of GABA following stroke, it is likely that a subgroup of patients will benefit from dampening of GABAergic inhibition, whereas this dampening may be harmful to patients in whom the inhibition is protective. Unfortunately, there is no consensus regarding an effective primary outcome measure in randomized controlled trials for addressing these questions. 183 The development and evaluation of novel rehabilitation strategies would be accelerated with a noninvasive imaging test to measure plasticity potential.
Neuronal and hemodynamic reorganization have been reported to occur over different anatomical scales during motor recovery: local rearrangement within primary motor cortex, increased activity in ipsilesional non-primary sensorimotor areas, and increased activity in the uninjured hemisphere. 184 Therefore, methods that are able to measure an array of changes to tissue physiology, over a broad spatial scale, are needed. More specifically, following stroke, corticospinal tract damage is a well-known predictor of poorer functional outcomes, 185 and by incorporating additional measures of excitability in ipsilesional motor cortex and interhemispheric functional connectivity, it has been reported that as much as 81% of variance in motor performance can be explained. 186 Furthermore, in a small cohort of patients, it has very recently been suggested that the degree of cortical inhibition within a voxel may predict response to tDCS therapy. 187 Therefore, multi-modal neuroimaging measurements of tissue structure and function have been suggested to have relevance for both predicting functional outcomes after stroke, as well as for predicting treatment efficacy. These studies suggest that inter-individual differences in response to intervention arise from individual factors that determine susceptibility to plasticity-inducing therapy. Individualized imaging biomarkers are needed to help stratify patients according to treatment responsiveness.
Post-stroke therapeutic interventions
A number of potential avenues for post-stroke therapy are currently being explored. The rationale for adjunctive therapies stems from the widely held theory that the functional benefits of physiotherapy are largely mediated via a combination of functional and structural plastic brain changes. Interventions that can be demonstrated to modulate brain plasticity, from pharmacological interventions to non-invasive brain stimulation (NIBS), have therefore largely been developed from the context of plasticity-inducing protocols in animal models or in healthy controls. This approach brings with it a number of important factors to consider, however, when developing successful therapies for patients: (1) it is plausible that long-term plastic changes will only be induced by multiple sessions, and (2) these therapies are unlikely to cause a functional improvement when applied on their own, but rather require combined use with physiotherapy. 188
Few putative therapies have been translated into clinical trials. This so-called translational road block 189 has arisen for a number of reasons, including the need to extrapolate approaches from animal models, to optimize parameters for pharmacological or stimulation interventions, and to identify patients most likely to respond to a given therapy. The large size of randomized control trials needed to adequately power studies to investigate the effects of adjunctive therapies, where multicenter trials would be required to overcome the noise imparted by the inherent heterogeneity of patient populations, has to date largely proved an insurmountable obstacle.
Despite this challenge, some pharmacological interventions, particularly the selective serotonin-reuptake inhibitors (SSRIs) such as fluoxetine, and NIBS techniques such as TMS and tDCS have shown promise in proof-of-principle studies. The SSRI fluoxetine has been shown to improve functional recovery in stroke patients even in the absence of depressive symptoms,190,191 though it is not used routinely in clinical practice. NIBS approaches, and in particular tDCS, have also been demonstrated to lead to significant long-term clinical improvements. Anodal tDCS to the ipsilesional motor cortex192,193 and bilateral tDCS, where the anode is placed over the ipsilesional M1 and the cathode over the contralateral M1194,195 show particular promise, though the evidence for their use is still from small studies and requires further, large-scale, testing. 196
Future directions
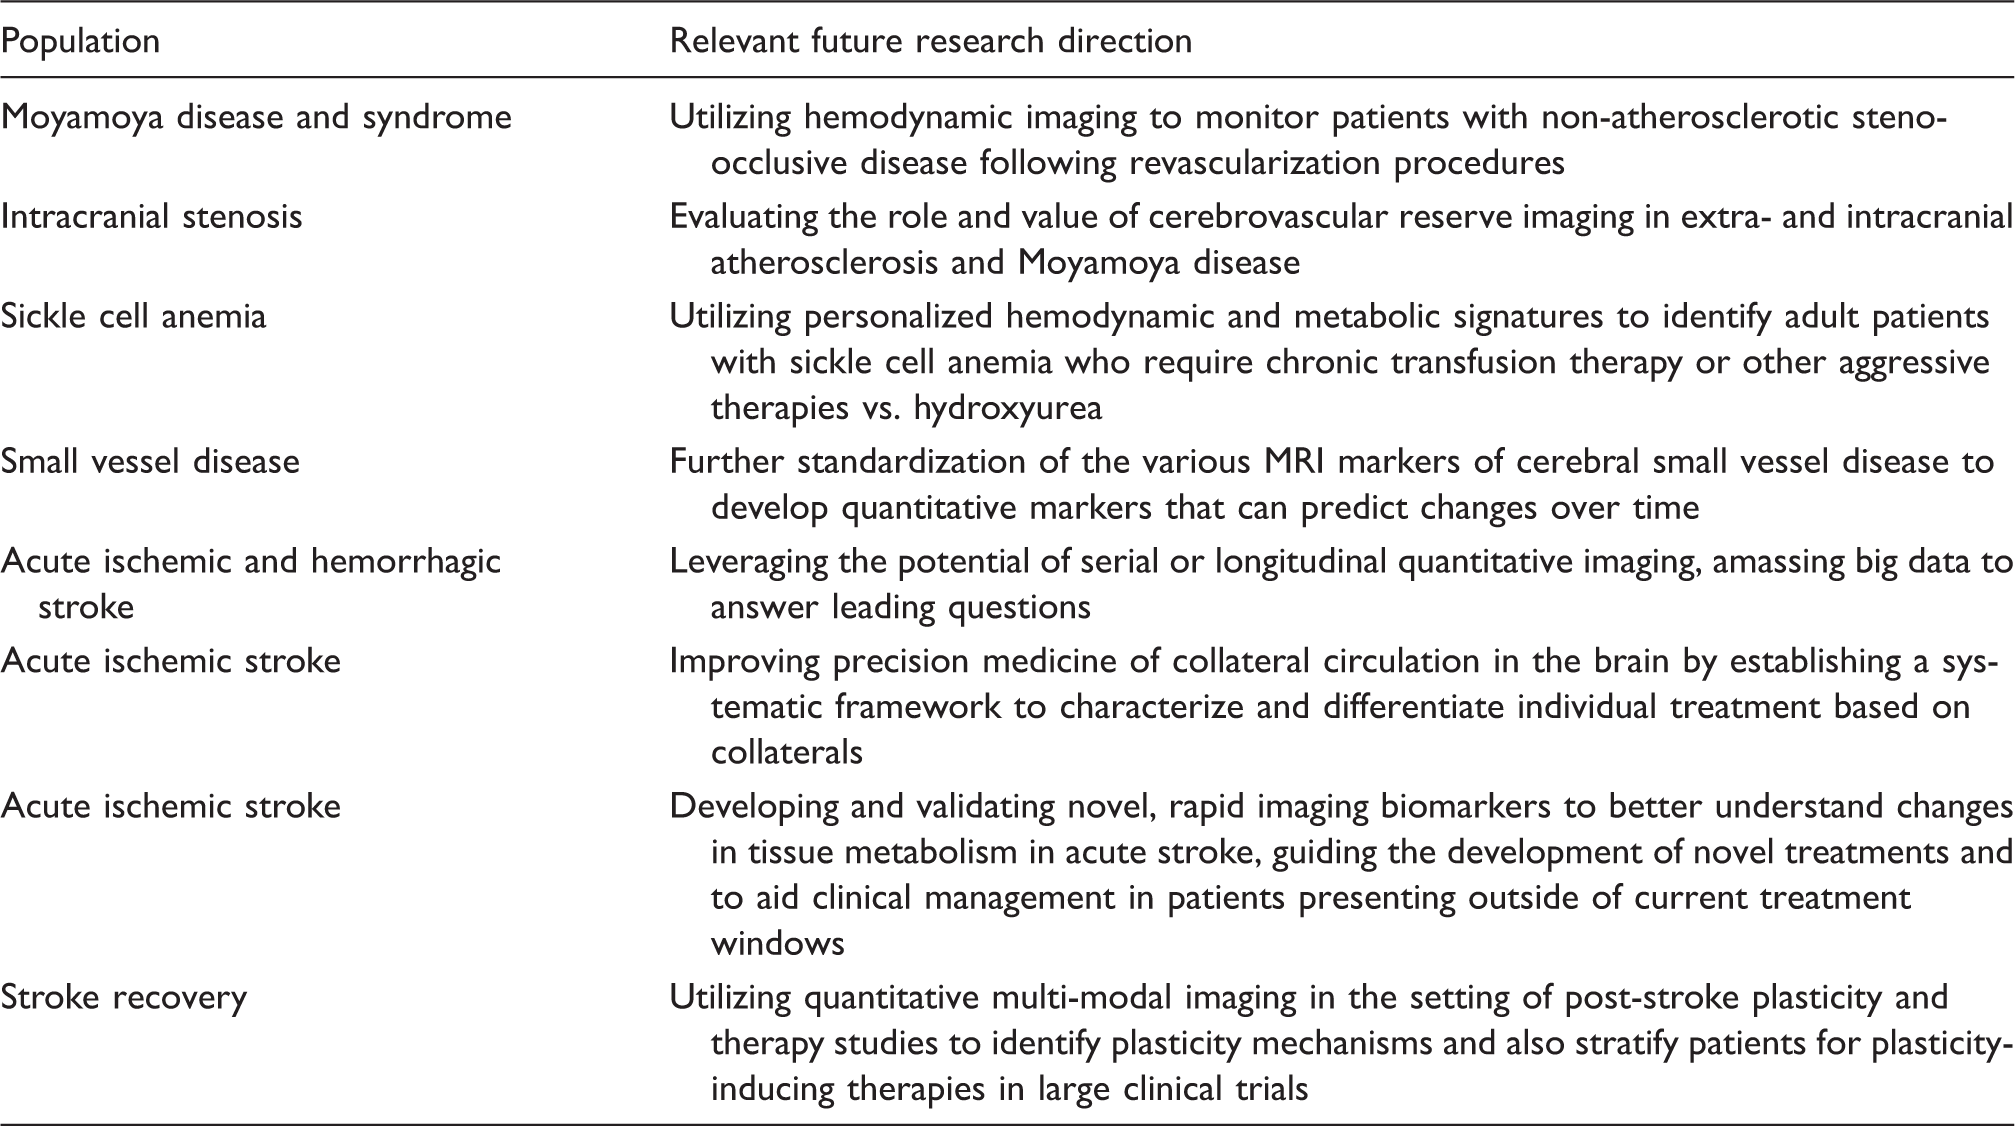
Recommended relevant research directions in the setting of cerebrovascular disease.
The imaging approaches outlined in the prior two sections are largely relevant for monitoring and evaluating post-stroke plasticity mechanisms, and can also be supplemented with quantitative spectroscopic imaging of GABA and glutamate, respectively. More specifically, fMRI, which most commonly exploits BOLD contrast, 197 is the most popular method for measuring brain function. However, BOLD signal is only an indirect and relative marker of neuronal activity, arising from complex neurochemical, metabolic, and hemodynamic modulations.197–199 Limited data are available on how BOLD signals relate to neurochemistry, which is likely relevant to plasticity studies. Alternative fMRI approaches sensitive to individual hemodynamic parameters, e.g. CBF, can be applied for more comprehensive investigations, 200 and such methods can be used to disambiguate absent BOLD responses in motor cortices of patients successfully performing motor tasks but with disrupted neurovascular coupling after stroke. 201 Additionally, using 1H magnetic resonance spectroscopy (MRS) and spectral editing,202–204 it is possible to measure GABA and glutamate. 205 In recent independent studies, GABA has been shown to correlate inversely with the BOLD response in human visual cortex 206 and rat somatosensory cortex, 207 and directly with negative BOLD responses in anterior cingulate cortex. 208 A limitation of MRS in stroke research is its poor spatial coverage, prohibiting comparison between affected and intact tissue. Feasibility of GABA MR spectroscopic imaging (MRSI) for regional GABA quantitation has been demonstrated 209 ; GABA MRSI could be well-suited to study regional differences in GABA post-stroke, but has not yet been implemented widely in patients. Newer developments that increase spatial coverage and reduce scan times hold promise. 210
Concluding remarks and future directions
This document is intended to highlight major advancements in different stages of stroke research, as well as to highlight current unmet clinical needs and future directions. Given the rapid advancement of neuroimaging methods for visualizing known physiological stroke risk factors, a major area of CVD research over the next decade will likely focus on stratification of patients for personalized therapies. As outlined above, this will likely span the spectrum of CVD and include identifying inadequate hemo-metabolic compensation mechanisms in patients with chronic arterial steno-occlusive disease, identifying collateralization extent and the ischemic penumbra in patients with acute stroke, and utilizing neuroimaging to monitor patients post-stroke and even titrate therapies based on individual potential for plasticity-inducing therapies. Realizing these goals will require coordinated efforts between the clinicians who actively manage such patients (e.g. neurologists, cardiologists, neurosurgeons, and therapists) and imaging specialists (e.g. radiologists and imaging physicists) who can develop and implement appropriate measurement tools. Relevant research areas that have been suggested by the panel of authors are highlighted in Table 3. It should also be noted that several important areas of CVD have not been covered in this consensus statement due to space restrictions, including neonatal stroke, 211 small vessel disease,62,63 inflammation, 212 cervical dissection, 213 cerebral aneurysms, 214 cardiovascular risk factors, 17 and neural repair mechanisms, 168 however much of the above summary is relevant to these conditions as well, and the above citations and references therein highlight these areas in more detail for the interested reader.
Footnotes
Funding
The author(s) disclosed receipt of the following financial support for the research, authorship, and/or publication of this article: MJD is supported by the American Heart Association (14CSA20380466 and 14GRNT20150004), NIH/NINDS (5R01NS078828, 1R01NS097763), and NIH/NINR (6R01NR015079). F-EdL is supported by a clinical established investigator grant of the Dutch Heart Foundation (grant number 2014 T060) and by a VIDI innovational grant from The Netherlands Organisation for Health Research and Development (ZonMw grant 016.126.351). MAI is funded through the Netherlands Heart Foundation (2012T008). TWO is supported by the Royal Academy of Engineering. JH has received funding from the European Research Council under the European Union’s Horizon 2020 Programme (H2020)/ERC grant agreement n°637024 (HEARTOFSTROKE), H2020 grant agreement No 666881, SVDs@target and receives salary support by from the Netherlands Organization for Scientific Research (NWO) under grant n°91712322.
Declaration of conflicting interests
The author(s) declared the following potential conflicts of interest with respect to the research, authorship, and/or publication of this article: OW is the co-inventor of a patent on Delay-compensated calculation of tissue blood flow, US Patent 7,512,435, 31 March 2009, and the patent has been licensed to General Electric, Siemens, Imaging Biometrics and Olea Medical. TWO is an author on a US patent application relating to the analysis of vessel-encoded ASL data.