
Abstract
Global cerebral ischemia is a debilitating injury that damages the CA1 region of the hippocampus, an area important for learning and memory. Protein kinase C epsilon (PKCɛ) activation is a critical component of many neuroprotective treatments. The ability of PKCɛ activation to regulate AMPA receptors (AMPARs) remains unexplored despite the role of AMPARs in excitotoxicity after brain ischemia. We determined that PKCɛ activation increased expression of a protein linked to learning and memory, activity-regulated cytoskeleton-associated protein (arc). Also, arc is necessary for neuroprotection and confers protection through decreasing AMPAR currents via GluR2 internalization. In vivo, activation of PKCɛ increased arc expression through a BDNF/TrkB pathway, and decreased GluR2 mRNA levels. In hippocampal cultured slices, PKCɛ activation decreased AMPAR current amplitudes in an arc- and GluR2-dependent manner. Additionally, PKCɛ activation triggered an arc- and GluR2 internalization-dependent delay in latency until anoxic depolarization. Inhibiting arc also blocked PKCɛ-mediated neuroprotection against lethal oxygen and glucose deprivation. These data characterize a novel PKCɛ-dependent mechanism that for the first time defines a role for arc and AMPAR internalization in conferring neuroprotection.
Keywords
Introduction
Out-of-hospital cardiac arrests (CAs) affect approximately 400,000 people every year in the United States and have a survival rate of only 8%.1,2 Survivors often suffer from brain damage and irreversible learning and memory deficits 3 as a consequence of the global cerebral ischemia-induced neuronal damage. 4 The lack of oxygen and glucose during cerebral ischemia results in a bioenergetics failure leading to a phenomenon known as anoxic depolarization (AD), a sustained and potentially irreversible depolarization of neurons.5–7 Vulnerable regions of the brain, such as the CA1 region of the hippocampus, are often affected following ischemia8,9 and cell death can occur.10–12
An effective neuroprotective strategy against cerebral ischemia is ischemic preconditioning (IPC).13,14 IPC is the treatment of the brain with sub-lethal ischemia followed by a period of recovery prior to a lethal ischemic insult; the sublethal ischemia primes the brain resulting in neuroprotection. Previous research in our laboratory determined that activation of the epsilon isoform of protein kinase C (PKCɛ) is necessary for the neuroprotective effect of IPC.14,15 Also, the application of a specific activator of PKCɛ, ψɛ-Receptor of Activated C Kinase (ψɛRACK), can be used as a neuroprotective, pharmacological mimetic of IPC, conferring neuroprotection 48 h after treatment.14,15
Previously, we showed that activation of PKCɛ with ψɛRACK can also modulate the synapse by increasing the amplitude of miniature inhibitory postsynaptic currents (mIPSCs). 16 Other groups have shown a less specific PKCɛ activator, bryostatin (also promotes PKCα activation), increases spontaneous IPSCs in CA1 hippocampal neurons, 17 enhances synaptogenesis following stroke in neonatal rats, 18 and promotes survival in aged rats following stroke. 19 However, the specific activation of PKCɛ and its ability to confer neuroprotection through modulation of excitatory synapses has not previously been investigated.
In a recent study, we found that two days following an application of ψɛRACK, BDNF protein expression increased, and this increase was linked to decreases in CA1 neuronal action potential firing rates and delayed the onset of AD during oxygen-glucose deprivation (OGD). 20 In the same study, nonspecific inhibition of Trk receptor signaling abolished IPC and ψɛRACK induced neuroprotection. BDNF protects neurons against hypoxia through a mitogen activated protein kinase (ERK)/mitogen-activated protein kinase kinase (MEK)-dependent pathway. 21 This signaling pathway (i.e. BDNF/MEK/ERK) was also implicated in the increased expression of activity-regulated cytoskeleton-associated protein (arc).22–26 Arc decreases AMPA receptor (AMPAR) number and current at excitatory synapses 27 and protects against the effects of an apoptosis inducing protein, Amida, in COS-7 cells. 28 The role of arc in preconditioning-induced neuroprotection has not previously been investigated. Therefore, we sought to test the hypothesis that PKCɛ-activation enhances BDNF expression and its known downstream signaling partner arc, thereby conferring neuroprotection against a lethal ischemic injury through an AMPAR-dependent mechanism.
Materials and methods
Animal care
All animal procedures were carried out in agreement with the Guide for the Care and Use of Laboratory Animals and approved by the Animal Care and Use Committee of the University of Miami. Animals were supervised and housed in facilities of the division of veterinary resources with free access to food and water. They were transported to the laboratory only for administration of anesthesia, experimental procedures, and to be sacrificed.
In vivo injections
Twenty-five-day-old male Sprague Dawley rats (Charles River Laboratories, Wilmington, MA, USA) were injected intraperitoneally (i.p.) with the PKCɛ-specific activator, ψɛRACK or TAT-peptide control (KAI Pharmaceuticals, San Francisco, CA, USA) at a dose of 0.2 mg/kg, a neuroprotective concentration in vivo. 29 Brains were used for Western blotting, immunofluorescence, or RNA experiments.
Organotypic hippocampal cultured slice preparation
Hippocampal cultured slices were prepared as previously described. 14 Briefly, P9-13 Sprague Dawley pups were anesthetized (1 mg/kg ketamine), decapitated, and hippocampi were isolated and placed on a custom-made tissue chopper. Transverse slices (400 µm) were placed into 4℃ Gey’s Balanced salt solution. Slices with distinct and intact hippocampal morphology containing the dentate gyrus, CA3, and CA1 were plated onto 0.4-µm Millicell well inserts (Millipore, Billerica, MA, USA) in media containing 25% horse serum, 25% Hanks balanced salt solution (HBSS), and 50% minimal essential media, supplemented with 1 mM glutamine and 30 mM glucose. Media was changed one day following plating and subsequently twice a week. Experiments began 14 days after culturing. Slices were used for electrophysiology, Western blotting, or cell death experiments. Unless specified, all chemicals were purchased from Sigma-Aldrich (St. Louis, MO, USA).
Drug administration for hippocampal cultured slices
For PKCɛ-activation, slices were treated with 200 nM of ψɛRACK 14 for 1 h and kept at 36℃. For experiments blocking TrkB, the specific TrkB inhibitor, ANA-12 (10 µM), 30 was administered 24 h prior to ψɛRACK treatment. To determine the effect of blocking arc expression, 1 nM arc antisense oligodeoxynucleotide (arc AS ODN) or 1 nM scrambled control ODN (SC ODN) was added to each well 24 h prior to ψɛRACK or TAT treatment. ODNs were prepared in PBS (pH 7.4). ODN sequences: arc AS ODN: 5′-GTCCAGCTCCATCTGCTCGC-3′; SC ODN: 5′-CGTGCACCTCTCGCAGCTTC-3′ the three outer most linkages contain phosphorothiate linkages (Midland Certified Reagent Company, Midland, TX, USA).31–33 For experiments examining the role of GluR2 internalization, 10 µM of TAT-GluR23Y (prevents GluR2 internalization) or TAT-GluR23A (control) was added into the internal solution. Peptide sequences are as indicated in Ahmadian et al.: 34 TAT-GluR23Y sequence N′ to C′: YGRKKRRQRRRYKEGYNVYG; TAT-GluR23A sequence: YGRKKRRQRRRAKEGANVAG (Anaspec, Freemont, CA, USA). Peptide was allowed to defuse into the cell for 10 min prior to recordings.
Oxygen and glucose deprivation
Slices were washed three times in glucose-free HBSS containing 1.26 mM CaCl2 5.37 mM KCl, 0.44 mM KH2PO3, 0.49 mM MgCl2, 0.41 mM MgSO4, 136.9 mM NaCl, 4.17 mM NaHCO3, 0.34 mM Na2HPO4, and 30 mM sucrose. Slices were placed in fresh glucose-free media and moved into an airlock chamber (Coy Lab Products, Grass Lake MI, USA) flushed with 90% N2/5%CO2/5%H2 gas (37℃) to remove oxygen. Following 35 min of oxygen and glucose deprivation (OGD), slices were returned to a 36℃ normoxic incubator with fresh glucose containing media.14,16
Western blotting
Tissue was homogenized in RIPA buffer solution (pH 8.0) containing 150 mM NaCl, 1% NP-40, 0.5% sodium deoxycholate, 0.1% SDS, 50 mM Tris, supplemented with 1% protease antibodies (Sigma) and phosphatase inhibitor cocktails (Roche Molecular Systems Inc., Branchburg, NJ, USA). Lysates were centrifuged at 16,000 g for 15 min. Protein was concentration determined by Bio-Rad protein assay (Bio-Rad, Hercules, CA, USA). Protein samples (30 or 40 µg) were separated on a 10 or 12% SDS-PAGE gel then electrophoretically transferred onto nitrocellulose membranes (Bio-Rad). Blots were blocked in 5% milk in Tris-buffered saline with 1% tween then incubated overnight in primary antibody in 5% milk. Blots were washed then incubated for 1 h in horseradish peroxidase-conjugated anti-mouse or anti-rabbit secondary antibodies (Sigma). Blots were developed on film or using the VersaDoc 4000 MP (Bio-Rad). For blots imaged using the VersaDoc, each blot was imaged so that intensity of samples was within a linear range. Westerns were quantified using ImageJ. Antibodies used: actin (Sigma, 1:5000), BDNF (Santa Cruz Biotechnology, Santa Cruz, CA, USA,1:200), TrkB (Cell Signaling Technologies, Boston, MA, USA, 1:1000), phosphorylated TrkB (pTrkB) (Millipore, 1:1000), and arc (Santa Cruz, 1:200).
Immunofluorescence
Twenty-five-day-old Sprague Dawley rats were anesthetized, then perfused with saline followed by 4% paraformaldehyde in PBS and post-fixed overnight. Brains were removed, cryoprotected in a 20% sucrose solution for two days, frozen, then cryosectioned (30 µm). Coronal hippocampal sections were taken at −3.8 mm bregma. Sections were washed in PBS with 0.8% triton X-100 (PBST) three times and blocked overnight at 4℃ in 10% goat serum in PBST. Sections were then washed three times in PBST and incubated with 1:500 NeuN (Millipore) and 1:50 Arc (H-300 Santa Cruz) in PBS for 72 h. Slices were then washed in PBS three times and secondary anti-mouse alexa fluor 568 (Life Technologies, Grand Island, NY, USA, 1:500) and anti-rabbit hilyte fluor 488 (AnaSpec, 1:500) were applied for 2 h at room temperature. Slices were mounted using Prolong Antifade reagent (Molecular Probes, Carlsbad, CA, USA) and visualized using a Zeiss LSM 700 Confocal microscope at 63X magnification.
Real-time PCR analysis
RNA was extracted from the hippocampi of 25-day-old rats 48 h following an i.p. injection (0.2 mg/kg) of ψɛRACK or TAT control. RNA was extracted as described.35,36 Briefly, hippocampi were homogenized in TRIzol (Life Technologies, Carlsbad, CA, USA) followed by column RNA extraction using the RNeasy Mini kit (Qiagen, Hilden, Germany). To remove contaminating DNA, DNase digestion (Qiagen) was performed during the RNA extraction procedure. RNA (1 µg) was then reverse transcribed using the qScript cDNA synthesis kit (Quantabio, Beverly, MA, USA). cDNA was then diluted 1:5 and used as a template for real-time PCR analysis using Power SYBR green PCR Master Mix (Life Technologies). The relative expression was calculated based on the ΔΔCt method with β-actin (ACTB) used as an endogenous control. Three technical replicates were performed for each qRT-PCR reaction. The target mRNA for rat genes was obtained from Ensembl and primers were designed to amplify a product size between 80 and 120 bases and to span an exon junction to avoid the amplification of any residual DNA contaminants. Primer sequences (from 5′to 3′): Arc forward: TTCAGAGCCAGGAGAACGAC; Arc reverse: CAGGCAGCTTCAAGAGAGGA; Actin forward: GTCTTCCCCTCCATCGTG; Actin reverse: AGGGTCAGGATGCCTCTCTT; GluR1 forward: GAAGCAGGCTCCACTAAGGA; GluR1 reverse: ACGGATGGTTCTGCAGACTT; GluR2 forward: ATGGGACAAGTTCGCATACC; GluR2 reverse: ACCTGCCACTTCTTCTCTGC; GluR3 forward: GGGTGCCATTCTGAGTCTTC; GluR3 reverse: CTGCTGCCTCCATAATTGCT; GluR4 forward: TGAGCCTCCTGGATCACTATG; GluR4 reverse: CCATCCATTTTGTCCTGCTT.
Propidium iodide measurements of cell death in organotypic slices
Slices were incubated in media supplemented with 2 µg/mL propidium iodide (PI). PI fluorescence was measured at four time points: (1) prior to ODN administration, (2) prior to OGD, (3) 24 h after OGD, and (4) 24 h following an hour application of 500 nM NMDA (to cause maximal neuronal death). Images of the CA1 region were captured with an Olympus IX50 fluorescent microscope using SPOT CCD camera and software and quantified with ImageJ. OGD-mediated cell death was quantified as % PI fluorescence expressed as [(post OGD – prior to OGD)/(post NMDA – prior to OGD)] × 100. 37 Toxicity of ODN treatment was quantified as % PI fluorescence expressed as [(prior to OGD – prior to ODN)/(post NMDA)].
AMPA miniature excitatory postsynaptic current measurements
Whole-cell voltage clamp was used to record miniature excitatory postsynaptic (mEPSC) AMPAR-mediated currents. Forty-eight hours after treatment with TAT or ψɛRACK in the presence or absence of SC or arc AS ODNs, organotypic hippocampal cultured slices were submerged in an external solution containing 150 mM NaCl, 3.0 mM KCl, 2.5 mM CaCl2, 1.3 mM MgSO4, 1.3 mM NaPO4, 25 mM NaHCO3, 10 mM glucose, and bubbled with 95%O2/5%CO2. Bicuculline (10 µM), D-(-)-2-amino-5-phosphonopentanoic acid (20 µM, APV) and tetrodotoxin (1 µM, TTX) were added to inhibit GABA receptor currents, NMDA receptor currents, and spontaneous EPSCs, respectively. The internal solution of the pipette contained 122.5 mM CsMSO4, 10 mM CsCl, 10 mM HEPES, 10 mM EGTA, 10 mM glucose, 8 mM NaCl, 2 mM MgATP, 1 mM CaCl2, and 0.3 mM NaGTP at pH 7.4 (with NaOH) and 317 mOsm. For experiments examining the contribution of GluR2 endocytosis, TAT-GluR23Y (GluR2 endocytosis inhibitor) or TAT-GluR23A (control) peptide was added into the internal solution. Pipettes (2-5 MΩ) were made from borosilicate glass capillaries (Word Precision Instruments, Sarasota, FL, USA). CA1 hippocampal pyramidal neurons were targeted and visualized using Alexa 488 dye. One cell was patched per slice equating to an n = 1. A GΩ seal was obtained followed by a whole cell configuration in voltage clamp mode. Access resistance was maintained under 20 MΩ and recordings that drifted more than 4 MΩ were discarded. Two minute gap-free recordings were obtained in current clamp mode using the program pCLAMP 9.0 (Molecular Devices, Silicon Valley, CA, USA). The first 100 miniature events over each gap-free recording for each cell were used for analysis of maximum amplitude, maximum amplitude distribution, and event frequency. If less than 100 events occurred, the total number of events in the recording were used. mEPSCs were selected using Clampfit event detection software with a custom made filter.
Anoxic depolarization
Organotypic slices were used to obtain whole cell recordings 48 h following treatment with TAT or ψɛRACK in the presence or absence of SC or arc AS ODNs. Slices were in the same external solution described above excluding bicuculline and APV. The internal solution of the pipette contained 140 mM K+-gluconate, 5 mM KCl, 10 mM HEPES, 10 mM EGTA, 2 mM MgCl2, 2 mM MgATP, and 0.5 mM NaGTP (pH 7.33). For experiments with the TAT-GluR23Y or TAT-GluR23A peptides, peptides were added into the internal solution. CA1 hippocampal pyramidal neurons were targeted and visualized using Alexa 488 dye. One cell was patched per slice equating to an n = 1. Whole cell configuration and access resistance were maintained as described above. To initialize the OGD, the external perfusate was switched to a glucose free media (where sucrose replaces glucose) that was vigorously bubbled with a 95% N2/5%CO2 gas mixture. Latency until AD onset was marked as a rapid change from resting membrane potential. 38
Statistical analysis
Results are expressed as means ± SEM. Student’s t-test, one-way ANOVA with Bonferroni post-hoc analysis, linear regression, and Kolmogorov-Smirnov statistical tests were used as indicated. Significance denoted as * = p < 0.05, ** = p < 0.01, and *** = p < 0.005. Statistical software SPSS version 21 was used. For Western blot experiment confirming knockdown of arc with arc AS ODN in organotypic hippocampal cultured slices, slices obtained from one animal were divided into two groups and treated with SC ODN or arc AS ODN. Twelve hippocampi slices from the same litter and same treatment were pooled for Western blot analysis for an n = 1. Healthy organotypic slices were selected randomly from each plate for each treatment group for all organotypic experiments. Researchers were appropriately blinded for both experimentation and analysis throughout the study. Sample sizes were selected depending upon prior experiments conducted by the lab and power analysis in order to detect an effect size of 0.8 using the program G*power 3.1. Data were reported in compliance with the ARRIVE guidelines.
Results
PKCɛ activation increases hippocampal BDNF expression and TrkB phosphorylation in vivo
PKCɛ-mediated preconditioning has previously been shown to confer neuroprotection after 48 hours.16,20,39–41 Recently, our laboratory reported that BDNF protein expression increases following PKCɛ-activation in vitro
20
and previous reports have indicated that prolonged BDNF expression and TrkB activation robustly increase arc expression.
26
Therefore, we sought to examine the BDNF/TrkB signaling pathway at 6 (an early time point), 24 (an intermediate time point), and 48 (protective time point) h following PKCɛ activation. To test the hypothesis that PKCɛ activation increases BDNF expression and results in TrkB receptor activation in vivo, 25-day-old Sprague Dawley rats were administered ψɛRACK (specific PKCɛ activator) or TAT control peptide (0.2 mg/kg; i.p.) and hippocampal expression of BDNF and pTrkB were measured 6, 24, and 48 h later via Western blot (Figure 1). Six hours following PKCɛ-activation with ψɛRACK, BDNF expression was significantly increased 2.12 ± 0.35-fold compared to the TAT peptide control (n = 4, p < 0.05, Student’s t-test); however, TrkB phosphorylation (pTrkB) was not different from the TAT controls at this time point (n = 4, p < 0.05, Student’s t-test) (Figure 1(a) and (b)). Twenty-four hours following ψɛRACK administration, BDNF expression was increased 5.99 ± 0.11-fold compared to TAT peptide (n = 4, p < 0.005, Student’s t-test), and pTrkB was increased 2.94 ± 0.32-fold compared to TAT peptide (n = 4, p < 0.005, Student’s t-test) (Figure 1(c) and (d)). Forty-eight hours following administration of ψɛRACK or the TAT peptide, there was no observed differences between groups for BDNF protein expression (n = 5, p = 0.85, Student’s t-test) or pTrkB (n = 5, p = 0.26, Student’s t-test) (Figure 1(e) and (f)).
ΨɛRACK administration increases BDNF protein levels and TrkB phosphorylation in the hippocampus in vivo. (a) Twenty-five-day old Sprague Dawley rats were injected i.p. with 0.2 mg/kg ψɛRACK (specific PKCɛ activator) or TAT peptide control. Whole cell, hippocampal homogenates were obtained 6 (a–b), 24 (c–d), or 48 (e–f) h following treatment. BDNF expression normalized to actin and TrkB phosphorylation normalized to TrkB expression were quantified via Western blot. Samples collected from a single time point were run on the same blot. (a) Representative Western blot of BDNF, TrkB, pTrkB and actin 6 h post ψɛRACK or TAT peptide injection. (b) Quantification of (a). BDNF levels were increased compared to a TAT peptide at 6 h following BDNF expression (n = 4, p < 0.05, Student’s t-test). (c) Representative Western blot of BDNF, TrkB, pTrkB and actin 24 h post ψɛRACK or TAT peptide injection. (d) Quantification of (c). At 24 h following ψɛRACK injection, BDNF and pTrkB levels were increased compared to TAT (n = 4, p < 0.005, p < 0.005, respectively, Student’s t-test). (e) Representative Western blot of BDNF, TrkB, pTrkB and actin 48 hours post ψɛRACK or TAT peptide injection. (f) Quantification of (e). There were no observed differences in BDNF expression or TrkB phosphorylation at 48 h.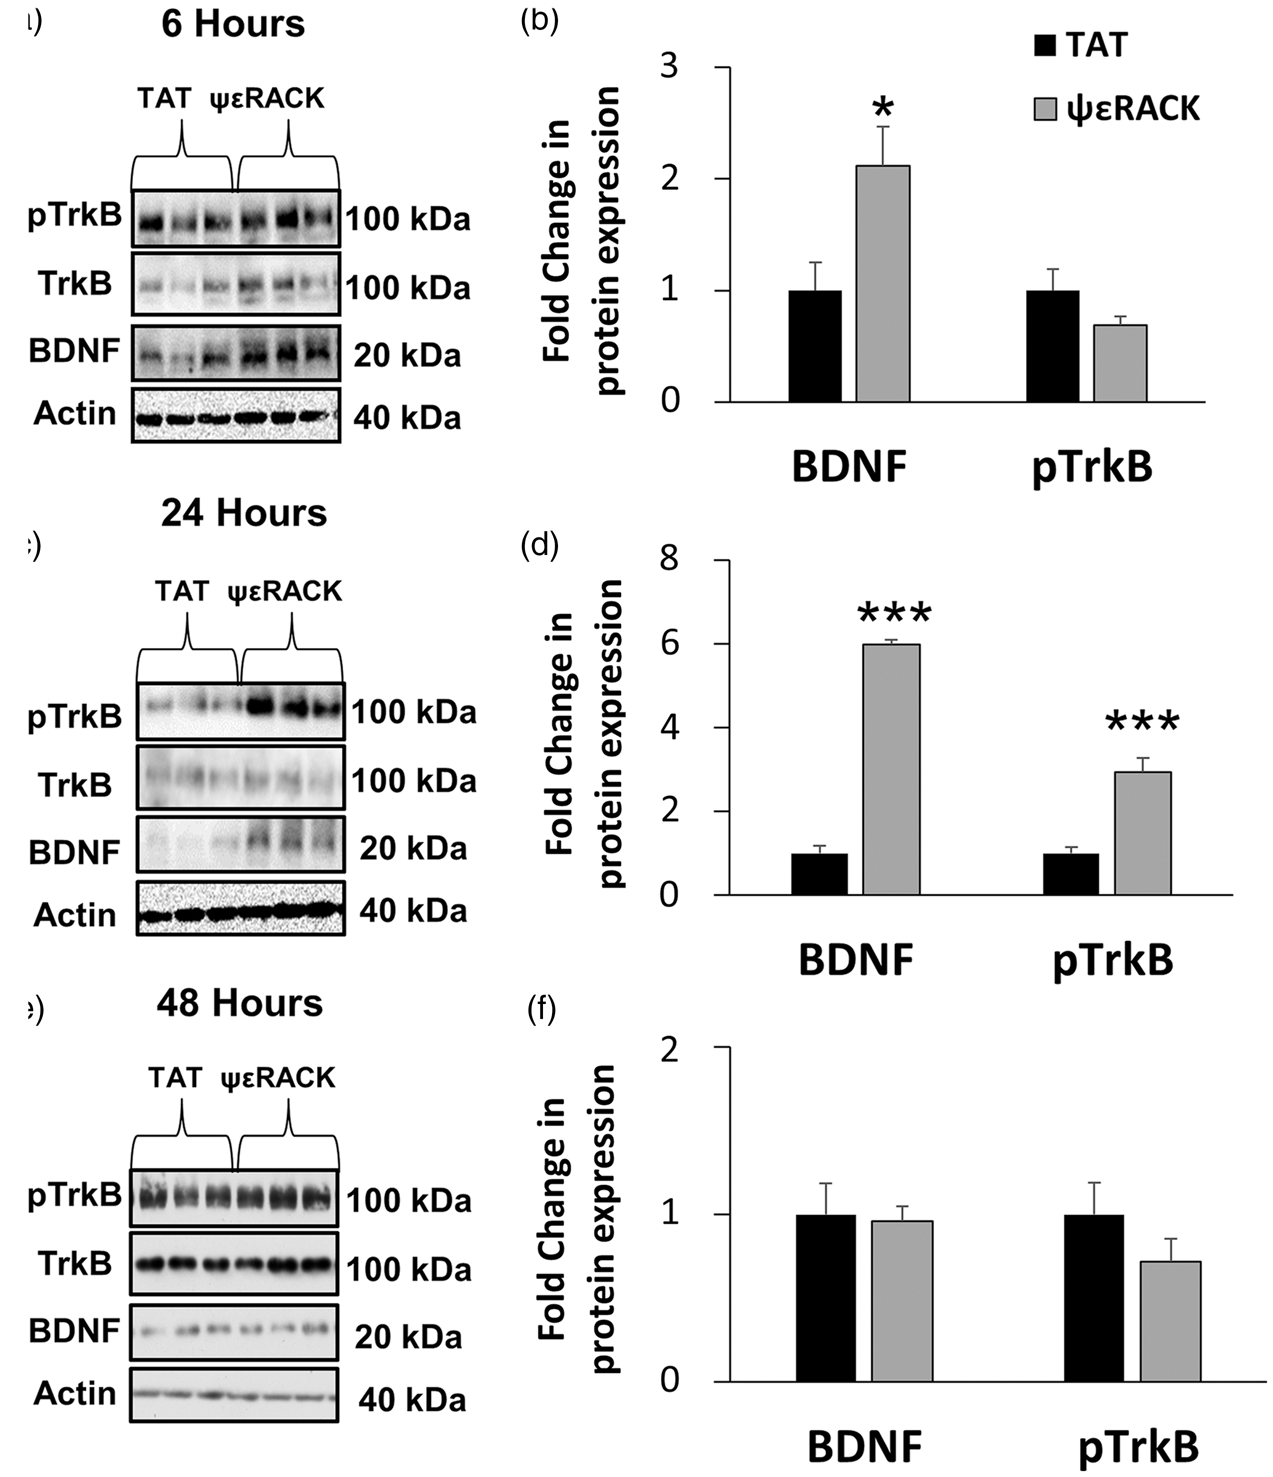
PKCɛ increases CA1 hippocampal arc expression in vivo
It is well established that BDNF expression increases the expression of arc.22–26 As we determined that PKCɛ activation enhances BDNF expression and downstream signaling, we hypothesized that PKCɛ activation increases hippocampal arc expression in vivo. To test this hypothesis, 0.2 mg/kg of ψɛRACK (specific PKCɛ activator) or a TAT control peptide was injected in 25-day-old Sprague Dawley rats. Forty eight hours later, tissue was collected to evaluate hippocampal arc protein expression (Figure 2(a) and (b)), mRNA expression (Figure 2(c)), and CA1 protein localization (Figure 2(d) to (i)). ΨɛRACK administration increased arc expression 1.91 ± 0.22-fold compared to TAT peptide treated control (n = 9, p < 0.005, Student’s t-test) (Figure 2(a) and (b)) and increased arc mRNA expression to 143.97 ± 7.68 % of TAT (n = 10, p < 0.05, Student’s t-test) (Figure 2(c)). CA1 pyramidal cells were probed for the neuronal marker NeuN (Figure 2(d) and (e)) and arc (Figure 2(f) and (g)). Qualitative immunofluorescence shows that PKCɛ activation with ψɛRACK increases the localization of arc expression into cell bodies of CA1 pyramidal neurons (Figure 2(h) and (i)).
ΨɛRACK administration increases arc protein expression in CA1 neurons in vivo. (a) Twenty-five-day-old Sprague Dawley rats were injected i.p. with 0.2 mg/kg ψɛRACK (specific PKCɛ activator) or TAT peptide control. Whole cell hippocampal homogenates were obtained 48 h following administration and activity-regulated cytoskeleton-associated protein (arc) levels were quantified via Western blot. (a) Representative Western blot showing enhanced arc expression with ψɛRACK treatment. (b) Quantification of western blot described in (a). Arc protein levels were elevated compared to a TAT peptide treated control (n = 9, p < 0.005, Student’s t-test). (c) 48 h following ψɛRACK injection, arc mRNA expression levels increase to 143.97 ± 19.32 % of TAT control mRNA expression levels (n = 10 TAT and n = 9 ψɛRACK, p < 0.05, Student’s t-test). (d–i) Immunofluorescence images obtained 48 h following administration of 0.2 mg/kg ψɛRACK. Sections were stained for NeuN (red) and arc (green) protein (n = 4). A visual increase in somatic arc protein was observed in CA1 pyramidal neurons. (j) GluR2 mRNA expression was decreased to 79.23 ± 5.00 % of TAT control (n = 10, p < 0.05, Student’s t-test) 48 h following ψɛRACK injection and GluR1 mRNA expression was trending down to 83.67 ± 7.31 % of TAT control (n = 10, p = 0.07, Student’s t-test). (k–n) Arc mRNA expression is increased and GluR receptor subunit mRNA expression is decreased 48 h following in vivo injection of the PKCɛ-activator ψɛRACK. Linear regression analyses were run to determine the relationship between arc mRNA expression and specific GluR subunit expression. There was a relationship between arc mRNA expression and GluR1 mRNA expression (N = 19, r = −0.52, p < 0.05, linear regression), and arc mRNA expression and GluR2 mRNA expression (N = 19, r = −0.53, p < 0.05, linear regression). There was no relationship observed between arc and GLuR3 mRNA expression (N = 19, r = −0.33, p = 0.116, linear regression) or arc and GluR4 arc mRNA expression (N = 19, r = 0.016, p = 0.95 linear regression).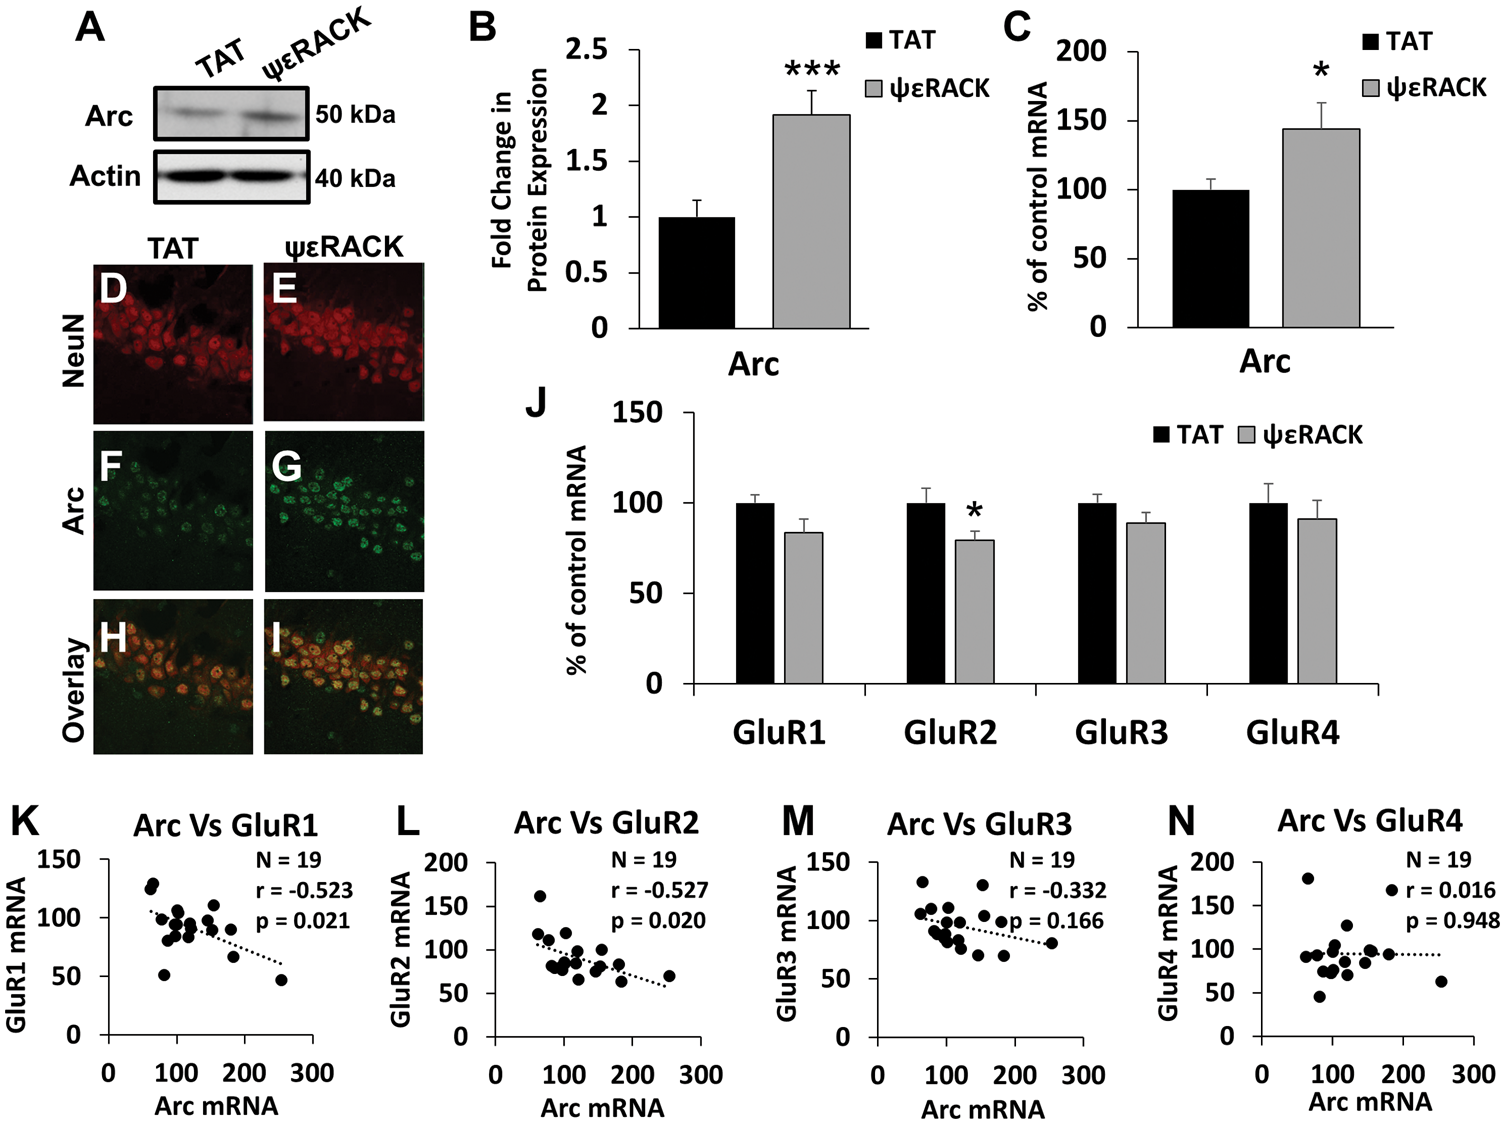
PKCɛ activation decreases GluR receptor mRNA expression in vivo
Arc protein expression has previously been linked to GluR mRNA expression. 42 We examined mRNA expression of four glutamate receptor subunits (GluR1, GluR2, GluR3, and GluR4) 48 h following ψɛRACK or TAT injection in vivo (Figure 2(j)). mRNA expression of GluR1 after ψɛRACK injection was 83.67 ± 7.31 % of TAT control but this difference was not statistically significant (n = 10, p = 0.07, Student’s t-test). ΨɛRACK injection decreased GluR2 mRNA expression to 79.30 ± 5.00% of TAT control (n = 10, p < 0.05, Student’s t-test). GluR3 and GluR4 mRNA expression were not significantly different between the ψɛRACK treatment and TAT peptide control groups (p = 0.17 and p = 0.95 respectively, Student’s t-test). Linear regressions between arc mRNA expression and mRNA expression of each GluR subunit for all animals in both groups (N = 19) were performed to better elucidate the relationship between the two factors. GluR1 expression is inversely related to arc expression (Figure 2(k)) (N = 19, r = −0.52, p < 0.05, linear regression). Additionally, GluR2 is inversely correlated with arc mRNA expression (Figure 2(l)) (N = 19, r = −0.53, p < 0.05, linear regression). There were no observed relationships between arc mRNA expression and either GluR3 mRNA (Figure 2(m)) (N = 19 r = −0.33, p = 0.17, linear regression) or GluR4 mRNA expression (Figure 2(n)) (N = 19, r = 0.017, p = 0.95, linear regression).
PKCɛ-mediated arc expression decreases AMPAR miniature excitatory postsynaptic current maximum amplitudes in vitro
A well characterized function of arc is to alter the number of cell surface AMPARs through increasing endocytosis
27
and regulating AMPAR transcription
42
leading to a decrease in AMPAR-mediated mEPSC amplitude. As our previous results show that PKCɛ activation enhances arc expression and decreases AMPAR subunit transcription, we wanted to examine the effect of PKCɛ activation on AMPAR currents. To determine the contribution of arc, arc protein expression was inhibited in organotypic slices with arc AS ODNs, a well characterized technique to inhibit arc expression;
31
scrambled control oligodeoxynucleotides (SC ODNs) served as experimental controls. Arc AS ODNs decreased arc protein expression in organotypic hippocampal cultured slices to 56.84 ± 24.08% of SC ODN (Figure 3(a) and (b)) (n = 3, p < 0.05, paired t-test) which is a similar decrease in protein expression to what others have reported when utilizing these ODNs.31,33,43 Then, we tested the hypothesis that PKCɛ activation reduces AMPAR-mediated currents through an arc-dependent pathway. Forty-eight hours following a 1 h ψɛRACK or TAT (200 nM) treatment, AMPAR mEPSCs were recorded in organotypic hippocampal cultured slices (Figure 3(c) and (d)). The culture media of a subset of slices was maintained with SC or arc AS ODNs beginning 24 h prior to the ψɛRACK treatment to determine the contribution of arc expression in modulation of AMPAR mEPSCs after PKCɛ activation (Figure 3(c) and (d)). Treatment of organotypic slices with ψɛRACK decreased the average maximum AMPAR-mediated mEPSCs amplitude to 12.75 ± 0.35 pA as compared to 14.80 ± 0.39 pA in TAT control-treated slices (n = 20, p < 0.05, one way ANOVA, Bonferroni post-hoc) (Figure 3(e)). The ψɛRACK + SC ODN treatment similarly decreased average AMPAR-mediated mEPSC maximum amplitude to 12.47 ± 0.49 pA, as compared to the TAT control (n = 20, p < 0.01, one way ANOVA, Bonferroni-post hoc) (Figure 3(e)). However, this change in mEPSC amplitude was lost with the ψɛRACK + arc AS ODN treatment as there was no observed change in mEPSC amplitude when compared to the TAT peptide (n = 20, p = 0.63, one way ANOVA, Bonferroni-post hoc) (Figure 3(e)). These data show that PKCɛ activation reduces AMPAR-mediated currents, an effect that is dependent on arc expression. There were no statistically significant changes in event frequency overall or between any of the groups (n = 20, p = 0.29, one way ANOVA, Bonferroni post hoc) (Figure 3(f)).
Inhibition of arc blocks PKCɛ-dependent AMPAR mEPSC amplitude changes. (a) Western blot of arc expression in organotypic hippocampal cultured slices treated with arc antisense oligodeoxynucleotide (arc AS ODN, 1 nM) or a scrambled control oligodeoxynucleotide (SC ODN, 1 nM) for 24 h. (b) Quantification of A; arc protein expression is decreased following 24 h of arc AS ODN treatment compared to scrambled control (n = 3, p < 0.05, paired t-test). Inhibition of arc blocks PKCɛ-dependent AMPAR mEPSC amplitude changes. (c) Organotypic hippocampal cultured slices were treated with arc AS ODN or SC ODN for 24 h prior to a 1 h treatment with TAT (200 nM) or ψɛRACK (200 nM). In groups treated with arc AS ODN or SC ODN, ODNs were maintained in culture for the following 48 h. AMPAR-mediated mEPSCs were measured in the presence tetrodotoxin (TTX, 1 µM) bicuculline (10 µM), and APV (20 µM). Typical mEPSC tracings observed. (d) Average tracing of all mEPSCs recorded for each group. (e) Maximum mEPSC amplitude of TAT, ψɛRACK, ψɛRACK + arc AS ODN, and ψɛRACK + SC ODN-treated groups. Following administration of ψɛRACK, the maximum amplitude was decreased as compared to a TAT control group (n = 20 slices, p < 0.05, one-way ANOVA, Bonferroni post hoc). ΨɛRACK + SC ODN also decreased the maximum mEPSC amplitude as compared to a TAT control group (n = 20 slices, p < 0.01, one-way ANOVA, one-way Bonferroni post hoc). The ψɛRACK + arc AS ODN showed no decrease in maximum amplitude observed as compared to the TAT group (n = 20 slices, p > 0.05, ANOVA, Bonferroni). (f) There were no significant changes in event frequency between any of the groups (n = 20, p > 0.05, one-way ANOVA, Bonferroni post hoc). (g–h) Cumulative fraction plots examining the changes of the distribution for all of the events for the TAT (n = 1905), ψɛRACK (n = 1853), ψɛRACK + SC ODN (n = 1964), and ψɛRACK + arc AS ODN (n = 1977) groups. The distribution of amplitude of total mEPSCs was shifted towards smaller maximum amplitudes in slices treated with ψɛRACK compared to a TAT control (p < 0.005, Kolmogorov–Smirnov Test). The presence of the arc AS ODN increased the maximum amplitude as compared to ψɛRACK + SC ODN (p < 0.05, Kolmogorov–Smirnov Test). (i) PKCɛ-mediated changes in mEPSC amplitude and latency until AD are blocked by inhibiting GluR2 internalization. Application of TAT-GluR23Y peptide within the internal solution blocked the PKCɛ-mediated reduction in mEPSC amplitude (n = 12, p < 0.05, Student’s t-test). (j) mEPSC frequency was unchanged between the two groups, indicating that TAT-GluR23Y peptide application had no effect on mEPSC frequency. (k) ΨɛRACK + TAT-GluR23Y group also had shifted distribution towards larger responses compared to the ψɛRACK + TAT-GluR23A group (n = 762 and 761 respectively, p < 0.005, Kolmogorov–Smirnov Test).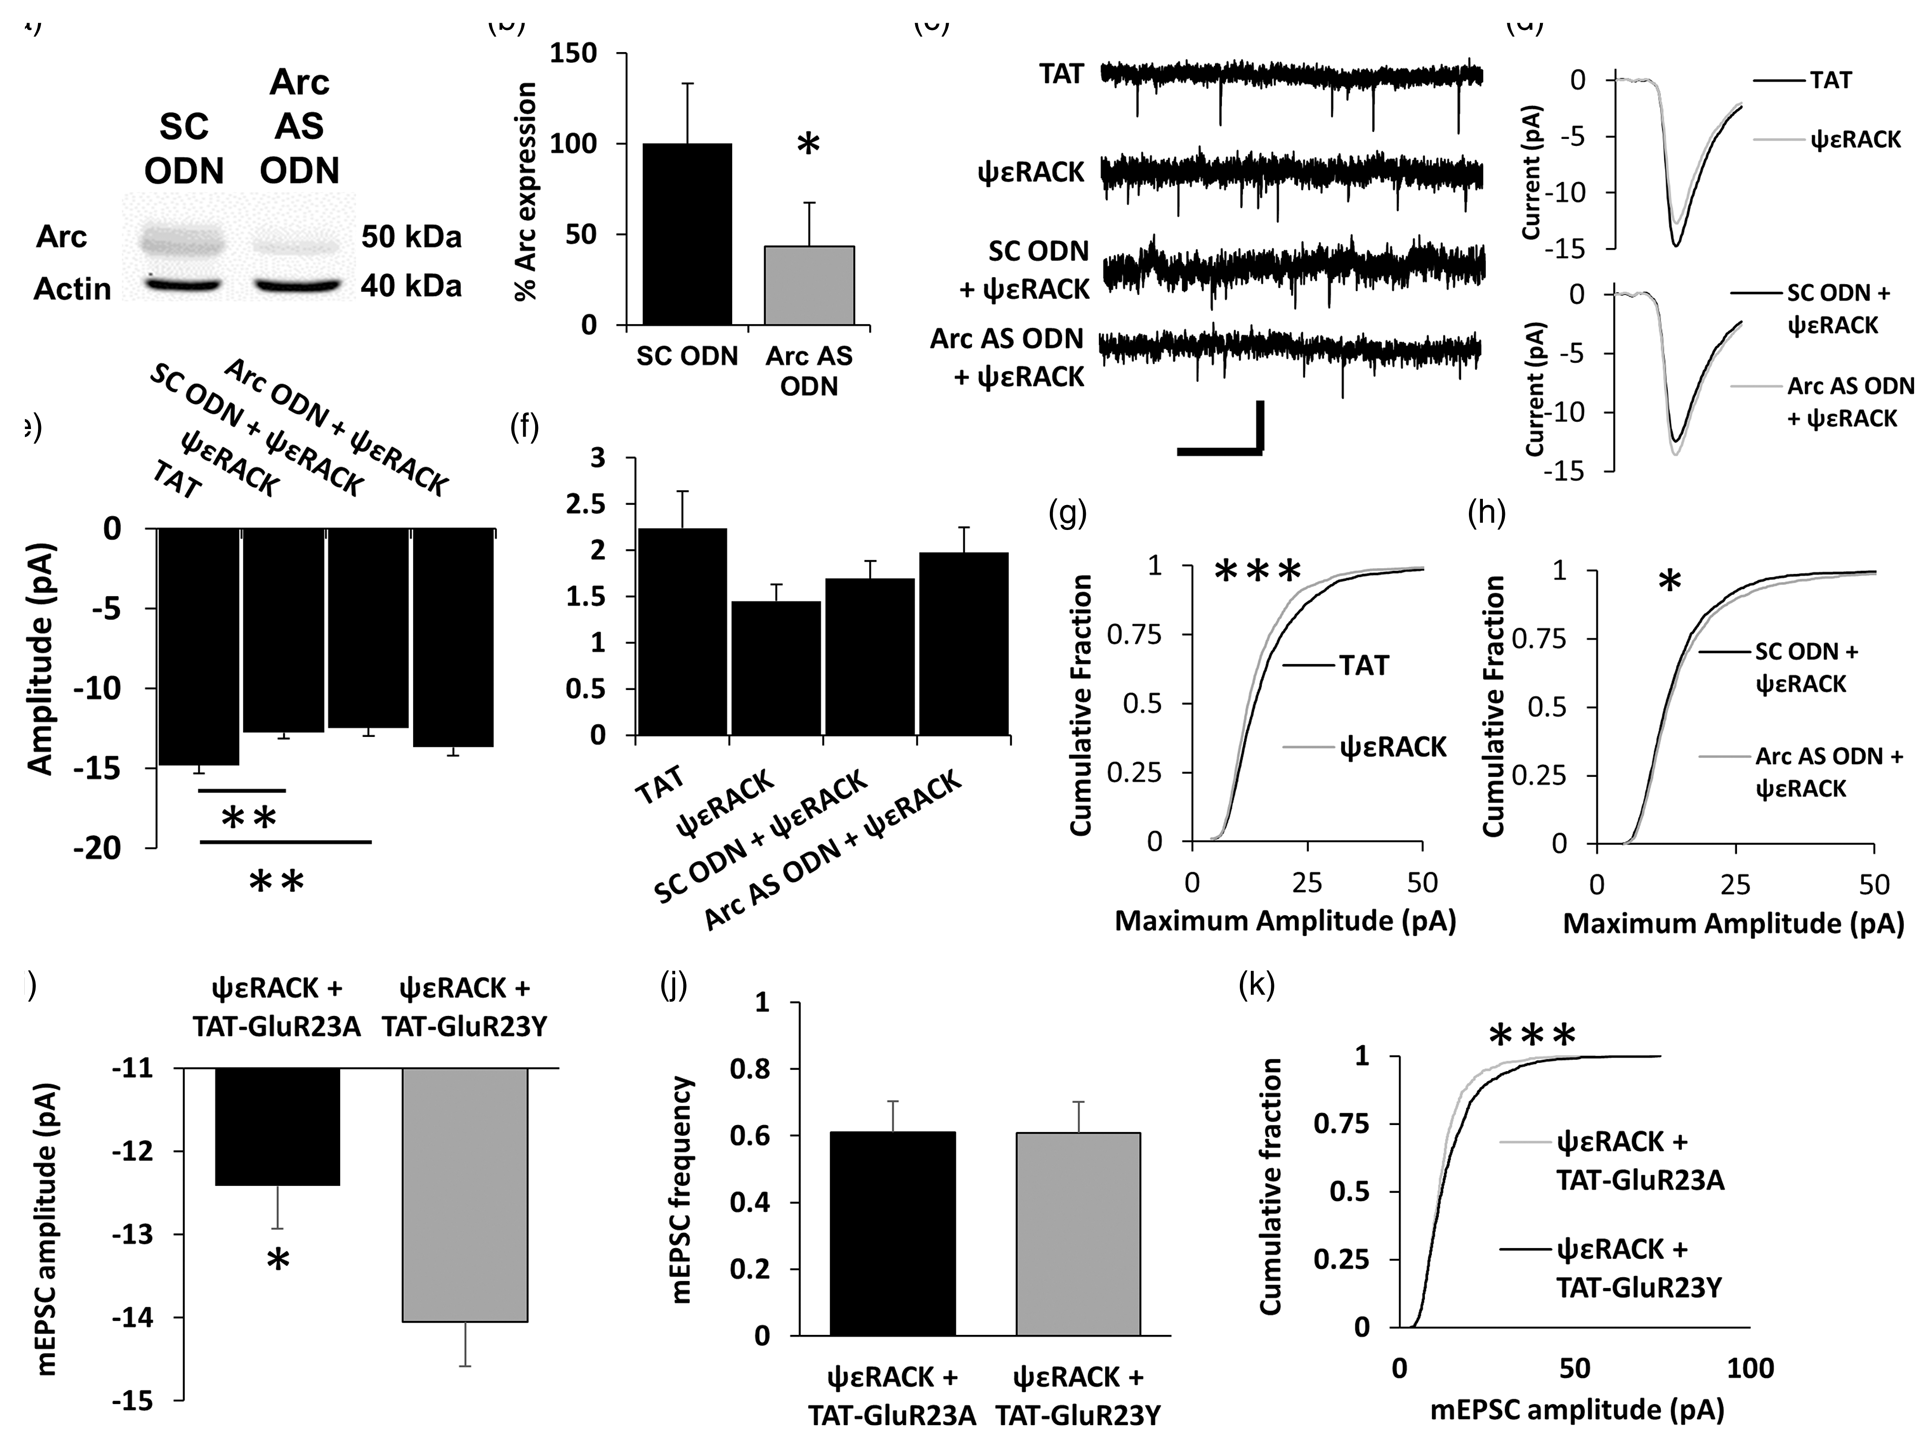
In addition to decreasing the average maximum mEPSC amplitude, the distribution of the maximum amplitudes for AMPAR-mediated mEPSCs was shifted towards smaller amplitude responses for the ψɛRACK-treated group compared to TAT peptide controls (n = 1853 and n = 1905 respectively, p < 0.005, Kolmogorov–Smirnov test) (Figure 3(g)). This effect is also dependent upon arc expression as ψɛRACK + arc AS ODN treatment shifted the distribution of the maximum amplitude for total events measured towards larger responses when compared to the ψɛRACK + SC ODN controls (n = 1977 and n = 1964 respectively, p < 0.05, Kolmogorov–Smirnov test) (Figure 3(h)).
PKCɛ-mediated reduction in AMPAR mEPSCs is blocked by inhibiting GluR2 internalization
Arc is known to induce internalization of surface AMPARs.27,42 To directly test if this role of arc was important in the PKCɛ-mediated reduction of AMPAR mEPSC amplitude, we utilized a peptide, GluR23Y, which prevents GluR2 internalization. GluR23Y has previously been shown to impair arc-dependent AMPAR internalization. 44 This peptide mimics and blocks the phosphorylation of Y869, Y873, Y879, which are necessary for subunit internalization. 34 AMPAR mEPSCs were recorded in organotypic slices 48 h after treatment ψɛRACK and either GluR23Y (GluR2 internalization inhibitor) or GluR23A (control) peptide was added to the internal solution. While ψɛRACK application decreased AMPAR mEPSC amplitudes (Figure 3(c) to (e)), this decrease was impaired when GluR internalization was blocked: ψɛRACK + GluR23Y maximum AMPAR mEPSCs was −14.05 ± 0.54 pA as compared to −12.42 ± 0.51 pA observed in a ψɛRACK + control GluR23A peptide (n = 12, p < 0.05, Student’s t-test) (Figure 3(i)). The average maximum AMPAR mEPSC amplitude in the ψɛRACK + control GluR23A treatment was similar to ψɛRACK treatment alone, suggesting control peptide had no effect. mEPSC frequency was unchanged by ψɛRACK + GluR23Y peptide compared to the control ψɛRACK + GluR23A group (Figure 3(j)). Additionally, the distribution of mEPSC maximum amplitude responses was shifted towards larger responses in the ψɛRACK + GluR23Y peptide compared to the ψɛRACK + GluR23A control group (n = 761, 762 respectively, p < 0.005, Kolmgorov–Smirnov test) (Figure 3(k)).
PKCɛ-mediated arc expression delays the latency until anoxic depolarization in organotypic hippocampal cultured slices through a GluR2-dependent process
Long lasting AD is a catastrophic process often resulting in cell death.
45
A previous study showed that direct pharmacological inhibition of AMPARs can increase the latency until AD in acute hippocampal slices.
38
Decreasing postsynaptic AMPARs through increased arc expression may lead to a similar delay in AD. To test the hypothesis that PKCɛ activation would cause an arc-dependent increase in latency until AD, we recorded membrane potential in CA1 neurons treated with TAT, ψɛRACK, ψɛRACK + SC ODN, or ψɛRACK + arc AS ODN (as described above) during an irreversible OGD (Figure 4(a) and (b)). Forty-eight hours following TAT or ψɛRACK treatment, latency until AD was increased from 29.27 ± 3.6 min in TAT-treated slices to 50.77 ± 5.08 min after ψɛRACK treatment (p < 0.05) and 52.73 ± 6.78 min after ψɛRACK + SC ODN treatment (p < 0.05) (n = 13–15, Bonferroni post hoc) (Figure 4(c)). Enhanced latency after ψɛRACK treatment was reduced when arc expression was inhibited; latency until AD was 39.5 ± 5.63 min for the ψɛRACK + arc AS ODN group, not significantly different from the TAT control (n = 14, p = 1.000, one way ANOVA, Bonferroni post-hoc). These are novel data that PKCɛ activation enhances latency till AD through an arc-dependent mechanism. Additionally, we hypothesized that blocking GluR2 internalization with application of the GluR23Y peptide would reverse the ψɛRACK-dependent increase in latency until AD. Blocking GluR2 internalization by application of the GluR23Y peptide following ψɛRACK treatment reduced latency until AD to 22.3 ± 5.17 min compared to 54.5 ± 8.40 min in the ψɛRACK + GluR23A control group (n = 6, p < 0.005, Student’s t-test) (Figure 4(d)).
Inhibition of arc and GluR2-internalization impairs PKCɛ-dependent increases in latency until AD and TrkB/arc signaling is necessary for PKCɛ-mediated neuroprotection. (a) Example images of TAT treated organotypic slices that have undergone 0 and 40 min of anoxic depolarization (AD). Two cells that have undergone significant swelling during the AD are circled. (b) Example membrane potential changes over time for organotypic hippocampal cultured slices during OGD that were treated with TAT or ψɛRACK for 1 h 48 h prior to OGD. The sharp rise in membrane potential illustrates the initiation of AD. (c) Latency until AD was increased in the ψɛRACK and ψɛRACK + SC ODN groups compared to TAT (n = 13–15, p < 0.05, p < 0.05 respectively, one-way ANOVA, Bonferroni post hoc). Latency until AD for the ψɛRACK + arc AS ODN group was not significantly different from the TAT control (n = 14, p = 1.000, one-way ANOVA, Bonferroni post hoc). (d) TAT-GluR23Y application additionally blocked a PKCɛ-dependent increase in latency until AD (n = 6, p < 0.005, Student’s t-test). (e) The TrkB pathway was inhibited in organotypic hippocampal cultured slices using the specific inhibitor ANA-12 (10 µM) 24 h prior to, during 1 h administration of ψɛRACK (200 nM), and for 48 h prior to a lethal OGD. Inhibition of TrkB impaired ψɛRACK neuroprotection compared to its ψɛRACK + DMSO control (n = 7–8, p < 0.005, one-way ANOVA, Bonferroni post-hoc). (f) Organotypic hippocampal cultured slices were treated with TAT peptide (200 nM), ψɛRACK (200 nM), arc AS ODN + ψɛRACK, or SC ODN + ψɛRACK. Cell death in the CA1 region was observed 24 h following the lethal OGD using a 2 µg/ml propidium iodide (PI). ΨɛRACK administration protected slices from a lethal OGD, reducing PI fluorescence as compared to TAT control (n = 6 p < 0.005, one way ANOVA, Bonferroni post hoc). Inhibition of arc with an arc AS ODN impaired ψɛRACK-dependent neuroprotection against a lethal OGD compared to SC ODN + ψɛRACK treated group (n = 6, p < 0.005, one way ANOVA, Bonferroni post hoc).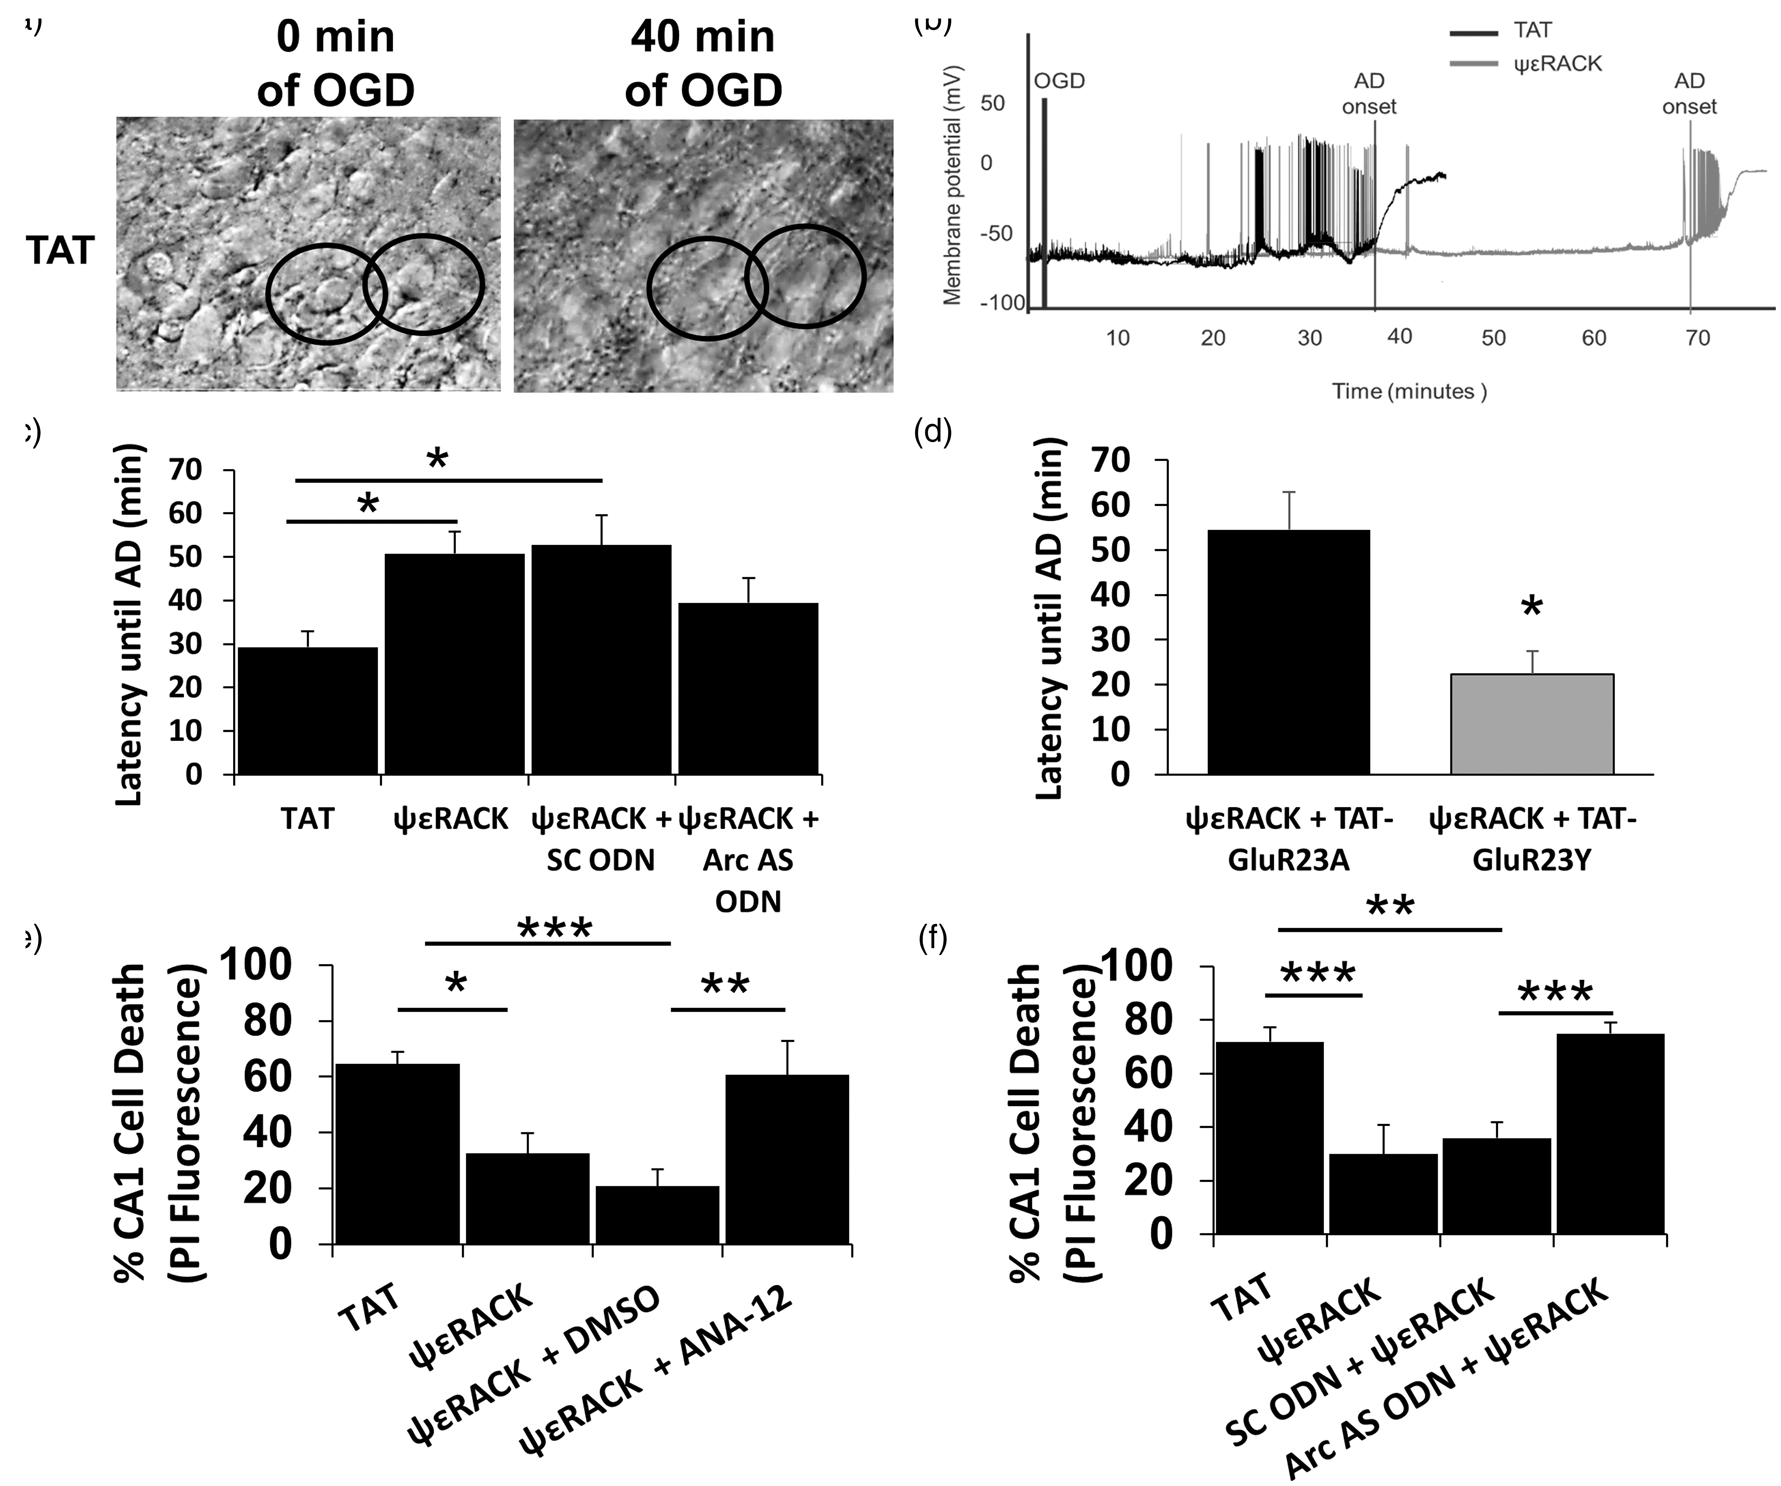
PKCɛ-dependent arc expression is necessary for neuroprotection against oxygen and glucose deprivation in vitro
Our previous experiments suggest a novel mechanism of PKCɛ-mediated neuroprotection where application of ψɛRACK enhanced BDNF signaling resulting in increased arc expression, reduced AMPAR mEPSCs, and enhanced latency until AD. Therefore, we tested the role of BDNF/TrkB signaling in conferring neuroprotection in organotypic slices. We hypothesized that PKCɛ-dependent activation of TrkB was necessary for conferring neuroprotection against a lethal OGD. Organotypic hippocampal cultured slices were subject to 1 h treatment of ψɛRACK or TAT control and subject to a lethal OGD 48 h later. Media in a subset of slices was supplemented with a TrkB specific inhibitor, ANA-12 (10 µM), or DMSO control (0.01%) beginning 24 h prior to the 1 h administration of ψɛRACK or TAT control peptide (Figure 4(e)). Inhibiting TrkB with ANA-12 impaired the protective effect of ψɛRACK increasing CA1 cell death from 20.80 ± 6.20% with ψɛRACK + DMSO control treatment to 60.67 ± 12.11% ψɛRACK + ANA-12 (n = 7, p < 0.005, one way ANOVA, Bonferroni post hoc) (Figure 4(e)).
We examined the necessity of enhanced arc expression to confer neuroprotection after PKCɛ activation. We treated organotypic slices with TAT, ψɛRACK, ψɛRACK + SC ODN, or ψɛRACK + arc AS ODN. ΨɛRACK protected slices from lethal OGD 48 h later, reducing cell death from 71.89 ± 5.33% in the TAT control to 29.91 ± 10.92% in the ψɛRACK-treated slices (n = 6, p < 0.005, one way ANOVA, Bonferroni post hoc) (Figure 4(f)). The ψɛRACK + SC ODN treatment also protected against a lethal OGD as only 35.91 ± 5.97% CA1 cell death was observed. In comparison, the ψɛRACK + arc AS ODN abolished the protective effect of ψɛRACK treatment with 74.93 ± 4.24% CA1 cell death (n = 6, p < 0.005, one way ANOVA, Bonferroni post-hoc) (Figure 4(f)). The enhanced cell death in the arc AS ODN-treated group was not due to toxic effects of the peptide. None of the treatments (TAT, ψɛRACK, ψɛRACK + SC ODN, and ψɛRACK + arc AS ODN) had any acute effect on cell death resulting in changes of −1.16 ± 2.73, 4.33 ± 1.54, 3.66 ± 2.09, and −1.20 ± 2.53% of maximal CA1 PI fluorescence respectively (n = 6, p > 0.05, one way ANOVA, Bonferroni post hoc).
Discussion
Here, we describe a novel mechanism whereby a novel isozyme of protein kinase C (i.e. PKCɛ) is involved in modulation of the BDNF/TrkB signaling cascade (Figure 1), which leads to enhanced arc expression (Figure 2). Arc expression, in turn, is necessary to alter AMPAR subunit expression (Figure 2) and promote AMPAR internalization (Figure 3). AMPAR internalization then delays latency until AD during OGD conferring neuroprotection (Figure 4). This arc-dependent shift in AMPAR-mediated currents provides a novel mechanism by which PKCɛ-activation mediates neuroprotection against excitotoxic injury through delaying latency until AD (Figure 5), but also implicates PKCɛ in synaptic regulation of the master regulator arc, which may have other physiological responses during normal synaptic function.
Mechanism of excitatory synaptic changes involved in PKCɛ-mediated preconditioning. Isoform specific activation of PKCɛ with ψɛRACK enhances BDNF expression. BDNF activation of TrkB receptors enhances the transcription and expression of arc through a MEK/ERK dependent pathway.22–26 Arc, in conjunction with accessory proteins, promotes AMPAR endocytosis
27
and decreases the mRNA expression of AMPAR subunits. Together, these changes result in the reduction of surface AMPAR abundance and consequentially AMPAR-mediated mEPSC amplitude 48 h later. A reduction in post-synaptic AMPARs increases the latency until anoxic depolarization providing tolerance to ischemic injury.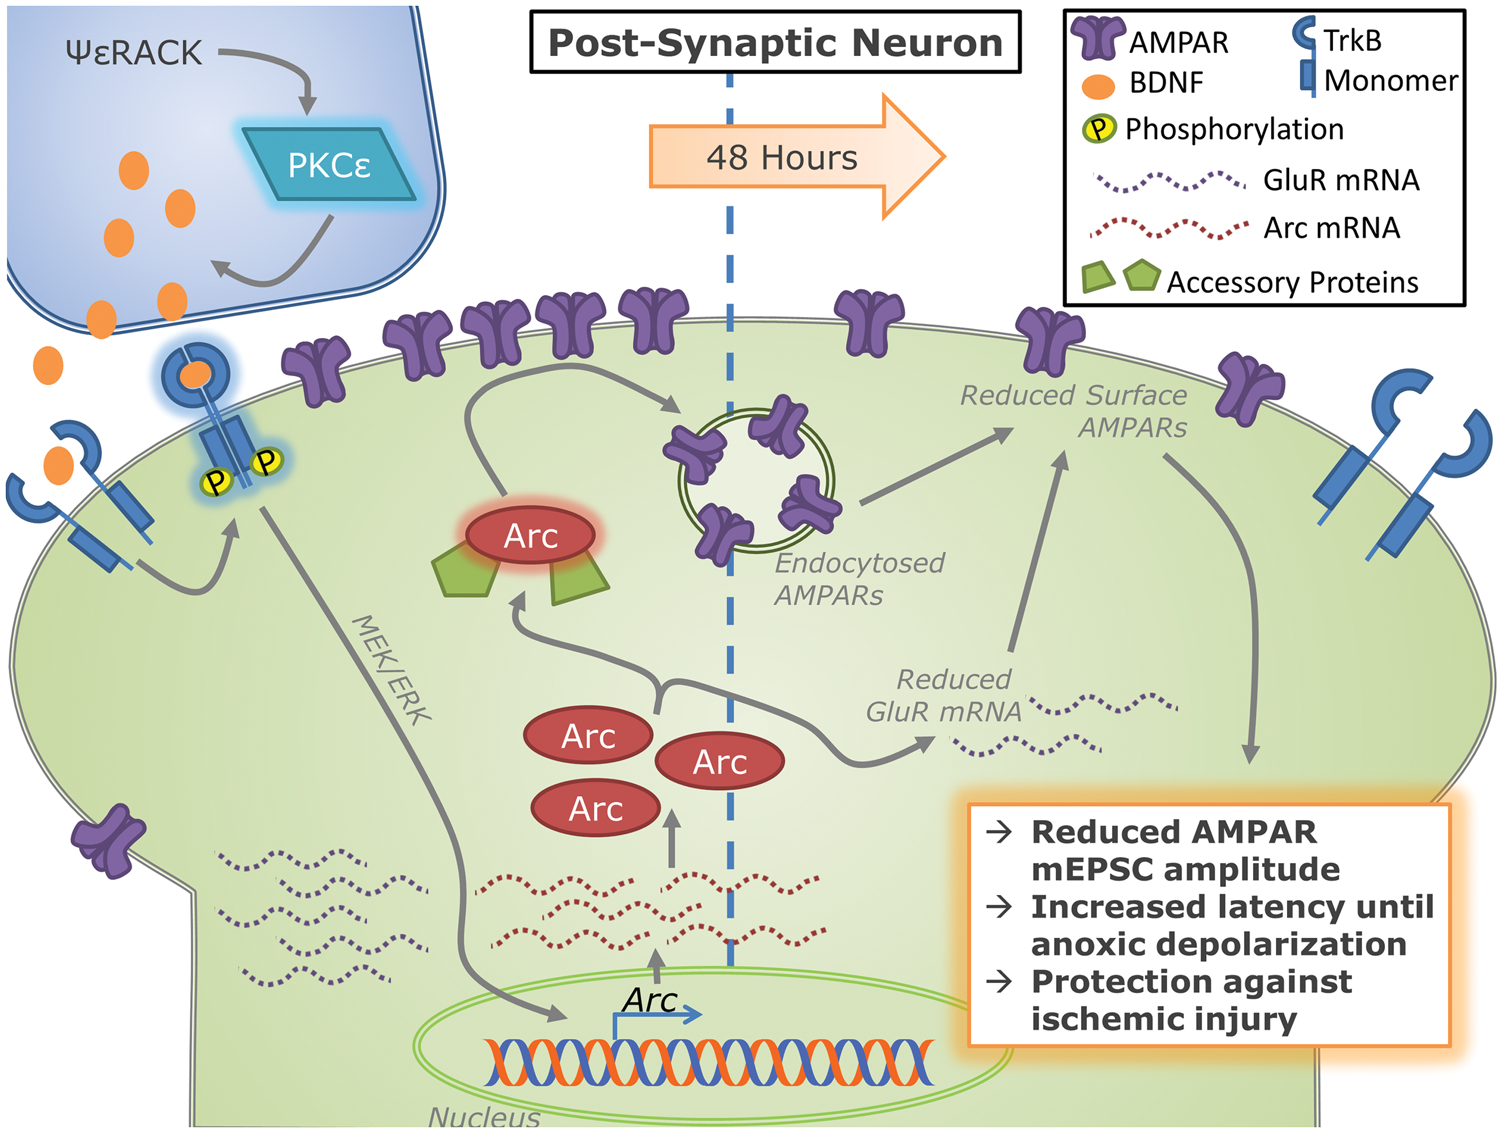
The function of decreasing synaptic AMPAR current is only part of a complex adaptive response triggered by PKCɛ activation. The signaling cascades activated by PKCɛ are multifaceted and may confer neuroprotection by modifications in mitochondria and at the synapse.16,20,39–41 Thus, our result that inhibition of arc expression completely abolished the neuroprotective effect of PKCɛ activation was initially unexpected. Glutamatergic synaptic activity can consume 13% to 34% of the ATP stores within a cell. 46 Importantly, AD results from the failure of tissue ATP generation to match utilization. 47 Decreasing AMPAR glutamatergic signaling may allow for a cell to maintain ATP levels for longer periods, thereby delaying latency until AD and providing neuroprotection. Activation of PKCɛ has previously been implicated in modulating GABAergic activity at the synapse which also may further contribute to decreasing the rate of ATP depletion through dampening of excitatory signaling. Two days following an hour ψɛRACK treatment, there was an increase in GABA miniature inhibitory postsynaptic currents (mIPSC) and that enhanced GABAergic activity was necessary for neuroprotection. 16 Additionally, the ability of PKCɛ activation to increase mitochondrial efficiency may play an important role in determining latency until AD, as energy production through glycolysis and oxidative phosphorylation can extend latency until AD. 48 Together, PKCɛ-mediated changes to synaptic signaling and metabolic efficiency play an important role in maintaining ATP levels, which collectively play an important role in delaying the onset of AD.
PKCs can also modulate excitatory neurotransmission through the direct phosphorylation of AMPARs. The role of PKCs in regulating synaptic currents and receptor trafficking is more ambiguous due to the complex interplay between phosphorylation sites on the AMPARs as well as the surrounding synaptic machinery (for review, see Henley et al. 49 ). Phosphorylation of serine 816 and serine 818 on the GluR1 subunit following pan-PKC activation by phorbol-esters can lead to immediate insertion of AMPARs into a synapse and play a critical role in the generation of long-term potentiation (LTP).50,51 Both PKCα and PKCγ have been implicated as kinases involved in the phosphorylation of these sites. 51 In contrast to GluR1, phosphorylation of the GluR2 tyrosine sites Y869, Y873, Y879 can lead to endocytosis of AMPARs present on the cell surface, 34 indicating a role for an active endocytotic process. Previous publications have linked this active endocytosis process to arc expression. 44 However, no previous studies show that this process is linked to conventional or novel PKCs, or that it is necessary for modifying latency until AD.
Our novel finding that a decrease in AMPAR current is neuroprotective is consistent with previous publications that have indicated that AMPAR antagonism is neuroprotective against ischemic injury52,53 and can increase latency until AD in the CA1 region. 38 Those studies used pharmacological treatments to inhibit AMPARs. Despite the potential for neuroprotection with AMPAR antagonism, clinical trials have failed due to a multitude of off target effects. 54 Results from our experiment utilizing the GluR23Y peptide demonstrate for the first time that directly modulating AMPAR internalization can promote neuroprotection against ischemic injury and may have less adverse side-effects.
While activation of PKCɛ causes a 15% reduction in single cell AMPA mEPSC amplitude, it results in a 42% increase in latency until AD. Others have shown that small changes in AMPAR mEPSC amplitudes recorded in single cells underlie large changes in behavior and electrophysiological responses.55,56 Ghosh et al. 55 found a 20% increase in AMPAR mEPSC amplitude was triggered by olfactory training tasks in the piriform cortex. 55 Also, Goforth et al. 56 found a mechanical injury caused a 17–25% change in AMPAR mEPSC amplitude – similar to the change found in the current study. This small percent change in AMPAR mEPSC amplitude and led to a drastic 20–42% reduction in frequency and amplitude of oscillations in small neuronal networks. 56 Through the use of the GluR23Y peptide experiments, we were able to confirm the importance of the observed change in AMPAR content. By inhibiting PKCɛ-mediated internalization of GluR2 receptors, we prevented the reduction in mEPSC amplitude (Figure 3(i)) and determined that this change specifically was necessary for the PKCɛ-mediated increase latency until AD (Figure 4(d)). We found that there was no increase in latency until AD if the mEPSC amplitude change was blocked with the GluR23Y peptide. To the best of our knowledge, modifying latency until AD time by reducing AMPAR receptor content has not previously been explored and is a novel aspect of this study. Most previous research on this topic has investigated the roll of receptor subtype changes, not focusing on overall post synaptic site receptor content, as changes in calcium permeability can also affect cell death following ischemic injury (see Liu et al. 57 ). Along these lines, we observed a trending decrease in GluR1 mRNA expression and significant reduction in GluR2 mRNA expression. This is similar to a previous article indicating that nuclear arc expression decreased GluR1 expression. 42 With correlation analyses, we found a small, but significant inverse relationship between arc mRNA expression and mRNA expression of both GluR1 and GluR2. Future studies are needed to evaluate the importance of specific GluR subunit expression in PKCɛ-mediated preconditioning.
In addition to the BDNF/TrkB/MEK/ERK signaling cascade, PKCɛ-mediated increases in arc may be triggered by the phosphorylation of a related protein implicated in neuroprotection, cAMP-response element-binding protein (CREB). PKCɛ activation in vascular endothelium can promote CREB activation. 58 Additionally, Ying et al. 22 found that the MEK/ERK signaling activated by BDNF administration resulted in the phosphorylation of CREB in a pathway upstream of arc (mechanism reviewed in Bramham et al. 59 ). Taken together, these studies suggest that CREB may be activated by PKCɛ activation and enhance arc expression. Additionally, CREB activation is upregulated at 6 and 24 h after estrogen preconditioning 60 similar to the timing of BDNF upregulation found in the current study. Independent of arc activation, CREB-mediated preconditioning paradigms can regulate anti-apoptotic mechanisms via Bcl-261 and Bcl-xl 62 expression. While we cannot exclude the contribution of CREB activation in these alternative neuroprotective pathways or downstream of TrkB activation, we have found that arc is a necessary downstream mediator of PKCɛ preconditioning.
Arc is a well-characterized protein that is most commonly used as a marker of neuronal activity as its mRNA transcription is tightly coupled to neuronal activity and excitation.31,63 A prior publication determined that following a global ischemic event, arc expression is minimal in a region susceptible to ischemic injury, the CA1, while its expression in a protected region, the dentate gyrus (DG), was preserved. 64 The difference between CA1 and DG could imply that the presence of arc in DG is able to protect it against an ischemic insult. We propose that decreasing AMPAR-mediated current amplitude through arc expression may contribute to this endogenous protection, but further studies would be warranted. To our knowledge, this is the first study reporting that PKCɛ mediates arc expression, that arc expression is necessary for PKCɛ-dependent neuroprotection, and that regulation of GluR2 internalization is important for modulating latency until anoxic depolarization.
Footnotes
Funding
The author(s) disclosed receipt of the following financial support for the research, authorship, and/or publication of this article: This work was supported by the National Institutes of Health grants NS45676, NS054147 and NS34773; and the Miami Evelyn F. McKnight Brain Institute.
Declaration of conflicting interests
The author(s) declared no potential conflicts of interest with respect to the research, authorship, and/or publication of this article.
Authors’ contributions
CHC, CBW, and MAPP designed and planned experiments. CHC, HMSC, KCMB, NK, KBK, and MY conducted experiments and analysis. All the authors reviewed and wrote portions of the manuscript.