
Abstract
This study proposes a method for territorial segmentation and volumetric flow rate (VFR) distribution measurement of cerebral territories based on time-resolved contrast enhanced magnetic-resonance-angiography (MRA). The method uses an iterative region-growing algorithm based on bolus-arrival-time with increased temporal resolution. Eight territories were segmented: (1) right and (2) left internal carotid arteries, including the middle cerebral artery (ICA+MCA), excluding the anterior cerebral arteries (ACA); (3) right and left ACA (R+L-ACA); (4) right and (5) left external carotid arteries (ECA); (6) right and (7) left posterior cerebral arteries (PCA); and (8) vertebrobasilar territory. VFR percentage, relative to the entire brain (rVFR), was measured based on territorial volume as a function of time. Mean rVFR values of fifteen healthy subjects were: ICA+MCA = 23 ± 2%, R + L-ACA = 17 ± 3%, ECA = 4 ± 2%, PCA = 12 ± 2%, and vertebrobasilar territory = 31 ± 4%. Excluding the ECA-rVFR, which is underestimated, these values are comparable to previously reported values. Six subjects were scanned twice, demonstrating comparable and even higher reproducibility than previously reported using phase-contrast, yet with faster scan time (∼1 min). This method was implemented in one patient with MCA occlusion and one with Moyamoya syndrome scanned before and after bypass surgery, demonstrating its clinical potential for quantitative assessment of the degree of occlusion and the effect of surgery.
Keywords
Background
The ability to examine the structure of the vascular territories and to quantify the volumetric flow rate (VFR) of a specific artery is of central importance both in defining normal flow and in the diagnosis and evaluation of many cerebrovascular diseases.1,2 Vascular territorial imaging can be used to identify the presence and source of collateral flow to a brain area at risk of ischemia, to assess stenosis severity, and to assess the success of surgical intervention. 1 Along with attempts to develop imaging biomarkers, acquisition of quantitative values of the VFR of the major cerebral arteries could be used for objective quantitative evaluation of patients, with better ability to estimate disease progression and improved therapy response assessment.
Several methods have been proposed for the assessment of the vascular territories. X-ray digital subtraction angiography (DSA) is considered the gold standard for cerebral angiography, with high spatial and temporal resolution, and the ability to examine specific vessels. 3 However, this is an invasive procedure that involves exposure to radiation and is associated with neurological complications.4,5 Using magnetic resonance imaging (MRI), a few methods have been proposed for territorial segmentation including time of flight method with additional saturation pulses to remove contribution of specific arteries, 6 and territorial arterial spin labeling (ASL), which consists of tagging specific arteries or spatially encoding the labeling efficiency of the tagging plan. 7 However, these methods suffer from one or more of the following limitations: vessels of interest must be prospectively defined and identified; tagging a specific vessel without tagging nearby vessels is difficult; there is a limited number of different target arteries; the scan time depends on the number of labeled arteries and may result in long scanning time; and a low signal-to-noise ratio when there is a long arterial transit time. 8
Post processing methods, which attempt to track the blood flow through the arteries, have also been suggested for territorial segmentation. A recently reported study suggested a post-processing method for territorial segmentation based on computer tomography (CT) data using multiple-seed, iterative region-growing algorithm in which the territories are gradually segmented according to the bolus-arrival-time (BAT). 9 However, this method did not include arteries upstream of the circle of Willis, and was not applied to MRI data. Based on four-dimensional (4D) phase contrast, flow tracking cartography was suggested, yet this method enables segmentation of only the large blood vessels and is limited by the velocity encoding used. 10
There are a number of dynamic methods for magnetic resonance angiography (MRA) with relatively high temporal resolution of about 2–3 s, and high spatial resolution of about 1 mm3.11,12 These methods allow tracking the progress of the contrast bolus through the blood vessels and detecting possible delay in the bolus progression. In routine clinical practice, these methods result in simultaneous angiography of all the arteries, without selecting a specific territory. Currently, most applications of these methods are based on qualitative or rough quantitative assessment of the data, without relating to the VFR of each territory. Measuring cerebral VFR of the different arteries was suggested using phase contrast MRI; however, this method requires a long scan time and its reproducibility is still debatable.13–16
The aims of this study were to develop a post-processing method for (1) territorial segmentation, and (2) measurement of the distribution of the VFR (relative VFR, rVFR) of the major cerebral arteries, based on time-resolved contrast enhanced angiography. The proposed post-processing method segments the detected blood vessels into eight territories, providing rVFR of each territory (relative to the total brain VFR) and a map of BAT. The method was applied to 15 healthy subjects, providing normal rVFR values within the different vascular territories. Six subjects were scanned twice to assess the reproducibility of the method. The applicability of this method to identify altered territories and blood flow was evaluated in three scans of two patients with vascular occlusions: one with middle cerebral artery (MCA) occlusion, and the second with Moyamoya syndrome, 17 scanned before and after bypass surgery.
Material and methods
Subjects
Healthy subjects
Data of 15 healthy subjects (nine males, age range 16–53 years, mean 34 ± 11 years old) were included in this study: six of which were scanned twice with an interval of one to three weeks. Inclusion criteria were normal brain MRI and no vascular anomaly or pathology on brain MRA.
Patients
Two patients: a sixty three-year-old female with right MCA occlusion and a five-year-old male, with neurofibromatosis type I and unilateral (right) Moyamoya syndrome, were included in the study. The patient with Moyamoya was scanned twice, before and after indirect bypass surgery.
All subjects had normal glomerular filtration rate and no contraindication to MRI scan. The study was approved by the Tel Aviv Sourasky Medical Center review board and was in accordance with the Declaration of Helsinki, both for retrospective analysis of data already acquired as part of routine clinical protocol, and for prospective study, where written informed consent was obtained from the subjects.
Magnetic resonance imaging
All imaging was performed on a 3 Tesla Siemens system (MAGNETOM Prisma or Skyra, Germany), using a 20 channel head coil. The protocol included conventional sequences, high-resolution T1-weighted imaging acquired before and after contrast agent injection, time of flight and time-resolved contrast enhanced angiography with interleaved stochastic trajectories (TWIST). TWIST parameters were: time to repeat/time to echo (TR/TE) = 2.13−2.37/0.84−0.99 ms, 160 coronal slices with in-plane spatial resolution of 0.9−1 × 0.9−1 mm, field of view: 256 × 187−256 mm, slice thickness of 1 mm, slice oversampling of 20%, parallel acquisition (IPAT) factor 6 (two in phase direction, three in 3D direction), partial Fourier 6/8 in both phase and slice directions, TWIST view sharing: central region A 20–25%, sampling density B 20%, resulting in temporal resolution of 1.8–2.7 s; 25–54 measurements, resulting in total scan time of 0:56–2:14 min. A power injector (MEDRAD, Spectris Solaris EP) was used to infuse 0.2 cc/kg (single dose) of contrast agent (Gadolinum Dotarem 0.5 M), followed by a flush of 20 cc saline, both at a constant rate of 2 cc/s. Injection started 8–27 seconds after the scan began.
Territorial segmentation
Territorial segmentation and rVFR measurements are performed based on the TWIST data. The major blood vessels are segmented into eight territories: (1) right and (2) left internal carotid arteries (ICA) with all branches (such as the ophthalmic artery), including the MCA (ICA+MCA), excluding the anterior cerebral arteries (ACA). (3) The right and left (combined) ACA (R+L−ACA); (4) right and (5) left, external carotid arteries (ECA); (6) right and (7) left posterior cerebral arteries (PCA); and (8) the vertebrobasilar territory (excluding the PCA).
The developed method for segmentation consists of five steps:
Creation of the angiography mask. Estimation of the bolus-arrival-time in high temporal resolution. Marking the seed regions for the different territories. Creation of blocking zones for each territory. Territorial segmentation using BAT based region-growing.
All steps are performed automatically, except for stage 3 which is performed manually.
Creation of the angiography mask
A threshold-based segmentation is performed to create the angiography mask. In each voxel, the mean value of the baseline signal intensity (the first four images) is subtracted from the 4D data. Only voxels with peak value ≥ 5% of the maximum peak value of all voxels (Pmax) are included in the angiography mask. In addition, voxels with peak time lower than a defined reference time (t0) or higher than 10 s after the defined reference time, are removed from the mask. The reference time is defined as the lowest peak time from voxels which have peak value ≥ 50% of Pmax. Voxels which are spatially disconnected from the vascular tree are also removed.
Estimation of the bolus-arrival-time in high temporal resolution
In order to estimate the BAT in a higher temporal resolution than the acquired resolution, the signal time-course of each voxel in the angiography mask was fitted to a function composed of two Gaussians and a plateau value (similar to Liberman et al. 18 ) and the peak time of the first Gaussian was used to create the estimated BAT maps (for more information, please see supplementary material).
Marking the seed regions for the different territories
Seed regions for the tracking algorithm are marked manually on the 3D BAT images, which allow easy detection of the arteries of interest (Figure 1(a)). For the right and left ICA+MCA territories, seed voxels are marked on the right and left ICA. For the R+L−ACA, the start of the two A2 segments at the meeting of the two A1 segments is marked. For the right and left ECA, voxels which are lateral to the ICA are marked. For the right and left posterior cerebral arteries (PCA), the seed voxels are detected automatically based on a voxel defined manually at the end of the basilar artery at the bifurcation into the two PCA (for detailed information, please see supplementary material). For the vertebrobasilar territory, voxels on the right and left vertebral arteries are marked.
(a) Example of the seed voxel positions displayed on a coronal minimum intensity projection of the BAT map (small blood vessels were removed for display purposes): (1) right ICA, (2) left ICA, (3) right vertebral artery, (4) left vertebral artery, (5) basilar artery, (6) ACA, (7) right ECA, (8) left ECA. (b) Example of the blocking zones for the right ICA+MCA territory, the left hemisphere (transparent grey), the ACA through the anterior communication artery (green), the PCA through the posterior communication artery (yellow) and the right ECA territory (pink).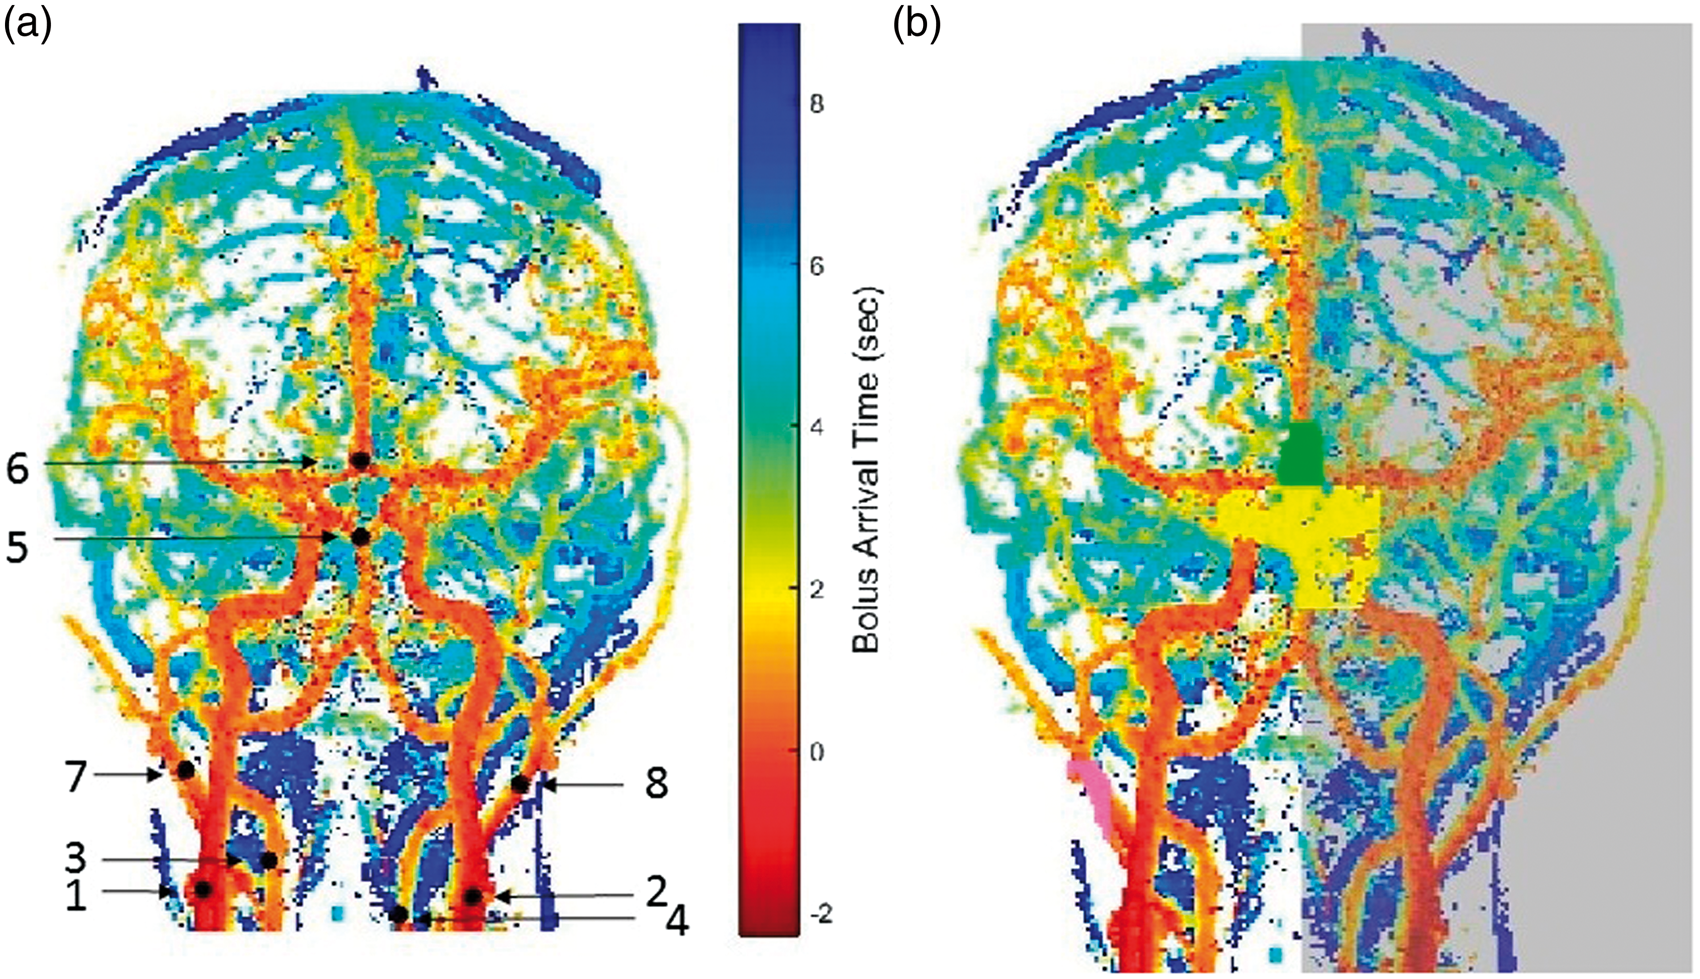
In order to reduce the possible effect of selecting a specific voxel, the initial seed voxel masks are expanded to the neighborhood voxels resulting in 3 × 3 × 3 seed regions.
Defining blocking zones for each territory
In order to avoid mixing of territories at the circle of Willis and at the veins, each one of the territories is not allowed to propagate through the circle of Willis into the other territories, and into the contra-lateral hemisphere (for the lateral territories) by using blocking zones for each territory. All blocking zones are created automatically, based on the defined seed regions, using criteria detailed in the supplementary material. An example of the blocking zones for the right ICA + MCA territory is shown in Figure 1(b).
Territorial segmentation using BAT based region-growing
The territorial segmentation is performed within the angiography mask by a multiple seed region-growing algorithm based on the estimated BAT (similar to Christensen et al. 9 ). First, the reference time (t0) is defined, in a similar way to the calculation in step one, but in higher temporal resolution. For each seed region, all the voxels spatially connected to the region with a BAT below t0 are detected. Next, each territory, in its turn, can grow while maintaining all voxels spatially connected, without invading other previously detected territories, according to the voxels’ BAT. The process is repeated iteratively, each time with a higher BAT limit, with increments of five percent of the acquired temporal resolution (∼100 ms), and stops 5 s after t0. Additional conditions for the segmentation processes were that the PCA territories were not allowed to grow before one of the vertebral arteries reached the basilar seed region, and the ACA was not allowed to grow before one of the ICA reached near the ACA seed region.
After segmentation, the territories originating from the two vertebral seed regions are merged into one vertebrobasilar territory. The territorial segmentation process is used to create new BAT maps of each territory, in which the BAT for each voxel is decided according to the time step in which it was added to the territory. This filters the produced BAT maps in a way that a voxel cannot have a BAT shorter than the BAT of all the voxels leading to it.
Calculation of rVFR and territorial BAT
The VFR is measured as the slope of the territorial volume (in number of voxels) as a function of time (in high temporal resolution) (Figure 2). Given only one territory with one inlet, which provides relatively constant volumetric blood flow, the territory volume should increase linearly as a function of time after bolus arrival, with a slope, which is proportional to the VFR. The VFR is calculated using linear regression on time points between t10 and t10+time window, where t10 is the time point after which the territory is filled to 10% of Vmax and the time window was set to 2.5 s in all subjects (for more information on the effect of time window on the VFR please see supplementary material). Vmax is defined as the volumes at the end of the segmentation (5 s in all subjects). For lateral territories, the max of right/left t10 value is chosen and for the vertebrobasilar territory, the t10 of the PCA is used. This calculation is used for all the segmented territories while the two PCA are included in the vertebrobasilar VFR calculation. Next, rVFR was calculated by dividing the VFR in each territory by the total VFR (including the ECA).
Graphs of number of voxels as a function of time for the different territories of a twenty seven year old healthy male. Linear lines (dashed or dash-dot lines for the right and left territories accordingly) were fitted using linear regression on the points between the vertical blue lines. The slope of the lines was used for VFR calculation and their point of reaching zero volume as the territorial BAT.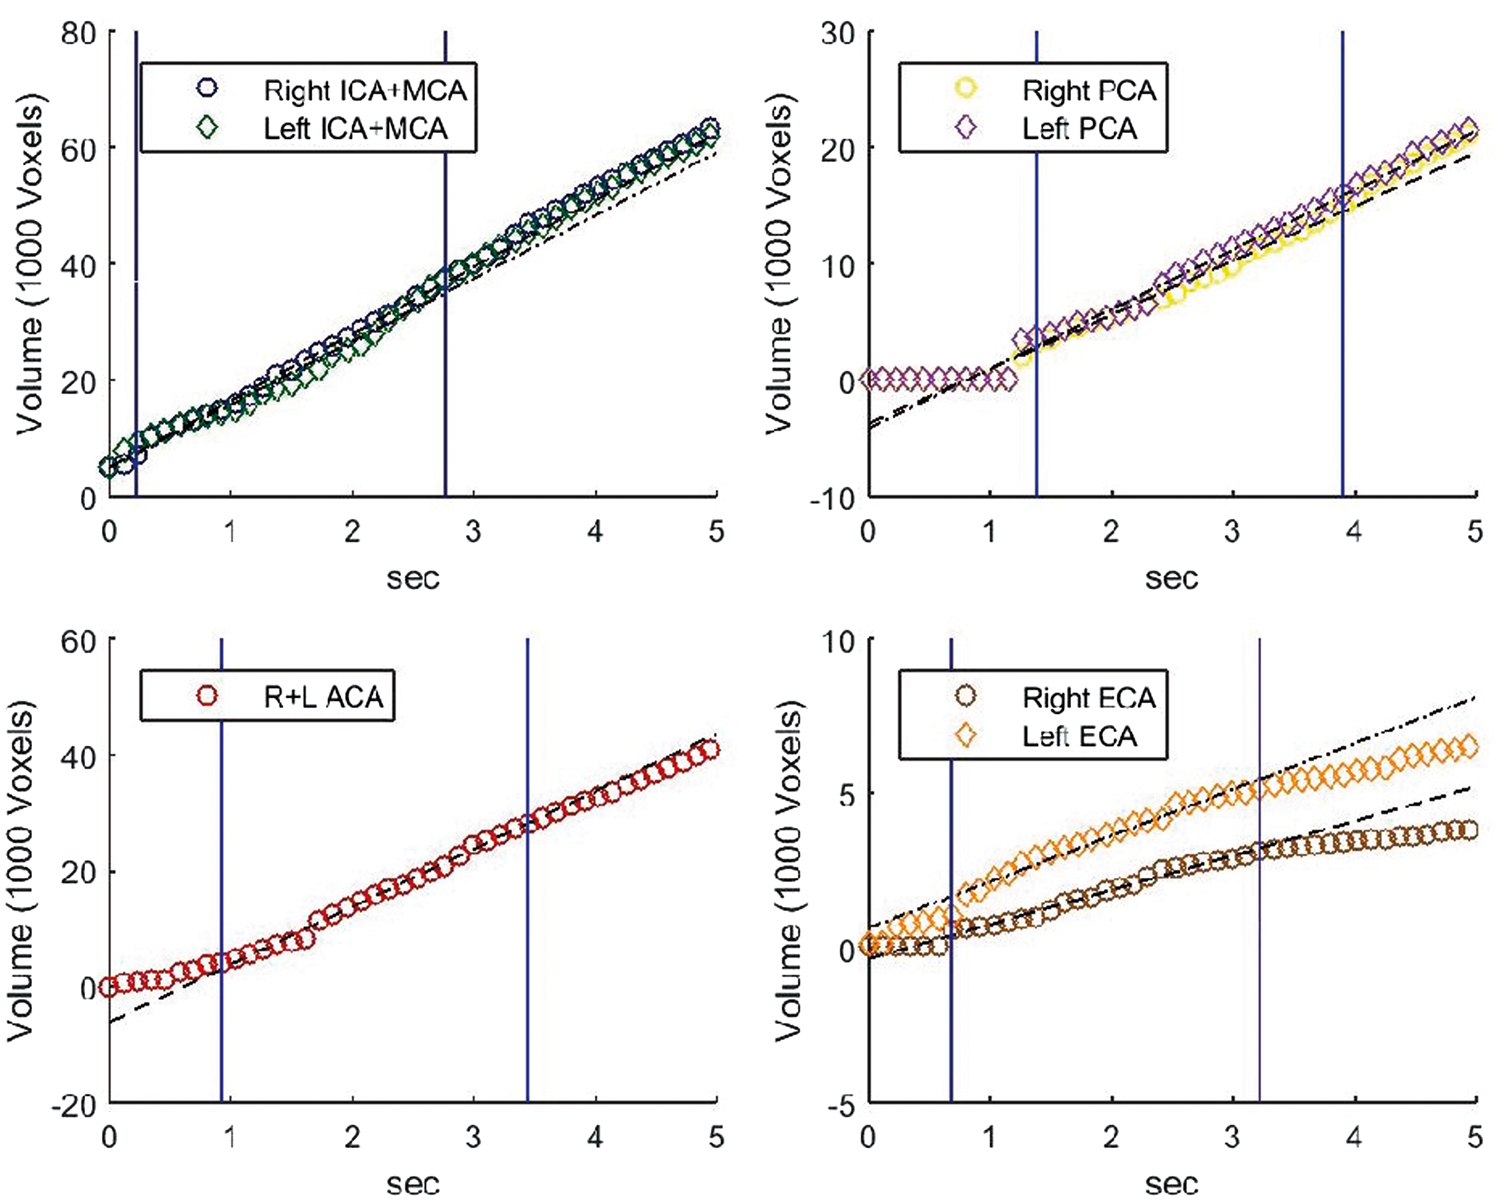
Territorial BAT is calculated for each territory according to the linear regression on the same time points (between t10 and t10+2.5 s), extrapolating to the time of zero volume.
Differences between right and left sides were calculated for the ICA+MCA, PCA and ECA territories. For the rVFR, side differences were calculated = 2 × ((right vessel rVFR)-(left vessel rVFR))/((right vessel rVFR) + (left vessel rVFR)), similar to previously reported studies,14,15 and for the territorial BAT, side difference = Right Vessel BAT-Left Vessel BAT was calculated. The differences between posterior (mean PCA) and anterior (mean ICA + MCA) territorial BAT values were also calculated.
Assessing method reproducibility
In order to assess the reproducibility of the proposed method, six healthy subjects were scanned twice and within-subject standard deviation (SDW) was calculated for each territory using the formula SDW = (∑(rVFR1–rVFR2)2/2 N)0.5, where rVFR1 and rVFR2 are the rVFR of the specific territory at the two different scan times and N is the number of subjects. 19 The least detectable difference (LDD) was calculated using the formula: LDD = 20.5 × 1.96 × SDW. 19 SDW and LDD were also calculated for the territorial BAT parameters in a similar way.
Statistical analysis
Correlations were analysed between age and the mean values of rVFR, BAT, side difference and posterior-anterior BAT difference, using Pearson correlation. Side differences were compared to zero using two-sided t-test. Gender values were compared using t-test. For patients, deviations from normal values were calculated based on the inter-subject standard deviation (SD) of the healthy group, assuming equal mean values and SD for the pairs of lateral territories.
Results
Healthy subjects
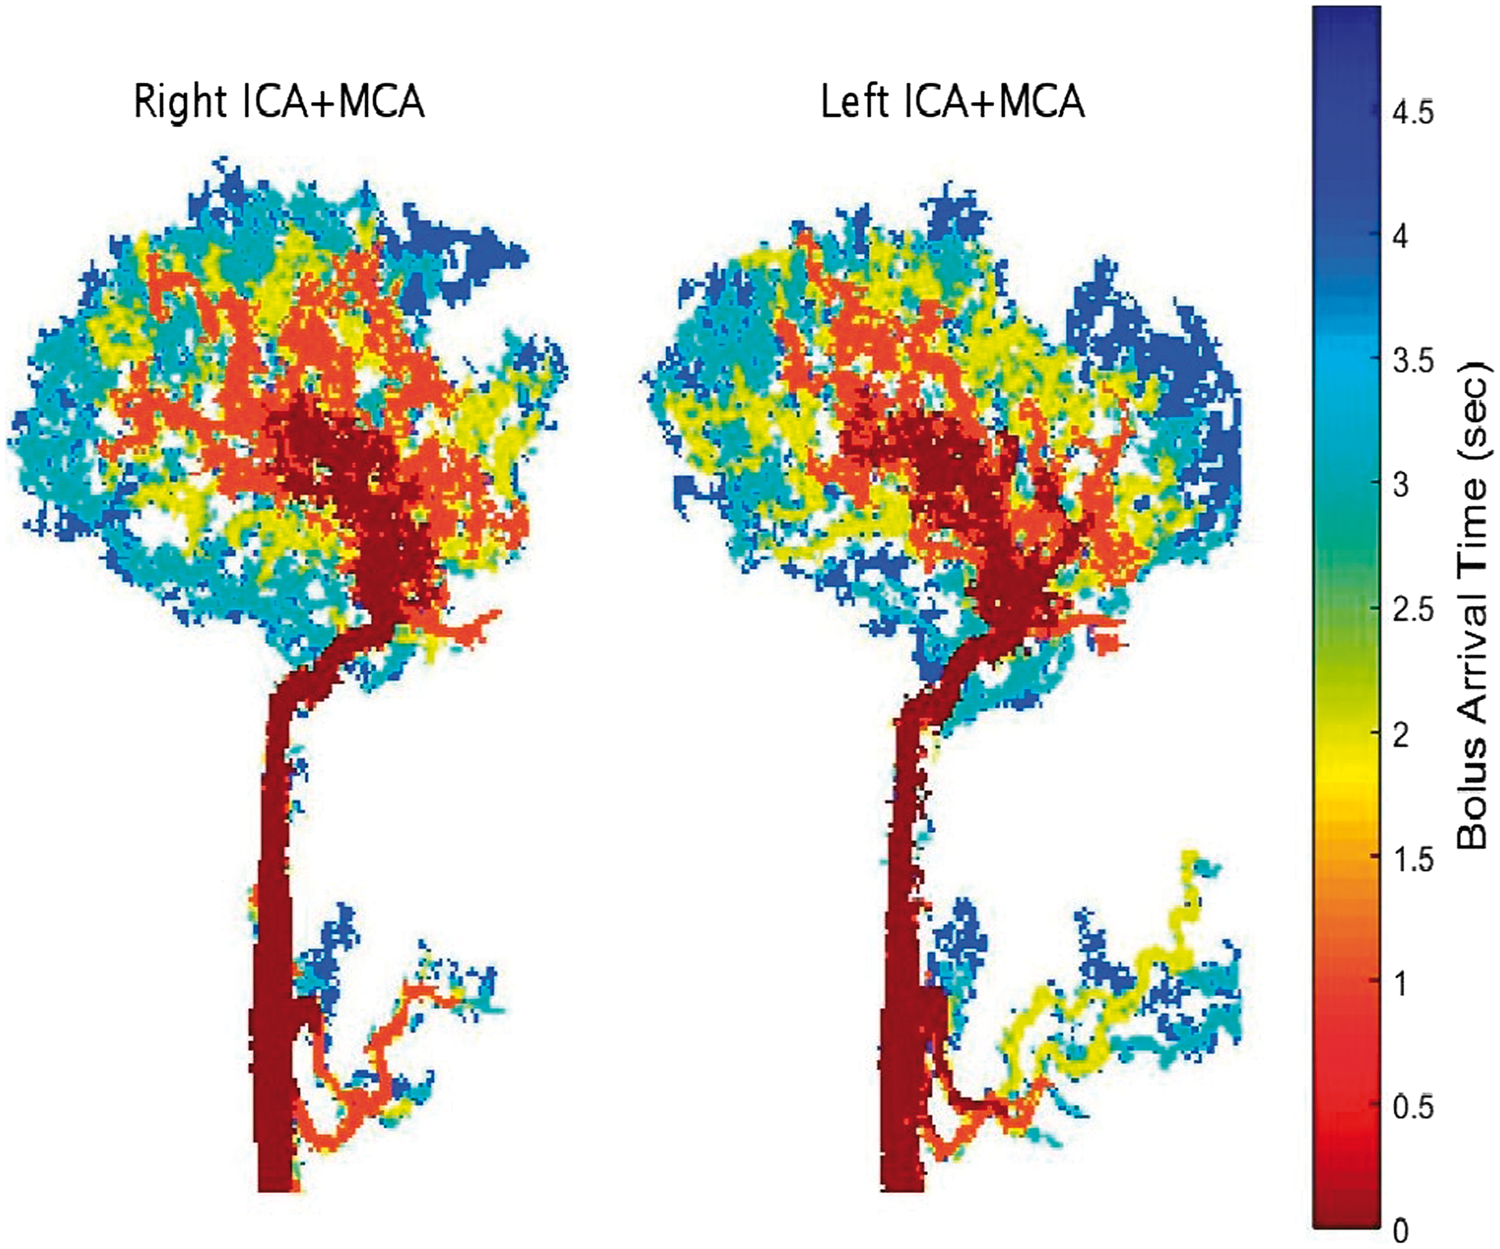
The developed method was successfully applied to all subjects. Figure 3 shows a representative segmentation of a 16-year-old healthy subject, with coronal projections at different time points after bolus arrival. Figure 4 shows sagittal projections of the right and left ICA+MCA territories color coded according to the voxel's BAT values at high temporal resolution.
Coronal projection of the eight segmented territories at different times following the contrast agent bolus arrival in a sixteen year old healthy male. In case of an overlap between territories in the projection, only one territory is displayed with the priority order (from lowest to highest): Right ICA+MCA, Left ICA+MCA, Vertebrobasilar, Right PCA, Left PCA, the combined two ACA, Right ECA and Left ECA. Sagittal minimum intensity projections of the bolus arrival time, based on the segmentation process, for the right and left ICA+MCA territories (excluding the ACA branch) in a 25-year-old healthy male.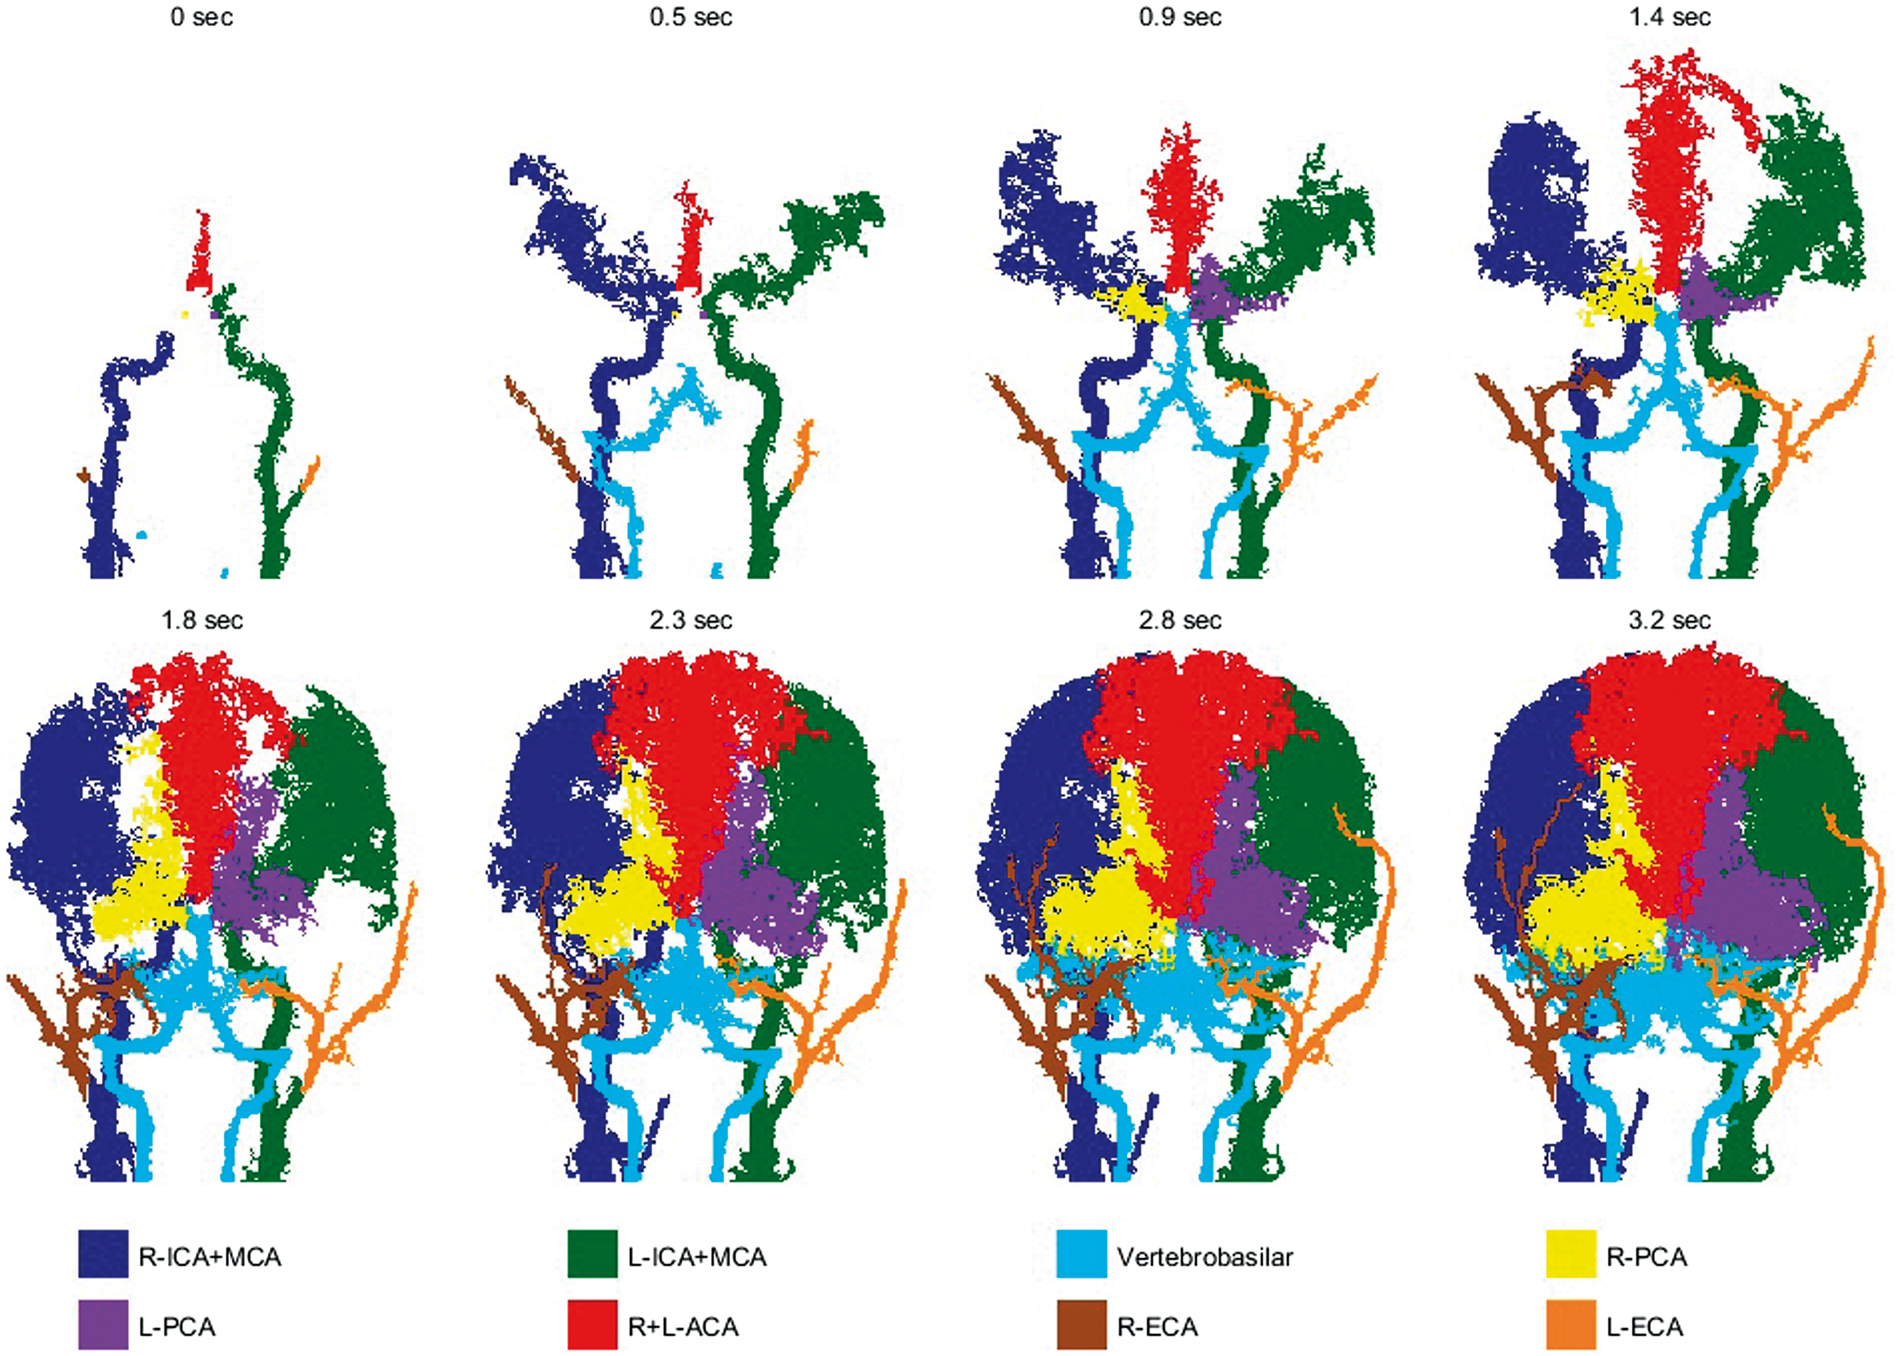
rVFR and territorial BAT results from healthy subjects.
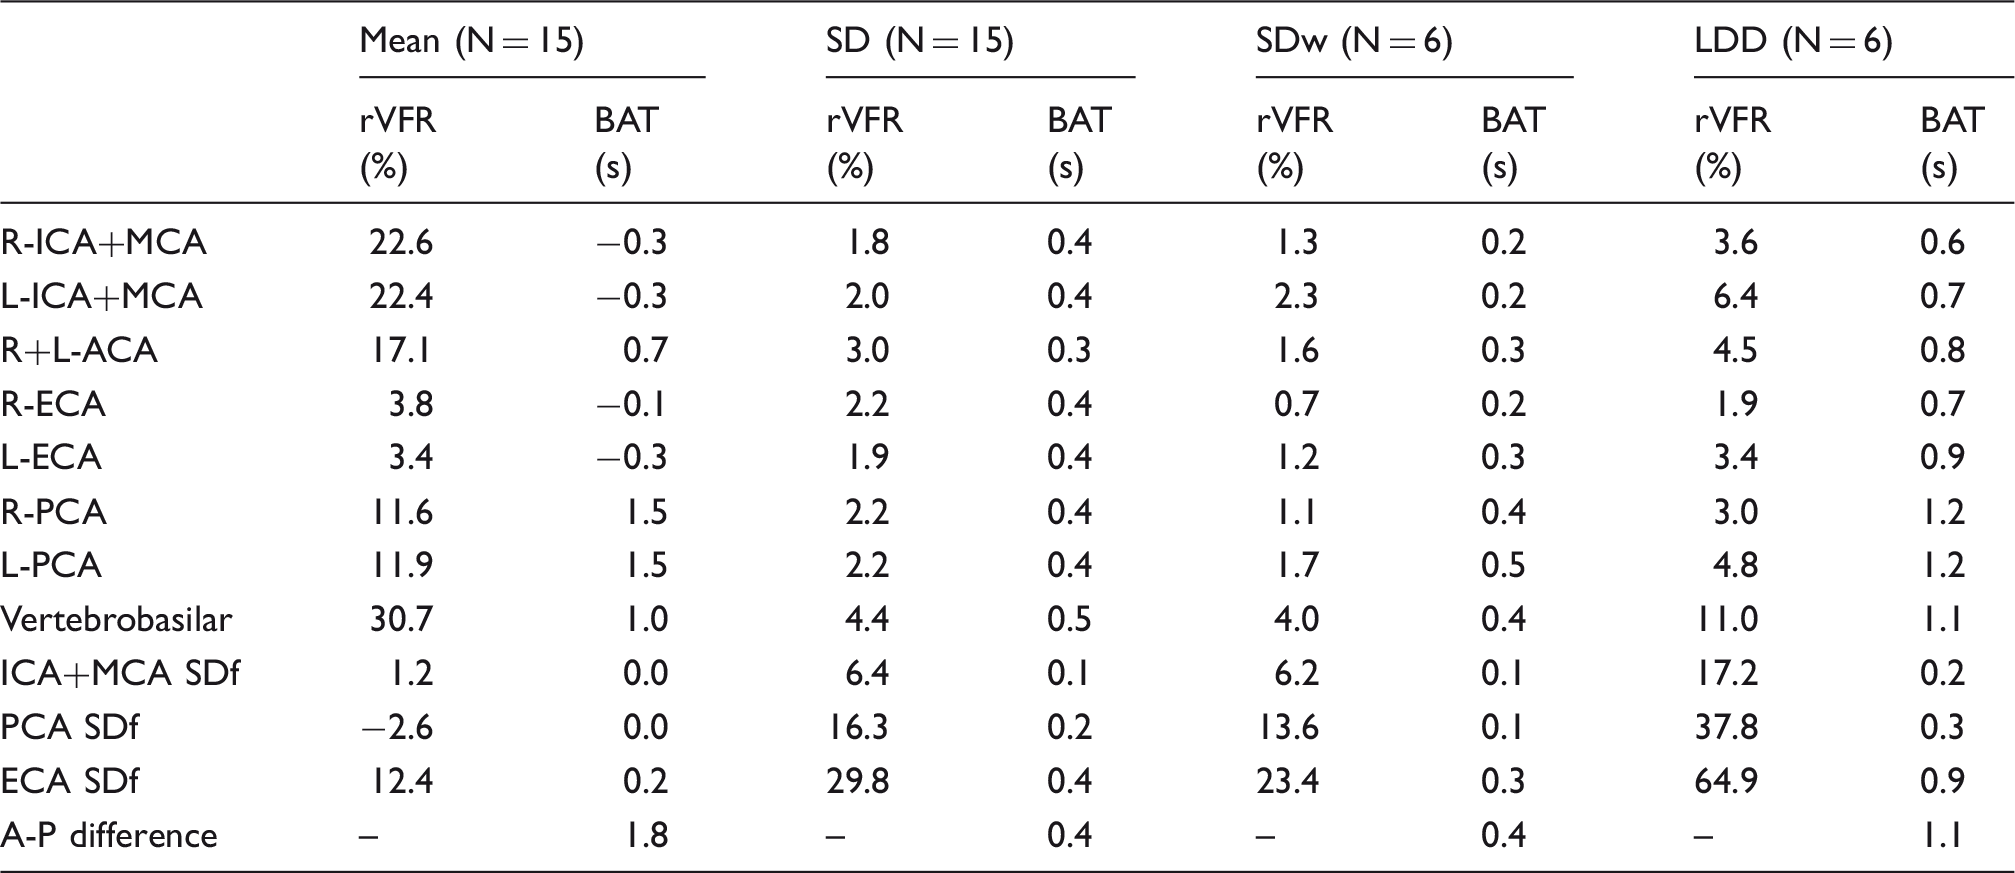
L/R: left/right; I/P/A/E: internal/posterior/anterior/external; CA: cerebral arteries; SD: inter-subject standard deviation; SDw: within subject standard deviation; LDD: least detectable difference; SDf: side difference; A-P: anterior-posterior.
The average values for within-subject SDw for the rVFR and territorial BAT values were: 1.8% and 0.2 s for the ICA+MCA; 1.4% and 0.4 s for the PCA; 1.0% and 0.3 s for the ECA, respectively. All the calculated SDw were similar and even smaller than the inter-subject SD.
No significant correlations with age were found for any the parameters, except for an increased delay between the posterior and anterior circulation with age (r = 0.73, p = 0.002) and increase in the left PCA rVFR with age (r = 0.59, p = 0.02). No significant differences between genders were found.
Patients
Figure 5 shows territorial segmentation of the two patients: the patient with right MCA occlusion; and the patient with Moyamoya syndrome before and after right ECA indirect bypass surgery. In both patients, a reduced flow to the right ICA+MCA can be seen to be compensated by increased and delayed flow through the right PCA and the ACA. In the patient with Moyamoya, seven months after surgery, a dominant contribution of the right ECA bypass can be seen.
Coronal projections of the eight segmented territories for a 63-year-old female with MCA occlusion (subject 1) and a 5-year-old child with unilateral (right) Moyamoya syndrome (subject 2), one week before and seven months after right ECA indirect bypass surgery.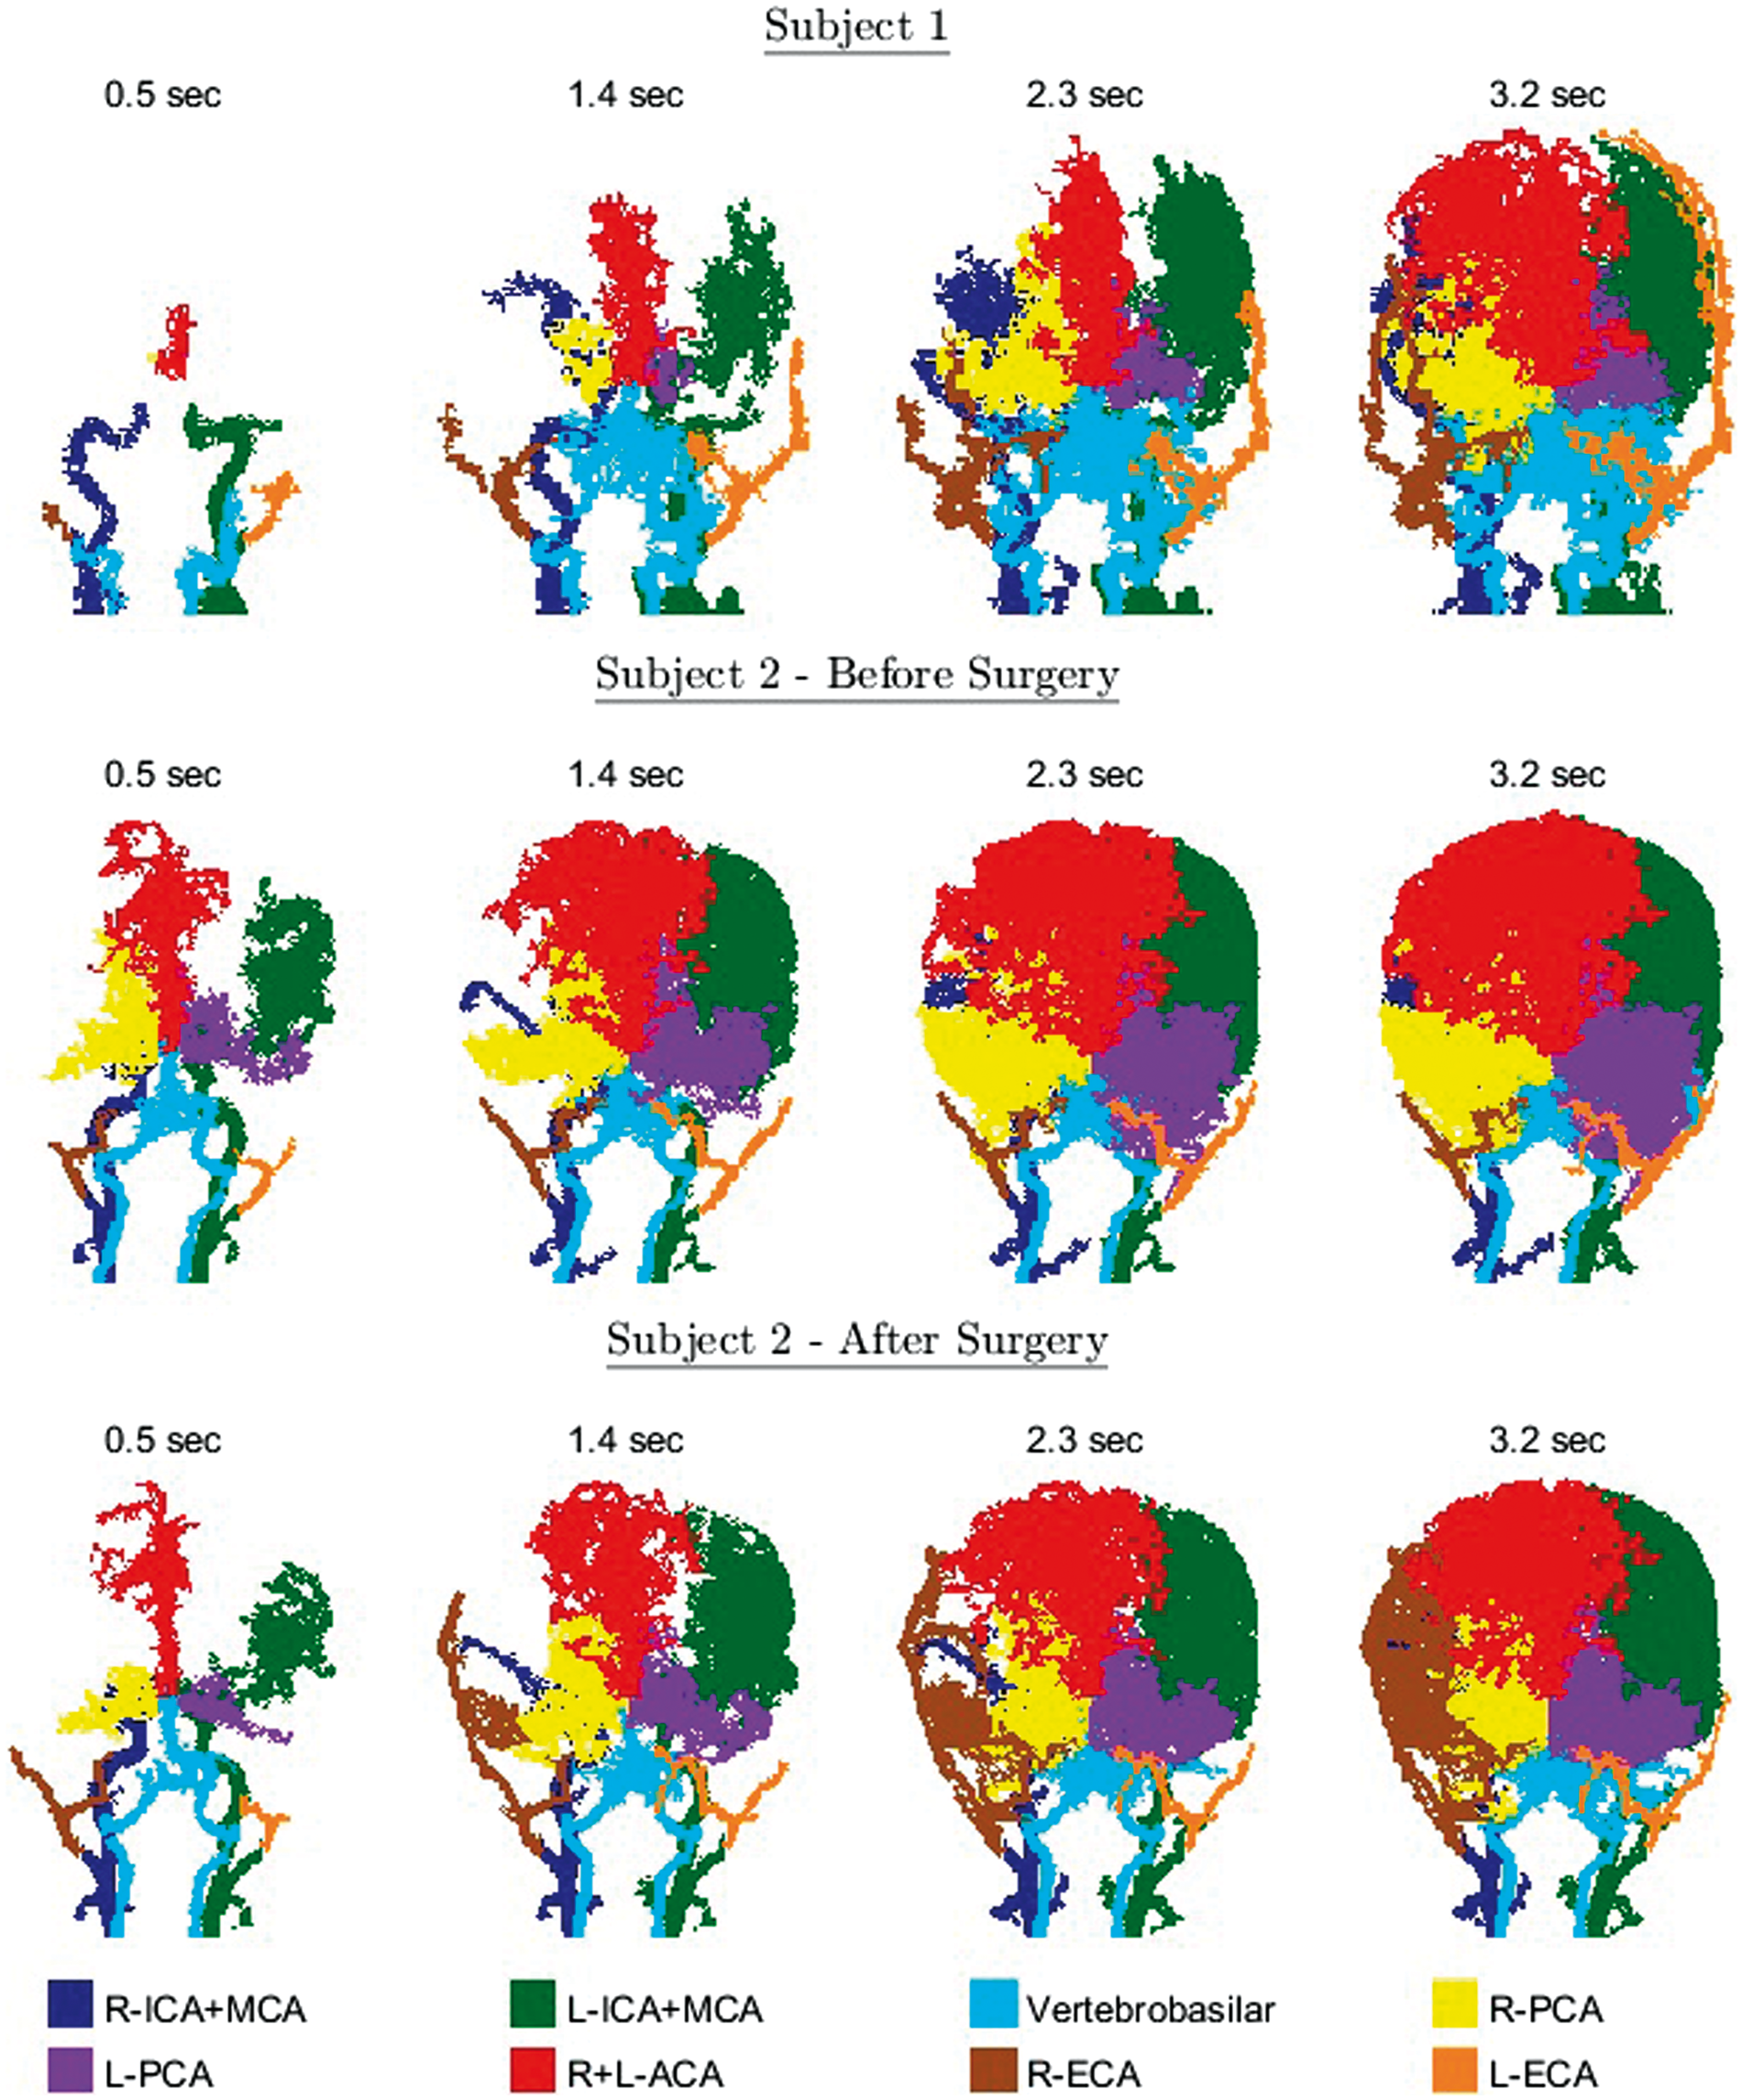
rVFR results of patients.
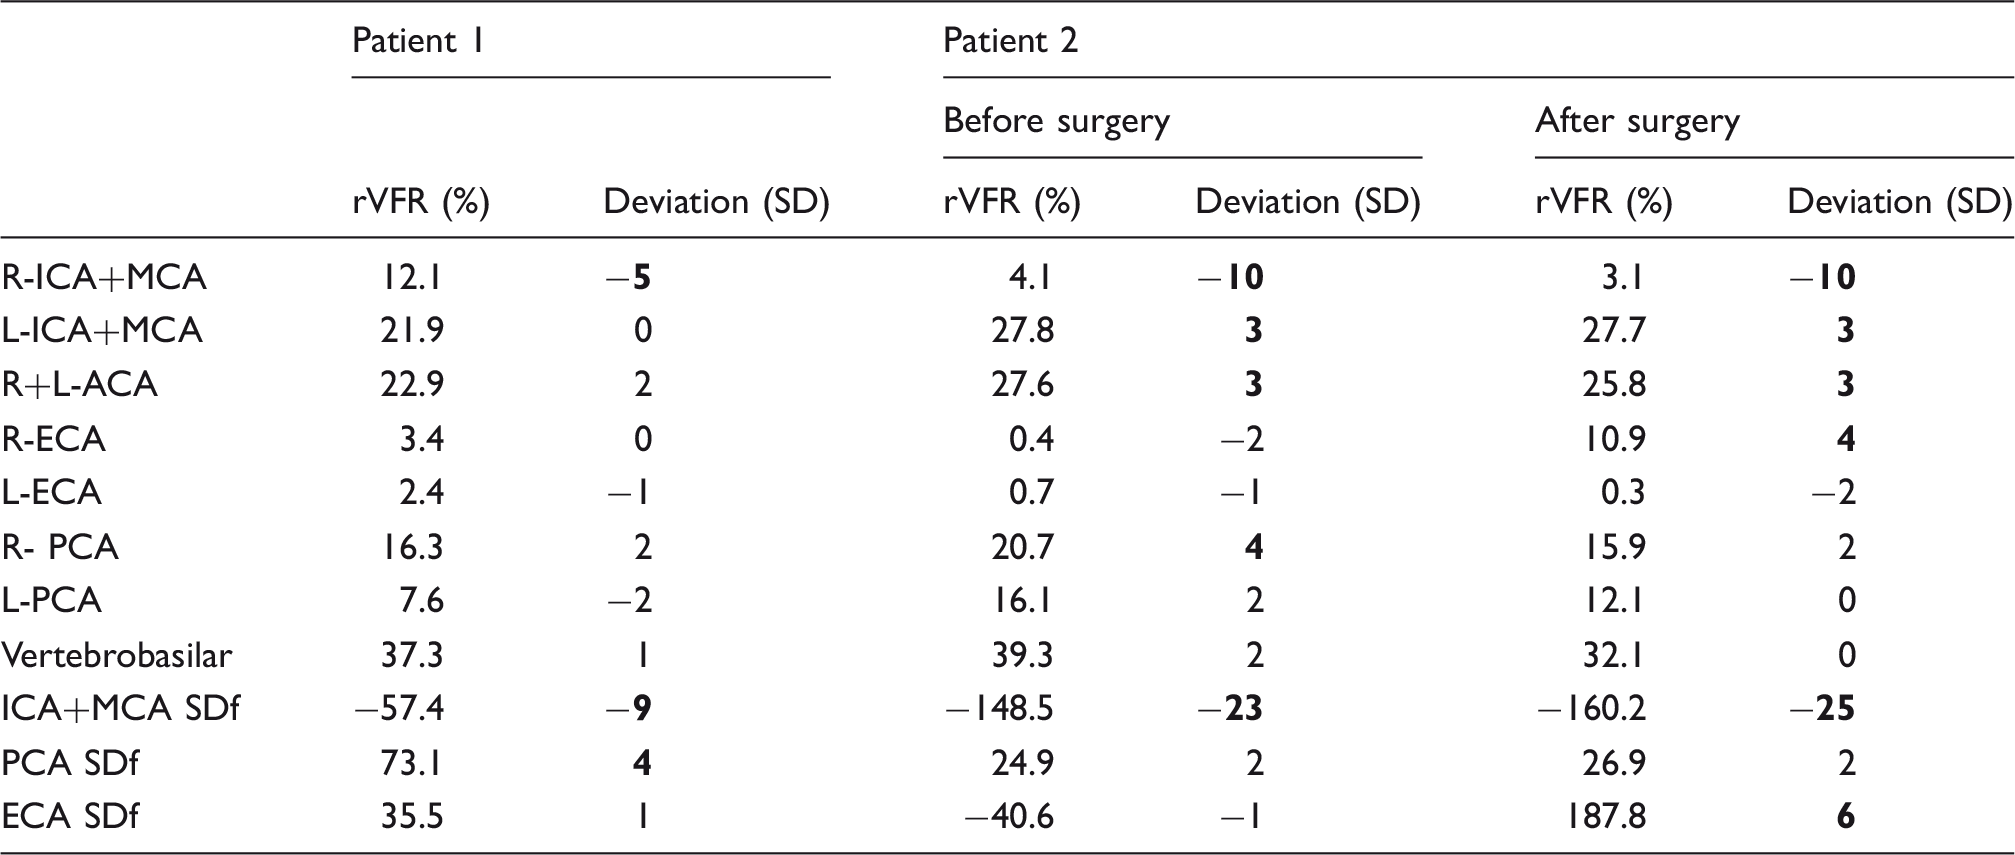
Note: Three or more standard deviations (SD) from normal values are marked in bold. Patient 1 – a patient with right MCA occlusion; Patient 2 – a patient with Moyamoya.
L/R: left/right; I/P/A/E: internal/posterior/anterior/external; CA: cerebral arteries; SDf: side difference.
Discussion
This study proposes a post-processing method based on TWIST data for territorial segmentation of the major cerebral arteries and for measuring the cerebral rVFR. In addition, the algorithm provides BAT maps with temporal resolution higher than the acquired resolution. Reproducibility of the method was assessed in healthy subjects, demonstrating comparable and even higher reproducibility than phase contrast method. 14 We demonstrated the applicability of the method for visualization of the territories and quantification of the rVFR in two patients with vascular occlusions, including assessment of the effect of surgery in one of the patients.
The proposed post processing method is based on TWIST data, and enables segmentation of eight different territories, covering the entire brain with spatial resolution of about 1 mm3 and calculating the rVFR based on high temporal resolution. The method requires only about 1-min scan time during contrast agent injection. Previously suggested methods, including ASL and phase contrast, require much longer scan time for similar results. The method is fully automatic, in the sense that it can produce the results with no user intervention except for the manual definition of seed regions. The algorithm was implemented using MATLAB, and takes about 1–2 h processing time using an Intel I7-4770 processor. This processing time will probably be reduced in future implementations based on graphics processing unit. We will be glad to share the code upon request. The proposed method can be easily implemented on similar dynamic MRA methods which have high temporal and spatial resolution.
Our initial results regarding the method's reproducibility suggest similar and even lower LDD values than previously reported using phase contrast, in all comparable territories. 14 Since the calculation used in the proposed method is based on the entire arterial territories, it is less susceptible to local noise and specific choice of area of interest than phase contrast. The SDw was found to be similar and even lower than between subjects SD. Preliminary results in two patients showed large differences between patients and healthy subjects and changes following surgery. Future studies should explore the sensitivity of this method in a larger group of patients and its ability to quantitatively assess more subtle vascular pathologies such as carotid stenosis.
Excluding the ECA contribution, the calculated rVFR values obtained in this study are similar to previously reported values using phase contrast. 13 The ECA rVFR is underestimated using the proposed method. 13 This is probably because many of the voxels fed by the ECA were removed in the post-processing, as their signal time-course behaves differently than the signal time-course inside the brain. In addition, the seed voxels for the ECA were marked higher than the carotid bifurcation, so some of its branches may be segmented as if they belong to the ICA. However, preliminary results in one patient following bypass surgery suggest the applicability of the method to detect increased collateral flow from the ECA into the brain.
Given the size and characteristic of our group, the results represent healthy young adults. No differences between right and left vessels rVFR were detected in this study which is in accordance with previous results, 13 although contradicts a recent study that did find about twenty percent side difference in the M1 segment VFR (left > right). 15 Similar to previous results, 13 no dependency of the rVFR on age was found, except for the left PCA rVFR. These findings should be interpreted with caution given that the age range of our cohort was relatively small and that the correlation with age of the left PCA rVFR did not pass correction for multiple comparisons. The increased delay found between the posterior and anterior circulation with age may be a result of the reduction in the flow velocity with increasing age. 20 No gender differences were found in this study, which is in accordance with previous results (except for higher VFR in ECA of males found in a previous study). 13 However, due to the relatively small sample size and narrow age range, the results regarding differences between gender and age should be regarded as preliminary.
The proposed method provides relative values of VFR and not absolute values, since the absolute VFR values calculated here are affected by partial volume effects and the threshold values used for the calculation. In this study, we calculated the VFR as the slope of the curve of volume versus time, at a specific time window. The choice of the time window within the linear range, showed only a minor effect on the calculated VFR. The number of voxels in each territory is affected by the threshold used in the creation of the angiography mask and physiological and experimental parameters. We used a low threshold, averaging thousands of voxels, resulting in a relatively linear dependency between number of voxels and time, at a specific time window. Since we assumed similar contribution from each voxel (regardless of intensity), partial volume effects affect the calculation and the results are not in absolute values. In order to improve accuracy, and to obtain absolute flow values, future implementations may take into account the different contributions of each voxel.
A few limitations to this study should be addressed: The assumption of one inlet to each territory is not completely accurate. However, as blood flow in the major blood vessels is relatively fast and the time windows in which rVFR were calculated were adjusted accordingly, these effects should not be significant. In addition, the method assumes that each voxel is supplied by only one major artery, which is the first to reach it in the segmentation process. This is less accurate in cases of mixed territories, especially if the combination is at an early stage, at the circle of Willis, in cases in which there is a significant flow through the posterior communicating cerebral artery. Additional analyses focused on the circle of Willis may mitigate this limitation in the future.
In the current study, the analysis method was applied to data obtained using TWIST, which requires contrast agent injection. Although this method has much higher signal-to-noise ratio and shorter acquisition time over non-contrast enhanced methods, it may be inapplicable to some subjects, and it is limited in its ability for repeated measurements. Non-contrast methods such as ASL were proposed to evaluate vascular territories, and the effect of surgery.21,22 In recent years, methods for non-contrast 4D MRA are also emerging.23–26 Theoretically, given good enough signal-to-noise ratio and spatial resolution, the presented algorithm should also be applicable to non-contrast 4D MRA.
In conclusion, the presented post-processing method is based on a routinely used clinical sequence, with high temporal and spatial resolutions and short acquisition time. Analysis results in segmentation of the eight major vascular territories and quantitative assessment of the rVFR. Preliminary results in two patients suggest the potential of this method to provide more precise evaluation of patients with occlusive conditions, improved assessment of occlusion severity, collateral contribution, follow-up of disease progression and treatment response.
Footnotes
Funding
The author(s) received no financial support for the research, authorship, and/or publication of this article.
Acknowledgements
We thank Vicki Myers for editorial assistance.
Declaration of conflicting interests
The author(s) declared no potential conflicts of interest with respect to the research, authorship, and/or publication of this article.
Authors’ contributions
OG – Developed and implemented the method; acquired and analyzed the data; wrote the first draft and approved the final version of the manuscript. SIS, JR, LBS – Assisted in subject recruitment; performed data examination and analysis; reviewed the manuscript. MA – Performed data examination and analysis; reviewed the manuscript. DBB – Conceived of and designed the study; performed data examination and analysis; wrote the first draft and approved the final version of the manuscript.
References
Supplementary Material
Please find the following supplemental material available below.
For Open Access articles published under a Creative Commons License, all supplemental material carries the same license as the article it is associated with.
For non-Open Access articles published, all supplemental material carries a non-exclusive license, and permission requests for re-use of supplemental material or any part of supplemental material shall be sent directly to the copyright owner as specified in the copyright notice associated with the article.