
Abstract
To derive the reperfusion index best predicting clinical outcome of ischemic stroke patients, we retrospectively analysed the acute and 24-h computed tomography perfusion data of 116 patients, collected from two centres equipped with whole-brain computed tomography perfusion. Reperfusion index was defined by the percentage of the ischemic region reperfused from acute to 24-h computed tomography perfusion. Recanalization was graded by arterial occlusive lesion system. Receiver operator characteristic analysis was performed to assess the prognostic value of reperfusion and recanalization in predicting good clinical outcome, defined as modified Rankin Score of 0–2 at 90 days. Among previous reported reperfusion measurements, reperfusion of the Tmax>6 s region resulted in higher prognostic value than recanalization at predicting good clinical outcome (area under the curve = 0.88 and 0.74, respectively, p = 0.002). Successful reperfusion of the Tmax>6 s region (≥60%) had 89% sensitivity and 78% specificity in predicting good clinical outcome. A reperfusion index defined by Tmax>2 s or by mean transit time>145% had much lower area under the curve in comparison to Tmax>6 s measurement (p < 0.001 and p = 0.003, respectively), and had no significant difference to recanalization at predicting clinical outcome (p = 0.58 and 0.63, respectively). In conclusion, reperfusion index calculated by Tmax>6 s is a stronger predictor of clinical outcome than recanalization or other reperfusion measures.
Introduction
Either reperfusion of the ischemic region or recanalization of an occluded artery has been reported to predict outcome of ischemic stroke patients in previous studies.1,2 Recent studies have focused on the comparison of recanalization and reperfusion, the results of which suggest that reperfusion is superior to recanalization at predicting tissue outcome and clinical outcome after ischemic stroke.3–5
However, to apply the reperfusion measurement in clinical practice, two concerns need to be addressed. The first concern is the variation of approaches for reperfusion quantification. Across research groups, reperfusion have been quantified differently, varying from the restoration of Tmax>2 s ischemic region,4,6,7 restoration of Tmax>6 s region,3,8,9 to restoration of MTT>145% region.5,10,11 According to the findings of past studies, different perfusion thresholds introduce variation in the accuracy of delineating the ischemic region.12,13 Thus, it is reasonable to assume that reperfusion of the ischemic region defined by different thresholds might vary in the performance of predicting outcome of stroke. The other concern is the inaccuracy of reperfusion assessments when using limited-coverage computed tomography perfusion (CTP) scanners. Previous reperfusion studies have been carried out on CTP with limited brain coverage (e.g. a 16 - or 64-slice scanner) which provides incomplete cerebral perfusion information in the axial plain.14,15
In the present study, CTP with whole-brain coverage was used to ensure the accuracy of reperfusion quantification. With whole-brain CTP data, we aimed to identify the optimal reperfusion measurement at determining good clinical outcome.
Methods
Patients
This is a retrospective study, using data from two centres, John Hunter Hospital (Newcastle, Australia) and Huashan Hospital (Shanghai, China). Patients with multi-modal computed tomography (CT) within 6 h of stroke onset and repeated multi-modal CT at 24–48 h post onset were included, and decision of which patient should receive repeated multi-modal CT scanning was made by local clinicians. Following criteria were further applied to select patients. First, patients with occlusion on intra-cranial artery or middle cerebral artery were included, while those with posterior circulation occlusion were excluded. We also excluded patients with severe motion artefact or inadequate acquisition time of CTP, as well as patients with haemorrhagic transformation on follow-up imaging. Finally, patients with incomplete 3-month clinical data were excluded. Patients eligible for thrombolysis were treated according to standard institutional guidelines of John Hunter Hospital or Huashan Hospital. The study was approved by the ethical committees of John Hunter Hospital and Huashan Hospital as part of the International Stroke Perfusion Imaging Registry (INSPIRE). Informed consent form was obtained from all participants for their data to be collected for the registry.
CT acquisition and post-processing
In John Hunter Hospital, multi-modal CT images were acquired on 320-detector Toshiba scanner (Toshiba Aquilion ONE; Toshiba, Tokyo, Japan). The standard multi-modal CT protocol included non-contrast CT (NCCT), CT angiography (CTA), and CTP. The intracranial CTA and CTP were acquired simultaneously. Image acquisition commenced 7 s after non-ionic iodinated contrast injection into an antecubital vein (40 ml, 6 ml/s; Bayer HealthCare, Berlin, Germany) and lasted for 60 s with 19 time points acquired. The whole acquisition process consisted of three phases: phase one acquired 1 frame as mask image with one rotation (80 kV, 300 mAs); phase two was arterial phase, acquiring 13 frames with the frame interval of 2 s (80 kV, 150/300 mAss); phase three was venous phase, acquiring five frames with the frame interval of 5 s (80 kV, 150 mAs). There was 4 s time interval between phase one and phase two, and 5 s time interval between phase two and phase three. Spatially, one gantry rotation resulted in 320 slices with the thickness of 0.5 mm, which covered 160 mm on axial direction. FOV was 220 × 220 mm, and Matrix was 512 × 512.
In Hua Shan Hospital, multi-modal CT images were acquired on 256-detector scanner (Philips iCT-256; Philips, Germany). NCCT was acquired first, followed by CTP with intracranial CTA being reconstructed from the CTP raw data. CTP data were acquired by “shuttle mode” with 4 s interval between shuttles. The acquisition started 5 s after the injection of the non-ionic iodinated contrast (40 ml, 5 ml/s), and it lasted for 60 s resulting in 13 time points (80 kV, 100 mAs). Spatially, 125 mm was covered on axial direction, by 25 slices with 5 mm thickness. FOV was 220 × 220 mm, and Matrix was 512 × 512.
After acquisition, CTP data from both hospitals were processed by the commercial software MIStar (Apollo Medical Imaging Technology, Melbourne, Victoria, Australia). The software applied least-mean-squares fitting to obtain a smooth time-attenuation curve from the time-series image frames. From the curve, following perfusion maps were then generated by deconvolution mathematical approach (standard singular value decomposition, sSVD): cerebral blood flow (CBF), cerebral blood volume (CBV), mean transit time (MTT), and time to peak of the residual function (Tmax). The sSVD model required information of the arterial input function (AIF) and the venous outflow function (VOF) which were derived from anterior cerebral arterial (ACA) of the non-ischemic hemisphere and superior sagittal sinus, respectively (VOF was used to correct the partial volume effect of AIF). 16
Measuring reperfusion index on CTP
CTP data was segmented to ischemic and non-ischemic hemisphere on MIStar software. The non-ischemic hemisphere was used to derive normal perfusion value and the ischemic hemisphere was used to calculate reperfusion index.
For the non-ischemic hemisphere, two regions of interest (ROI) were drawn corresponding to the two time points of CTP scanning: ROI1 covered the non-ischemic hemisphere of acute CTP and ROI2 covered the non-ischemic hemisphere of 24-h CTP. Absolute perfusion values of CBF, CBV, MTT, and Tmax were calculated for ROI1 and ROI2 separately. Then the difference of the perfusion values between ROI1 and ROI2 was assessed for each perfusion parameter. Perfusion parameters with a significant difference between time points were considered unsuitable for reperfusion quantification in subsequent analysis.
For the ischemic hemisphere, the same perfusion threshold was set to define ischemic lesion on acute CTP and on 24-h CTP (acute CTP and 24-h CTP was analysed separately). Then, reperfusion index of the ischemic lesion was calculated by the following equation:
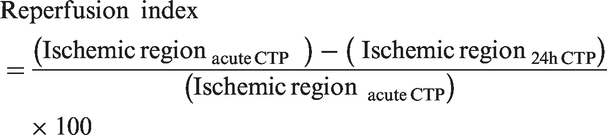
To observe the variation of reperfusion index across perfusion thresholds, a wide range of thresholds were covered in this study (Figure 1): for CBF and CBV maps, the threshold setting ranged from 100% to 5% at 5% decrement; for MTT, the range was 100–200% at 5% increment; for Tmax, the range was 0–10 s at 0.5 s increment. Then, reperfusion indexes calculated by the previously published ischemic thresholds, including Tmax>2 s,
7
Tmax>6 s,
17
MTT>145%,
18
were selected and compared to each other as well as to the recanalization of occluded artery.
Threshold setting on perfusion maps. For each perfusion map, one threshold delineates one ischemic region, and the setting of 20 threshold levels results in 20 ischemic regions. Each ischemic region corresponds to one reperfusion index.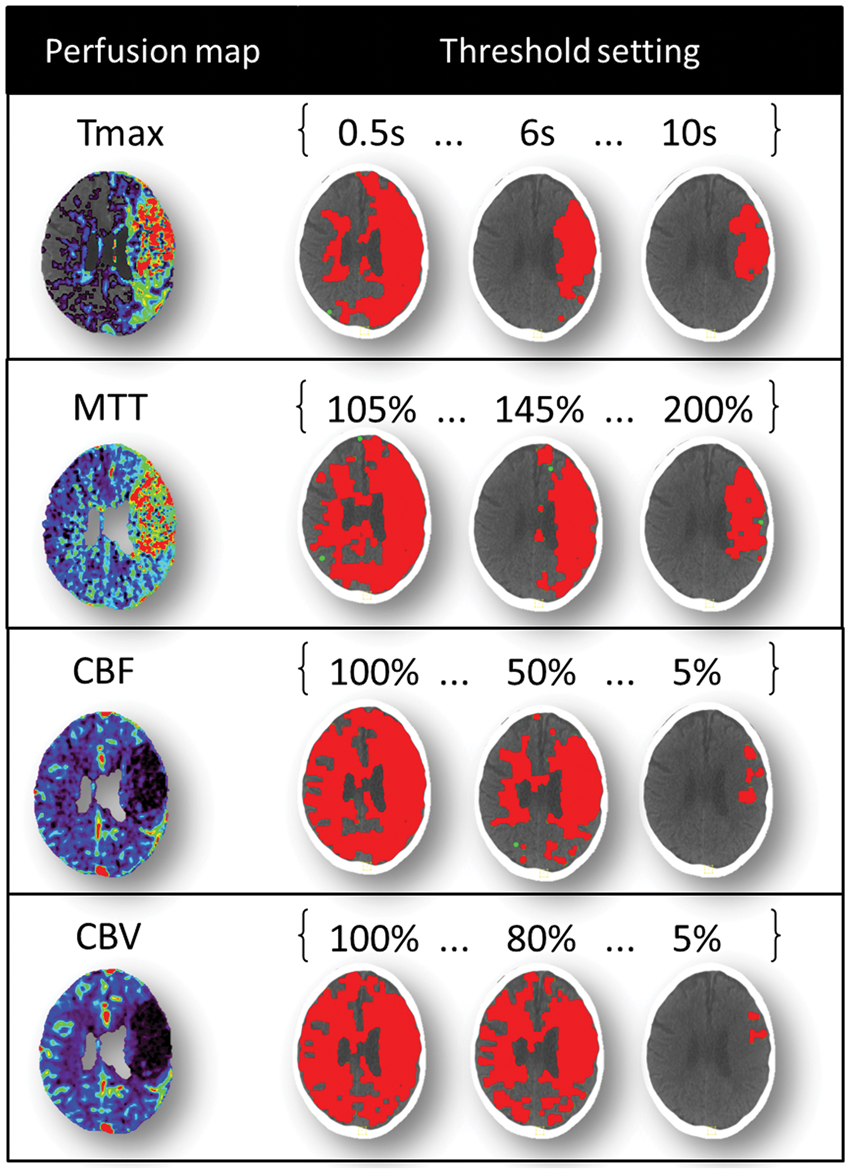
Classifying recanalization on CTA
Recanalization status was graded by the arterial occlusive lesion (AOL) grading system, 19 evaluating the restoration of flow through the previously occluded vessel on 24-h CTA. AOL score of 0 refers to no recanalization, score of 1 refers to partial recanalization with no distal flow, score of 2 refers to partial recanalization with distal flow, and score of 3 refers to complete recanalization. The AOL classification was done by M.W.P. (a stroke imaging neurologist with >10 years of experience) and was blinded to the reperfusion analysis.
Clinical outcome
The outcome of patients was dichotomized based on modified Rankin Score (mRS) at 90 days: score of 0–2 was defined as good clinical outcome and score of 3–6 was defined as poor clinical outcome. The mRS score of 0 refers to no symptoms, 1 refers to no significant disability, 2 refers to slight disability, 3 refers to moderate disability, 4 refers to moderately severe disability, 5 refers to severe disability, and 6 refers to death. The mRS scores were performed by X.C. (a neurologist with >5 years of clinical experience) in Huashan Hospital and by M.W.P in John Hunter Hospital, and then uploaded to INSPIRE online database for reviewing and analysing.
Tissue outcome
Ischemic tissue outcome after stroke was measured by infarct growth, which was calculated by the volume change of infarction from acute phase to 24 h. Baseline infarct volume was measured on CTP defined as CBF <30% 20 and 24-h infarct volume was measured on follow-up NCCT with visual delineation of hypodense regions by M.W.P.
Statistical analysis
Perfusion values of the non-ischemic hemisphere were summarized by mean and standard deviation, and difference of the perfusion value between acute CTP and 24-h CTP was assessed by paired t-test. Reperfusion index was summarized by median±inter-quantile range (IQR) and plotted across perfusion threshold levels (Figure 2). Repeated measure ANOVA was used to test the difference of reperfusion index measurement across thresholds for each map.
Box plot of reperfusion index against perfusion thresholds for each map. Reperfusion index measured by the restoration of the Tmax prolonged regions (a), by the restoration of the MTT prolonged regions (b), by the restoration of the CBF abnormality regions (c), and by the restoration of the CBV abnormality regions (d).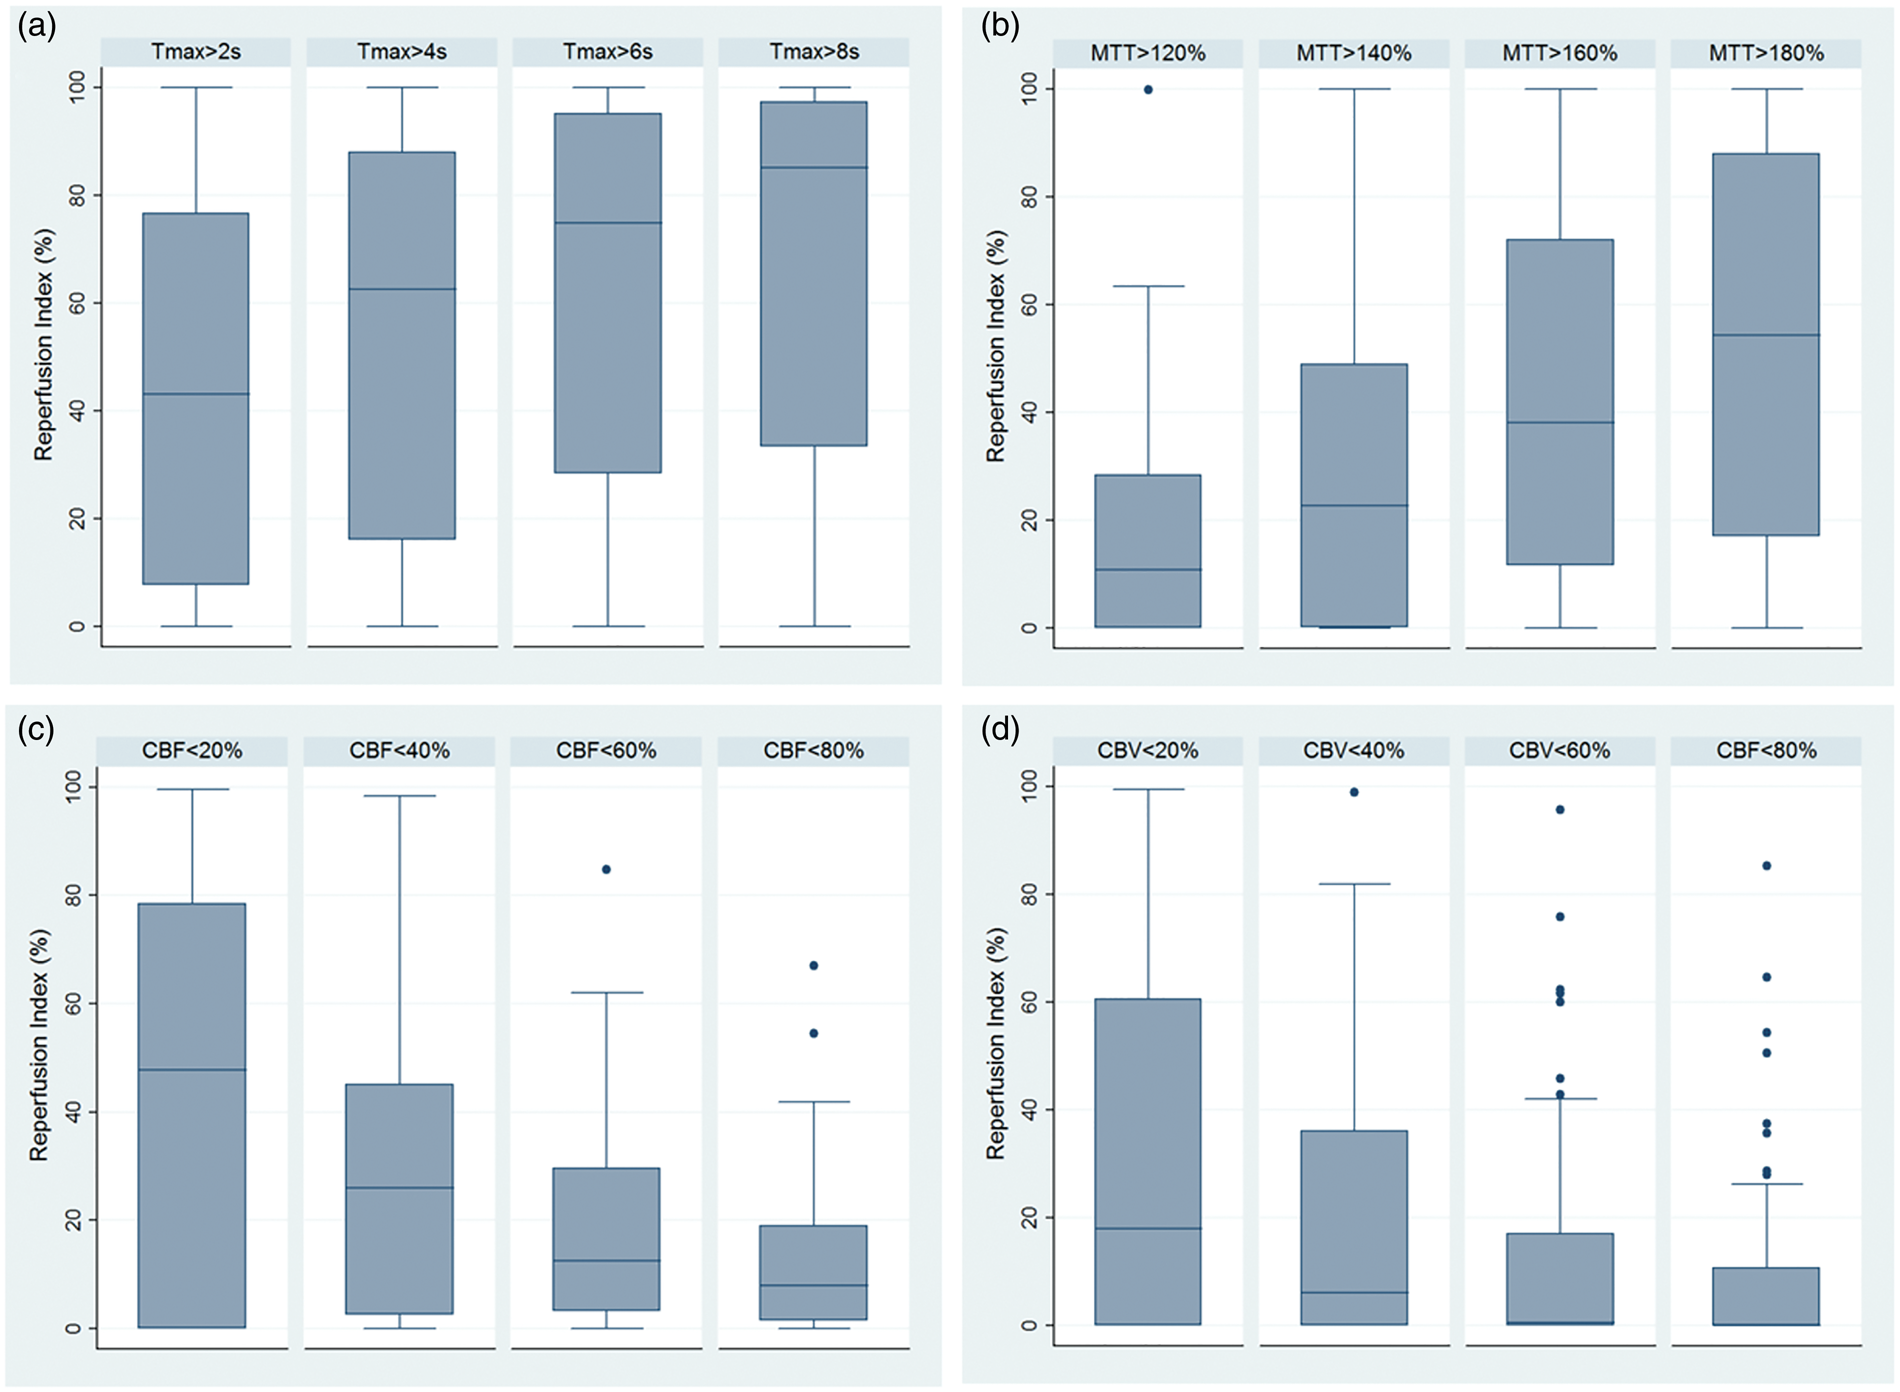
Receiver operator characteristic (ROC) analysis was used to measure the sensitivity and specificity of reperfusion index as well as recanalization in predicting the binary clinical outcome. The sensitivity and specificity were summarized by ROC curves (Figure 3(b)). The reperfusion index defined by Tmax>2 s, by Tmax>6 s, and by MTT>145% resulted in three separate ROC curves, and the ROC curves were analysed in the following three aspects: First, area under the curve (AUC) was compared among the three ROC curves as well as compared to the AUC of recanalization. The AUC comparison was done by a statistical method introduced by Pepe et al.,
21
using bootstrapping to derive standard error and confidence interval (CI) of the AUC difference and a Wald statistic, dividing the AUC difference by its standard error, is compared with the standard normal distribution to report a p value. Second, for each ROC curve, sensitivity and specificity were also calculated by Youden Index: Youden Index=(sensitivity+specificity−1). The cut-point of reperfusion index and AOL score that achieved the maximum value of Youden Index was used to define successful reperfusion and successful recanalization, respectively. Third, the ROC curves were adjusted by either baseline NIHSS or acute core volume. Baseline NIHSS or acute core volume measures stroke severity, which may be a confounding factor that associates with both the reperfusion index and the clinical outcome.22,23 ROC curves were adjusted by an approach introduced by Janes et al.
24
Comparison of the reperfusion index measured by Tmax>6 s, by Tmax>2 s, and by MTT>145%. (a) Box plot shows that reperfusion index of the ischemic region measured by Tmax>6 s has higher value than that by Tmax>2 s and by MTT>145%. (b) ROC analysis shows that reperfusion index measured by Tmax>6 s has larger AUC than Tmax>2 s and MTT>145% measurement in predicting good clinical outcome (mRS of 0–2). Reperfusion of the Tmax>6 s region also has larger AUC than recanalization.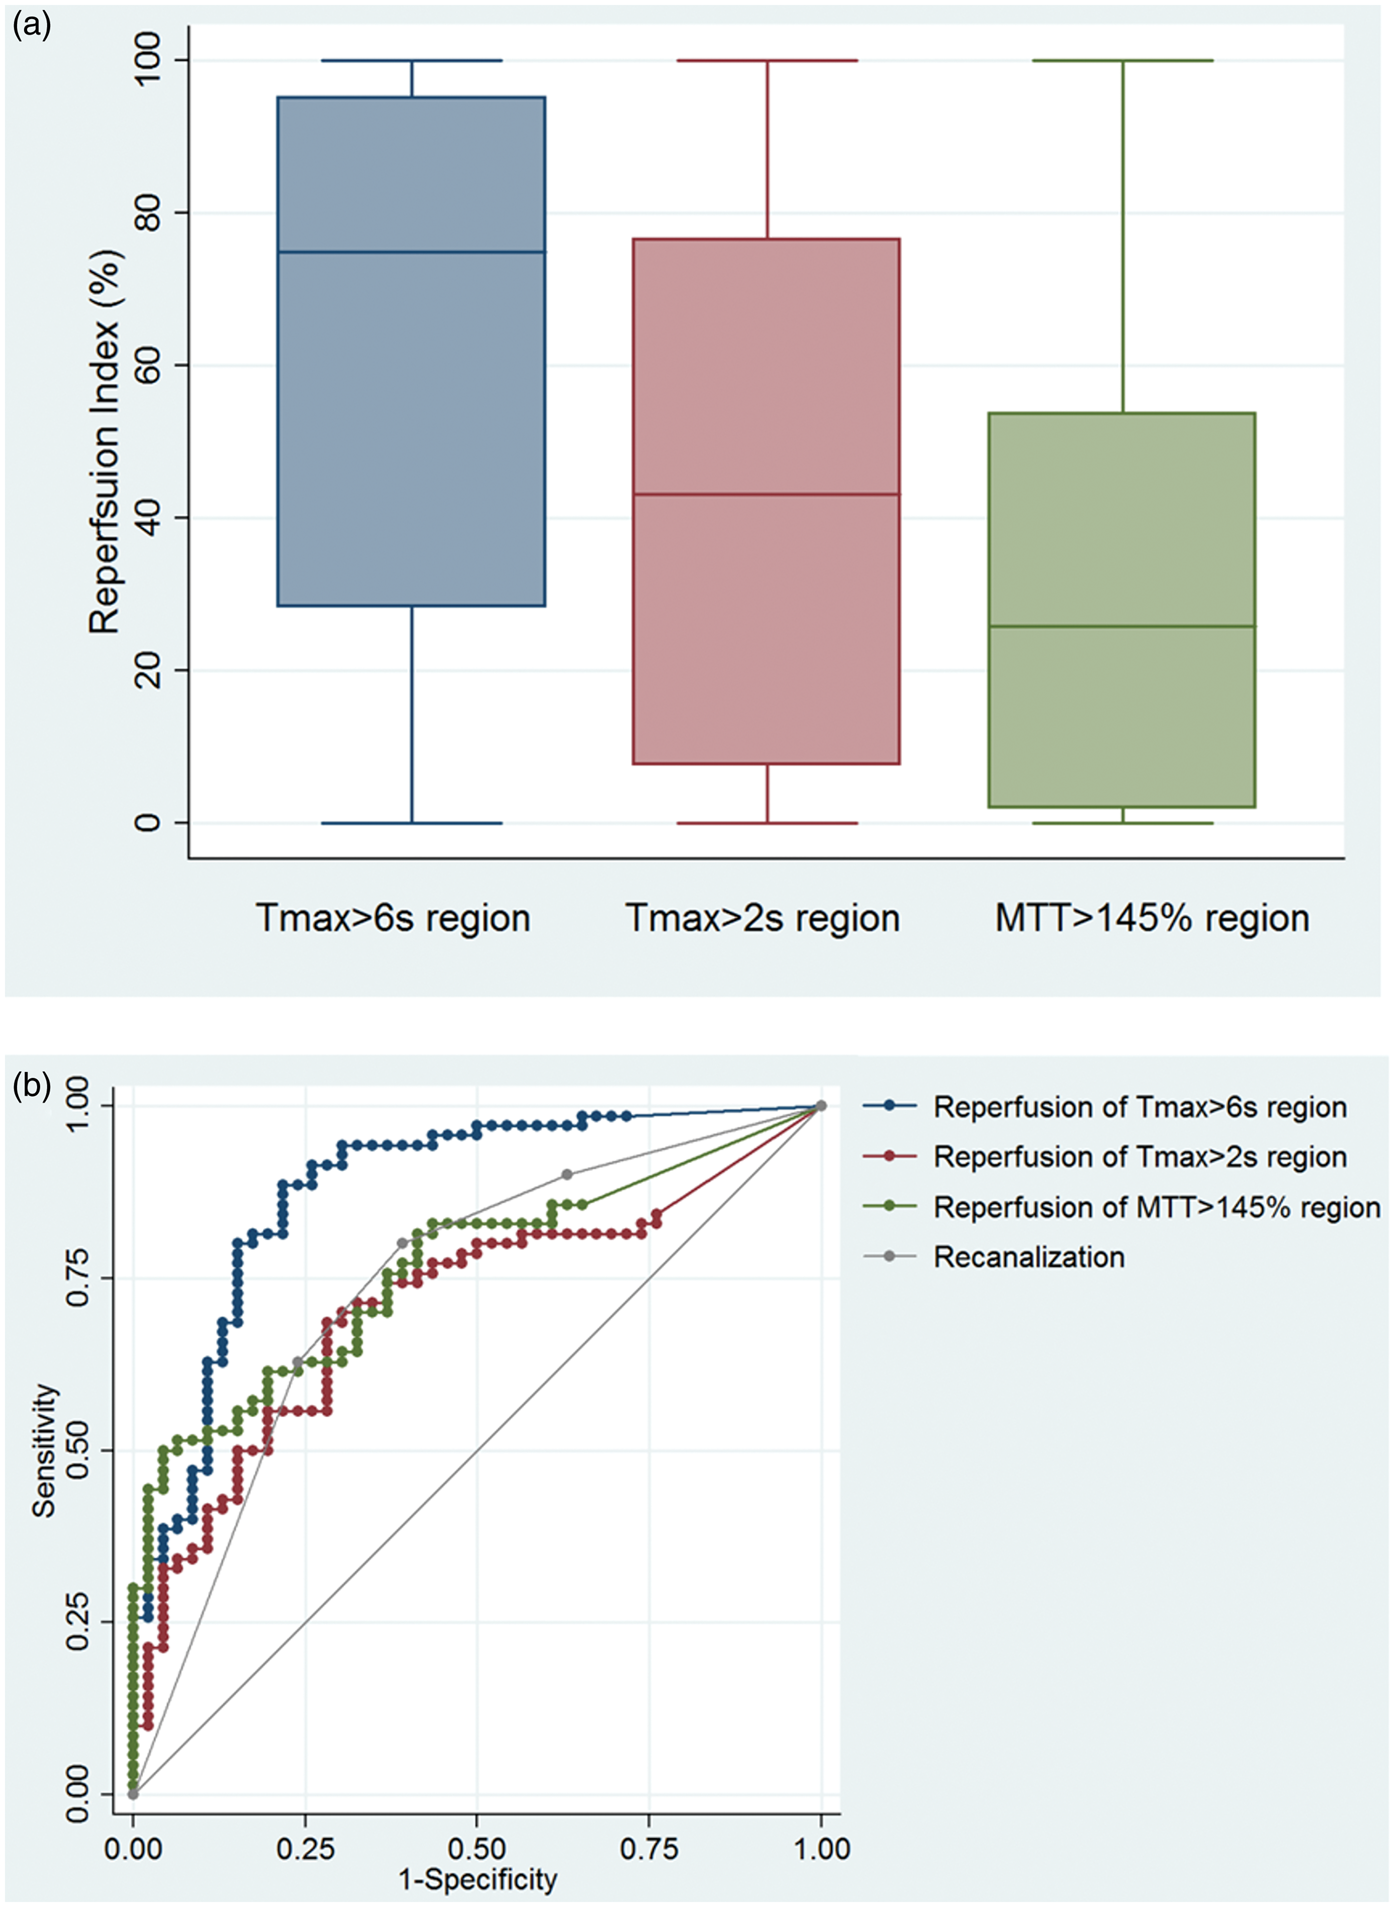
Simple linear regression was used to assess each reperfusion index (or recanalization) in predicting infarct growth. R square of the regression model was used to compare the prognostic value of reperfusion indexes measured by different threshold, and to compare reperfusion index and recanalization. All the analysis was done on STATA 13.0, with CI set at 95% and significant level set at 0.05.
Results
Patients
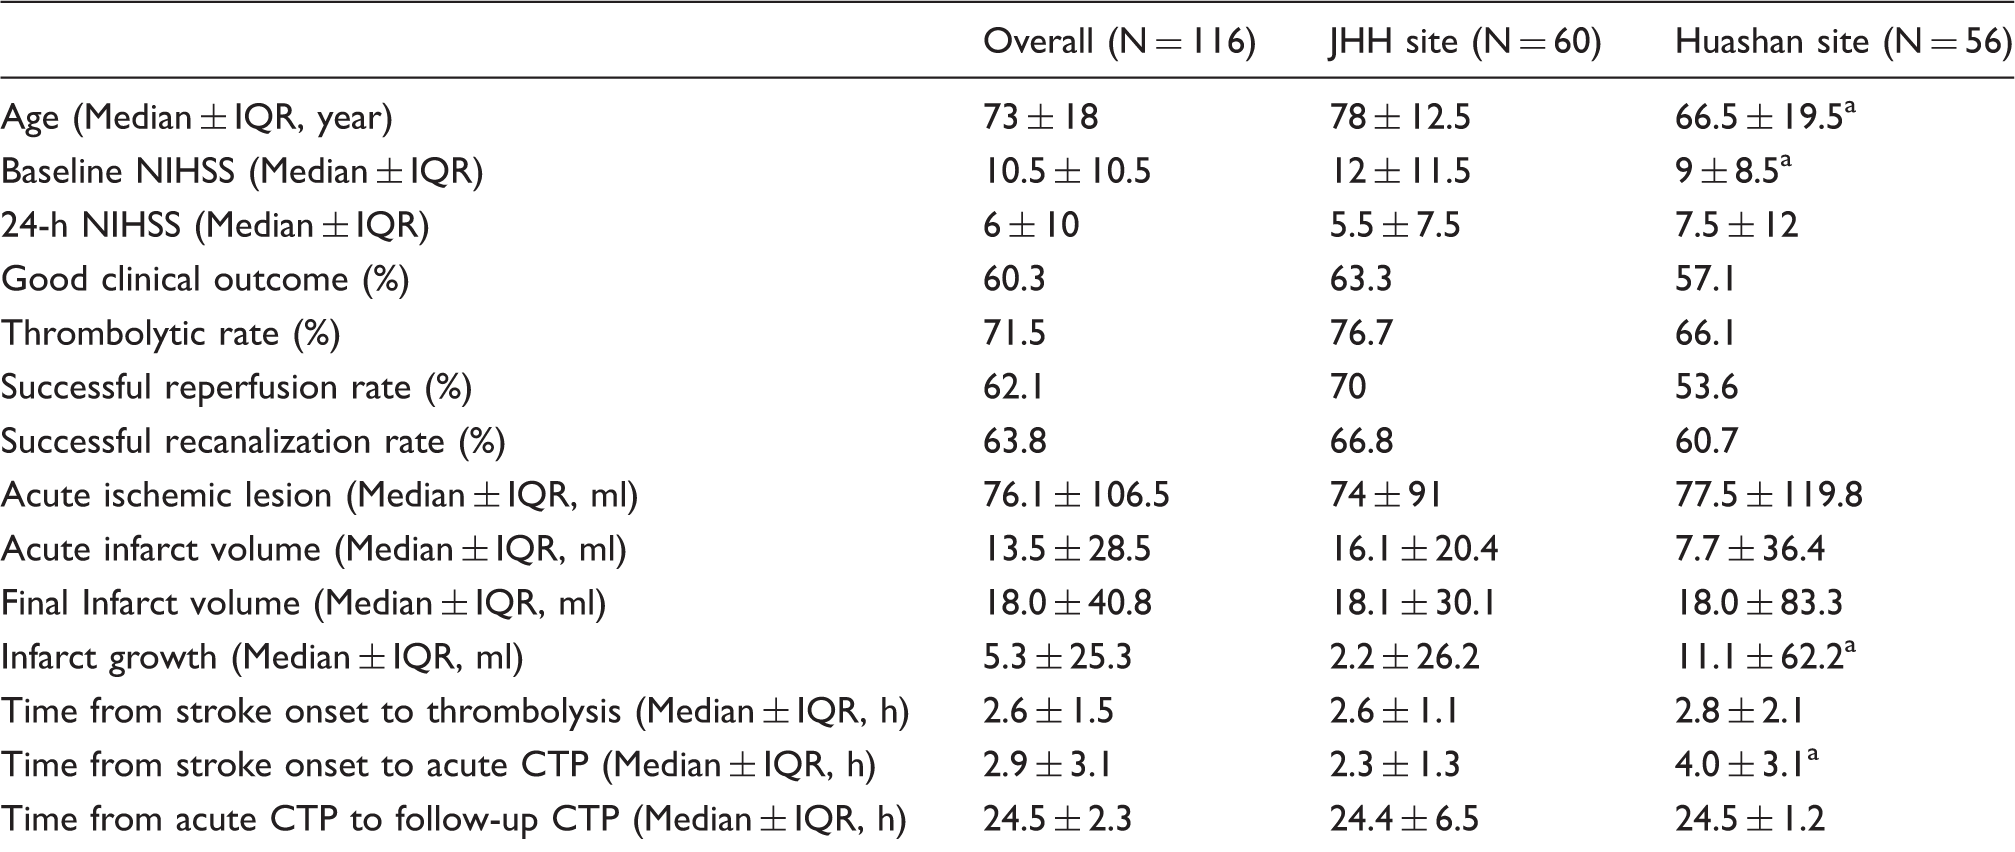
Between June 2011 and April 2014, 78 patients received acute and 24-h multi-modal CT scanning in John Hunter Hospital, and 101 patients had acute and 24-h multi-modal CT in Huashan Hospital. In each hospital, the CTP data were acquired using the same scanner for the study period. Of the 179 patients, 116 patients were eligible for current study (60 from John Hunter Hospital and 56 from Huashan Hospital). The patient selection process is summarized in Figure 4 and patient characteristics are summarized in Table 1. Noticeably, patients with or without thrombolytic treatment were both included in this study. Of the 116 patient, 83 received thrombolytic treatment (all of which received intravenous thrombolysis since intra-arterial thrombectomy was not available during the study period), resulting in a high thrombolysis rate of 71.5%. A sub-study was performed for the group of patients receiving thrombolytic treatment, results of which are summarized in the supplemental material.
Flow diagram of the patient selection process. Patient characteristics. IQR: inter-quantile range; CTP: computed tomography perfusion; CBF: cerebral blood flow; NCCT: non-contrast computed tomography. Note: NIHSS indicates the National Institutes of Health Stroke Scale; good clinical outcome is defined by modified Rankin Scale of 0–2 at 90 days; acute ischemic lesion and acute infarct volume are defined by Tmax>6 s and by CBF<30% respectively on acute CTP; successful reperfusion is defined by >60% reperfusion of the acute ischemic lesion; final infarct volume is derived from follow-up NCCT. p value < 0.05 for the comparison of the two sites.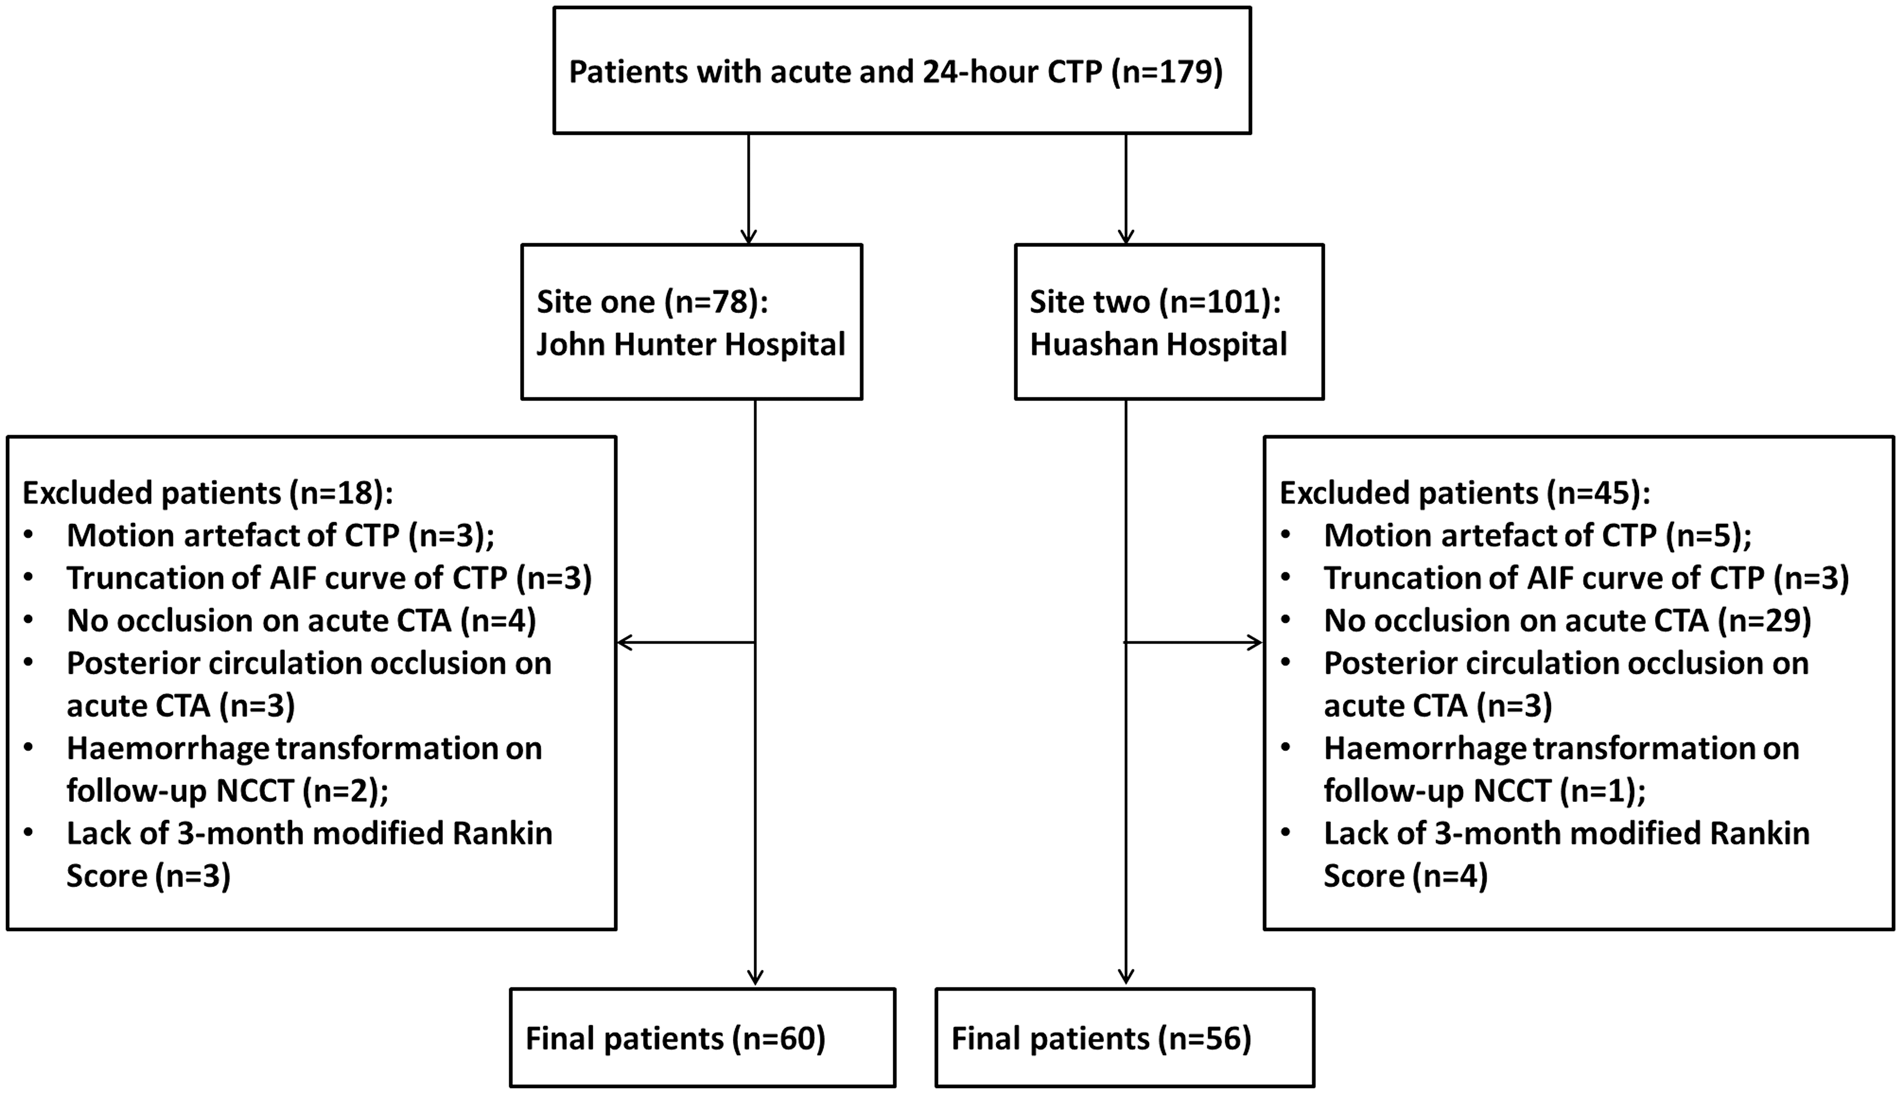
Cerebral perfusion values on acute CTP and 24-h CTP
Cerebral perfusion values of the non-ischemic hemisphere.
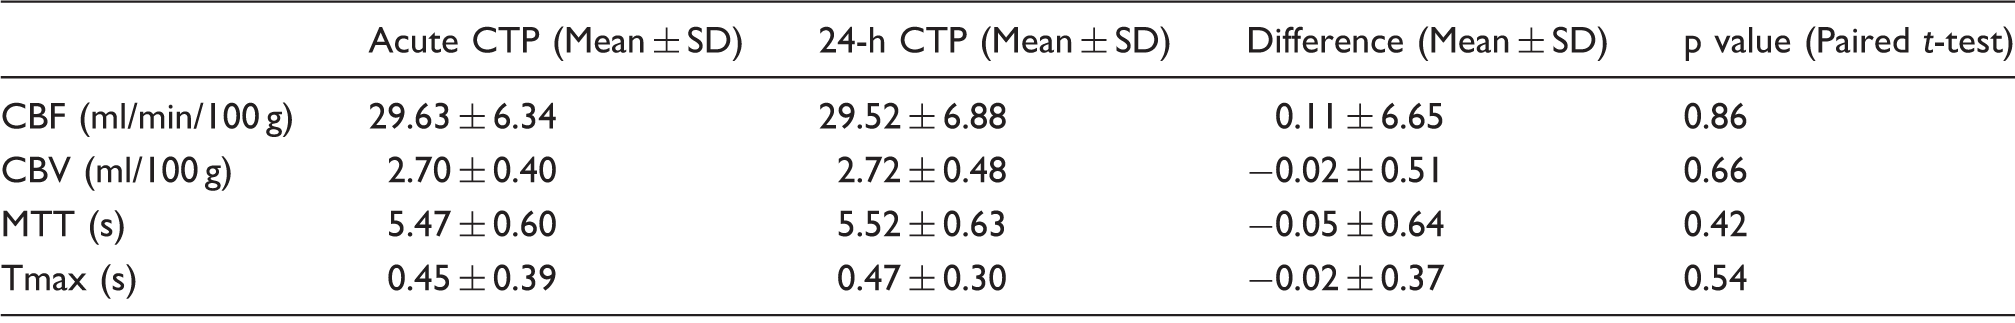
CTP: computed tomography perfusion; CBF: cerebral blood flow; CBV: cerebral blood volume; MTT: mean transit time.
Variation of reperfusion index across perfusion thresholds
The value of reperfusion index varied when the index was calculated by different ischemic definitions (p < 0.001, Figure 2). On Tmax and MTT maps, with the prolongation of perfusion threshold, the acute ischemic region reduced (Figure 1) and reperfusion index of the ischemic region increased (p < 0.001, Figure 2(a) and (b)). On CBF and CBV maps, with the drop of perfusion threshold, the acute ischemic region reduced (Figure 1) and the reperfusion index of the ischemic region increased (p < 0.001, Figure 2(c) and (d)).
For the same group of patients, reperfusion indexes measured by the restoration of Tmax>6 s region, Tmax>2 s region, and MTT>145% region were 75% (±67%), 43% (±69%), and 26% (±52%), respectively (Figure 3(a)). The ischemic region defined by Tmax>6 s resulted in a significantly higher value of reperfusion index than the Tmax>2 s region (p < 0.001) or the MTT>145% region (p < 0.001).
Variation of reperfusion index in predicting good clinical outcome
ROC analysis of reperfusion index in predicting good clinical outcome.
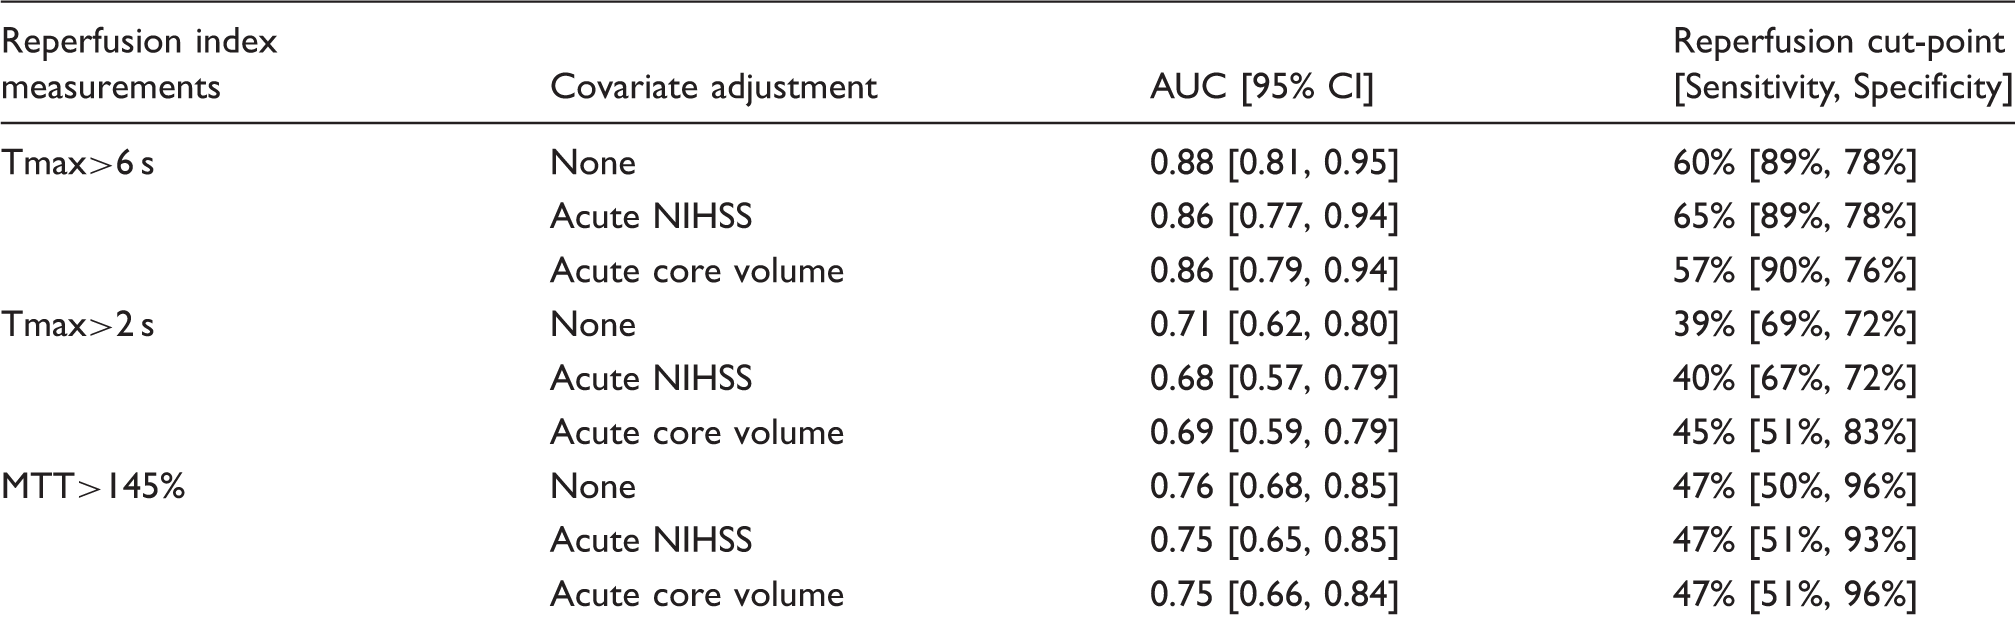
AUC: area under the curve; NIHSS: National Institutes of Health Stroke Scale; MTT: mean transit time.
Note: Good clinical outcome is defined by modified Rankin Scale of 0–2 at 90 days.
Among the three reperfusion measurements to predict clinical outcome, only reperfusion of the Tmax>6 s region resulted in a larger AUC than recanalization of the occluded artery (AUC difference=0.14 [0.05, 0.23], p = 0.002, Figure 3(b)). Reperfusion index calculated from the Tmax>2 s or the MTT>145% region, on the other hand, was not significantly different to recanalization in predicting good clinical outcome (AUC difference=−0.03 [−0.13, 0.07] and 0.03 [−0.08, 0.13] respectively, p = 0.58 and 0.63, respectively).
Reperfusion indexes measured by Tmax>6 s, Tmax>2 s, and MTT>145% also differed in the cut-point for successful reperfusion (Table 3). The cut-point of reperfusion index that resulted in the highest Youden Index was 60% for Tmax>6 s region, 39% for Tmax>2 s region, and 47% for MTT>145% region. Successful reperfusion of the Tmax>6 s region (over 60%) had sensitivity of 89% and specificity of 78% in predicting good clinical outcome (Youden Index=0.67), whereas successful reperfusion of the Tmax>2 s region (over 39%) had sensitivity of 69% and specificity of 72% (Youden Index=0.41), and successful reperfusion of the MTT>145% region (over 47%) had sensitivity and specificity of 50% and 96% in predicting good clinical outcome (Youden Index=0.46). Only with the Tmax>6 s measurement, successful reperfusion resulted in both higher sensitivity and higher specificity than successful recanalization in predicting the clinical outcome. The AOL score of 2 achieved the highest Youden Index for recanalization (Youden Index=0.41), and successful recanalization (AOL≥2) had sensitivity of 80% and specificity of 61% in predicting good clinical outcome. Figure 5 presents a case achieving good clinical outcome with successful reperfusion but no recanalization of occluded artery.
A stroke case showing reperfusion is better than recanalization in predicting clinical outcome. Female, 31, admitted to John Hunter Hospital with baseline NIHSS 10. Acute brain scanning shows occlusion of middle cerebral artery (MCA, green arrow) on CTA and corresponding ischemic region on CTP (red area delineated by Tmax>6 s). 24-h scanning shows the persistence of occlusion on MCA (blue arrow), but the reduction of ischemic region on CTP. The patient has no occlusion recanalization but achieves 81.05% reperfusion. The good reperfusion explains the small infarction on 24-h NCCT (yellow circle). It also explains her clinical improvement at 24 h (NIHSS = 4) and good clinical outcome at 90 days (mRS = 1). CTP map is generated from standard SVD.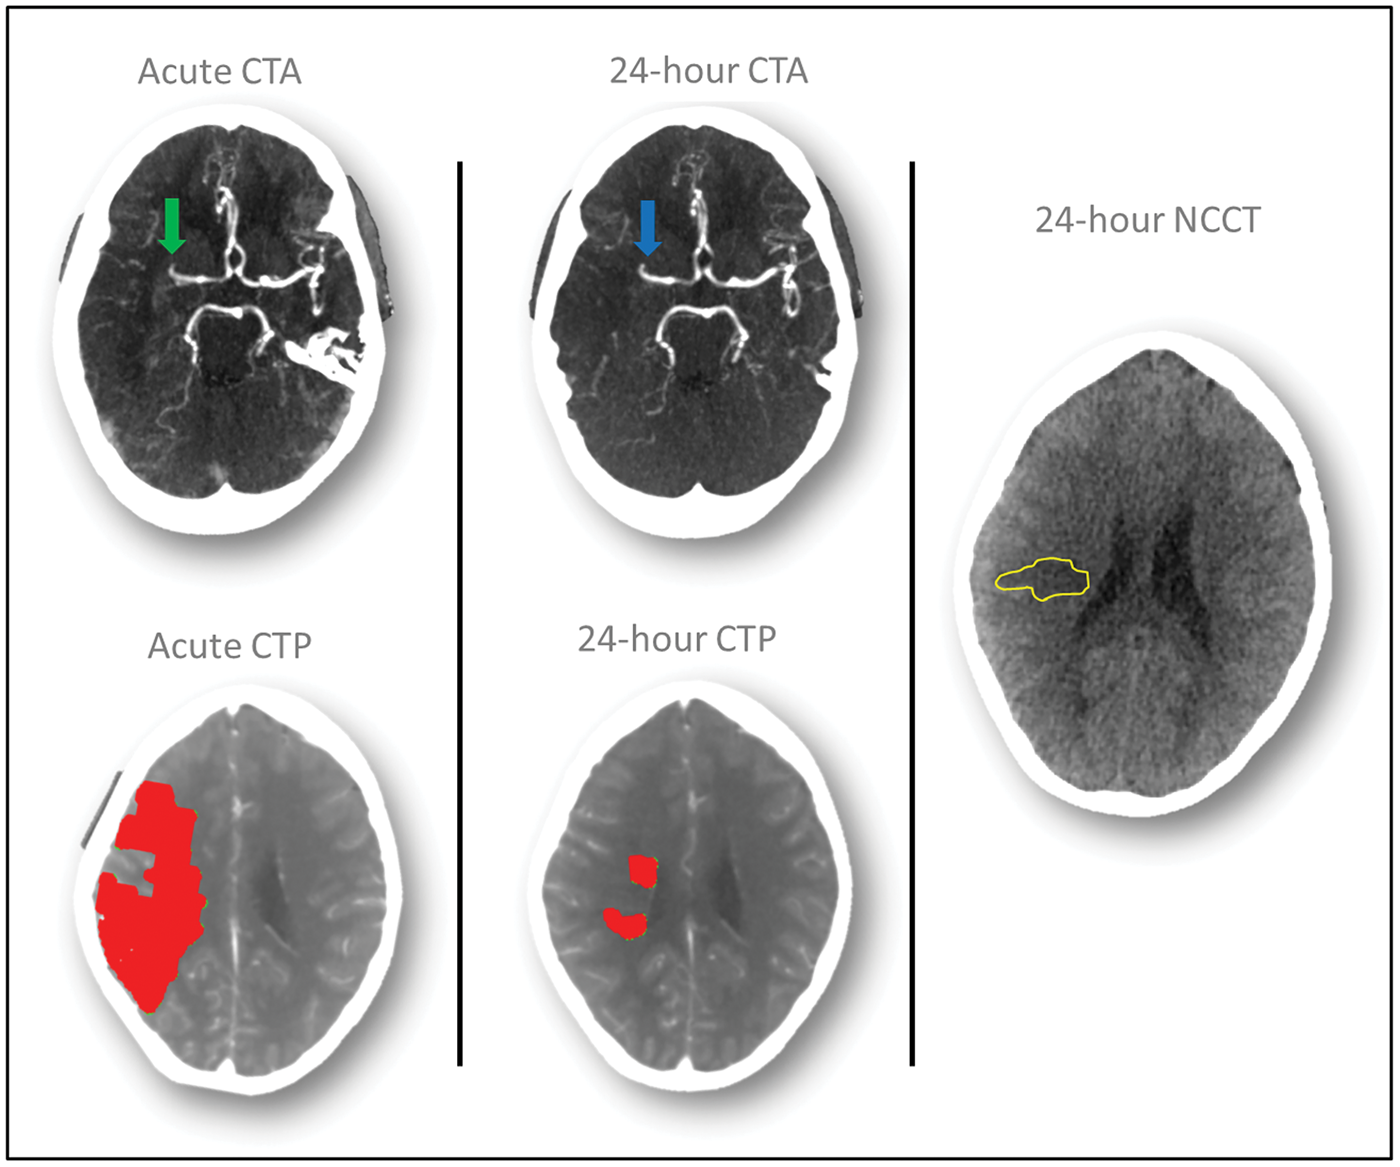
For reperfusion indexes measured by Tmax>6 s, Tmax>2 s, and MTT>145%, adjusting baseline NIHSS or acute core volume did not affect their predicting value in clinical outcome (Table 3). First, the AUC value of reperfusion indexes did change either with the adjustment of baseline NIHSS (p = 0.41 for reperfusion index measured by Tmax>6 s, 0.06 for Tmax>2 s measurement, and 0.32 for MTT>145% measurement) or with the adjustment of acute core volume (p = 0.46 for reperfusion index measured by Tmax>6 s, 0.24 for Tmax>2 s measurement, and 0.26 for MTT>145% measurement). Second, with the adjustment of either baseline NIHSS or acute core volume, reperfusion index of Tmax>6 s region maintained higher AUC than Tmax>2 s measurement (p < 0.001 for AUC comparison) and MTT>145% measurement (p = 0.03 for AUC comparison after NIHSS adjustment and 0.01 after core adjustment). Third, no substantial change was observed on the reperfusion cut-point either with baseline NIHSS adjustment or with acute core volume adjustment. The cut-point maintained to be around 60% for Tmax>6 s reperfusion measurement, around 40% for Tmax>2 s reperfusion measurement, and around 50% for reperfusion index measured by MTT>145% (Table 3).
Variation of reperfusion index in predicting infarct growth
Results of reperfusion index in predicting infarct growth were consistent with above results in predicting clinical outcome. Reperfusion index, measured by either Tmax>6 s, Tmax>2 s, or MTT>145%, predicted the infarct growth significantly (p < 0.001) in the simple linear regression model. However, the regression coefficient varied among the three reperfusion measurements: reperfusion of ischemic region, measured by Tmax>6 s, predicted the reduced infarct growth by 0.72 ml (p < 0.001), whereas reperfusion of the Tmax>2 s region and MTT>145% predicted the reduced infarct growth by 0.54 ml and 0.62 ml, respectively. More importantly, the predictive power varied among the three reperfusion measurements, with reperfusion index measured by Tmax>6 s having the highest R squared value (R2 = 0.25 for Tmax>6 s measurement, 0.13 for Tmax>2 s measurement, and 0.11 for MTT>145% measurement). Of the three reperfusion measurements, only reperfusion of the Tmax>6 s region had the R square value higher than recanalization in predicting infarct growth (R2 = 0.15 for recanalization).
Discussion
Reperfusion of the ischemic region has been found in previous studies to predict good outcome in stroke patients. However, different definitions have been used to delineate the ischemic region for the calculation of reperfusion index. This study confirms that the reperfusion index varies when calculated by different perfusion maps or perfusion thresholds.
Three different approaches have been used to define reperfusion in previous stroke trials: reperfusion of the Tmax>2 s region has been used in EPITHET 10 and DEFUSE, 11 reperfusion of the Tmax>6 s region has been used in DEFUSE-2 13 and EXTEND, 12 and reperfusion of the MTT>145% region has been used in DIAS 14 and TASTE. 15 Of the three approaches, our findings suggest that Tmax>6 s region should be used for reperfusion measurement in future stroke trials for its superior performance in predicting clinical outcome of ischemic stroke patients. The superior performance of Tmax>6 s could be explained by its accuracy in differentiating ischemic tissues to benign oligemia. Benign oligemia is the region of brain tissues exposed to mild hypoperfusion but does not contribute to clinical symptoms because it is too mild. 25 Therefore, reperfusion of benign oligemia tissues does not alter clinical outcome. Tmax with the threshold setting at 6 s has been found as the optimal perfusion threshold to delineate the ischemic region on magnetic resonance perfusion (MRP) 17 with a strong correlation to the ischemic definition on positron emission tomography (PET), 26 and the accuracy of Tmax>6 s in delineating the ischemic region on CTP has also been found in recent studies.24,20,27 Tmax>2 s or MTT >145%, on the other hand, has been found to overestimate the acute ischemic region,12,17 indicating the inclusion of benign oligemia in these regions.
Another evidence to support the reperfusion measurement using Tmax>6 s region is its superior performance in predicting infract growth. Tmax>6 s measurement, in comparison to Tmax>2 s and MTT>145%, has the highest predicting value in infarct growth. The underlying mechanism may be that within an ischemic region exist two types of tissues, salvageable and none-salvageable. 28 The salvageable tissues could be restored to normal function with restoration of blood supply (successful reperfusion); however, without reperfusion, the salvageable tissues would be recruited to non-salvageable area (infarct growth). Therefore, reperfusion determines the infarction growth (which has been proved by previous studies3,6) and the measurement capturing reperfusion information better, as the Tmax>6 s region in current study, would predict the infarct growth better. Noticeably, even with the Tmax>6 s measurement, reperfusion still results in relative low predictive value in infarct growth. This indicates infarct growth is a more complex process influenced by other clinical and pathological factors.
The main clinical application of this study is providing guidance on how best to assess reperfusion of the ischemic region. It not only recommends which perfusion map and threshold to select for reperfusion quantification, but also provides an answer to the question of which cut-point to use to define successful reperfusion. Various cut-points have been used to define successful reperfusion in clinical trials,10,11,13–15 ranging from 30% to 90%. Results of our study support the use of a 60% cut-point to define successful reperfusion of Tmax>6 s region, which is consistent with one previous report that Tmax>6 s region being reperfused over 59% as best distinguishing good clinical outcome. 3 Moreover, our study supports generalization of the reperfusion measurement to other stroke population with a different range of stroke severity, as the prognostic values of the reperfusion index and the reperfusion cut-point were not affected by baseline stroke severity. One explanation for the independence of reperfusion measurement from baseline stroke severity, especially from baseline core volume, is that reperfusion was defined by an index calculating the relative change (%) of ischemic volume with baseline ischemic region as reference. The approach using percentage index, compared to reperfusion measured by absolute volume change, would be less affected by the baseline stroke severity.
On the other hand, application of the current finding is limited to the perfusion imaging acquired by CT modality and post-processed by standard SVD. CTP and MRP are the two clinical available perfusion imaging modalities, of which, CTP has the advantage of being rapid and accessible in emergency rooms. 29 Due to this advantage, CTP is often chosen to measure the ischemic region of stroke patients on acute phase. On follow-up stage, to measure reperfusion of the ischemic region, the choice varies between CTP and MRP depending on hospitals and research groups. In this study, CTP was selected due to the consideration that reperfusion measured by the same imaging modality from acute phase to follow-up stage could increase the accuracy of measurement by limiting potential systematic errors brought by cross-modality technical differences. However, we are aware of the drawback of repeating CT scanning that doubles the radiation dose exposure and results in high potential contrast toxicity. MR perfusion imaging, if performed on follow-up stage, would have less radiation concerns. However, further study would be required to assess the reliability of cross-modality reperfusion measurement from acute CTP to follow-up MRP. Performance of reperfusion could also be different if CTP was post-processed by algorithms other than standard SVD. Standard SVD has been reported to be susceptible to the delay of contrast from the feeding artery to brain tissues, leading to the underestimation of CBF and overestimation of MTT, 30 Tmax generated from standard SVD has been reported to be affected by the delay effect as well. 31 Several algorithms have been developed to correct the delay effect, and the delay correction results in the change of perfusion value estimation.31–33 Therefore, it is reasonable to suspect that algorithm with delay correction might change the threshold of Tmax in measuring reperfusion index, and further study is required to investigate this.
There are two advantages of the present data over previous studies. The first one is using whole-brain CTP to calculate reperfusion index. In previous studies,3–5 reperfusion was assessed with limited-slice CTP that covers 20–40 mm on the axial plane. Limited slice coverage may lead to biased calculation of the reperfusion index. As the brain coverage is reduced, the full extent of the ischemic lesion is incompletely detected or even missed.14,15 Thus, subsequent reperfusion of the ischemic region would be overestimated if the ischemic lesion is missed on acute CTP, and underestimated if the ischemic lesion is missed on 24-h CTP. Therefore, measuring reperfusion on limited brain coverage of CTP may produce falsely high predictive values. By utilising whole-brain scanners in this study, such an error was avoided. Another advantage is taking potential bias in reperfusion measurement into consideration. Study of reperfusion requires multiple scans over a 24-h period that may introduce systematic bias caused by operator variability, minute acquisition changes, or patient related variation of the two time points. If the systematic bias was significant, it would lower the accuracy of reperfusion assessments. In this study, we evaluated the effect of such a bias by comparing perfusion value of the non-ischemic hemisphere between the time points. Noticeably, the CBF value measured by repeated CTP in present study, in comparison to that measured by repeated MR or repeated PET in previous studies,34,35 showed much lower test–retest variability (mean difference=0.11 ml/min/100 g). This indicates CTP, compared to MR and PET, might be a more reliable imaging modality to derive perfusion parameters and to quantify reperfusion.
There are limitations in this study. First, performance of other ischmeic thresholds, besides Tmax>2 s, Tmax>6 s, and MTT>145%, were not reported in predicting clinical outcome. This is because in the workstations of most radiology departments, Tmax>2 s, Tmax>6 s, and MTT>145% have been the main three thresholds used to define acute ischemic region with most commercial imaging software. Other perfusion thresholds, according to previous studies, either overestimate or underestimate the ischemic region and therefore are not commonly used in clinical practice. Second, the influence of variable time on reperfusion measurements was not assessed in current study. Time from imaging to reperfusion, rather than time from stroke onset to imaging, has been reported to affect the optimal perfusion threshold of ischemic region.36,37 It is therefore reasonable to assume measurements of reperfusion would be affected by the time from imaging to reperfusion as well. However, the exact time when reperfusion occurs was unknown for patients receiving intravenous treatment. The influence of time on reperfusion will be better assessed in future studies that recruit patients with intra-arterial treatment, allowing documentation of the exact reperfusion time. Another limitation of this study is the use of data from two sites. The two sites differ in the brain coverage and temporal resolution of CTP, which might be the covariates for reperfusion index in predicting good clinical outcome. Future study is required to look at how CTP acquisition differences affect calculation of the reperfusion index.
In addition, results of this study might be affected by selection bias. The first source of selection bias is from the exclusion of patients with posterior circulation stroke or haemorrhagic transformation. Exclusion of posterior circulation stroke was due to the consideration that cerebral perfusion from posterior circulation, compared to anterior circulation, might have a different perfusion threshold to define acute ischemic region on CTP. 38 Exclusion of haemorrhagic transformation was because it would increase difficulty to delineate final infarct volume accurately on NCCT. The accuracy of reperfusion measurement would be compromised if patients with posterior circulation stroke were included and the accuracy of measuring infarct growth would be compromised if patients with haemorrhagic transformation were included. Another source of selection bias comes from clinicians of the two sites when they made a decision on who should receive repeated CTP scanning. The high thrombolysis rate of current study indicates that clinicians are more likely to scan patients after they receive thrombolysis treatment to assess the effectiveness of the treatment, and reperfusion measurement is of more clinical interest on the patient group with thrombolytic treatment. Based on this observation, patients with thrombolytic treatment were analysed separately in the supplemental material, results of which also support the clinical application of Tmax>6 s in reperfusion measurement.
In conclusion, reperfusion measurement is recommended to be carried out on CTP using Tmax maps and a threshold setting of 6 s.
Footnotes
Funding
The author(s) disclosed receipt of the following financial support for the research, authorship, and/or publication of this article: The study was funded by a National Health and Medical Research Council (NHMRC) Partnership Project Grant (ID: 1013719).
Acknowledgements
None.
Declaration of conflicting interests
The author(s) declared no potential conflicts of interest with respect to the research, authorship, and/or publication of this article.
Authors’ contributions
Dr. Longting Lin has made a substantial contribution to the study concept and design, data acquisition, data analysis, and article drafting; Dr. Xin Cheng has made a substantial contribution to the data acquisition, and article revising; Dr. Andrew Bivard has made a substantial contribution to the study concept and design, data acquisition, and article revising; Prof. Christopher R. Levi has made a substantial contribution to the data acquisition, and article revising; Prof. Qiang Dong has made a substantial contribution to the data acquisition, and article revising; Prof. Mark W. Parsons has made a substantial contribution to the study concept and design, data acquisition, data analysis, and article revising.
References
Supplementary Material
Please find the following supplemental material available below.
For Open Access articles published under a Creative Commons License, all supplemental material carries the same license as the article it is associated with.
For non-Open Access articles published, all supplemental material carries a non-exclusive license, and permission requests for re-use of supplemental material or any part of supplemental material shall be sent directly to the copyright owner as specified in the copyright notice associated with the article.