
Abstract
Quantitative measurements of brain perfusion are influenced by perfusion-modifiers. Standardization of measurement conditions and correction for important modifiers is essential to improve accuracy and to facilitate the interpretation of perfusion-derived parameters. An extensive literature search was carried out for factors influencing quantitative measurements of perfusion in the human brain unrelated to medication use. A total of 58 perfusion modifiers were categorized into four groups. Several factors (e.g., caffeine, aging, and blood gases) were found to induce a considerable effect on brain perfusion that was consistent across different studies; for other factors, the modifying effect was found to be debatable, due to contradictory results or lack of evidence. Using the results of this review, we propose a standard operating procedure, based on practices already implemented in several research centers. Also, a theory of ‘deep MRI physiotyping’ is inferred from the combined knowledge of factors influencing brain perfusion as a strategy to reduce variance by taking both personal information and the presence or absence of perfusion modifiers into account. We hypothesize that this will allow to personalize the concept of normality, as well as to reach more rigorous and earlier diagnoses of brain disorders.
Introduction
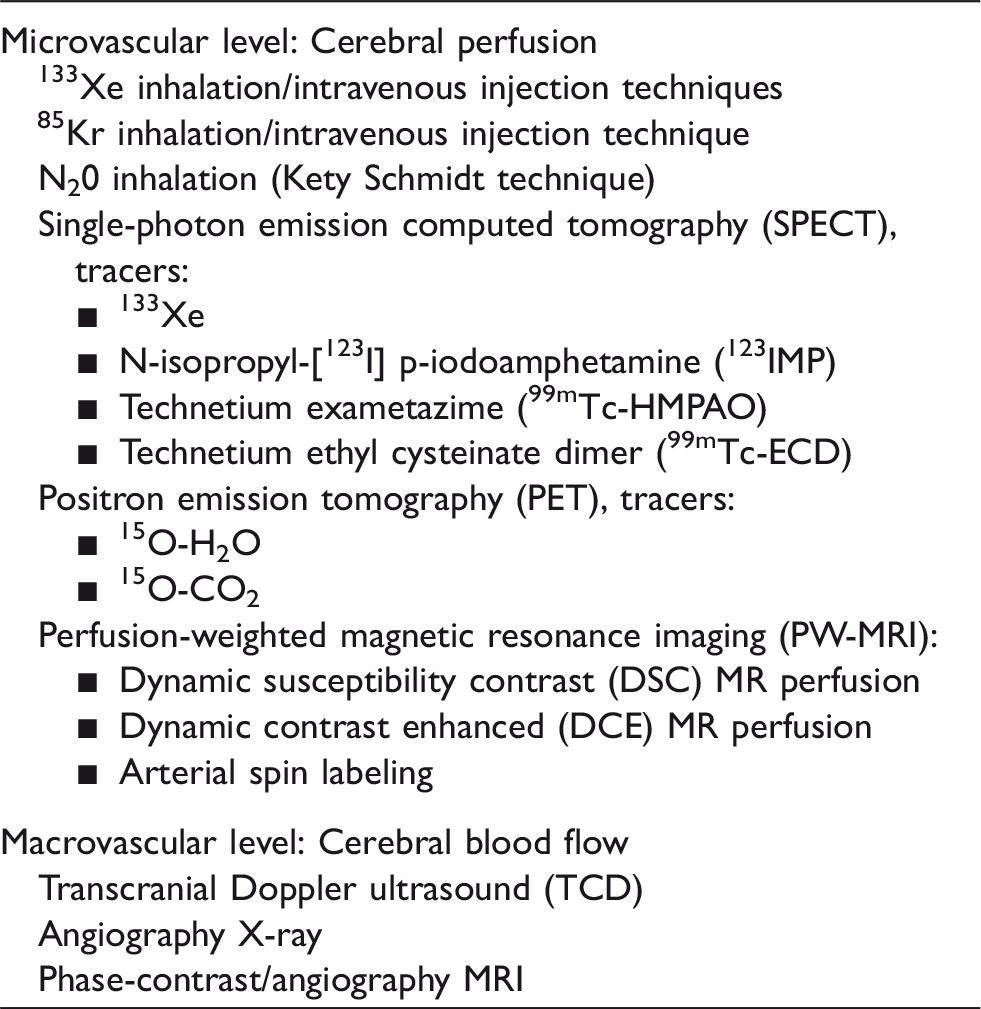
Techniques applied to measure cerebral perfusion and blood flow on microvascular and macrovascular level.
Regional distribution of cerebral perfusion and pattern recognition on perfusion maps may offer a major contribution to understand pathophysiological abnormalities, 4 but pathology at very early stages might be confounded by large individual variations in perfusion due to physiology, 5 aspects of lifestyle,6–8 dietary habits, 9 and medication use.10,11 Alternatively, physiological variations at the individual level can be mistaken as abnormalities when not properly taken into account. Unwanted variations of perfusion should be small compared to disease-related alterations if ASL-based perfusion measurements are to be used in individual patients. Researchers have tried to map the impact of many factors that modify cerebral perfusion and to investigate its complexity for decades. Given that ASL is increasingly being used in large population studies and in clinical radiology, the accuracy of perfusion measurements has gained a new relevance and hence the understanding of physiological variability is extremely important. The aim of this review is to systematically assess the magnitude of global and regional effects of perfusion-modifiers and to gain insight into the current level of knowledge represented by the literature. In this review, a perfusion modifier is defined as any normal physiological variation that gives rise to a change in cerebral perfusion. From this synthesis, several possible practical solutions are proposed to increase the precision of perfusion quantification.
Materials and methods
A comprehensive literature search for studies published between 1952 and August 2016 was carried out using the Web of Science and PubMed databases. First, an exploration of all possible terms related to cerebral perfusion modifiers was performed. Subsequently, those terms (e.g. caffeine, nicotine, age and gender) were used to further refine the search in combination with the terms: ‘cerebral blood flow’ and ‘cerebral perfusion’. Articles were selected on the basis of two main criteria: characteristics of the included subjects, and the applied techniques. Only English, original research full-text articles using non-anaesthetized healthy adults were included. For the modifier, ‘age – children’ studies including non-anaesthetized healthy children were also considered. The applied techniques to investigate cerebral perfusion and blood flow are summarized in Table 1. Studies investigating the effects of prescribed medicinal drugs on cerebral perfusion were excluded.
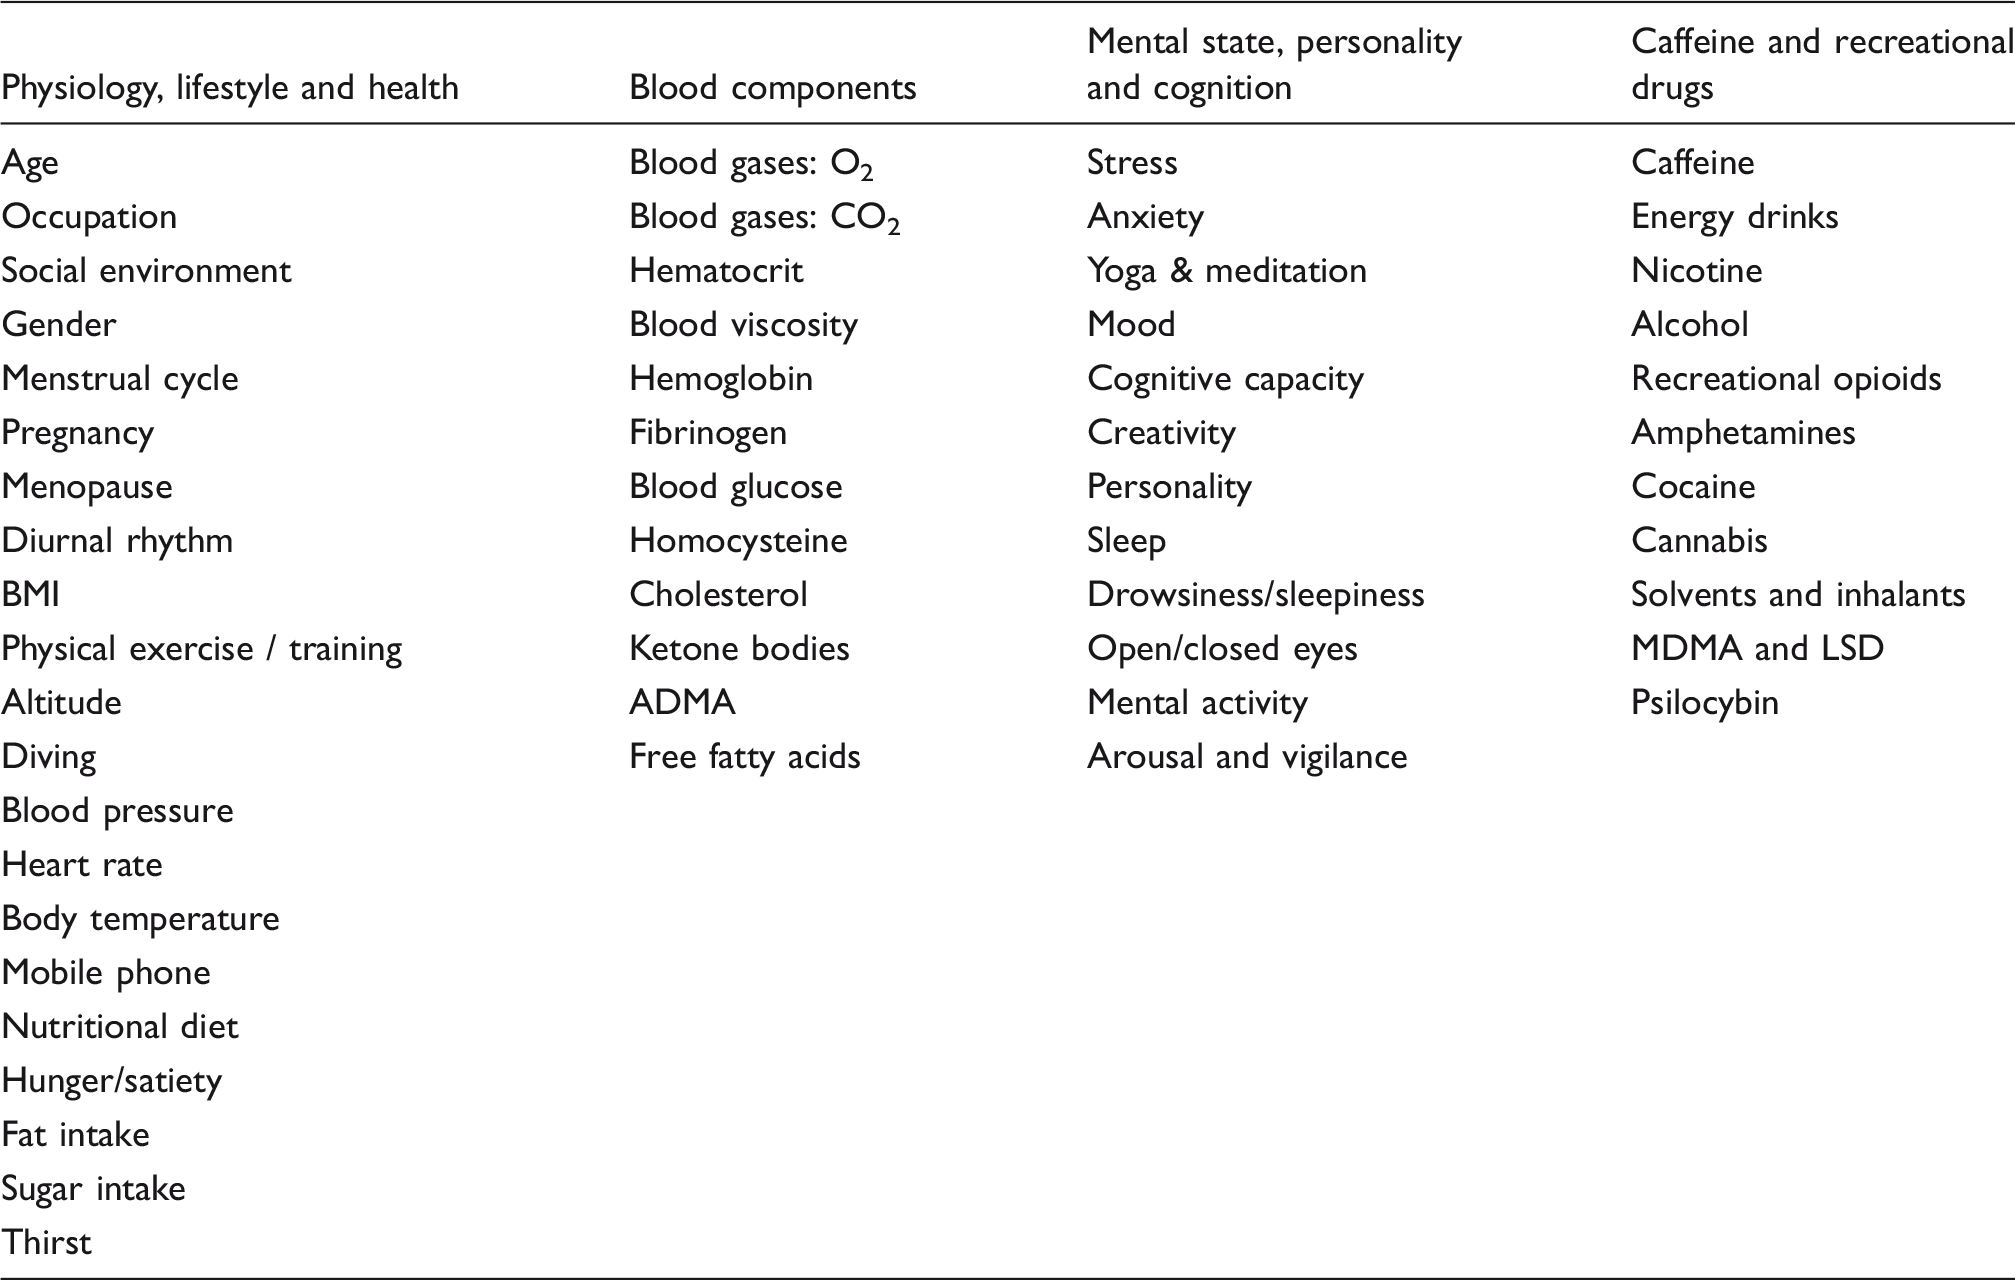
Summary of non-medication related perfusion-modifiers found in the literature, classified into four groups, including the number of studies presented in the Supplementary tables.
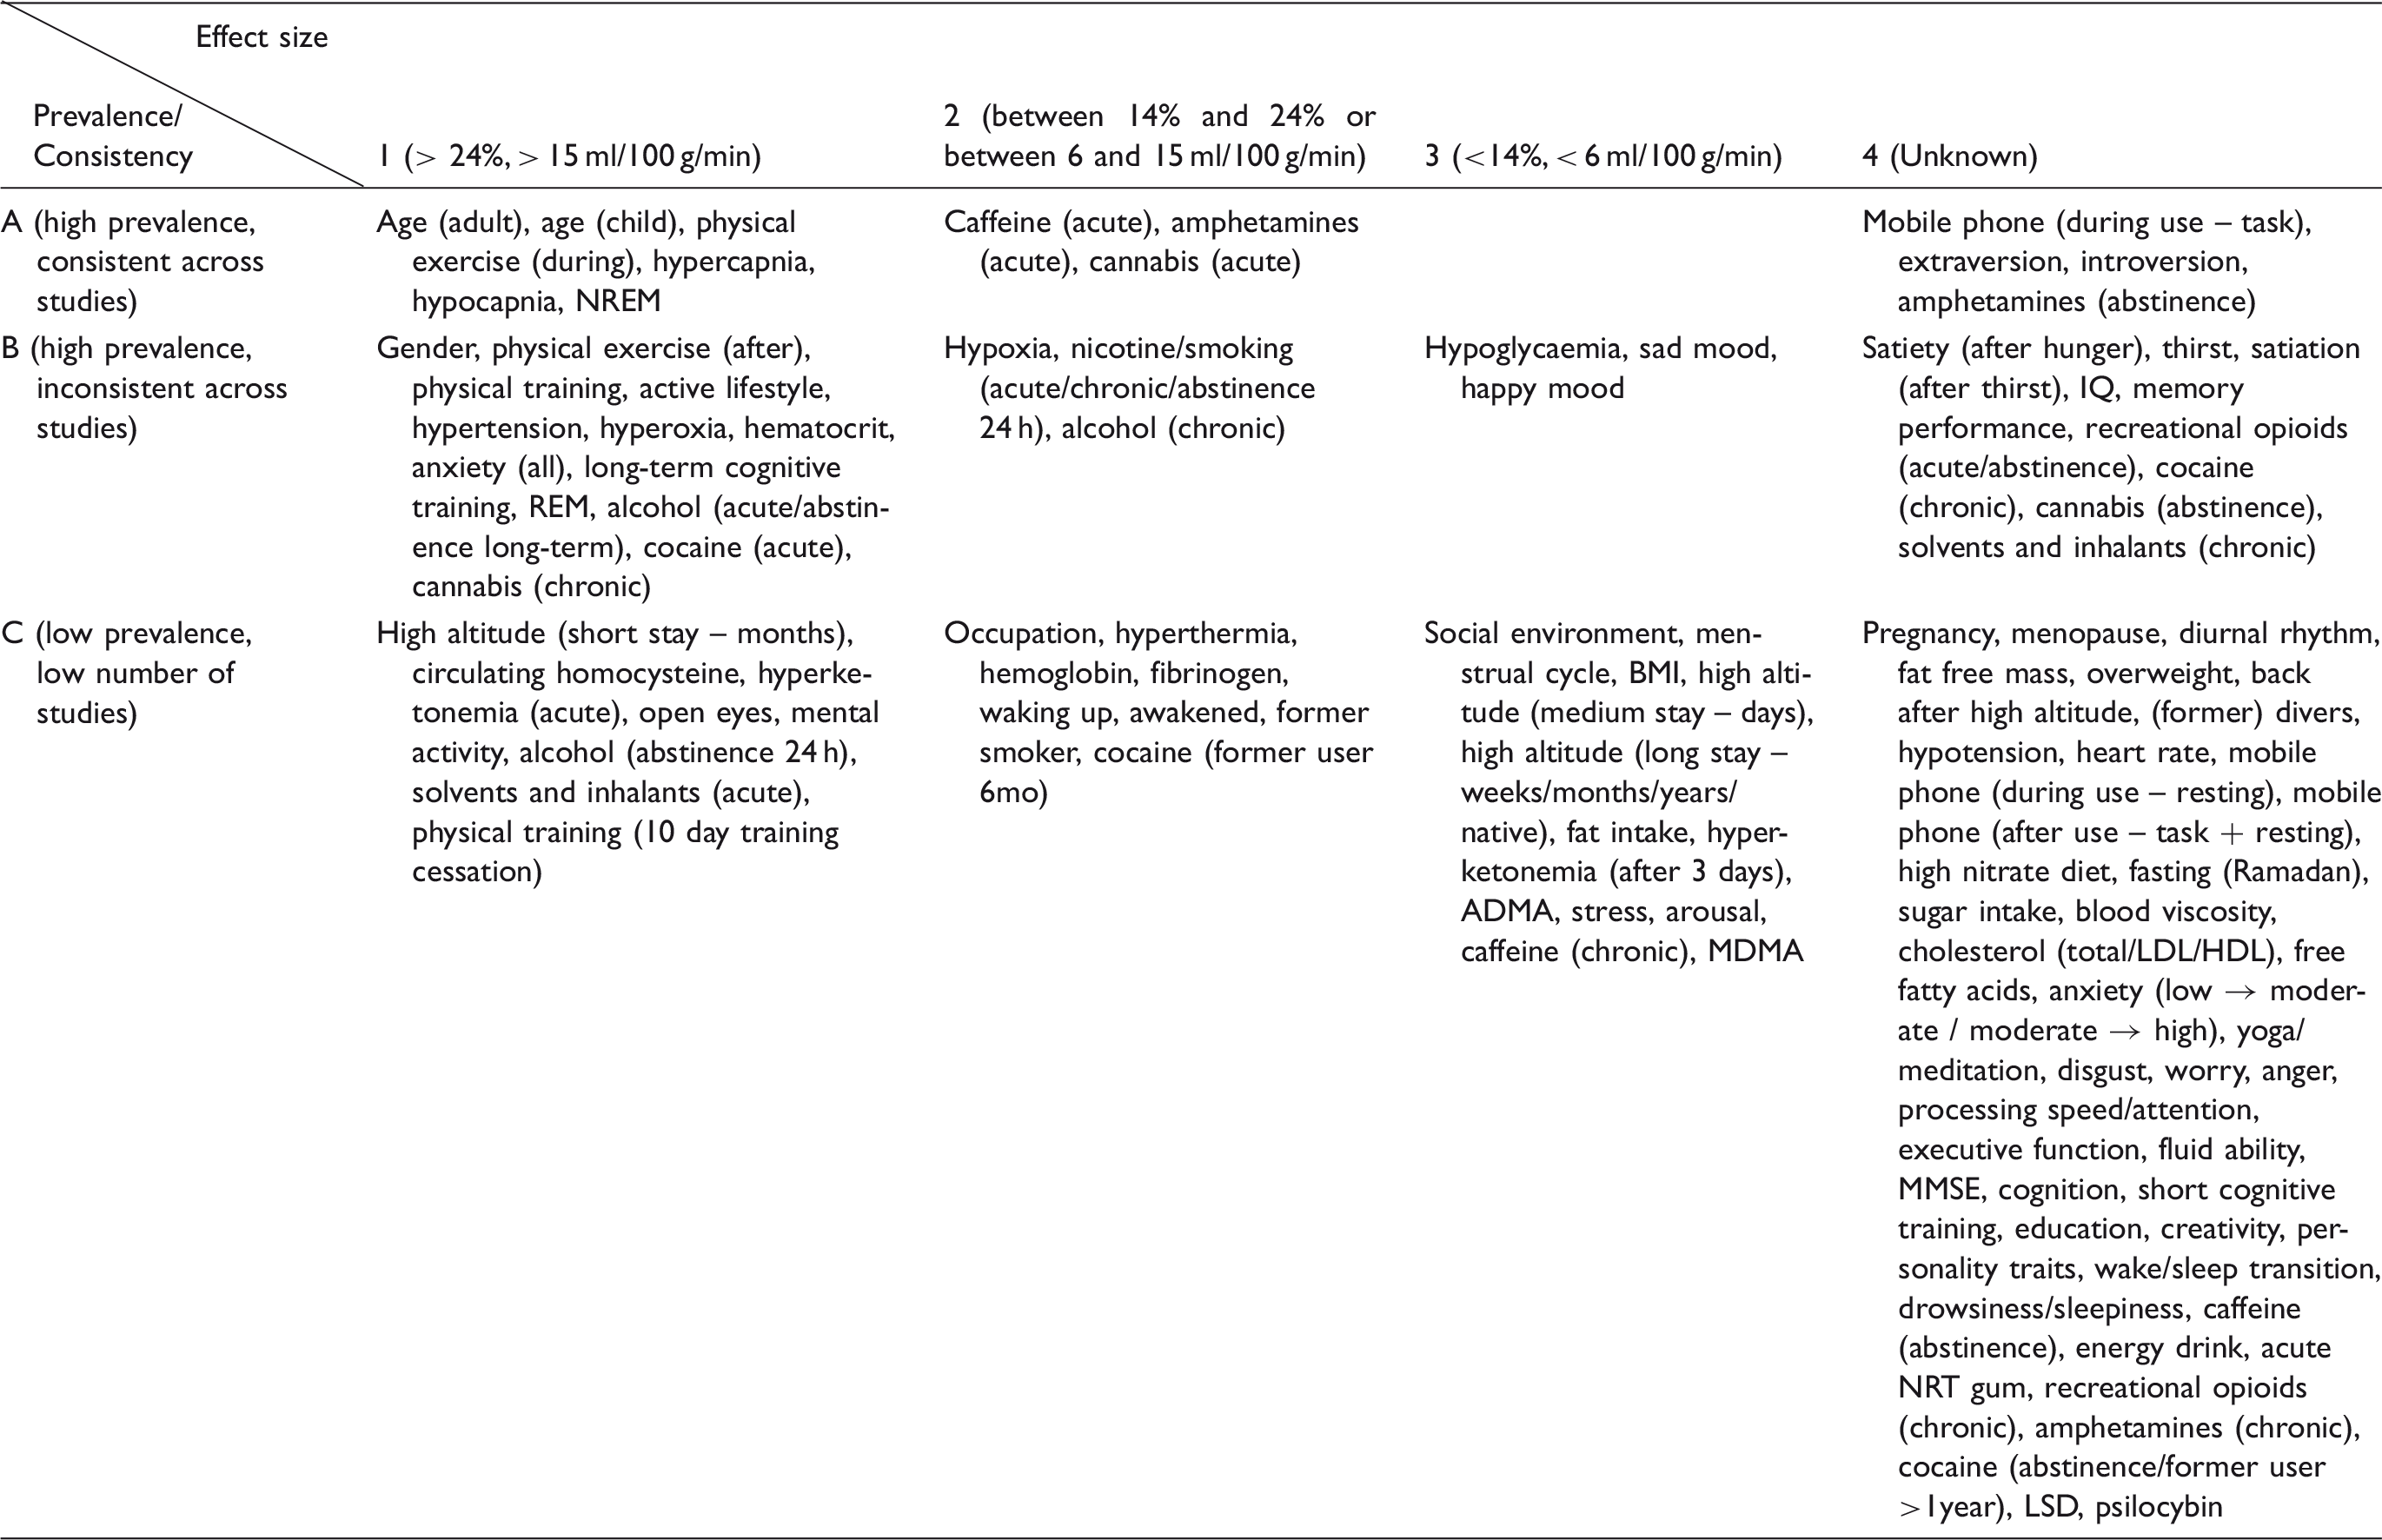
Using the three modifier criteria, an ordinal classification was devised and each factor was assigned a composite score consisting of a letter for quality – according to the methodology presented in Figure 1 – and a number for magnitude. The alphabetical order of letters reflects the number of studies in which the reported factor is mentioned (i.e. prevalence) as well as the consistency of the corresponding influence on brain perfusion (i.e. increase, decrease, no effect): (a) ‘high prevalence, consistent across studies’, (b) ‘high prevalence, inconsistent across studies’, (c) ‘low prevalence’. The numbers represent the reported magnitude of each perfusion-modifier effect: (1) ‘large effects’, (2) ‘intermediate effects’, (3) ‘small effects’, (4) ‘unknown’. Supplementary Tables 1 to 5 summarize results of all studies that were included in this review. Absolute (in ml/100 g/min) and relative measurements of perfusion in the brain were determined for each reported factor. For global perfusion, the mean and range of absolute and relative measurements reported across studies were calculated. For regional effects, only the range of values presented in the literature was taken into account. However, only studies including absolute or relative values were selected for the section of results of this review; studies with no such quantification information were only reported in the Supplementary Tables.
Schematic representation of the methodology applied to devise an ordinal classification of perfusion-modifiers based on the three modifier criteria.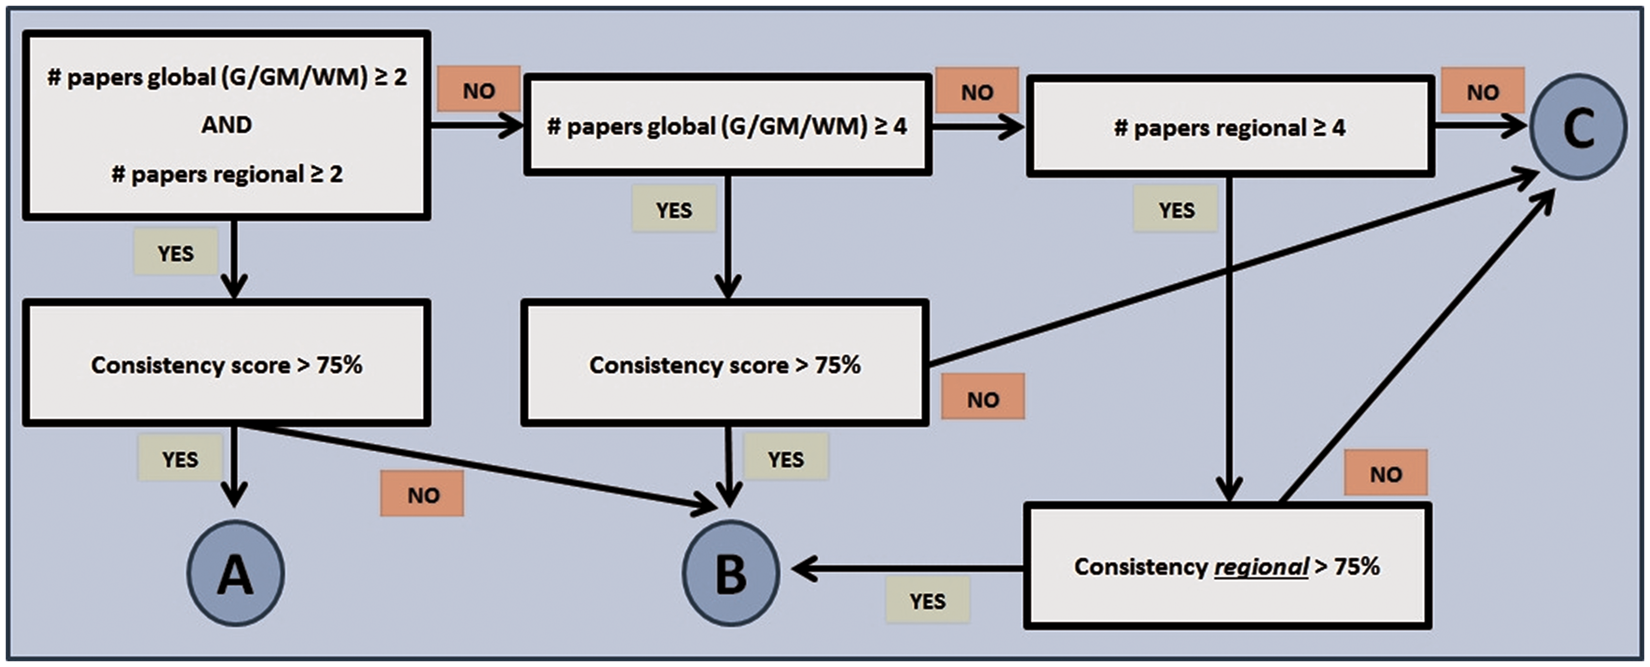
Based on these findings, we propose a suggestion – in the form of a standard operating procedure – to reduce the effect of physiological fluctuations on ASL and other perfusion measures, and to acquire physiological and cognitive data in a structured manner at the time of perfusion assessment. The standard operating procedure was constructed on the basis of procedures already used in four research centers associated with the European Cooperation in Science and Technology–Arterial spin labelling Initiative in Dementia (COST–AID Action BM1103).
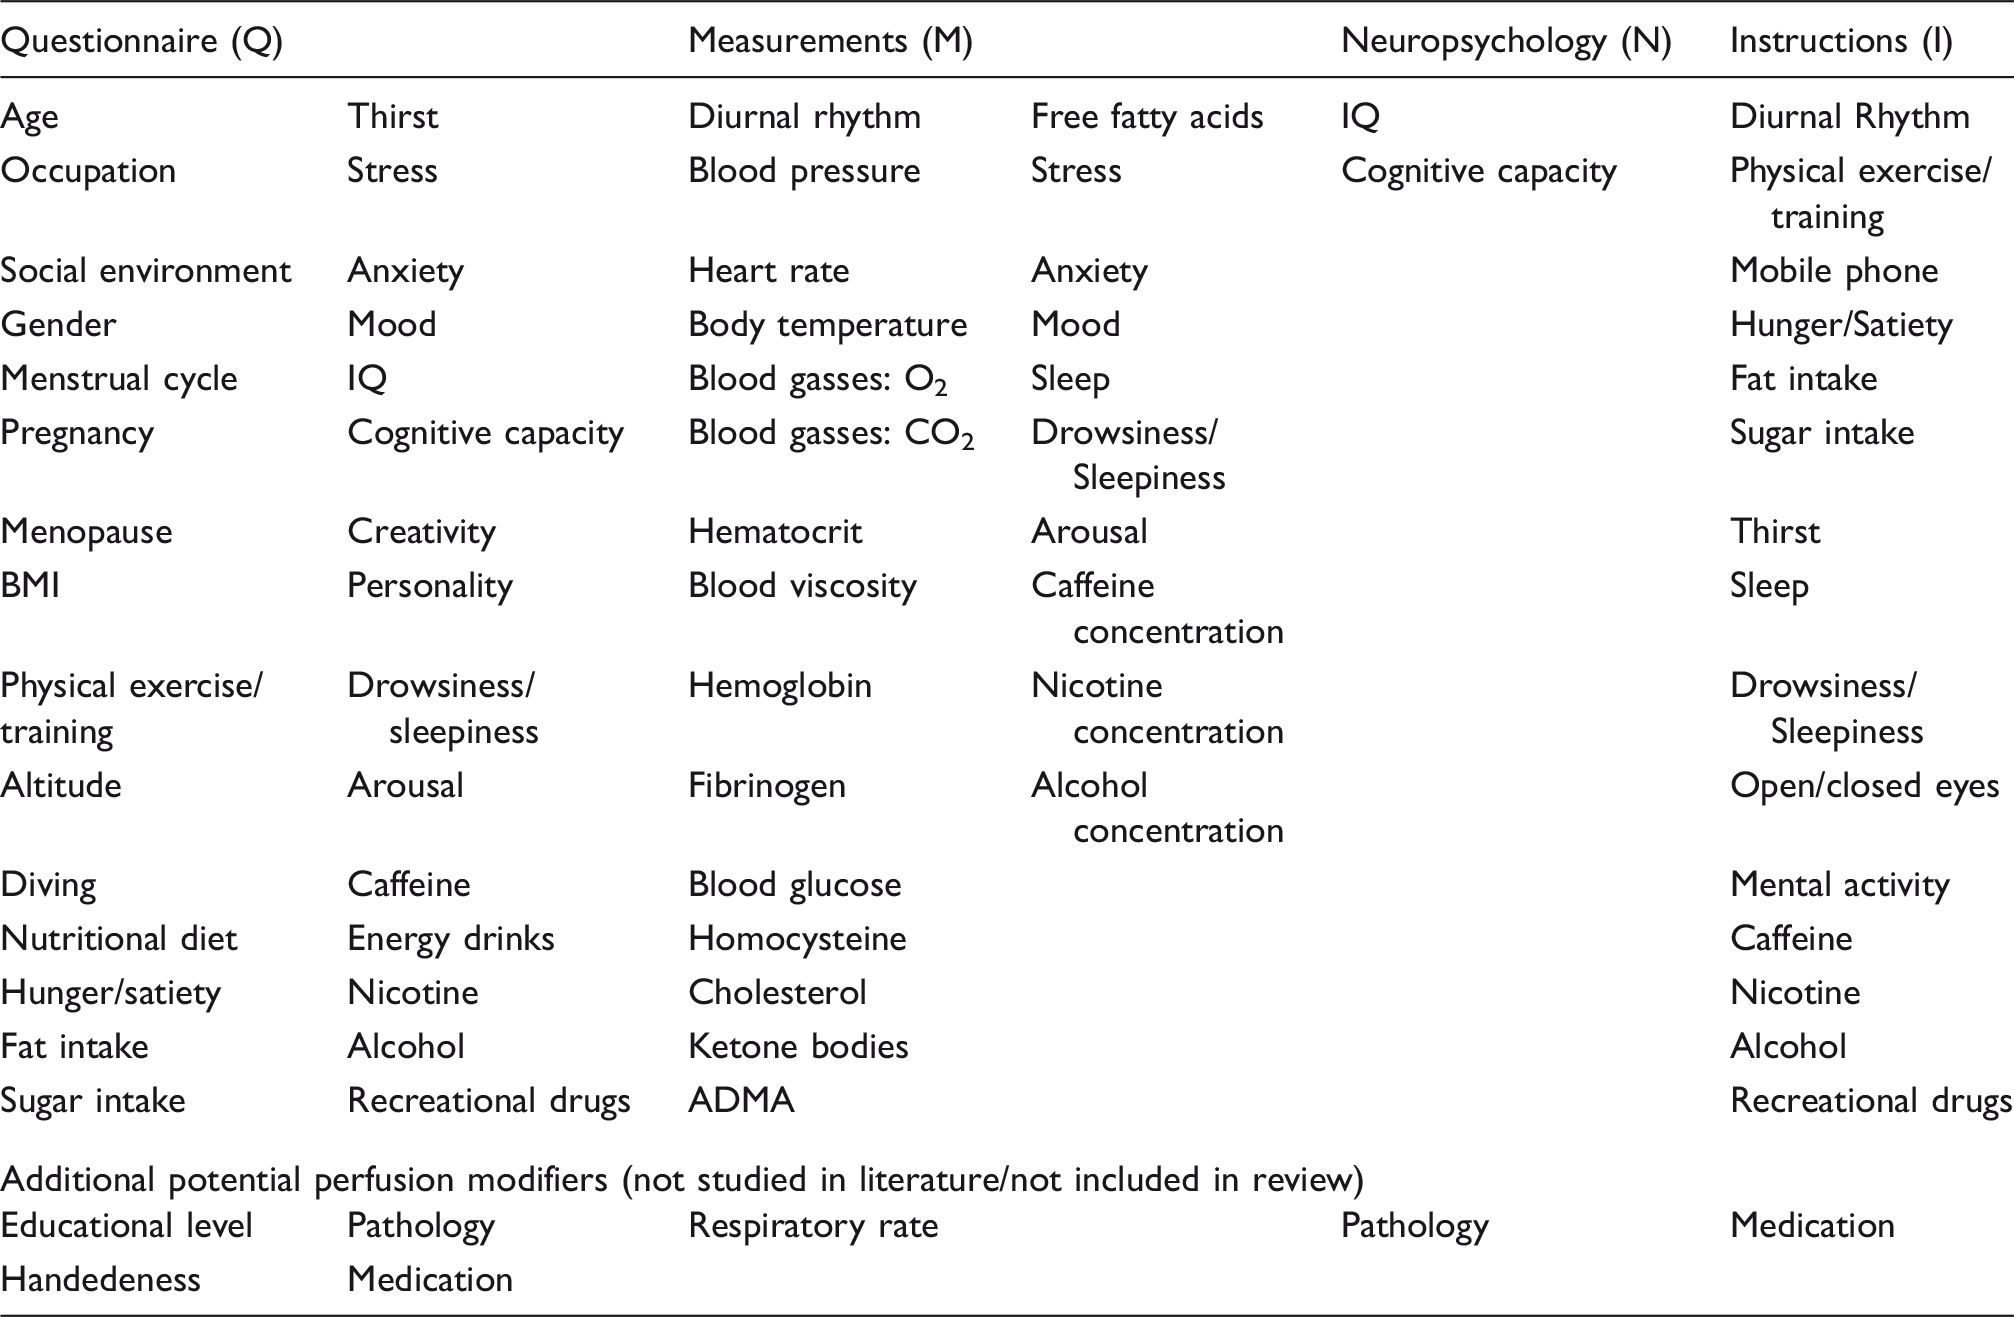
Results
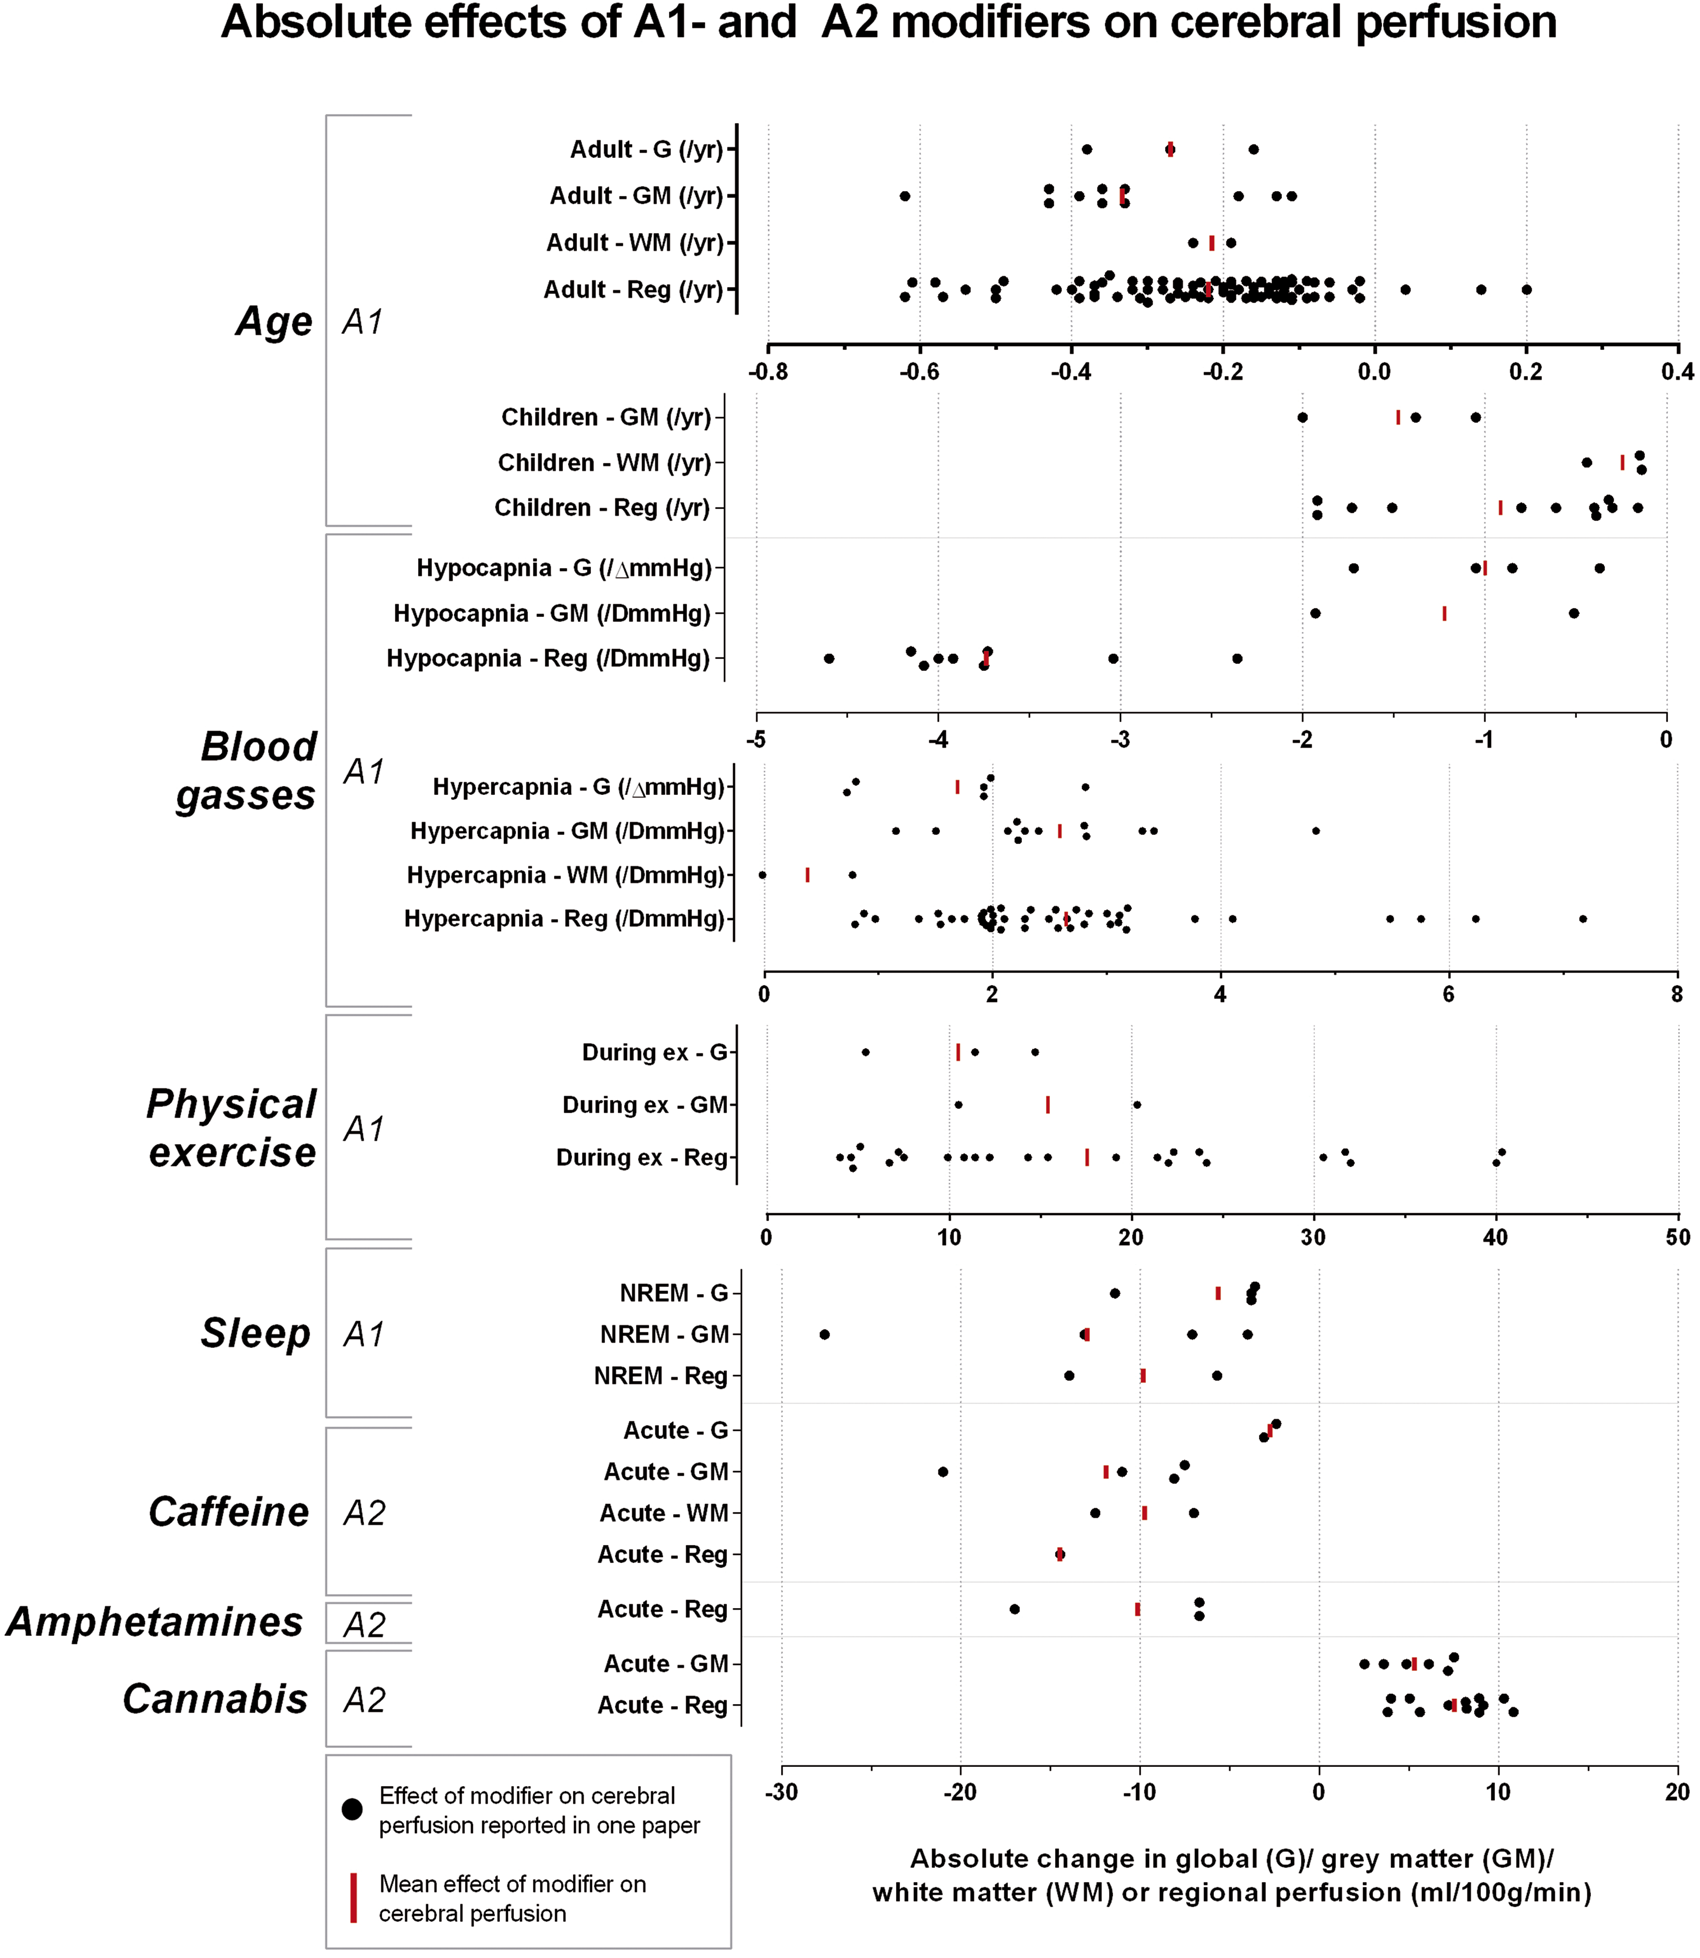
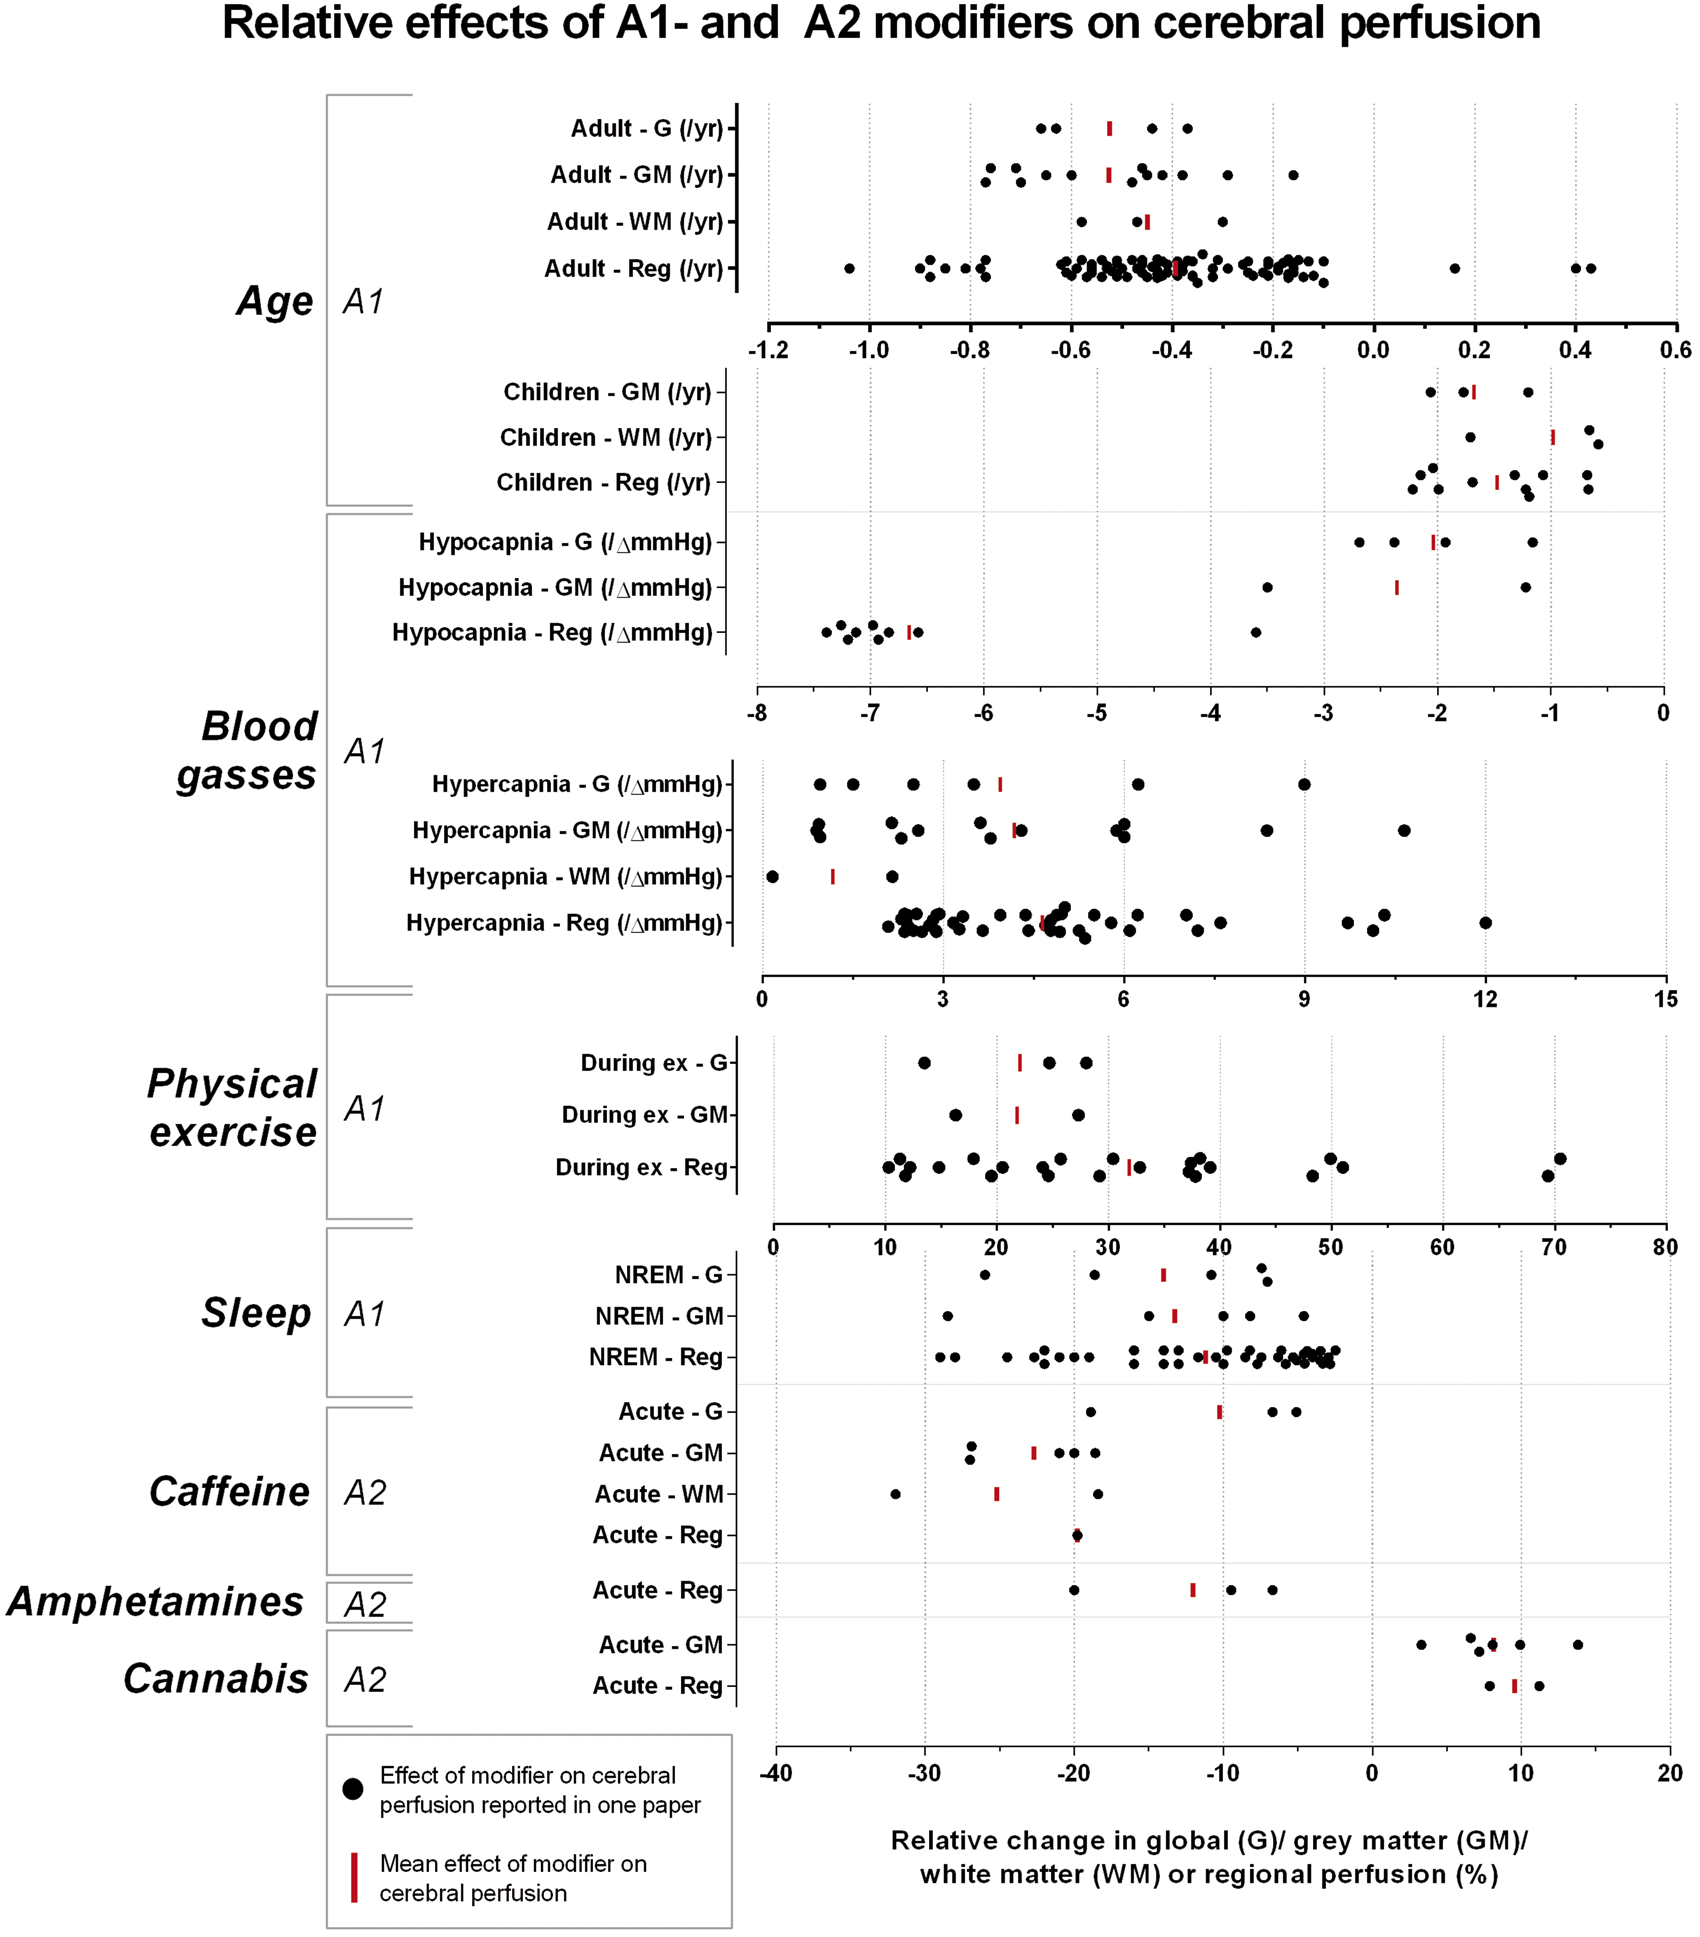
One hundred thirty-seven individual search terms were used in combination with ‘cerebral blood flow’ and ‘cerebral perfusion’. After screening and assessing for eligibility, 553 full-text articles were included in the analysis of the effects of modifiers on cerebral perfusion (Supplementary Tables 1 to 5); 137 of which were selected to summarize the modifiers’ effects in this section. All modifiers influencing global cerebral perfusion were identified and are summarized in Figure 2. Fifty-six human brain perfusion modifiers not related to medication use – except for recreational drugs – are summarized in Table 2. Table 3 categorizes the modifiers according to the corresponding level of prevalence, consistency and effect size. The spread of all reported quantitative absolute and relative information on the effects of the A1-modifiers, as well as the mean effect can be found in Figures 3 (absolute) and 4 (relative).
Effects of modifiers on global brain perfusion summarized as a color gradient: factors in the green area induce no effect, the blue and red areas represent global decrease and increase respectively. All factors are classified both according to their effect and the corresponding magnitude on global perfusion changes. Other factors, whose value is still unknown, are grouped around the grey rectangle. Categories of perfusion-modifiers in relation to current prevalence and consistency. Note: The modifiers in the A1 category are most likely to influence brain perfusion enormously and should be taken into account; modifiers in category A2 exert a smaller effect on perfusion and can be taken into account if practically possible. The categories B1, B2, B4 and A4 include modifiers with a plausible effect on cerebral perfusion but from which the results are rather inconsistent or lacking information regarding the effect size. Some focused research should be performed in order to clarify the effects of those modifiers. The modifiers in the categories C1, C2 and C4 lack research and should be investigated thoroughly. Finally, the categories A3, B3 and C3 can probably be neglected due to their minor effects on cerebral perfusion. Absolute effects of A1- and A2-modifiers on cerebral perfusion: absolute quantitative information for global (G), grey matter (GM) and white matter (WM) reported in each study was plotted for each A1- and A2-modifier and the mean is visualized. Relative effects of A1- and A2-modifiers on cerebral perfusion: relative quantitative information for global (G), grey matter (GM) and white matter (WM) reported in each paper was plotted for each A1- and A2-modifier and the mean is visualized.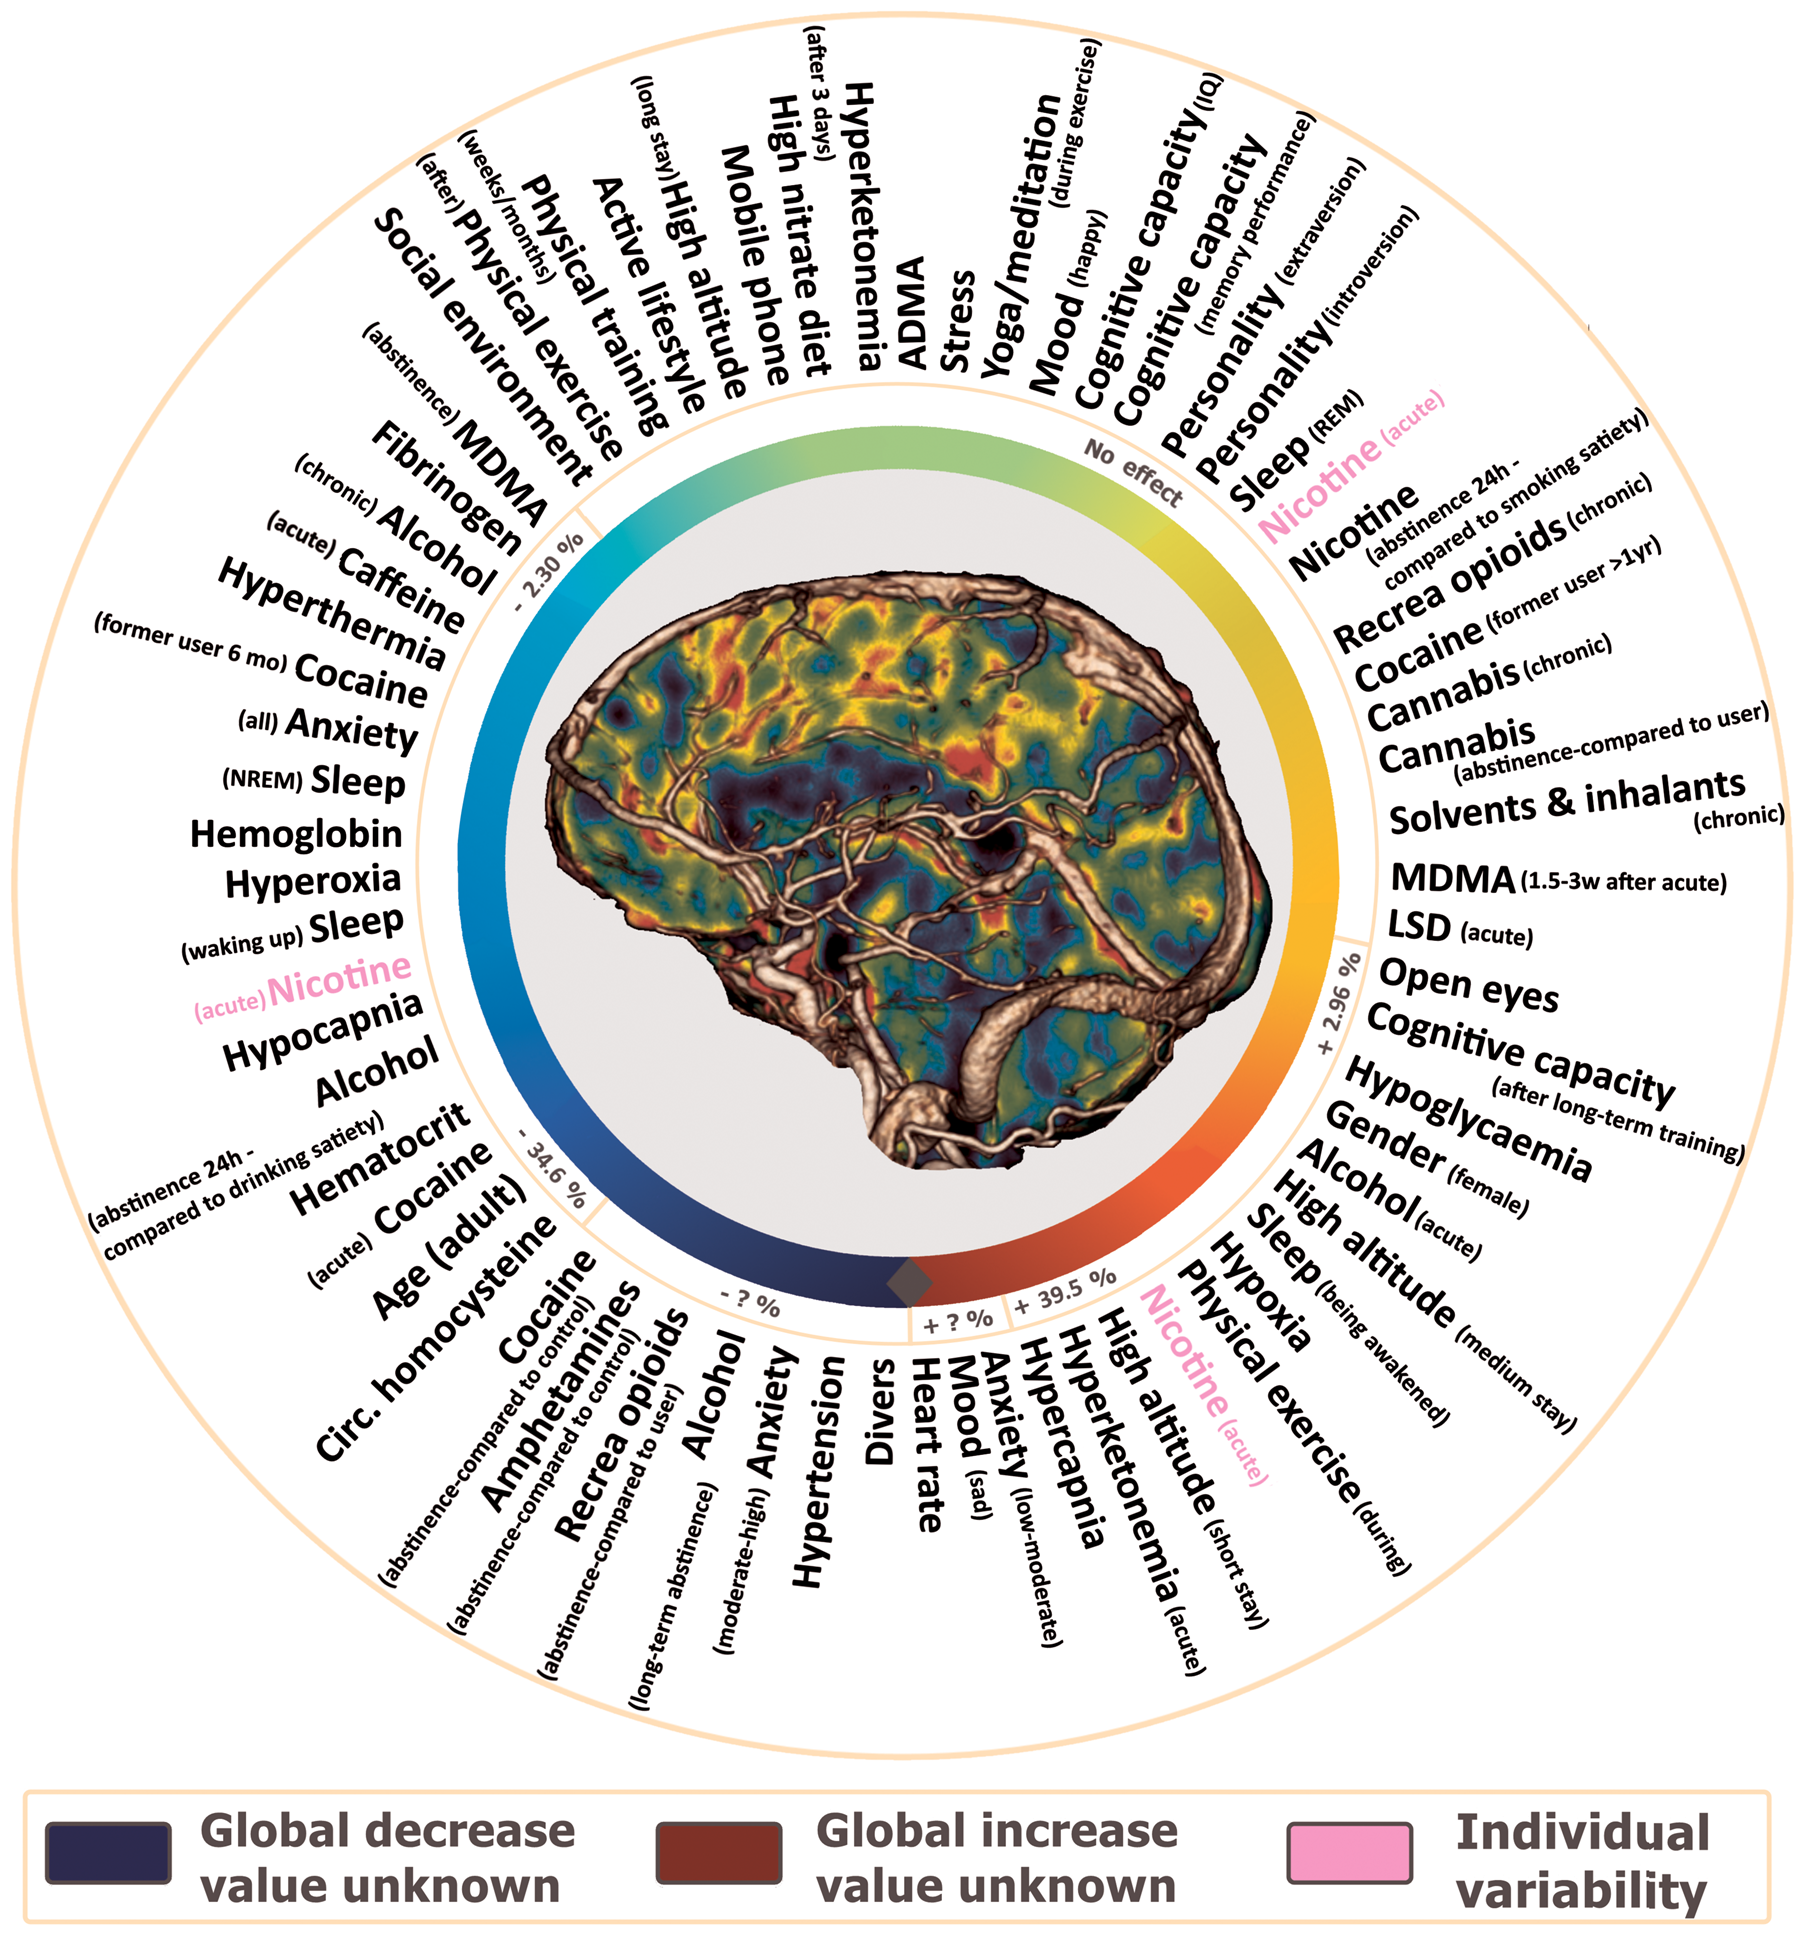
Physiology, lifestyle and health
Without any correction for GM volume changes, global perfusion was found to be negatively associated with age (A1), with an average decline of 0.27 ml/100 g/min (range −0.16 to −0.38) per year [−0.53% (range −0.37% to −0.66%)]. 5 A decrease of 0.31 ml/100 g/min (range −0.11 to −0.62) per year [−0.49% (range −0.16% to −0.77%)] was reported in the gray matter, 12 in combination with a redistribution of CBF among almost all cerebral regions. The effect of age only appeared to be significant in adults after the fifth decade of life. 5 The reported effect on age-related decrease in brain perfusion from corrections for contribution of brain volume loss and partial volume is somewhat controversial. One study found no impact of age on perfusion after correction for partial volume effects, 13 whereas other similar studies have found an age-related decline.5,14 In any case, age has to be taken into account in any comparison of brain perfusion, hence the A1 score. In children (A1) over five years, age was found to be negatively correlated with grey matter perfusion, causing an even more pronounced decrease of −1.69 ml/100 g/min (range −1.05 to −2.00) per year [1.92% (range −1.20 to −2.06)]. 15 The maximum global brain perfusion was found to be reached at the age of 5 to 6.5 years. 16 After reaching the age of retirement (C2), continuing to work or participating in regular physical activities seemed to delay the decline in perfusion. 7 No association was found between global cerebral perfusion and social environment (C3) in a single study comparing elderly subjects living in their own home with those staying in a retirement home or a hospital. 17
Global perfusion in women was found to be approximately 7.26 ml/100 g/min (range 3.80 to 10.73) higher [12.1% (11.0% to 21.9%)] than in men. There are also regional increases in the frontal, temporal, parietal and cingulate regions and in the basal ganglia.5,18 Nonetheless, gender-related differences in global and regional perfusion were not reported in all studies. 5 Actually, the gender (B1) effect on cerebral perfusion may be explained by the well-known gender difference in the hematocrit. 19 The interaction between gender and age is not yet solved and some contradictory observations have been reported. One study reported a gender difference in perfusion in subjects older than 50 years, 5 whereas other studies reported differences starting during female reproductive years. 20 Some studies report that the age-related decline was slower in women, 14 while other studies found no gender difference. 21 The effect of gender is therefore important, but more work is needed for further clarification.
Changes in blood flow velocity in the middle cerebral arteries have been observed during the menstrual cycle (C3),22,23 but no effects on gray matter perfusion were found. 24 During pregnancy (C4), a decrease in blood velocity of the middle cerebral artery (MCAv) at a rate of decline of 0.59 cm/s (range −0.41 to −0.77) per week [−0.58% (range −0.57% to −0.58%)] has been reported. 25 Two studies investigated the effect of menopause (C4) on perfusion, which was found to decrease in several regions. 26 This effect appears not to be associated with age, nor with the elapsed time after menopause. 26
Global effects of diurnal rhythm (C4) have not yet been reported, but regional decreases seem to occur in regions of the default mode network throughout the day. 27 One study observed a cosine course in the MCAv. 28
The effect of body mass index (C3) on cerebral blood flow is inconclusive. Cerebral blood flow velocity (MCAv) was found to be moderately decreased in conjunction with an increase of body weight. 29 Positive correlations between the fat-free body mass (C4) and regional perfusion have been observed elsewhere, 30 and a lowered global and regional perfusion in overweight (C4) subjects has also been reported. 31 Studies dealing specifically with obesity (BMI > 30) and eating disorders (e.g. anorexia nervosa) are not presented, as these are considered non-healthy conditions.
Studies on the short-term effects of physical exercise (A1) reported strong and rather congruent effects on cerebral perfusion. Global perfusion was shown to be increased by approximately 10.5 ml/100 g/min (range 11.4 to 14.7) [22.1% (24.7 to 28.0%), and a regional redistribution of flow was generated. Thirteen minutes after cessation of activity, global perfusion returned to normal, even when the regional perfusion in the sensorimotor area was still increased. 32 Although other studies did not report any effect of exercise on global perfusion, 33 this apparent discrepancy can be (partially) explained by changes in the partial arterial pressure of carbon dioxide (PaCO2).32–34 Perfusion changes are also dependent on the load and type of exercise.34,35 After exercise (B1), some studies reported an increased global perfusion, 36 whereas other studies only reported regional changes with no effects on global perfusion. 37 The chronic effects of long-term physical exercise or training (B1) are rather incongruent.6,38 Curiously, the difference in trained and sedentary men accounted for a difference in MCAv equivalent ‘age’ of approximately 10 years. 6 Regional redistributions have also been observed, 39 as well as associations between aerobic or cardiorespiratory fitness due to an active lifestyle (B1) and increased perfusion in the hippocampus and grey matter. 40 Regional perfusion appears to be decreased down to 39 ml/100 g/min (−57,2%) after a 10-day cessation of physical training (C1) in master athletes. 41
Pressure changes by changing altitude (C1) have profound effects on brain perfusion. Climbing to high altitude (i.e. about 4000 m) increases global perfusion by 9.65 ml/100 g/min (range 9.10 to 10.2) [+30.1% (range 24.0 to 36.2)] during the first day. The increase is accompanied by regional redistributions. 42 Approximately three weeks (C3) of acclimatization to high altitude normalizes perfusion. 43 Individual differences in perfusion have been observed after descending (C4) to lower altitude, following a long stay at high altitude. 44 In divers (C4), a decrease in both global and regional perfusion was reported.45,46 In former divers (C4), a persistent decrease of perfusion was found in certain regions of the frontal lobe and in parts of the cerebellum. 47
The effect of blood pressure has been extensively studied. In chronic hypotension (C4) ([SBP]<100 mmHg, [DBP]<60 mmHg), a decrease in the MCAv was reported, while no changes in grey matter perfusion were reported.48,49 Chronic hypertension (B1) (systolic blood pressure (SBP)>150 mmHg, diastolic blood pressure (DBP)>90 mm Hg) can decrease 50 or increase regional perfusion, 51 which has been attributed to gender-related differences in one study. 52 A positive relation between global brain perfusion and heart rate (C4) was found, but perfusion in certain regions was decreased. 53
Hyperthermia and fever (C2) were also found to decrease global perfusion at an average of 5.21 ml/100 g/min (range −2.72 to −7.70) [−10.2% (range −5.48% to −15.0%)]. 54 Nevertheless, hyperthermia was found to change the regional pattern of CBF by increases in the frontal and temporal regions, and by decreases in the limbic system, parietal lobe, and in the cingulate cortex. 55 These perfusion changes persisted for at least 15 min after normalization of body temperature. 55
Using a mobile phone (C4) appeared to change the regional task-related brain perfusion pattern, but not regional perfusion during rest. 56 Perfusion increased in the prefrontal region for at least 30 min after using the mobile phone. 57 Having a cell phone by your side during the so-called ‘resting’ state appears to induce no changes on MCAv. 58
Food and liquid intake has reported effects on perfusion, but the effects are not sufficiently documented. Dietary effects were studied in only two reports where a high nitrate diet (C4) was reported to increase perfusion in several regions, 59 whereas fasting during the Ramadan (C4) induced no changes on MCAv. 60 Satiety (B4) after eating was found to immediately affect regional perfusion. 61 Fat intake (C3) induced a decrease of nearly 13% in the perfusion of the hypothalamus, and an increase of perfusion in the frontal operculum, approximately half an hour after food intake.62,63 Glucose and fructose (C4) seemed to exert a distinct effect on regional perfusion 15 to 60 min after intake. Fructose induced both regional increases and decreases, whereas the effects of glucose were limited to regional decreases. 64 Effects on global perfusion were not observed. 65
The experience of thirst (B4) was found to redistribute regional perfusion, leading to increased perfusion in several cortical (e.g. cingulate) and cerebellar areas, and to decreased perfusion in the frontal and temporal regions (e.g. hippocampus), the basal ganglia and the midbrain. 66 Satiety (B4) after drinking water was found to redistribute perfusion in multiple cerebral regions. 66
Blood composition and components
Blood gases, O2 and CO2, have a profound effect on brain perfusion. 67 Hypoxia (B2) appears to increase global perfusion at an average of 0.43 ml/100 g/min (range 0.26 to 0.59) per mmHg [+0.87% (0.44% to 1.30%)] of decrease in the partial arterial pressure of oxygen (PaO2). 68 The same was seen with hypercapnia (A1) at an average of 1.65 ml/100 g/min (range 0.80 to 2.89) per mmHg [+3.95% (range 0.95% to 8.99%)] of increase (PaCO2). These changes are associated with a regional redistribution of perfusion. 69 Hypocapnia (A1) decreases both global and regional perfusion at a similar rate of change. 70 However, it should be noted that such a linear relationship was just observed in the range of 23 to 60 mmHg of PaCO2. 71 In some studies, hyperoxia (B1) appears to decrease both global and regional perfusion; other studies report no effects on global perfusion and an inverse effect on regional perfusion.72,73Again, an interaction was found between the effects of O2 and CO2. 67
A high hematocrit (B1) leads to a decrease in global perfusion at an average of −0.73 ml/100 g/min (range −0.32 to −1.55) [−2.28% (range −0.64 to −3.50)] per 1% of increase in the hematocrit value. 74 However, the effects of blood viscosity (C4) and hemoglobin (C2) are still debatable. There are studies on blood viscosity reporting no effect on grey matter perfusion, accompanied by regional increases. 75 The hemoglobin value was observed to determine a decrease in global perfusion at an average of −1.65 ml/100 g/min per g/dl of increase in the hemoglobin value, and to change cerebral perfusion in certain brain regions.76,77 For fibrinogen (C2), a decrease in global perfusion of 3.20 ml/100 g/min (6.43%) was found. 78
For a blood glucose (B3) level below 3.6 mmol/L corresponding to severe hypoglycemia, both increases and decreases in global perfusion were found, accompanied with increases of regional perfusion. 79 Global hyperperfusion was reported to outlast normalization of blood glucose levels by 90 min. 79 However information about the effects of physiological blood glucose level on brain perfusion was not found. Circulating homocysteine (C1) levels were found to be associated with a decrease in global perfusion (2.38 ml/100 g/min/µmol/L on average) and to induce some regional redistribution. 80 A heightened total cholesterol level (C4) was found to decrease regional perfusion in the temporal and parietal regions. 81 Hyperketonemia (C1) – a state that can occur in cachectic patients, but is unlikely to be found in normal subjects – was reported to increase global perfusion, 82 which tends to normalize after three days (C3). 82 The results on the effects of asymmetric dimethylarginine (ADMA) (C3) are contradictory, as either no effect 80 or a weak regional decrease in perfusion of the basal ganglia 83 were observed. Free fatty acids (C4) were found to be either positively or negatively associated with the degree of perfusion in several brain regions depending on the fatty acid composition. 84
Mental state, personality and cognition
Mental stress (C3) can increase regional perfusion in the cerebellum, putamen, insula and in the anterior cingulate cortex. 85 Global increases appear to be non-significant, but individual differences have been observed and led to the suggestion that an inverted-U effect might occur. 85 Likewise, an inverted-U effect on brain perfusion can be caused by anxiety (B1). There are reports of global and regional perfusion increases in situations causing low to moderate anxiety levels (C4), and perfusion decreases in moderate to high anxiety (C4) generating conditions. 86 Practicing yoga and meditation (C4) changes the brain state and is associated with a regional redistribution of perfusion, depending on the method of meditation and its induced depth. 87 However, the reported results were obtained in experienced Buddhist meditators.
Another factor that can influence brain perfusion is mood. Stimuli inducing sadness (B3) have been found to increase global perfusion, with regional redistributions among almost all brain regions. Happiness (B3) was reported to induce both increases and decreases in regional perfusion. 88 Other mood states, such as disgust (C4), worry (C4) and anger (C4) also have been reported to influence regional perfusion.89–91 The impact of a few aspects of cognitive capacity was investigated in a limited number of studies. A high intelligence quotient (IQ) (B4) was associated with increases in grey matter and regional perfusion. 92 Other cognition-related factors appear to redistribute regional perfusion, such as processing speed (C4), verbal fluency (C4), memory (C4) and executive functioning (C4).93,94 Both short (C4)-95 and long-term cognitive training (B1) 96 increase regional perfusion. Creativity (C4) was found to increase perfusion in several frontal regions (e.g. the gyrus rectus), and to decrease it in the precuneus.92,97
Personality is a multi-dimensional perfusion-modifier still under investigation with only a limited number of papers investigating. Extraversion (A4) was found to be associated with a different pattern of brain perfusion compared to introversion (A4). 98 Regional perfusion was increased in association with persistence (C4) or novelty-seeking (C4) behavior, whereas psychoticism (C4), neuroticism (C4), harm avoidance (C4), and reward dependence (C4) decrease perfusion in certain regions of the brain. 98
Although the effect of sleep on perfusion is quite well understood, some aspects still remain unclear. During non-rapid eye movement (NREM) sleep (A1), cerebral perfusion decreases globally at an average of −5.65 ml/100 g/min (range −3.60 to −11.4) [−14.0% (range −7.05% to −18.63%)] along with regional redistributions relative to pre-sleep perfusion.99,100 Afterwards, during rapid eye movement (REM) sleep (B1), there is an increase in the grey matter perfusion above pre-sleep perfusion levels.99,100 This rate of change is attributable to the depth of sleep across various sleep stages and cycles.99,101 Falling asleep (C4) seems to increase the MCAv. 102 Waking up spontaneously (C2), even at night, decreases perfusion globally (−17.5%) and redistributes regional perfusion. 102 By contrast, being awakened (C2) increases both global (+5.70 ml/100 g/min; +14.3%) and regional perfusion compared to stage 2 sleep perfusion level. 103 No association between perfusion and subjective sleepiness (C4) has been found, but some positive and negative regional variations with drowsiness (C4) were observed both in normal and sleep-deprived subjects. 104
Opening the eyes (C1) increases global perfusion. Watching a constant or flickering flashing light or a video during a perfusion scan increases occipital perfusion by 24.4 ml/100 g/min (+50%). 105 Mental activity (C1) was found to redistribute regional perfusion, (e.g. during self-referential tasks).106,107 Arousal and vigilance (C3) due to a given task can also exert an effect on regional perfusion. 108
Caffeine and recreational drugs
Acute caffeine (A2) intake exerts a profound short-term decrease in global perfusion of approximately 2.75 ml/100 g/min (range −2.40 to −3.10) [−10.2% (range −5.10 to −18.9)] in regular caffeine users.9,109 This decrease was reported to last for at least 75 min. 109 These short-term effects seem to be more pronounced in subjects taking a low daily dose of caffeine, 9 and to be very much dependent on perfusion levels prior to caffeine intake. 109 Long-term effects of daily caffeine intake on perfusion are still not completely understood. It was suggested that perfusion tends to normalize in chronic (C3) users, due to a downregulation of vascular adenosine receptors.9,110 Gray matter perfusion was found to increase in heavy coffee drinkers after 24 h of withdrawal (C4),9,110 and to normalize after 14 days (C4). 110 Caffeine-containing soft drinks and tea were found to exert similar effects on cerebral perfusion.111,112 The acute consumption of caffeine containing energy drinks (C4) was found to be associated with a decrease in the MCAv (−7.90 cm/s or −11.7%). 113
Long-term nicotine (B2) use was found to be associated with an average decrease of −6.37 ml/100 g/min (range −1.50 to −11.1) in global brain perfusion [−9.16% (range (−2.0 to −15.5)]. 8 Short-term effects of smoking (B2) (on global and regional perfusion) are reported to differ among individuals. Increased, decreased and normal global brain perfusion have been observed in subjects smoking their favorite cigarette brand. 114 These short-term regional effects were no longer visible after an abstinence period of 24 h (B2) which seems to abolish these short-term effects on regional perfusion. 115 Although a tendency towards normalization has been detected, global decreased brain perfusion persists even after nine years of abstinence (C2) following a long-term use of nicotine. 116 Caution is needed when interpreting perfusion measurements after withdrawal, since both nicotine-containing and denicotinized replacement therapies appear to affect regional perfusion as well, 117 and it has been observed that perfusion is modulated by psychotropic effects caused by withdrawal related to addiction. 117
Chronic alcohol (B1) consumption induced an average decrease of −2.43 (range −1.85 −> −3.00) ml/100 g/min (−7.46%) in global perfusion along with widespread regional perfusion changes. 118 An acute alcohol (B1) intake induces dose-dependent short-term increases in global and regional perfusion up to 8.58 ml/100 g/min (+12.7%), which lasts at least for 2 h after consumption.119,120 Global perfusion in chronic alcohol drinkers has been reported to decrease after 24 h of abstinence (C1). 121 A longer period of abstinence (B1) results in a grey matter increase and regional redistributions. 122
The long-term use of recreational opioids (C4) was found to be associated with a decreased perfusion in some regions of the brain. 123 An acute intake (B4) of recreational opioids was also reported to induce multiple short-term changes in regional perfusion. 124 Abstinence (B4) in long-term users was found to induce a decrease of global and a redistribution of regional perfusion. 11 However, withdrawal effects induced by naloxone were associated with a decrease in regional perfusion as well. 11 The long-term use of amphetamines (B1) was reported in combination with regional perfusion deficits.125,126 Nonetheless, these effects were neither observed in all subjects nor were they correlated with dose or duration of abuse.125,126 An acute intake (A2) of amphetamines was reported to induce no effects on grey matter perfusion, but changes in the pattern of brain perfusion in regions related to the reward circuit.127,128 Even after months of abstinence (A4), global and regional perfusion were found to be decreased relative to normal volunteers. 129
The long-term use of cocaine (B4) appears to be associated with regional decreases in brain perfusion. 130 An acute cocaine intake (B1) was found to cause a decrease in global perfusion accompanied by regional redistributions with a range from −36.6% to +28.1%. 131 Such a short-term effect is dose-dependent and lasts for approximately 40 min. 131 Brain perfusion was reported to increase and decrease compared to control subjects in some regions after more than one year of abstinence (C4), whereas global perfusion tends to normalize. 132 The long-term use of cannabis (B1) has been described to decrease global perfusion and to cause changes in regional perfusion. 133 However, the effects were not reported to be significant in all studies. 134 An acute use of cannabis (A2) was found to increase grey matter perfusion at an average of 5.29 (range 2.51 to 7.51) ml/100 g/min [8.14% (3.29 to 13.8%)] in combination with an altered pattern of regional perfusion. 135 Global and regional perfusion changes persist after at least two months of abstinence (B4). 133
Long-term exposure to solvents and inhalants (B4), such as industrial dyes and ethers, was in some studies found to be associated with a decrease in grey matter perfusion. 136 There are also changes in regional perfusion, which is increased in the left occipital region and decreased in the prefrontal and temporal cortices, and in the thalamus. 137 Acute inhalation (C1) appears to regionally increase grey matter perfusion up to 14.2 ml/100 g/min (+20.9%). 138 A couple of weeks after an acute intake of 3,4-methylenedioxy-methamphetamine (MDMA) (C1), regional perfusion has been reported to show a maximal decrease of −5.30 ml/100 g/min (−10.0%). 139 Some months after (C3) an acute intake, global perfusion appears also to decrease (−2.30% on average). 139 Somewhat surprisingly, LSD (C4) was not found to have any effect on global brain perfusion, but the effects of this modifier should be further investigated as more information is lacking. 140 An acute psilocybin (hallucinogenic mushrooms) (C4) intake was reported to be associated with regional decreases. 141 Finally, the effects of many other recreational drugs have not yet been studied.
Discussion
This literature review shows that the most relevant factors influencing perfusion of the brain (ranked as A1) are age (adult), age (children), physical exercise (during), hypercapnia, hypocapnia and NREM sleep. Given that it is not always possible to correct for these modifiers at the time of perfusion assessment, especially in the clinical setting, their effects should be taken into account during the interpretation of perfusion images and quantification. Although the variability of reported results is often quite large for many factors classified in category B, some perfusion-modifiers belonging to category A also deserve further research due to pronounced variability across study results (e.g. in quantitative information) or the insufficient available information (e.g., on the dynamics of the effects). Furthermore, a large group of potential modifiers in category C needs investigation to ascertain the corresponding effects on cerebral perfusion. In order to correct for the effects of all perfusion-modifiers, it is crucial to adopt a standard operating procedure in the research setting. In the clinical setting such a procedure is also recommendable, at least to account for the effect of perfusion-modifiers categorized as A1.
Understanding the effects of perfusion-modifiers
Regional and global perfusion alterations, caused by the described perfusion modifiers, can mimic similar regional disease-related changes which might be of the same order of magnitude. More so, in early or mild stages of neurodegeneration and psychiatric disorders, perfusion changes will be subtle and in line with changes caused by non-disease-related perfusion modifiers. For example, in patients with early-onset Alzheimer’s Disease, a hypoperfusion in the precuneus and posterior cingulate cortex has been reported, 142 a perfusion pattern that can also be observed in healthy subjects after an acute intake of caffeine. 112
From the review, it is also clear that the understanding of certain perfusion-modifiers is still limited (e.g. IQ, mood, cognition and education), incomplete (e.g. smoking and chronic caffeine use), or even contradictory (e.g. physical training and blood pressure). On top of that, the effect of some specific factors has not been studied in healthy subjects at all. For instance, in spite of the fact that significant – yet inconsistent – effects of education 143 and job complexity 144 have been described in perfusion studies involving patients with Alzheimer’s disease, the same effects have not yet been confirmed in healthy volunteers. Likewise, the effect of some other factors remains to be investigated, such as physical exercise before a perfusion scan (e.g. a brisk walk or bike ride to the scanning facility), ethnicity, loneliness, handedness, hyperglycaemia and eating related factors like long-term fasting, hunger and satiety. It is also unclear how important genetic factors are for cerebral perfusion.
Data acquisition, methods, and a standard operating procedure for the assessment of brain perfusion
Surplus variation secondary to non-standardized acquisition or post-processing complicates the interpretation of perfusion imaging. 145 Given that ASL images can be acquired using many different sequences and scanners, and that there are many post-processing methods and models for their analysis, a strategy to homogenize data acquisition and post-processing methods must be established. These issues – outside the scope of this review – were thoroughly discussed in a recent paper by Alsop et al, 145 and should be kept in mind when interpreting perfusion images or the effects of perfusion-modifiers.
Summary of the standard operating procedure proposed to reduce perfusion-modifiers induced variability.
Specific instructions can be used to improve subject cooperation and to reduce variability caused by the scanner environment. Perfusion assessment at a fixed time of the day should minimize the effects of diurnal rhythm. Minimizing stress and anxiety can be achieved by thoroughly explaining the experiment and characteristics of the MRI environment to the volunteer before the perfusion scan, and by using clear instructions during the scanning session as well. It is essential that the volunteer feels comfortable and knowledgeable about what to expect (e.g., loud noises). Restricting the use of a mobile phone can be advised for a few hours before the perfusion scan. However, the necessity of this impractical restriction still has to be proved. Asking the volunteer not to perform strenuous exercises before scanning can be suggested, but this may be difficult in certain situations (e.g. if the volunteer cycled to the scanning facility or had to hurry to be on time). In these circumstances, it might be wiser to take this modifier into consideration and, if possible, to allow for some rest before measuring perfusion. Adequate hydration can be ascertained by instructions before scanning. However, beware that drinking too much before scanning might lead to a toilet break during the scan session.
Asking the subjects to close their eyes and dimming lights in the scanner room minimizes the effects of light and closed versus opened eyes during the perfusion scan. It is important that the subject remains in a ‘resting state’ by simple instruction or message at the beginning of perfusion scanning, just like it is done for resting state fMRI. It is imperative that the subject doesn’t sleep. The awake condition can be checked by inquiring with the subject or by using EEG during the perfusion scan. Asking the volunteers about their sleep during the night before scanning might provide some extra information on their predisposition to fall asleep. Instructing the subjects not to move during the perfusion scan is mandatory to avoid motion artefacts, which always induces unwanted measures and quantification problems. Using rigorous procedures for positioning can also minimize unwanted movement.
The use of an adequate questionnaire and a set of psychological tests can be helpful to assess the so-called ‘physiotype’ of the brain of a given subject. Information on age, occupation, social environment, gender, menstrual cycle, pregnancy and menopause can be taken into account by using such a simple questionnaire. In spite of being unusual in clinical and research settings, factors such as altitude and diving can also be queried. It might be useful to take into account the usual pattern of physical exercise and the exercise practiced the day before and on the day of scanning. Providing a standardized meal an hour before the perfusion scan might minimize the effects of food on perfusion. However, this solution may not take metabolism-related variability into account and can be quite expensive and impractical. A better option would be to query dietary habits and information related to the last meal before the perfusion scan. Likewise, information on the current and past use of caffeine (and other recreational drugs) can be easily acquired by using a questionnaire. Advising withdrawal of acute drug intake is a plausible option. However, asking a volunteer not to smoke or drink or eat caffeinated foods (e.g. coffee, tea, coke, chocolate) for a couple of hours before scanning can cause even more variability in perfusion due to withdrawal effects. A better approach would be to determine how much consumption of these drugs occurred the day before and the day of scanning. Querying the subjective feeling of thirst immediately after the perfusion scan may be a practical solution to control for the effects of thirst on perfusion. Several aspects of cognitive capacity and creativity can be tested using a battery of neuropsychological tests. A personality test before scanning can provide information regarding the personality of the volunteer. Finally, a mood-sensing test should be performed before the perfusion scan. A simple mood rating can also be assessed immediately after scanning, using a visual analogue scale for happy and sad mood.
The standard operating procedure proposed is the result of a collaborative effort of the European COST – AID Action BM1103, and should be applied in the setting of the recently published consensus on best practices for ASL acquisition and post-processing. 146 Although this standard operating procedure is mostly applicable in the context of perfusion measurements using ASL, it can be used as a normalisation system to control for between- and within-subject variability with other perfusion techniques as well. The standard operating procedure is available as Supplementary material.
Deep MRI physiotyping
Obtaining personalized profiles and perfusion data from a large number of healthy subjects on the basis of a standard operating procedure would provide an opportunity to develop the so-called ‘deep MRI physiotyping’. In other words, it would be possible to match a given volunteer to a specific physiotypic profile by using perfusion data and personalized information. The most difficult challenge of ‘deep MRI physiotyping’ would be obtaining a database large enough to create personalized normality templates. A first big challenge is the number of templates and the amount of data to populate the templates which, due to the multi-dimensionality of the problem with so many factors to take into account, could well be over 10,000 datasets. Although large databases of normal brain MRI already exist and precautions have been taken to deal with unwanted variance, most of these do not include knowledge about the many perfusion-modifiers as appears to be required. 18
Another challenge is the lack of standardized neuropsychological testing and the difficulty to test all domains of cognition. A consensus is needed on the choice of neuropsychological tests in order to define a specific physiotype. For instance, in the United States of America (USA), the National Institute of Health (NIH) toolbox sets an example of how neuropsychology can be standardized. 147 Unfortunately, this framework is only validated in the USA for native English and Spanish speakers, despite ongoing efforts to translate this into other languages and cultures, including those of the European countries. In order to test the most important major neuropsychological domains and to rule out major psychiatric disorders, it would be recommendable to choose a battery of neuropsychological tests assessing general cognition, memory, language, attention, verbal fluency, processing speed, executive function and visuospatial skills.
Limitations of this review
The major limitation of this review derives from the existing variety of techniques and methods used to investigate the reported perfusion-modifiers. Moreover, older studies mostly focused only on perfusion-modifiers leading to an increase of cerebral perfusion (as opposed to a decrease in perfusion), which may have introduced a potential bias to this review. Furthermore, the concepts of global and regional perfusion, as well as the assessed cerebral regions were not precisely defined in many studies. This complicates the interpretation and generalizability of the reported results.
There was no uniformity in the reported units to measure perfusion. Results obtained on the basis of macrovascular approaches, such as TCD and angiography (Table 1), should also be interpreted with care, as these techniques measure blood flow velocity in a large cerebral artery (e.g. in the ICA or the MCA), rather than perfusion at the microvascular level. Therefore, results only based on macrovascular data were marked with an asterisk (*) in the supplementary tables. Nevertheless, we assume that these techniques can provide a strong indication of changes in blood supply to the brain. 3 For each modifier, the average value and range of the reported information are presented in the results section and the supplementary tables. However, only a few papers reported quantitative information, which complicates a correct attribution of their effect sizes. Additionally, the reported absolute values of CBF have been found to widely vary between 30 and 99 ml/100 g/min for grey matter, and between 13 and 45 ml/100 g/min for white matter, 148 which also precludes us from drawing uniform conclusions. Many studies mentioned either only absolute or only relative values. Therefore, a scaling factor across average values (per modifier) was impossible. It was also, obviously, impossible to present ranges for those modifiers that were only investigated by a single study. For these reasons, the use of averages and ranges reported in this review cannot be used as a recommendation for use as some kind of correction factor, but they can be interpreted as a way of understanding which modifiers have the most significant effect size on perfusion.
Another limitation of this review pertains to the fact that the reported effects of some perfusion-modifying factors were considered in isolation, because interactions between modifiers were often not described. A key example here is the influence of PaCO2 on perfusion, which probably depends on PaO2, and vice versa. 67 Another example is the above-mentioned interaction between the effects of gender and hematocrit on cerebral perfusion. 19 In the future, interactions might be better characterized using ‘deep MRI physiotyping’, assuming that the necessary effects are taken into account. This review did not address the many underlying psychological and physiological mechanisms to explain the effects of modifiers. A better understanding of these mechanisms could clarify some of the reported results, but this was not the main goal of the current report.
Results from some patient studies were included in this review of modifiers of normal perfusion because most knowledge for certain modifiers was obtained from such studies, and the factors described are often present in part in what is considered normal or in subjects who present themselves as normal. This includes studies about blood pressure, haematocrit, blood viscosity, haemoglobin and LDL-cholesterol. Furthermore, plenty of studies investigating the effects of alcohol and recreational drugs included patients suffering from poly-drug dependency. Because of the significant role of the results of those studies in the understanding of perfusion modifiers, exceptions for inclusion have been made. Finally, the effects of prescription and over-the-counter drugs were not included in this review. This can be regarded as an additional limitation, as it is clear that many medicinal drugs have a large influence on perfusion.10,11 Nevertheless, given that we wanted to investigate perfusion-modifiers in normal subjects and medication is related to pathological conditions, we decided not to include the corresponding effects in this review.
Conclusion
This review provides an overview of perfusion-modifying factors influencing between- and within-subject variability of perfusion measurements. It underlines the complexity and importance of numerous influences on brain perfusion that can affect its quantification and pattern. The effect of over fifty perfusion-modifiers was reported. In order to disentangle their impact from effects caused by disease, we suggest the combination of a standard operating procedure with a novel approach called ‘deep MRI physiotyping’. This approach can help to create personalized perfusion templates and be an invaluable resource to set up multi-center studies, longitudinal studies, and to help validating clinical applications of ASL. By extrapolation, it may also be helpful to interpret other quantitative measures of the brain.
Footnotes
Funding
The author(s) disclosed receipt of the following financial support for the research, authorship, and/or publication of this article: This work was supported by European Cooperation in Science and Technology – Arterial spin labelling Initiative in Dementia (COST – AID Action BM1103). This review has been funded by, and discussed multiple times at international meetings of this Action.
Acknowledgments
The authors wish to express their gratitude to the contribution of the European Cooperation in Science and Technology – Arterial spin labelling Initiative in Dementia (COST – AID Action BM1103).
Declaration of conflicting interests
The author(s) declared no potential conflicts of interest with respect to the research, authorship, and/or publication of this article.
Author’s contributions
PC and LV collected all research paper concerning this topic. PC and EA analysed, categorised and summarised the data. PC, H-JM, EG and FBP collected information on procedures which are already used in their research centers. PC, H-JM, EG, MS, MA, ER, FBP, JJ, RV, MK, AB-L, RW, E-ML, EA contributed in several critical discussions regarding the approach of the standard operating procedure, the conceptualisation of deep MRI physiotyping and the approach of presenting all information in the review paper. PC and EA wrote the review paper, which has been revised critically by LV, H-JM, MS, ER, FBP, JJ, MK, AB-L, RW, E-ML.
References
Supplementary Material
Please find the following supplemental material available below.
For Open Access articles published under a Creative Commons License, all supplemental material carries the same license as the article it is associated with.
For non-Open Access articles published, all supplemental material carries a non-exclusive license, and permission requests for re-use of supplemental material or any part of supplemental material shall be sent directly to the copyright owner as specified in the copyright notice associated with the article.