
Abstract
The high metabolic demand of neuronal tissue, coupled with its relatively low energy storage capacity, requires that increases in neuronal activation are quickly matched with increased blood flow to ensure efficient supply of oxygen and nutrients to the tissue. For this to occur, dilation of nearby arterioles must be coordinated with the dilation of larger upstream feeding arteries. As it stands, the exact spatial extent of such dilation in humans is unknown. Using non-invasive time-of-flight magnetic resonance angiography in healthy participants, we developed an automatic methodology for reconstructing cerebral arterial vessels and quantifying their diameter on a voxel-by-voxel basis. Specifically, we isolated the posterior cerebral artery (PCA) supplying each occipital lobe and quantified its vasodilation induced by visual stimulation. Stimulus-induced changes were strongest (∼30%) near primary visual cortex and progressively decreased in a non-linear fashion as a function of distance. Surprisingly, weak – albeit significant – changes (∼2%) were observed ∼70 mm from the visual cortex. This demonstrates that visual stimulation modulates vascular tone along the bulk of the PCA segment, and thus may have important implications for our understanding of functional hyperemia in healthy and diseased states.
Keywords
Introduction
The adult human brain represents about 2% of total body weight, yet consumes roughly 20% of its total energy budget at rest. 1 This disproportionately high energy demand, coupled with its relatively low energy storage capacity requires a highly optimized mechanism whereby energy substrates can be quickly and efficiently delivered to specific brain regions. For instance, during sensory stimulation, local neuronal activation is typically followed by an increase in regional cerebral blood flow (rCBF) via vessel dilation, a process often referred to as functional hyperemia. 2 However, studies have shown that stimulus-induced vasodilation is not only observed in the small vessels near the site of neuronal activation, but also in the larger upstream vessels.3–6 Such upstream dilation of larger vessels may be essential in order to maintain local microvascular pressure and prevent vascular ‘steal’ from nearby sites.7–9 Together, these studies clearly indicate the presence of vasodilation in areas beyond the primary site of neuronal activation, yet the exact spatial extent of this effect in humans is unknown. Addressing this is important as it may help in explaining discrepancies between neural and vascular-based measures of brain activity.4,5 In addition, Transcranial Doppler (TCD) studies often assume a constant vessel diameter as to infer flow from velocity. However, recent studies have indicated that this may not always be the case,10,11 further supporting the importance of measuring the spatial scale of stimulus-induced vasodilation in humans.
While several methodologies are available for studying grey and white matter, fewer exist for quantifying whole-brain, stimulus-induced changes in cerebral vessel diameter. One potential way of addressing this is by imaging cerebral vessels in humans by using non-invasive approaches that yield a more macroscopic view of vasodilation along the entire feeding vasculature. For instance, time-of-flight magnetic resonance angiography (TOF MRA) 12 at 3T can be used to visualize the main trunk, first-order and second-order branches of large cerebral arteries such as the posterior and middle cerebral artery (PCA and MCA, respectively) in both healthy and patient populations.10,13 While some studies have reported that visual stimulation increases vessel diameter in localized segments of the PCA, it is unclear whether such changes are present across the entire artery. 14
In addition, previous studies have reported stimulus-induced changes in the diameter of smaller branching vessels using sensory stimuli,14–16 though long-distance vasodilation in upstream feeding arteries was not reported. Therefore, the main goal of our study was to measure stimulus-induced vasodilation in both the smaller branches, as well as the major arteries comprising the entire PCA. For this, we first developed a novel approach for mapping stimulus-evoked (visual stimulus) vasodilation on a voxel-by-voxel basis along small and larger arterial vessels feeding the occipital lobe, thus permitting the quantification of large-scale vasodilation.
Material and methods
Arteries of interest
In this study, we focused on the PCAs, the two arteries (left and right) that originate from the distal end of the basilar artery (BA) and courses posteriorly along the inferior part of the temporal lobes until reaching the visual cortex in the occipital lobes. We also include the MCAs, which arises from the internal carotids bilaterally and extends laterally towards the Sylvian fissure to supply the parietal lobe and the lateral aspects of the frontal and temporal lobes.
Subjects and stimulus
All MRI images were acquired in six healthy subjects (two females, age: 24 ± 4), at the Centre Hospitalier Universitaire de Sherbrooke, using an Ingenia 3T Philips scanner. All the participating subjects gave their written informed consent and this study was performed according to the institutional guidelines of the Internal Review Board of the Centre Hospitalier Universitaire de Sherbrooke according to the guidelines of the Declaration of Helsinki of 1975. For visual stimulation, subjects were asked to fixate on a red dot centered over a full-field video, developed in-house using several consecutive action sequences from movies (no sound). As opposed to conventional types of visual stimulation (white flashes, checkerboard, etc.), such natural scenes are more comfortable to focus on for longer stimulation protocols and reliably activate neurons in visual cortex.17,18
TOF MRA acquisition and analysis
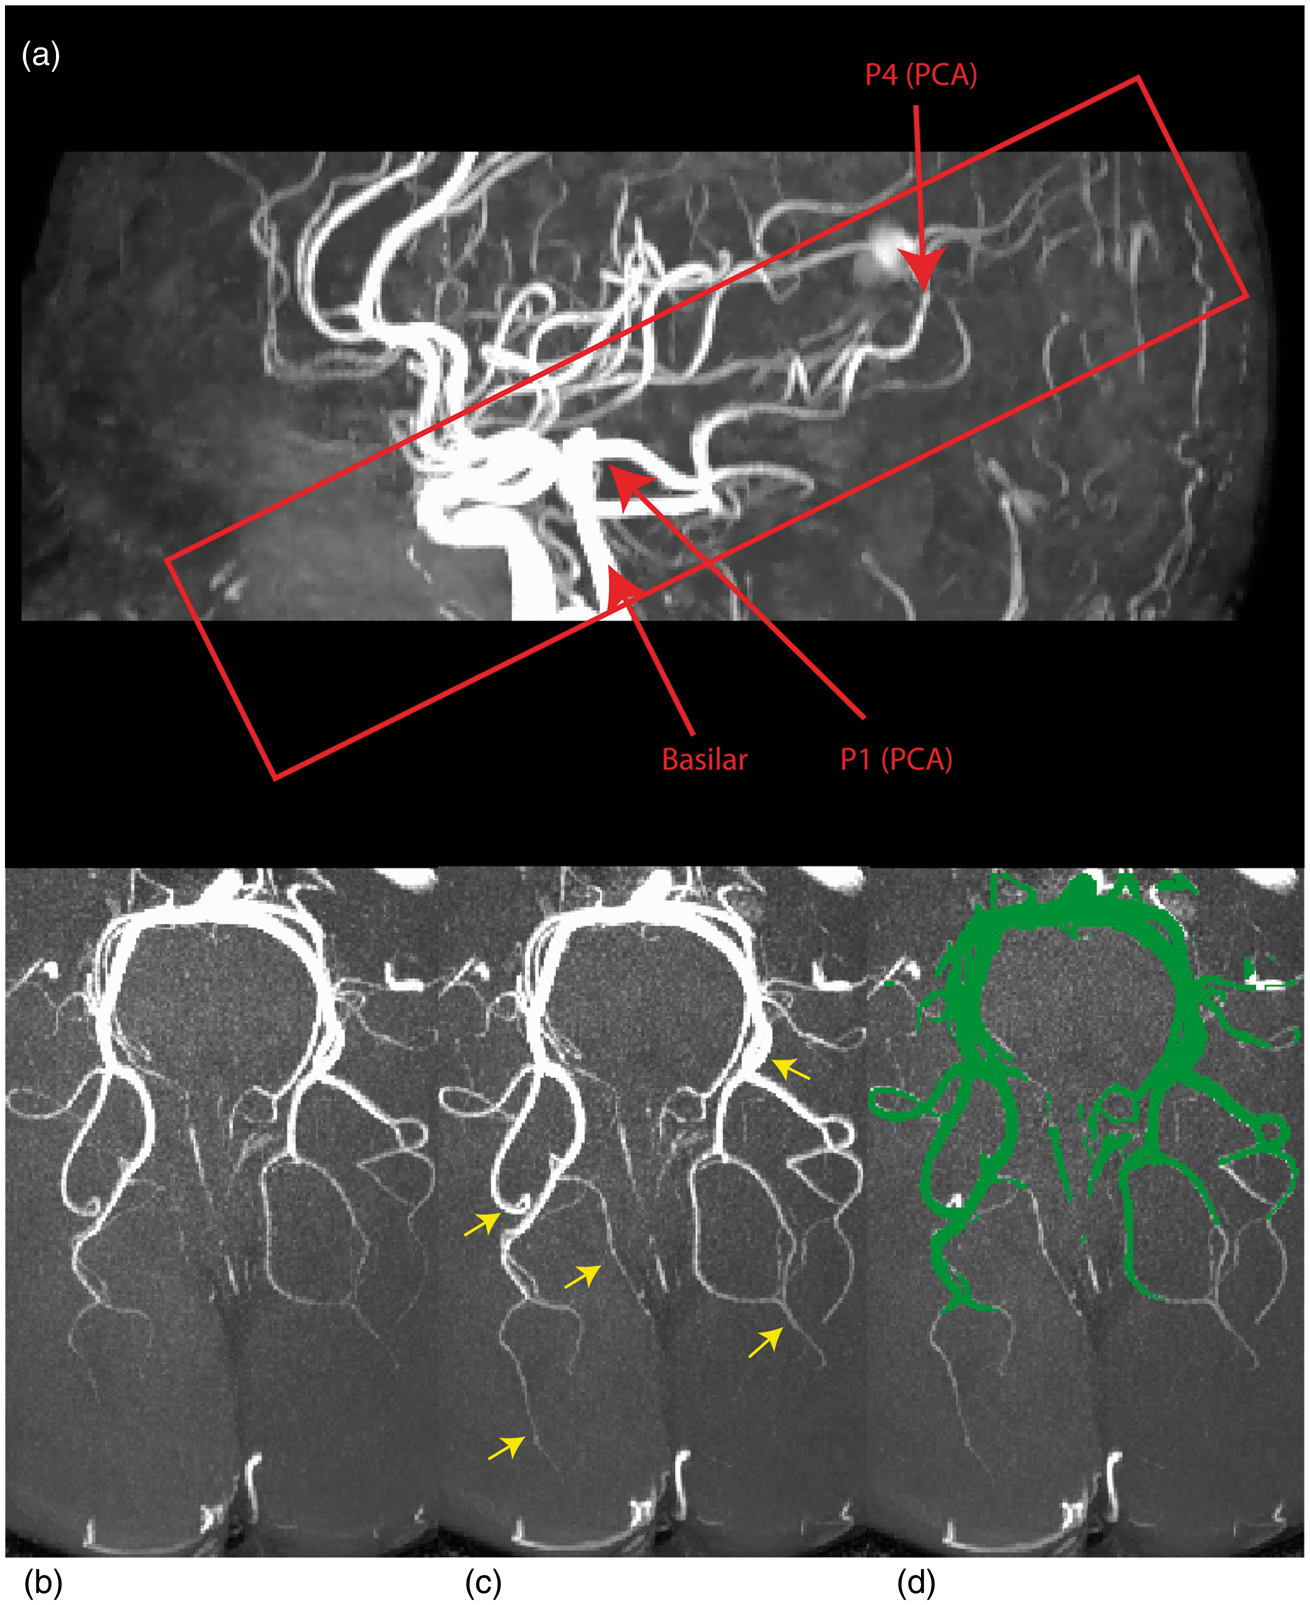
A large coverage low-resolution TOF MRA with four chunks (field-of-view (FoV) = 200 mm × 200 mm × 70 mm, repetition time (TR) = 23 ms, echo time (TE) = 3.6 ms, flip angle (FA) = 18o, parallel imaging (SENSE) acceleration factor = 3, acquisition resolution of 0.5 × 0.8 × 1.4 mm, reconstructed resolution of 0.5 × 0.5 × 0.7 mm, acquisition time of 2 min 24 s) was first acquired as a scout to locate the PCA and MCA. Once the location of these arteries was determined, two high-resolution TOF MRA with only one chunk (FoV = 200 mm × 200 mm × 30 mm, TR = 23 ms, TE = 3.6 ms, FA = 18o, parallel imaging (SENSE) acceleration factor = 2.8, acquisition resolution of 0.4 × 0.4 × 0.8 mm for a 0.4 mm isotropic reconstructed resolution, acquisition time of 2 min 34 s) were centered on the PCA and MCA and acquired as slab images, taking fewer slices instead of full-brain coverage, to decrease the acquisition time and permit higher resolution (see Figure 2(a) for the slab region). The first TOF MRA was acquired as a baseline image, during which the subject was asked to rest quietly (eyes closed, scanner room lights turned off) and a second TOF MRA was acquired as an ‘active state’ with visual stimulation. This was repeated five times yielding a total of 10 TOF MRAs (five baselines, five stimuli) per subject. For the remainder of this article, baseline image refers to the acquisition at rest and stimulus refers to the image acquired during stimulation. Each of the five baseline-stimulus image pairs were registered together using a linear registration technique (ANTs 19 ). Once aligned, the first three were averaged to reduce background noise, resulting in one baseline and one stimulus image per subject. Only the first three were averaged since no apparent improvements were observed when including the fourth and fifth trial, perhaps due to stimulation habituation. 20
In each subject, vessel segmentation was carried out separately on the trial-averaged baseline and stimulus image using an implementation based on our previous segmentation work21,22 which uses a Hessian-based vesselness measure 23 to localize cerebral vessels. In addition, we also used the vessel enhancing diffusion filter 24 (VED) which further improves segmentation of vessels by modifying curvature properties of the Hessian matrix that optimizes the vesselness measure. At the end of the process, each voxel contained a resulting vesselness value and a data-driven threshold value was determined using the triangle method to obtain a segmented, binary vessel tree. 25 First, this method detects the highest and lowest (non-null) peaks of the normalized histogram. Next, the threshold value is selected as the maximal distance between the height of the bin and the hypotenuse of the triangle formed by the highest and lowest peaks. The bin associated with this maximal distance is then selected as the threshold value.
As the last step of our method, we manually isolated the main trunk of the PCA by eliminating its smaller branching vessels. To estimate diameter, we used a local thickness technique which fits a sphere in each voxel of the vessel mask resulting in a voxel-based diameter measure along each segmented vessel26,27 (see Figure 1(a) and (c)). This diameter estimation method is based on the Euclidean distance transform (EDT)
28
(see Figure S1) and the data were upsampled to 0.1 mm3 to improve diameter estimates.
27
To ensure the measurement of common voxels, diameters were only estimated in vessels that were visible in both baseline and stimulus conditions by computing the intersection of the two segmentations (see Figure 2(d)) and also extracting the centerline of this intersection (see Figure 3(b) and (d)). Stimulus-induced changes in vessel diameter were quantified as (D – D0)/D0, with the difference between vessel diameters measured at baseline (D0) and stimulus (D) for all corresponding central voxels.
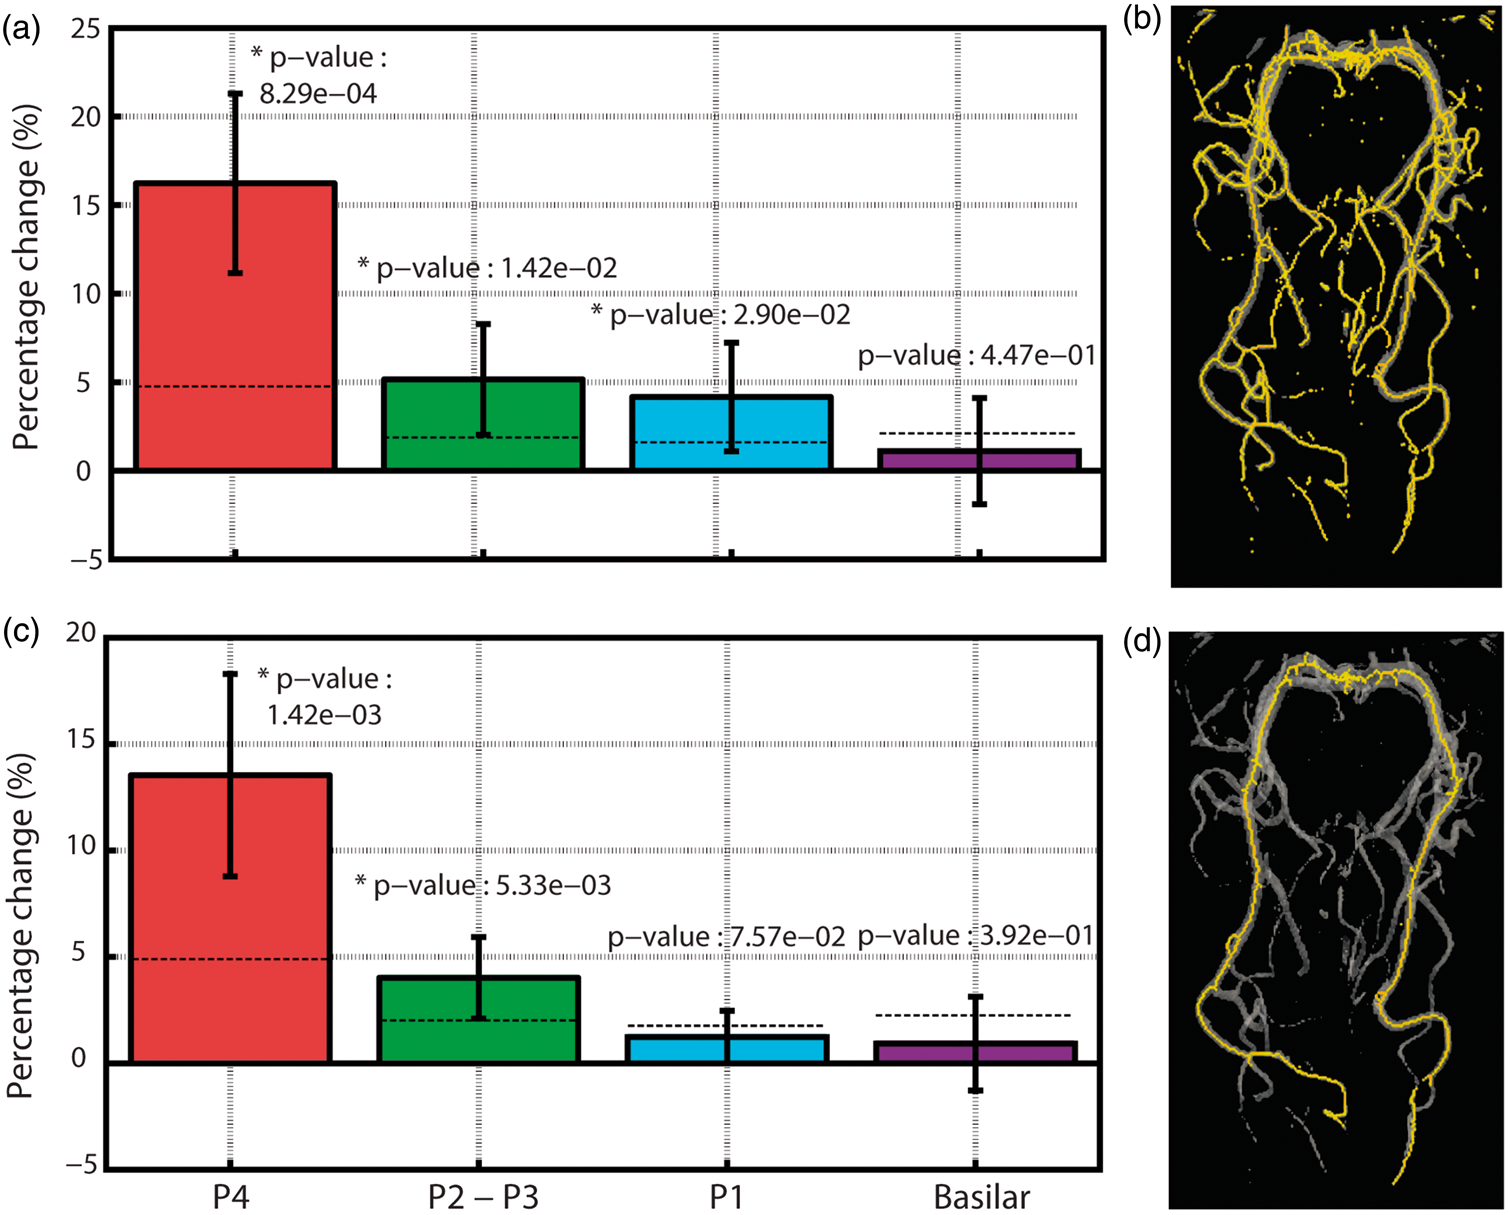
3D surface of the reconstructed cerebral vessels for PCA (a–b) and MCA (c–d). Images on the right highlight the different anatomical subdivisions of the PCA (b) and MCA (d). (a) Sagittal MIP of the scout TOF MRA used for initial localization of the PCA and MCA. Axial view of the PCA at baseline (b) and visual stimulation (c). Yellow arrows represent vessels that are enhanced during stimulation (8.37 ± 3.96% of the volume). (d) Intersection of the segmentation mask of (b) and (c) is shown in green. In this study, only vessels visible in both baseline and stimulation were retained for diameter estimation. Group-average stimulus-induced changes in the vessel diameter for different PCA subdivisions with (a–b) and without (c–d) branching. Yellow areas in (b–d) represent voxels used for the analysis. Note how stimulus-induced vasodilation values are larger when including smaller branching vessels (a–b) compared to when the analysis is carried out on the main trunk of the PCA (c–d). To minimize the contribution from the smaller PCA branches shown in (b), all subsequent results are based on the non-branching PCA reconstruction (d). The dark dashed line represents the average absolute % change computed from random pairs of single-trial baseline PCA images. This provides an estimate of diameter changes driven by small registration errors, changes in baseline physiology, etc. The average errors for each segment were: P4 (4.76%), P2–P3 (1.87%), P1 (1.61%) and BA (2.11%). In both with- and without-branching analysis, stimulus-induced vasodilation in P4 and P2-P3 was larger than that expected by chance.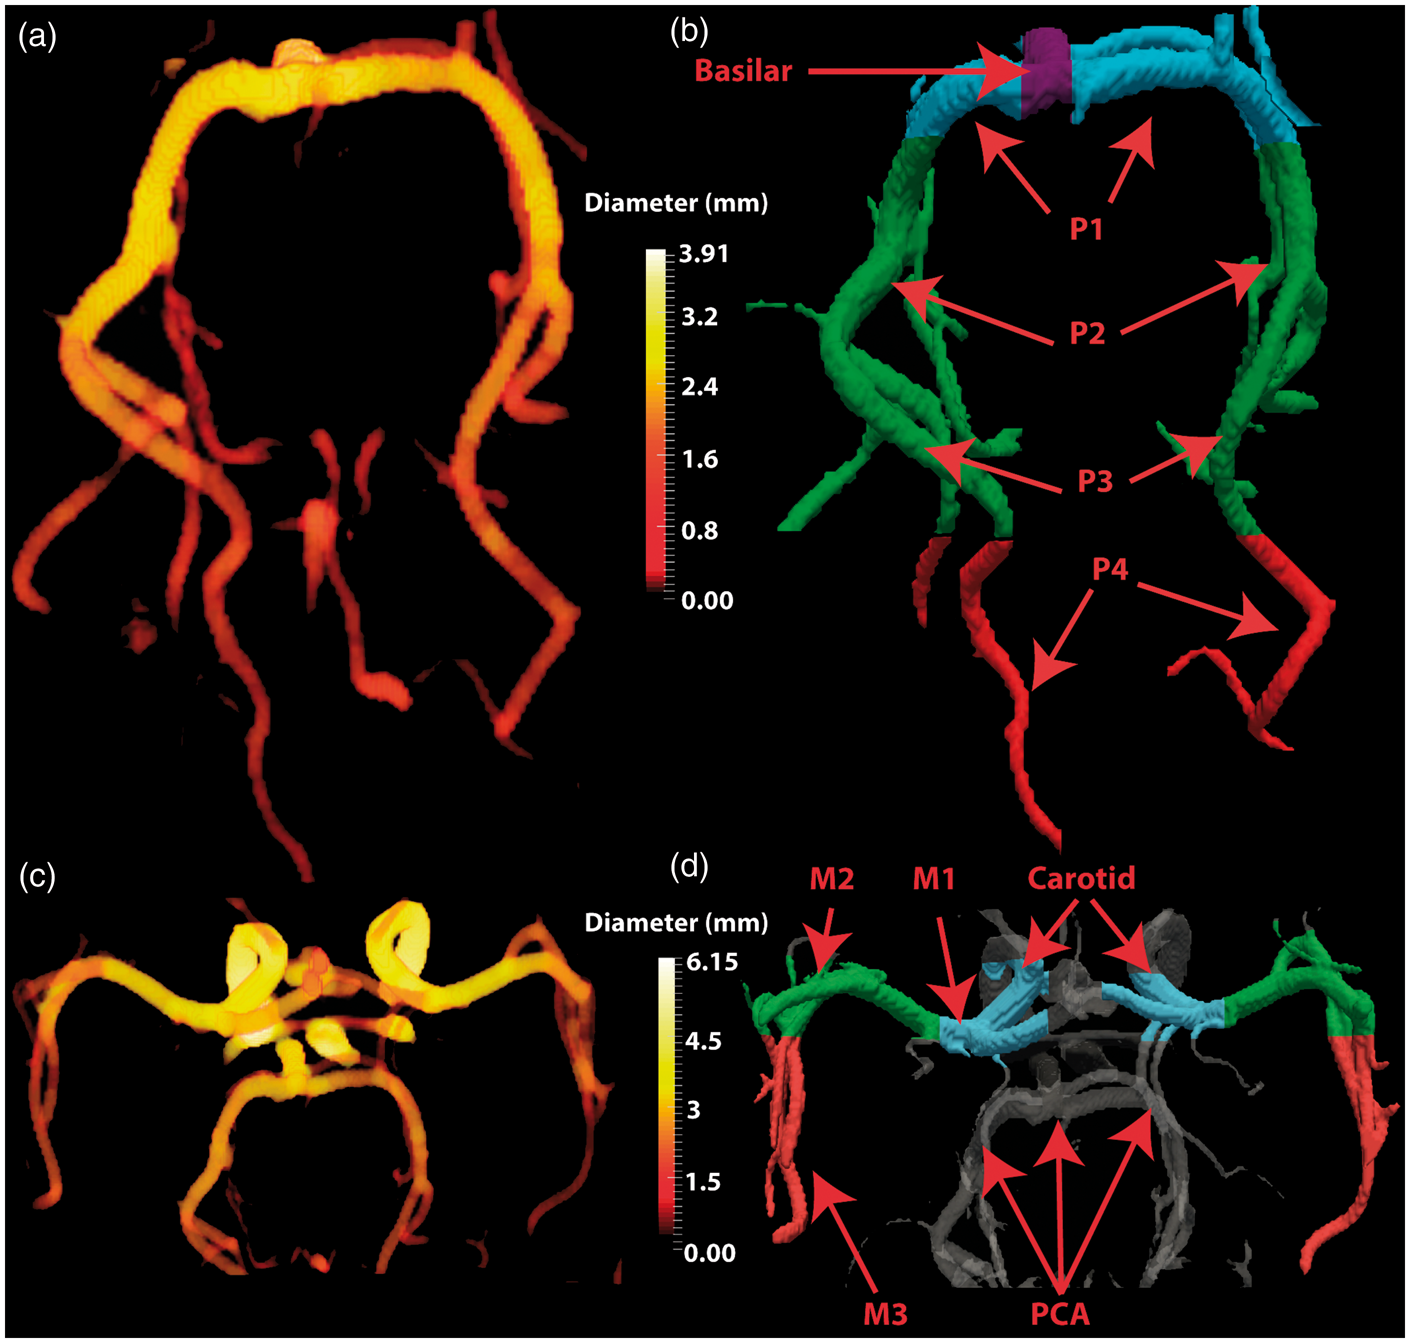
In each subject, the voxel representing the most distal portion of the PCA was manually selected independent of the branches (calcarine or parieto-occipital). Afterward, the distance relative to this point was computed along the main trunk of the segmented PCA by summing up the distance between neighbouring voxels within the segmentation. This allowed us to estimate vasodilation along the PCA as a function of distance from the closest point of the visual cortex.
4D Flow acquisition and analysis
One limitation in estimating vessel diameter from TOF MRA is that increased blood velocity may lead to partial volume effects by increasing the intensity near the vessel wall (border) and potentially lead to an overestimation of diameter.
29
In an attempt to account for this, we also measured visually induced changes in blood velocity in four subjects (one female) using a 4D Flow acquisition
30
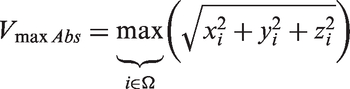
(224 × 224 × 27, TR = 6.8 ms, TE = 4.1 ms, velocity encoding (Venc) = 70, acquisition resolution of 1.1 × 1.1 × 1.1 mm, observed acquisition time between 6 min and a half to 10 min) that provides a voxel-based, cardiac-gated velocity profile reconstructed at a temporal resolution corresponding to 40 cardiac phases. The 4D flow image, covering the same region as the TOF MRA, was acquired during rest (eyes closed) and during visual stimulation. We selected a high Venc to obtain a stronger signal in the larger vessels such as BA, P1 and P2. Due to our resolution and Venc selection, P3 or P4 segments were not visible. Both images were co-registered and then resampled and registered to the TOF MRA to allow a voxel-wise comparison of stimulus-induced changes in velocity and diameter, respectively. In each voxel, velocity was defined as
Lastly, PCA and MCA vessels were classified into distinct anatomically defined segments by a resident in radiology (author: MH) to provide a generalized account of stimulus-induced changes in vasodilation and velocity (see Figure 1(b) and (d)). For the remainder of this article, these classifications are defined as clusters. All statistical testing was carried out using a paired student’s t-test with statistical significance set to P < 0.05 using Matlab (Mathworks).
Results
PCA and MCA diameter comparison between baseline and stimulus.
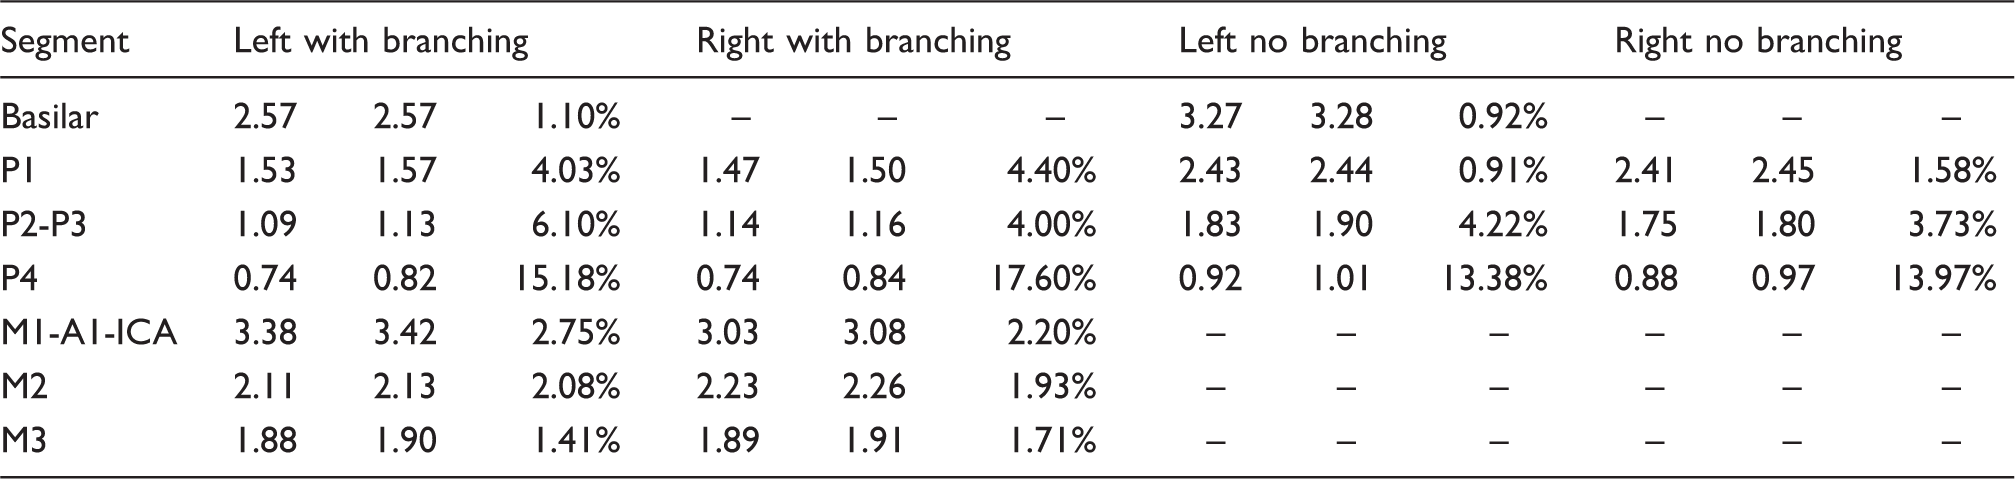
Note: First column shows the average baseline diameter in mm; second is the average diameter of the stimulus image in mm; and third one shows the average percent change computed in every voxel as shown in Figure 3 (except results are separated for left and right hemispheres). Slight differences in BA and P1 with- and without-branching are likely due to small branching from posteromedial and thalamoperforating arteries (For full subject data refer to Table S1–S3).
PCA: posterior cerebral arteries; MCA: middle cerebral arteries; Base: baseline; Stim: stimulation.
An example of the stimulus-induced vasodilation effect is shown in Figure 2 with a maximum intensity projection (MIP) of the baseline and stimulus PCA from one subject (Figure 2(b) and (c). Note the smaller vessels near the posterior portion of the PCA that are only visible during visual stimulation (yellow arrows in Figure 2(c)). On average, visual-stimulation increased the number of ‘new’ voxels identified as vessels in the segmentation by 8.37 ± 3.96%.
When restricting the analysis to vessels segmented in both baseline and stimulus conditions (green mask in Figure 2(d)), we found that visual stimulation significantly increased PCA diameter in all of its four major subdivisions (Figure 3(a)). The vasodilation was strongest in posterior PCA (∼16% in segment P4) and decreased to ∼1% in the basilar segment. The same trend was observed when limiting the analysis to voxels within the main trunk (i.e. no branching) of the PCA (Figure 3(c) and (d)), though the effect was marginally reduced. More specifically, the average dilation in segment P1 was reduced from ∼4% to ∼1% when excluding its smaller branches from the analysis. This demonstrates that many of the smaller vessels branching from the PCA dilate during visual stimulation. On average, 60.30 ± 18.84% of the main trunk of the PCA showed dilation, 15.65 ± 10.91% remained invariant and 24.06 ± 19.25% showed constriction. Both relative (Figure 3(a)) and absolute (Figure S3) stimulus-induced increases in P1, P2–P3 and P4 diameters were significantly greater than zero (P < 0.05). To further validate the significance of these results, we computed diameter differences between random pairs of single baseline trial images and took the average of their absolute value, thus providing % change values expected by chance (i.e. due to errors associated with vessel segmentation, image registration, changes in baseline physiology, etc.). Here, segments P4 and P2–P3 still showed vasodilation values greater than chance, while P1 did not (see dashed lines in Figure 3(c)) and similar results were obtained for absolute diameter differences (Figure S3).
The above results demonstrate that visual stimulation not only dilates the posterior portion of the PCA (segment P4) near the occipital lobe but also the more distant anterior segments (segment P2–P3). To better quantify this result, we sorted PCA voxels based on their distance from a fixed point near the visual cortex (Figure 4(a)). The results from a single subject are shown in Figure 4(b) and (c) and the group-average is shown in Figure 5.
(a) Representation of the right part of the PCA color-coded based on distance from the green sphere along with corresponding baseline diameter (b) and stimulus-induced diameter changes (c). Data are from one representative subject. Red points represent voxels in the left PCA, blue points from right PCA. Group-average changes in vessel diameter induced by visual stimulation. The notation is the same as Figure 4(c), though data are averaged across all subjects. Shaded red area represents distances at which stimulus-induced vasodilation was significantly greater than 5% (P < 0.05). Shaded blue area represents distances at which stimulus-induced vasodilation was significantly greater than 0% (P < 0.05). Distances were divided into 20 equal bins. Error bars represent the standard deviation of each bin.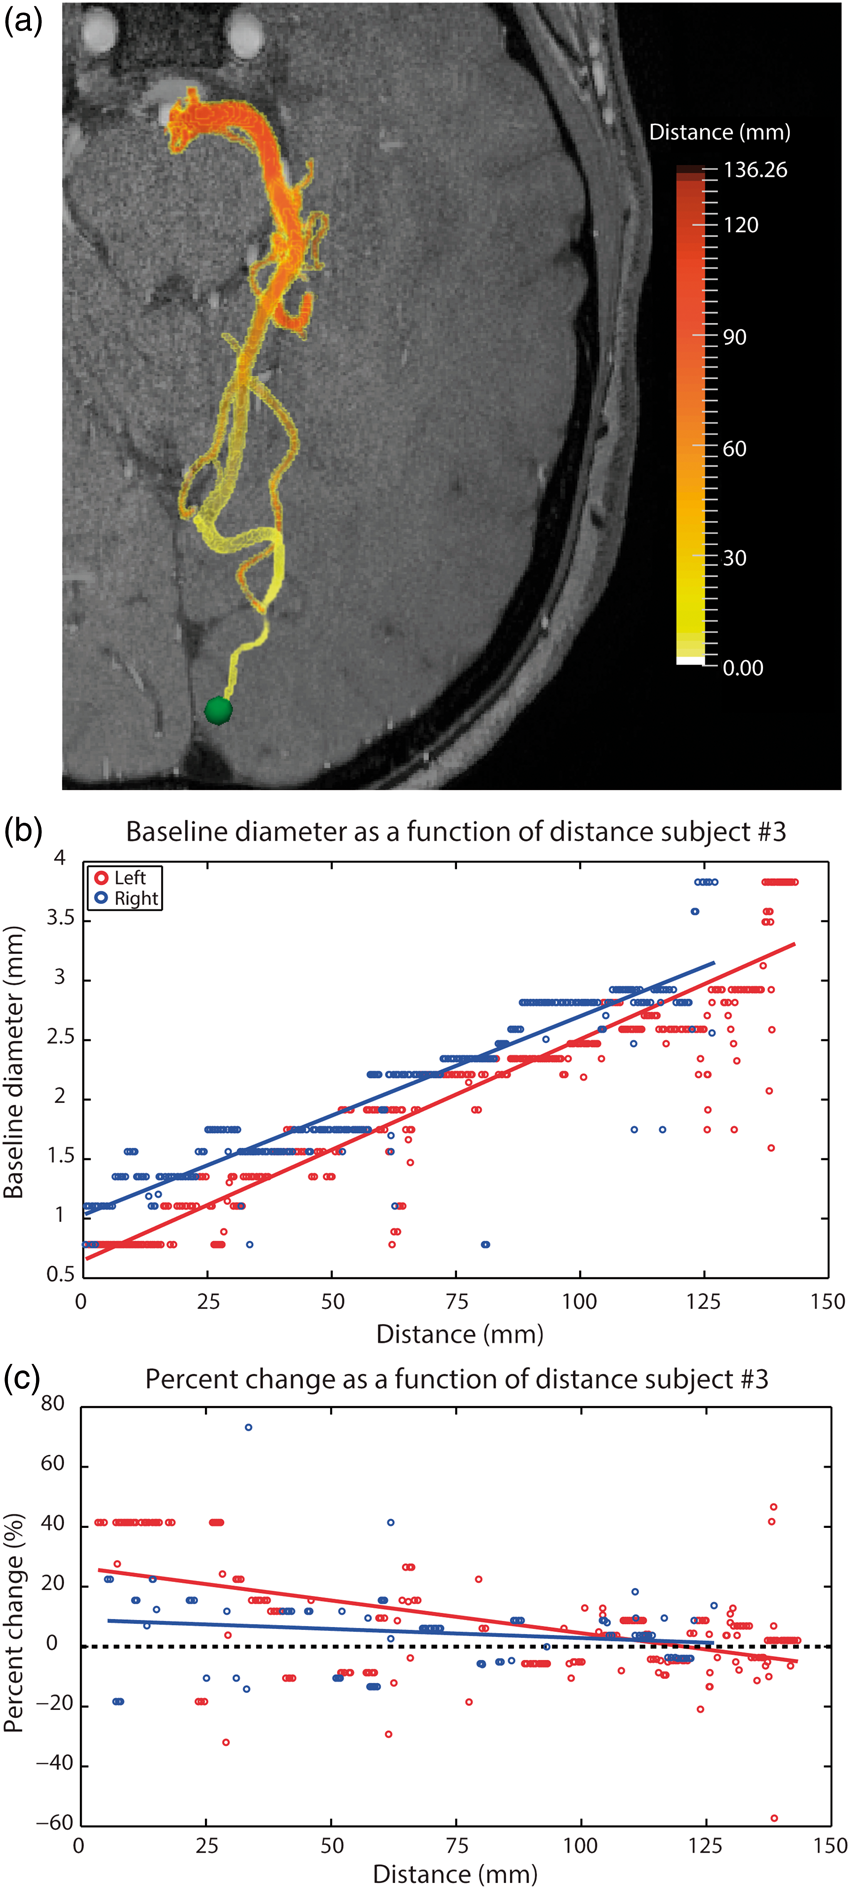
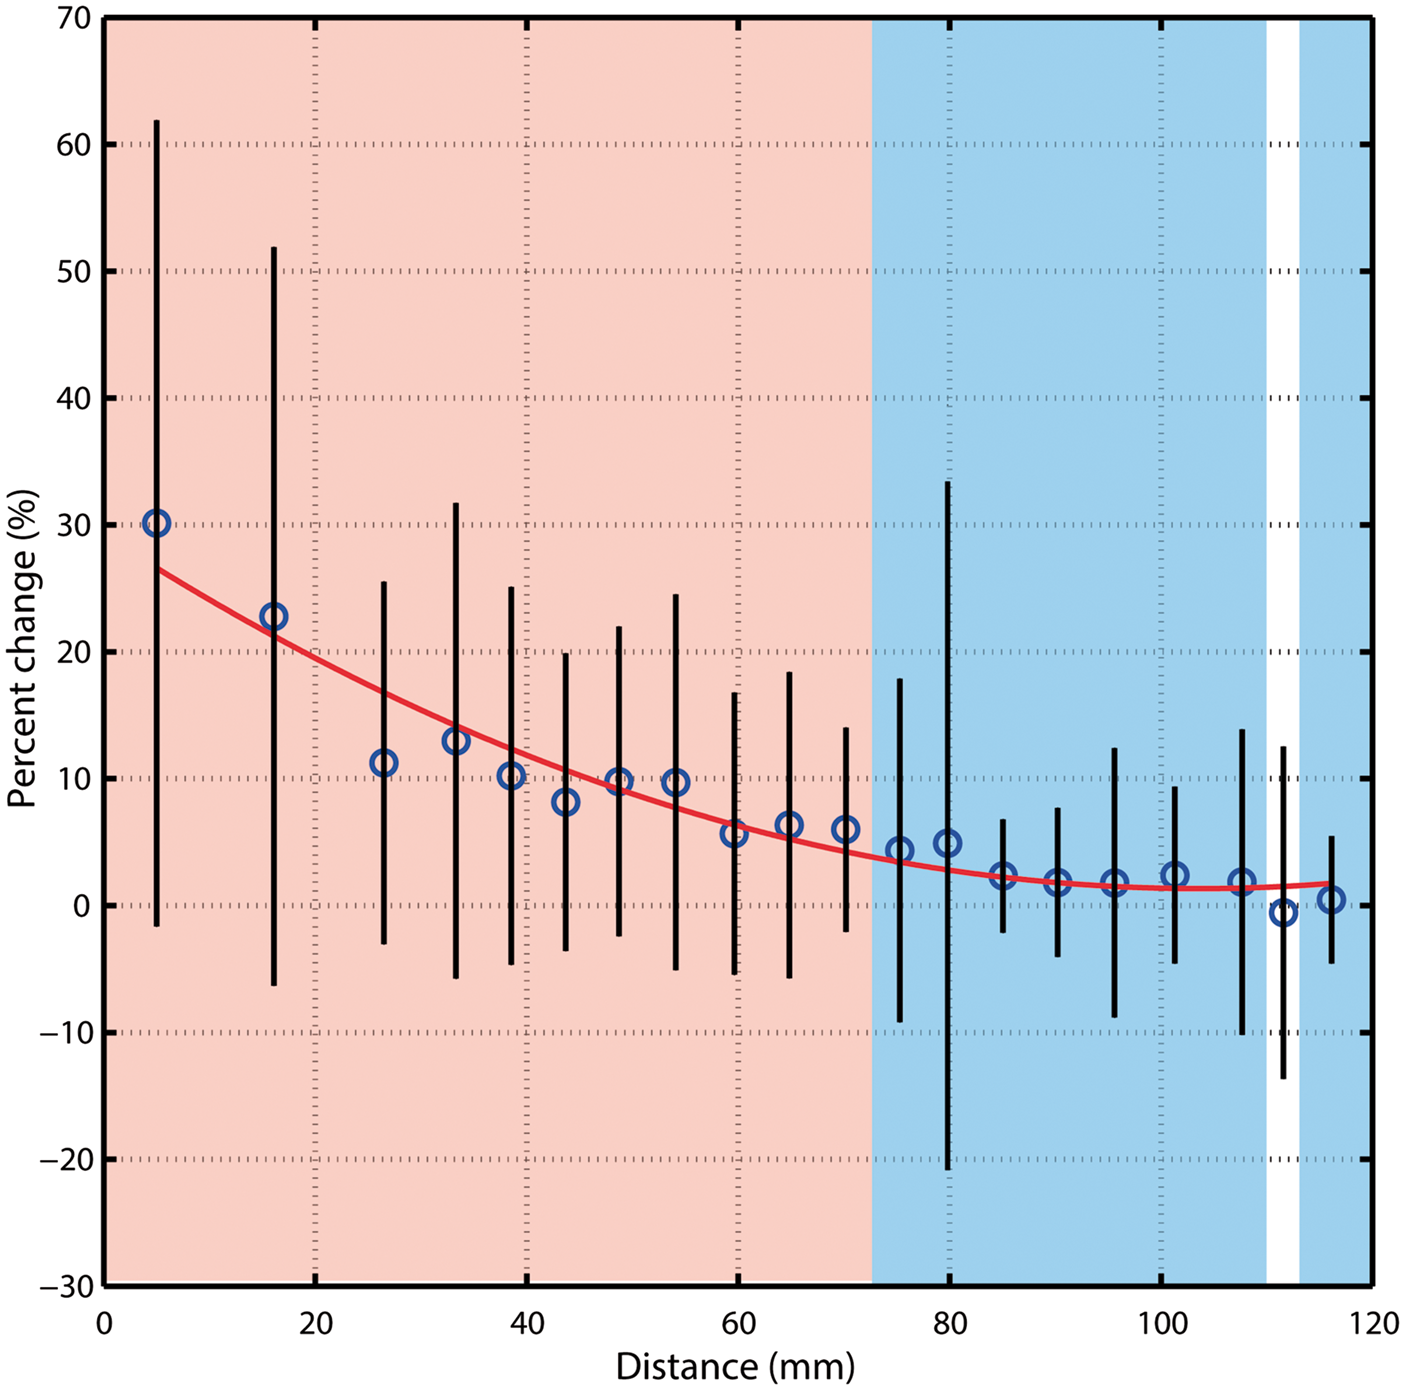
On average, stimulus-induced vasodilation was negatively correlated with distance (r = −0.58, Figure 4(c)) and decreased non-linearly with increasing distance from the visual cortex (Figure 5 and S4). The average vasodilation was ∼25% within the first 20 mm, quickly dropping to ∼5% at 70 mm from the visual cortex. Beyond this, stimulus-induced changes in the PCA diameter fell to <5%, which is less than that expected by chance (see Figure 3(c)).
As described in the methods, measures of vessel diameters that are derived from flow-based imaging techniques (such as the TOF-MRA used here) may be biased by blood velocity. To address this, we compared voxel-wise measures of stimulus-evoked changes in blood velocity with vasodilation along voxels in segments P1–P2. On average, visual stimulation increased blood velocity by an average of 14%, though the average correlation with vasodilation was weak (r < 0.18) (see Figure 6). This correlation could not be computed in the smaller vessels given the Venc value used in the 4D Flow acquisition.
Stimulus-induced vasodilation as a function of stimulus-induced changes in blood velocity. Data are taken from segments P1–P2 and the Pearson correlation coefficient is shown for all four participants. The 4D flow images were registered and upsampled to the resolution of 0.1 mm to match that used in diameter analysis.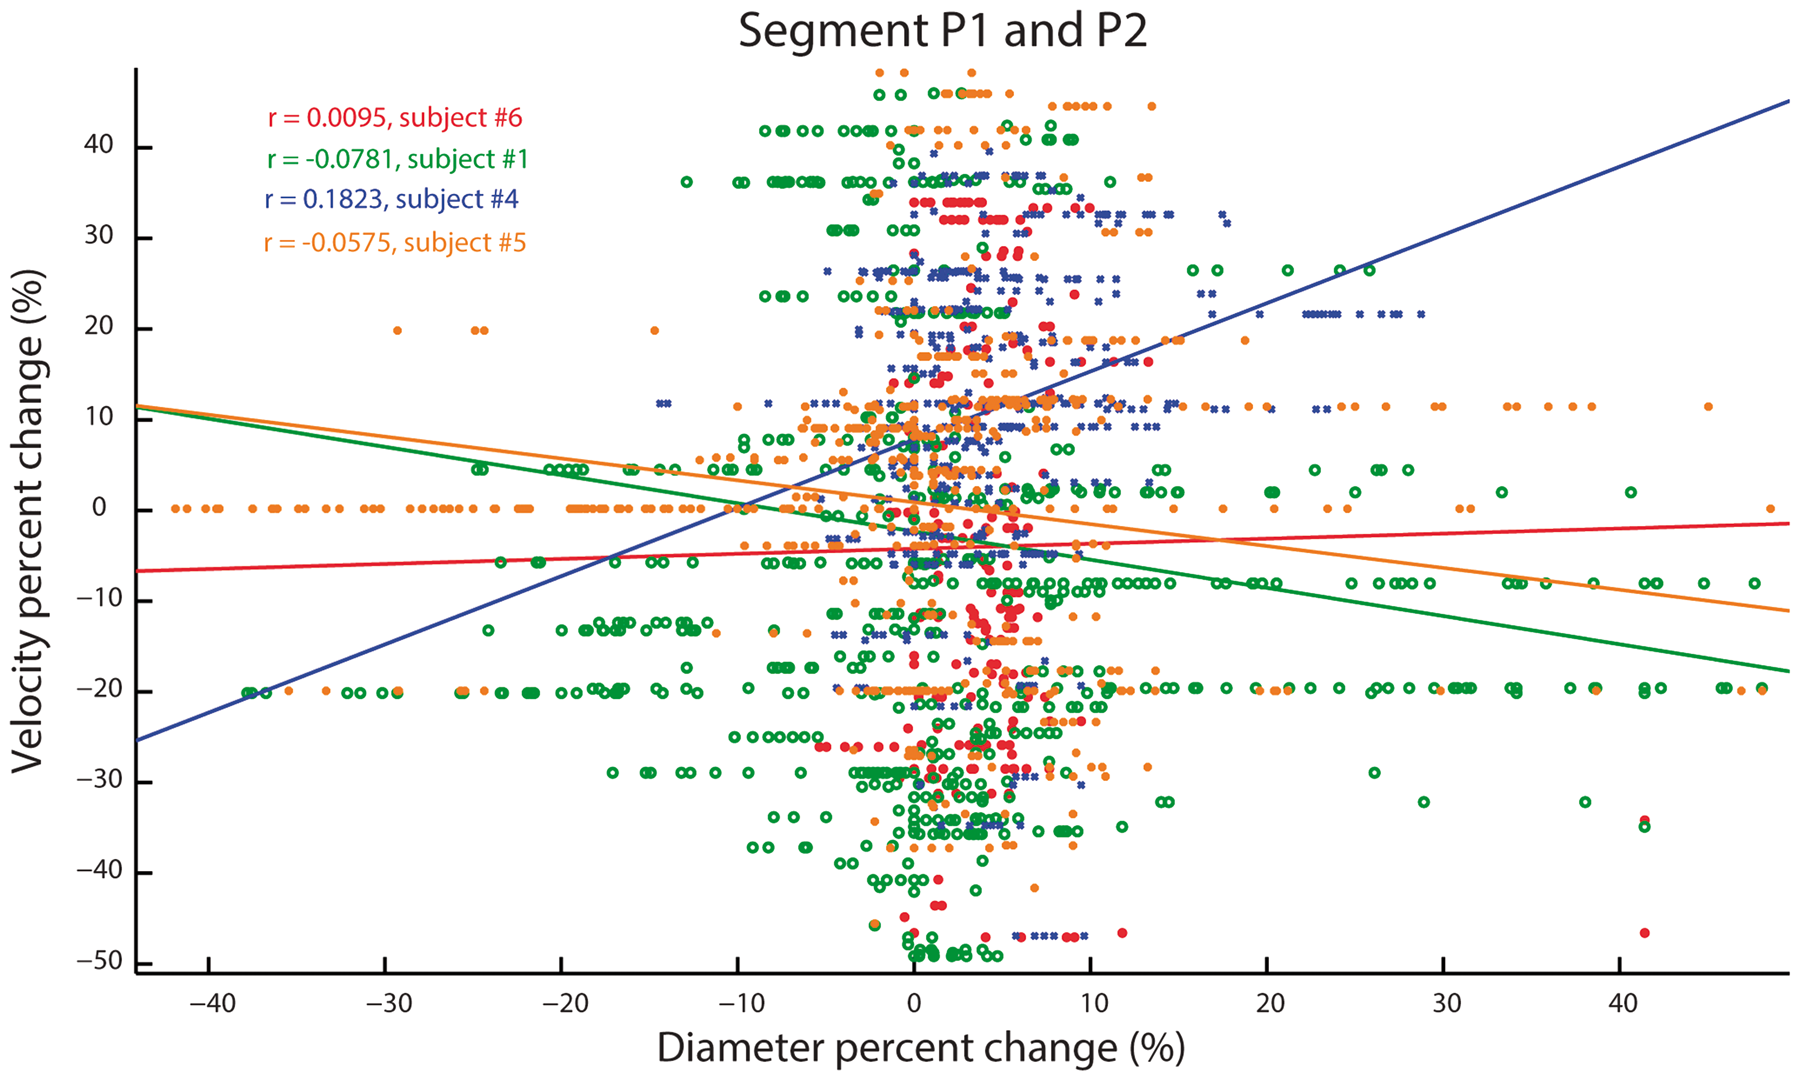
In addition, when limiting the analysis to P1–P2 segments whose diameter remained unchanged during stimulation (∼36% of all P1–P2 voxels), the average stimulus-induced velocity and signal intensity nevertheless increased by 10.83 ± 25.77 % and 3.17 ± 11.61%, respectively (Figure S5), suggesting that the diameter changes in this portion of the PCA were not completely driven by segmentation biases potentially induced by corresponding changes in velocity.
Discussion
In this study, we investigated how visual stimulation modulates vessel diameter in the human brain. To do so, we developed an automatic, non-invasive approach for estimating the diameter of the main artery (PCA) supplying the occipital lobe. Our results show that vessel dilation is not only confined to the small portion of the PCA near the visual cortex, but also the more anterior segments located ∼70 mm from the visual cortex. Overall, the majority of the PCA dilated in response to visual stimulation, indicating that stimulus-induced changes in vascular tone are not solely limited to vessels near the visual cortex.
Comparison with literature: Baseline PCA diameter
Our study describes an automatic approach for non-invasively estimating cerebral vessel diameter with minimal intervention required by the user. As a result, this approach can quickly generate whole-brain measures of vessel diameter on a voxel-by-voxel basis. As can be seen in Table 1, our diameter estimates for BA (∼3.2 mm) and P1 (∼2.4 mm) are well in-line with human post-mortem studies who report values within 3–6 mm and 1–4 mm, respectively 31 and previous MRA studies reporting ∼3 mm and ∼2 mm.32,33 The relatively small differences between our values may be due to age differences, the inherent limited sensitivity given our voxel resolution (0.4 mm) and/or artifacts inherent with the preparation of postmortem tissue. Importantly, our main interest was in the relative change in diameter induced by visual stimulation where several of the potential MR-related artifacts are further limited.
Stimulus-induced long-range vasodilation
Here, we found that the distal portion of the PCA (diameter between 0.6 mm and 1.6 mm) dilated by 13.53 ± 4.76%, whereas the larger proximal portion (diameter ∼ 3.27 ± 0.31 mm) dilated by 0.92 ± 2.21%. To our knowledge, we are the first to report stimulus-induced vasodilation along the entire human PCA, though our findings are consistent with those observed in human and animal studies. First, studies have shown that under electric stimulation, smaller cerebellar vessels dilated more than larger ones and that this dilation could be observed in segments located relatively far from the primary stimulation site 3 and recent studies in the cortex have reported similar results. 34 Similarly, another study measured stimulus-induced vasodilation along a single vessel (feed artery of the hamster’s cheek pouch) and also found that the smaller portion dilated more than the distant larger portion. 35 Importantly, they found that local stimulation dilated the distal portion (distance of 2000 um from primary stimulation site) from 63 um to 78 um (or a ∼23.8% change). In other words, vasodilation was evident at lengths equal to ∼ 32 (2000/63) times the baseline diameter. Considering our smallest resolvable diameter is 0.4 mm, a ∼23.8% vasodilation should be visible at ∼13 mm away (0.4 mm × 32 = 12.8 mm), which is indeed what we obtained at this distance (see Figure 5). In summary, our findings in humans build on those in animals whereby stimulus-induced vasodilation is not limited to vessels in the immediate vicinity of the area of stimulus-evoked activity (in our case, primary visual cortex) but also extends to more proximal vascular segment. 10
Potential mechanisms
The precise mechanisms underlying the observed long-distance vasodilation are unclear. One possible explanation is so-called propagated or conducted vasodilation. 36 Here, local vasodilation is believed to be initiated in the small vessels near the site of neuronal activation and to back-propagate through endothelium and/or smooth muscle-signaling to reach upstream larger arteries.5,37,38 The advantage of this mechanism is that it may maintain microvascular pressure and protect against local ischemia due to blood-stealing, though at the expense of perfusing a larger than needed cortical area. 9 This may explain why robust stimulus-evoked hemodynamic signals can be observed despite little to no changes in nearby neural activity.4,5 However, it should be noted that several factors limit the interpretation of retrograde vasodilation in the current study: First, presentation of natural scenes elicits neuronal responses in the lateral geniculate nuclei (LGN) of the thalamus whose blood supply comes mainly from thalamogeniculate arteries that branch from segment P2 of the PCA.39–42 We, therefore, cannot rule out that the dilation observed near P2 is due to the integration of conducted responses from local branching vessels feeding the LGN rather than a long-range conducted response originating in visual cortex. On the other hand, if local PCA dilations simply reflected nearby responses, one would expect P2 to dilate more than P3 (whose branches feed the temporal lobe), which was not the case. Therefore, the robust dilation in P1 and P3 coupled with the lack of dilation in MCA suggests that dilations along PCA are coordinated, though further study is needed to confirm this. Secondly, although we found that changes in blood velocity could not fully account for the vasodilation observed in segments P1–P2, in line with previous studies, 43 future studies employing a higher resolution and lower Venc value are needed to assess the impact of this effect on smaller vessels. Lastly, our TOF MRA images are acquired in ∼2 min, whereas studies have shown that sensory stimuli lead to a combination of dilatory and constrictive phases which can vary over shorter time scales. Our approach is thus limited in the sense that our measure of vasodilation represents a broad temporal average of several abrupt changes in vessel diameter. In short, further improvements in acquiring images of both human macro- and microvasculature may resolve some of these issues and improve our understanding of stimulus-induced changes in vascular tone.
Implications for brain imaging studies in health and disease
Our approach and findings have potential implications regarding how sensory stimuli affect cerebrovascular tone. On the more technical side, many modern MR-systems are equipped with screens for displaying visual stimuli. We suggest that presenting a movie to the patient during the TOF MRA acquisition may not only help in keeping the patient calm but also enhances smaller vessels that are normally invisible. Secondly, it may also help in isolating PCA segments that are damaged and/or partially occluded. For instance, it has been observed that highly localized disruption of the arterial wall (without full occlusion) was enough to interrupt conducting signals between endothelial cells and cause a clear reduction in blood flow (see Figure 2(e) in Chen et al. 5 ). Over time, this could lead to neuronal death and cognitive deficit despite no clear sign of full arterial occlusion. The combined TOF MRA-4D Flow approach described here could potentially be useful for detecting, where along the PCA visual stimulation ceases to modulate vessel diameter. This could potentially help elucidate the relative contributions of cerebrovascular factors in cognitive impairment and Alzheimer’s disease.44–46 That is, the precise mechanisms through which changes in neural activity lead to changes in vessel diameter and cerebral blood flow (CBF) are not fully understood. 47 Future studies combining measures of stimulus-induced diameter changes with other neuroimaging techniques such as arterial spin labeling (ASL), blood oxygen level dependent (BOLD) and susceptibility weighted imaging (SWI) are needed in order to better understand cerebral energetic in humans. 10 For example, studies using transcranial doppler (TCD) have shown that visual stimulation increases blood velocity through the anterior PCA segment by ∼20%14,20,48,49 despite our observation of less than 5% vasodilation. Future studies combining such measures with the one described here might help in better understanding the relationship between velocity and diameter. 10
Although our results are currently limited to the larger cerebral vessels and require three TOF-MRA acquisitions, they nevertheless suggest that a relatively simple and easily implemented methodology may provide a novel approach for studying neurovascular coupling in both healthy and patient populations.
Conclusion
In summary, our data indicate that visual stimulation increases the arterial diameter in the majority of the PCA including the proximal parts of the vessel. To our knowledge, this is the first observation in humans of the well-established conducted vasodilation observed in animal models. Future studies combining this approach with other modalities and stimuli may help in further understanding neurovascular coupling in humans.
Footnotes
Funding
The author(s) disclosed receipt of the following financial support for the research, authorship, and/or publication of this article: This researched was funded by the National Sciences and Engineering Council of Canada (NSERC) and Canada Research Chair Program.
Acknowledgements
Special thanks to Sukhmanjit Ghumman, Claudie Gauvreau and David Provencher for providing valuable input.
Declaration of conflicting interests
The author(s) declared following potential conflicts of interest with respect to the research, authorship, and/or publication of this article: Guillaume Gilbert is an employee of Philips Healthcare. All remaining authors declare that they have no conflict of interest.
Authors’ contributions
AB, MD, CB and KW conceived the study, analyzed the results and wrote the manuscript. GG designed and implemented the MR sequences. MB and MH helped with data analysis and interpretation.
References
Supplementary Material
Please find the following supplemental material available below.
For Open Access articles published under a Creative Commons License, all supplemental material carries the same license as the article it is associated with.
For non-Open Access articles published, all supplemental material carries a non-exclusive license, and permission requests for re-use of supplemental material or any part of supplemental material shall be sent directly to the copyright owner as specified in the copyright notice associated with the article.