
Abstract
In the quantification of positron emission tomography (PET) radiotracer binding, a commonly used method is reference tissue modeling (RTM). RTM necessitates a proper reference and a ubiquitous choice for G-protein coupled receptors is the cerebellum. We investigated regional differences in uptake within the grey matter of the cerebellar hemispheres (CH), the cerebellar white matter (CW), and the cerebellar vermis (CV) for five PET radioligands targeting the serotonin system. Furthermore, we evaluated the impact of choosing different reference regions when quantifying neocortical binding. The PET and MR images are part of the Cimbi database: 5-HT1AR ([11C]CUMI-101, n = 8), 5-HT1BR ([11C]AZ10419369, n = 36), 5-HT2AR ([11C]Cimbi-36, n = 29), 5-HT4R ([11C]SB207145, n = 59), and 5-HTT ([11C]DASB, n = 100). We employed SUIT and FreeSurfer to delineate CV, CW, and CH and quantified mean standardized uptake values (SUV) and nondisplaceable neocortical binding potential (BPND). Statistical difference was assessed with paired nonparametric two-sided Wilcoxon signed-rank tests and multiple comparison corrected via false discovery rate. We demonstrate significant radioligand specific regional differences in cerebellar uptake. These differences persist when using different cerebellar regions for RTM, but the influence on the neocortical BPND is small. Nevertheless, our data highlight the importance of validating each radioligand carefully for defining the optimal reference region.
Introduction
Positron emission tomography (PET) allows for the visualization of the density of neurotransmitter receptors and transporters and is one of the key tools for in vivo imaging. PET is used to quantify neuroreceptor density in the human brain using binding potential as a metric. Binding potential is defined as the concentration of a radioligand specifically bound to a target receptor divided by a reference concentration at equilibrium. In general, three different reference concentrations can be used: (1) free (non-protein-bound) radioligand concentration in plasma, (2) total (free plus protein-bound) radioligand concentration in plasma and (3) nondisplaceable radioligand (i.e. the non-specifically-bound radioligand plus the free ligand in tissue). Each of these references represents a balance between interpretability and convenience.
The first two methods require measuring the radioligand concentration in plasma, which necessitates arterial blood measurements (venous blood sampling is possible in some cases). However, the invasiveness of a required arterial line hampers its feasibility in a clinical setting. Furthermore, the measurements of the parent (nonmetabolized) radioligand in plasma can be challenging and labor-intensive. The nondisplaceable method, on the other hand, does not require blood sampling, but merely requires a region that is free of the target of interest. This region then represents the non-displaceable concentration and can be determined using the measured PET image. There have been several methods developed to compute the binding potential using a reference region; collectively, these are known as reference tissue models (RTM). 1 The binding potential computed relative to the nondisplaceable concentration is referred to as BPND.
An RTM, however, necessitates a proper reference region. RTMs have three basic assumptions: (a) the reference region is devoid of the target of interest; (b) the nondisplaceable binding, VND, is the same for both the target region and the reference region; (c) and the blood volume contribution is negligible in both the reference and target regions. The quantification will be biased if these assumptions are violated, and the bias may not be a simple scaling factor. 2 For G-protein coupled receptors, such as those in the serotonin and dopamine systems, the cerebellum is often used as the reference region as it is assumed to be receptor-free. However, studies of serotonin receptors suggest that some subregions of the cerebellum may not be receptor-free; properly identifying these subregions may be important when using cerebellum as a reference region.3,4
The cerebellum can be subdivided into several subregions that may vary in terms of their uptake and hence their suitability as a reference tissue. A subregion of specific interest in serotonin imaging is the cerebellar vermis (CV). It can be defined in different ways, but is mostly used to indicate the “midline” of the cerebellum. 5
In order to shed more light on possible uptake heterogeneity in the cerebellum, examine the use of cerebellum as a reference region, and specifically the properties of CV, we utilized the Center for Integrated Molecular Brain Imaging (Cimbi) database 6 to investigate regional differences in uptake as well as their influence on the quantification of neocortical nondisplaceable binding for five different PET radioligands targeting the serotonin system.
Materials and methods
Participants
The Cimbi database 6 established normative data for the 5-HT1A, 7 5-HT1B, 8 5-HT2A, 9 and the 5-HT4 10 receptors as well as the 5-HTT. 12 We selected data of healthy controls for five radioligands targeting these receptors and the serotonin transporter. 11 All subjects were scanned on a Siemens high-resolution research tomography (HRRT) PET scanner. Corresponding T1-weighted structural magnetic resonance (MR) scans were acquired on four different Siemens MR scanners with standard parameters. Demographic details about the participants can be seen in Table 1 of the supplementary material. All Cimbi studies were approved by the ethics committee for the Capital Region of Denmark and the Danish Data Protection Agency prior to initiation. All procedures followed were in accordance with the ethical standards of the responsible committees on human experimentation (institutional and national) and with the Declaration of Helsinki 1975, as revised in 2008. Informed consent was obtained from all patients for being included in the study.
Positron emission tomography and structural magnetic resonance imaging
The PET and MR images used in our analysis are all part of the Cimbi database. In detail the following PET scans were available for analysis: 5-HT1AR ([11C]CUMI-101, n = 8), 5-HT1BR ([11C]AZ10419369, n = 36), 5-HT2AR ([11C]Cimbi-36, n = 29), 5-HT4R ([11C]SB207145, n = 59), and 5-HTT ([11C]DASB, n = 100).
One of the [11C]CUMI-101 subjects underwent a pindolol blocking scan. Oral pindolol administration started three days before scanning: 3 times per day (2.5 mg × 3 on 1st day, 5 mg × 3 on the 2nd day, and 7.5 mg × 3 on the 3rd day), 7.5 mg in the morning of scanning, and 7.5 mg 1 h before scanning. Additionally, we included ketanserin blocking scan data from four [11C]Cimbi-36 scanned subjects, originally described in Ettrup et al. 9 Arterial input functions were available for all blocking as well as the corresponding baseline scans.
PET list-mode data were acquired with a Siemens HRRT scanner operating in 3D-acquisition mode, with an approximate in-plane resolution of 2 mm. PET frames were reconstructed using a 3D-OSEM-PSF algorithm.13–15 Scan time and frame length was tracer dependent, see Knudsen et al. 6 for details. Realignment of dynamic PET frames was performed using AIR 5.2.5 16 to account for within-scan motion. A rigid realignment transform was evaluated for individual frames believed to have sufficient count statistics. Frames were smoothed using a 10 mm Gaussian filter, and voxels less than 80% of the maximum intensity were discarded. The remaining voxels were used to evaluate the rigid transformation to the reference frame using least-squares intensity rescaling as the cost-function. The original frames were finally realigned by applying the rigid transformation. Frames with lower count statistics were aligned accordingly to the first or last realigned frame. Details of the realignment procedure can be found in Table 2 of the supplementary material.
Structural MRIs were acquired on four different Siemens scanners—two Siemens Verio, a Siemens Prisma, and a Siemens Trio. The detailed acquisition parameters can be found in the supplementary material. The structural MRI data were analyzed with FreeSurfer (v5.3)
17
to define tissue types and regions, including cortical grey matter. The individual cortical surfaces were reconstructed using the structural MRI corrected for gradient nonlinearity. PET-MR co-registration was estimated using boundary-based registration
18
between the time-weighted sum of the PET time activity curves (TACs) and the structural MRI.
19
FreeSurfer was used to define a segmentation of the cerebellum in grey and white matter (Figure 1). Additionally, we employed the software package SUIT 2.7
20
to segment the cerebellum into subregions namely cerebellar hemispheres (CH), the cerebellar white matter (CW), and the cerebellar vermis (CV) (also see Figure 1). The CH was defined as those voxels in the cerebellum that were not labelled as CW or CV. Finally, grey matter cerebellar labels were further refined by limiting them to the intersection of the FreeSurfer labels with the cerebellum labeled by SUIT. This removes peripheral overlabeling sometimes present in the FreeSurfer as well as the SUIT segmentation.
The cerebellar hemispheres are segmented in CH (yellow) and cerebellar white matter (blue) by FreeSurfer, while CV is delineated along the midline with SUIT (red). The peripheral overlabeling by using outliers of the intersection of SUIT and FreeSurfer are shown in pink.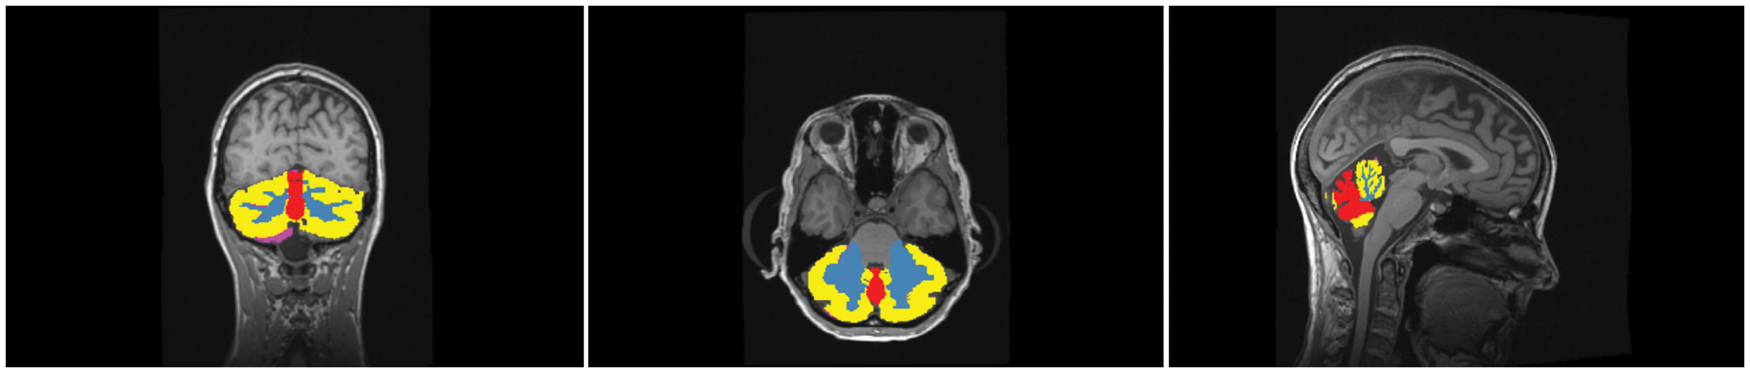
Analysis
We computed the volume of CV, CH, and CW by counting the number of voxels in each segmented region and dividing by the size of the voxels in the segmentation. For each subject we quantified a measure of radioligand uptake in CV, CH, and CW as well as the total cerebellum (total Cb), which comprised the sum of the other three regions. The mean standard uptake values (SUV) weighted by the frame length was used as a measure of brain uptake, where SUV is defined as the TAC in the region-of-interest divided by injected dose per kg bodyweight (g/mL). 21
Additionally, we calculated the neocortical BPND with the simplified reference tissue model (SRTM), 22 where we used CV, CH, CW, or total Cb as reference region, respectively. Regional TACs were used for the quantification. We are aware of the fact that we are violating the assumptions for SRTM if CV has specific binding and additionally is a small region, but since SRTM is commonly used to quantify non-displaceable binding potential, we want to assess the bias that including CV yields when using SRTM.
Regarding the blocking data, we performed arterial input modeling using a two-tissue compartment model with four parameters for the [11C]CUMI-101 blocking as well as baseline scan. For the four [11C]Cimbi-36 baseline and blocking scans, we employed a two-tissue compartment model with five parameters for arterial modeling, as done in the original publication. 9
Statistical difference was assessed within subjects and with paired nonparametric two-sided Wilcoxon signed-rank tests using Matlab (Mathworks Inc., MA, vers. R2013a). Correction for multiple comparison was done over all 60 pairwise tests via false discovery rate (FDR) < 0.05. 23
Results
In our segmentations, total Cb had on average a volume of 147 ± 15 cm3 in our population of 232 young healthy adults (for age ranges see Table 1 of the supplementary material).
Looking at the subregions, CV had an average volume of 6 ± 0.7 cm3, CH had an average volume of 110 ± 12 cm3, and CW was 31 ± 4 cm3. Hence, CV comprises about 4% of the cerebellum, CH covers 75%, and the white matter covers 21% of the whole cerebellum in our dataset.
Regarding differences in cerebellar uptake and neocortical binding potential based on different reference region definitions, we give an overview of the results in Table 3 of the supplementary material.
Figure 2 shows the differences in mean SUV for CH, CV, CW, and total Cb. A significant difference between CH and CV was found for [11C]CUMI-101, [11C]AZ10419369, [11C]Cimbi-36, and [11C]DASB . We found no significant difference in uptake between CH and CV for [11C]SB207145. The difference in uptake between CV and CH ranges from 7% to 20% for [11C]CUMI-101, 0 to 17% for [11C]AZ10419369, 0 to 8% for [11C]Cimbi-36, and 0 to 16% for [11C]DASB. Furthermore, we observed significant differences between CH and CW for all tracers and, consequently, also between CW and total Cb since CH as mentioned above covers 75% of the total Cb. The difference in uptake between CH and CW ranges from 17% to 30% for [11C]CUMI-101, 0 to 25% for [11C]AZ10419369, 0 to 12% for [11C]Cimbi-36, 0 to 14% for [11C]SB207145, and 2% to 17% for [11C]DASB. Finally, we saw significant lower uptake in CW than in CV in the case of [11C]CUMI-101, [11C]Cimbi-36, [11C]SB207145, and [11C]DASB. The difference in uptake between CV and CW ranges from 32% to 62% for [11C]CUMI-101, 3% to 17% for [11C]Cimbi-36, 0 to 15% for [11C]SB207145, and 0 to 10% for [11C]DASB.
Differences in meanSUV for the four regions – cerebellar gray matter in the hemispheres (CH), cerebellar vermis (CV), cerebellar white matter (CW), and total cerebellum (total cb). The box plot displays the mean, the whiskers extend to ± one standard deviation, and all values are plotted as dots individually. Significance of within subjects, paired nonparametric two-sided Wilcoxon signed-rank tests is given by *p < 0.05, **p < 0.01, ***p < 0.001 after correction for multiple comparisons via false discovery rate (FDR) < 0.05.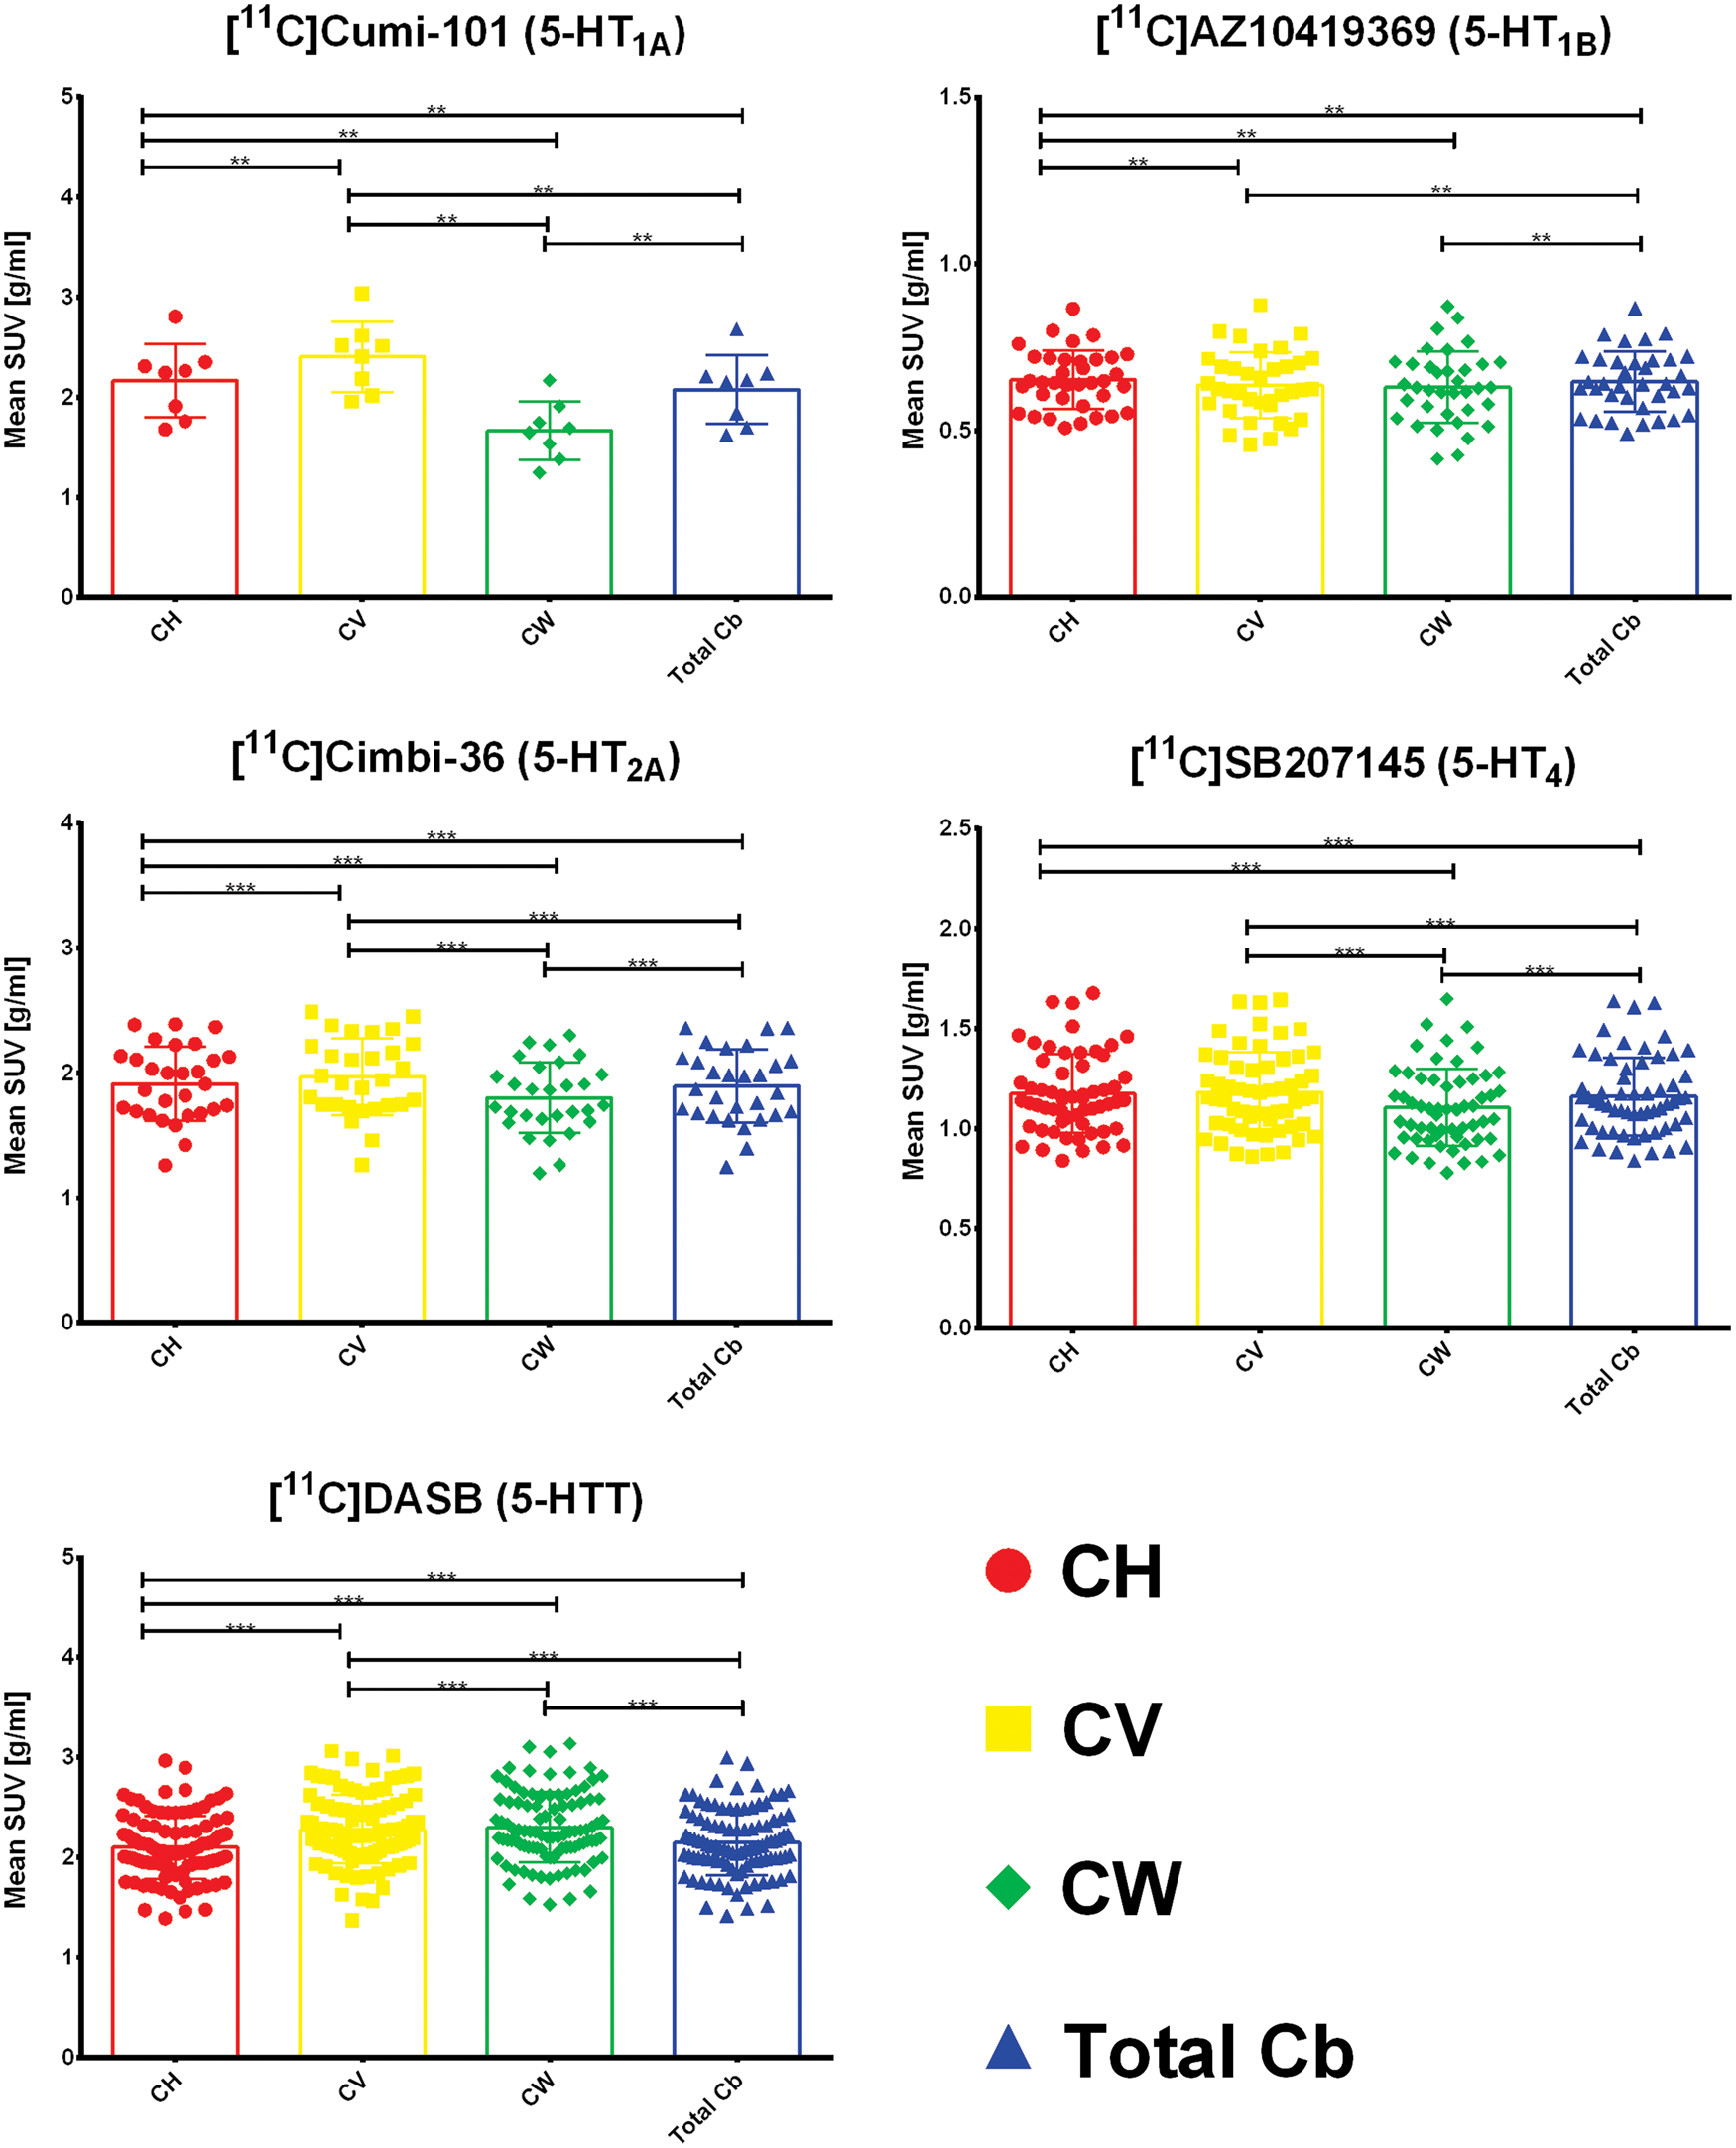
Next, we calculated neocortical BPND using different reference regions, where we used CH, CV, CW, or total Cb as reference and employed a simplified reference tissue model. The mean and standard deviation of neocortical BPND are given in Table 4 of the supplementary material. For [11C]DASB the modeling failed for CW for some patients and hence that region had to be excluded from the assessment. Figure 3 shows the differences in neocortical BPND based on simplified reference tissue modeling based on the four different regions. A significant difference in BPND when using CH or CV as reference region was found for [11C]CUMI-101, [11C]AZ10419369, and [11C]DASB. We found no significant differences in BPND using CH or CV for [11C]Cimbi-36 and [11C]SB207145. When only using the CV as the reference region, the effect size on the neocortical BPND is large: The difference in BPND based on CV and CH ranges from 2% to 23% for [11C]CUMI-101, 0 to 43% for [11C]AZ10419369, and 0 to 62% for [11C]DASB. Furthermore, we observed significant differences between CH and CW for [11C]CUMI-101, [11C]Cimbi-36, and [11C]SB207145 and, consequently, also between CW and total Cb. The difference in BPND based on CH and CW ranges from 30% to 70% for [11C]CUMI-101, 0 to 25% for [11C]Cimbi-36, and 0 to 27% for [11C]SB207145. For [11C]AZ10419369, there was no difference between the neocortical binding derived based on CH and CW. Finally, all tracers for which the modeling based on CW was available showed a significantly different neocortical binding based on CV and CW. The difference in BPND based on CV and CW ranges from 32% to 52% for [11C]CUMI-101, 0 to 28% for [11C]AZ10419369, 0 to 47% for [11C]Cimbi-36, and 0 to 17% for [11C]SB207145.
Differences in neocortical BPND based on simplified reference tissue modeling with the four regions – cerebellar gray matter in the hemispheres (CH), cerebellar vermis (CV), cerebellar white matter (CW), and total cerebellum (total cb). The box plot displays the mean, the whiskers extend to ± one standard deviation, and all values are plotted as dots individually. Significance of within subjects, paired nonparametric two-sided Wilcoxon-signed rank tests is given by *p < 0.05, **p < 0.01, ***p < 0.001 after correction for multiple comparisons via false discovery rate (FDR) < 0.05.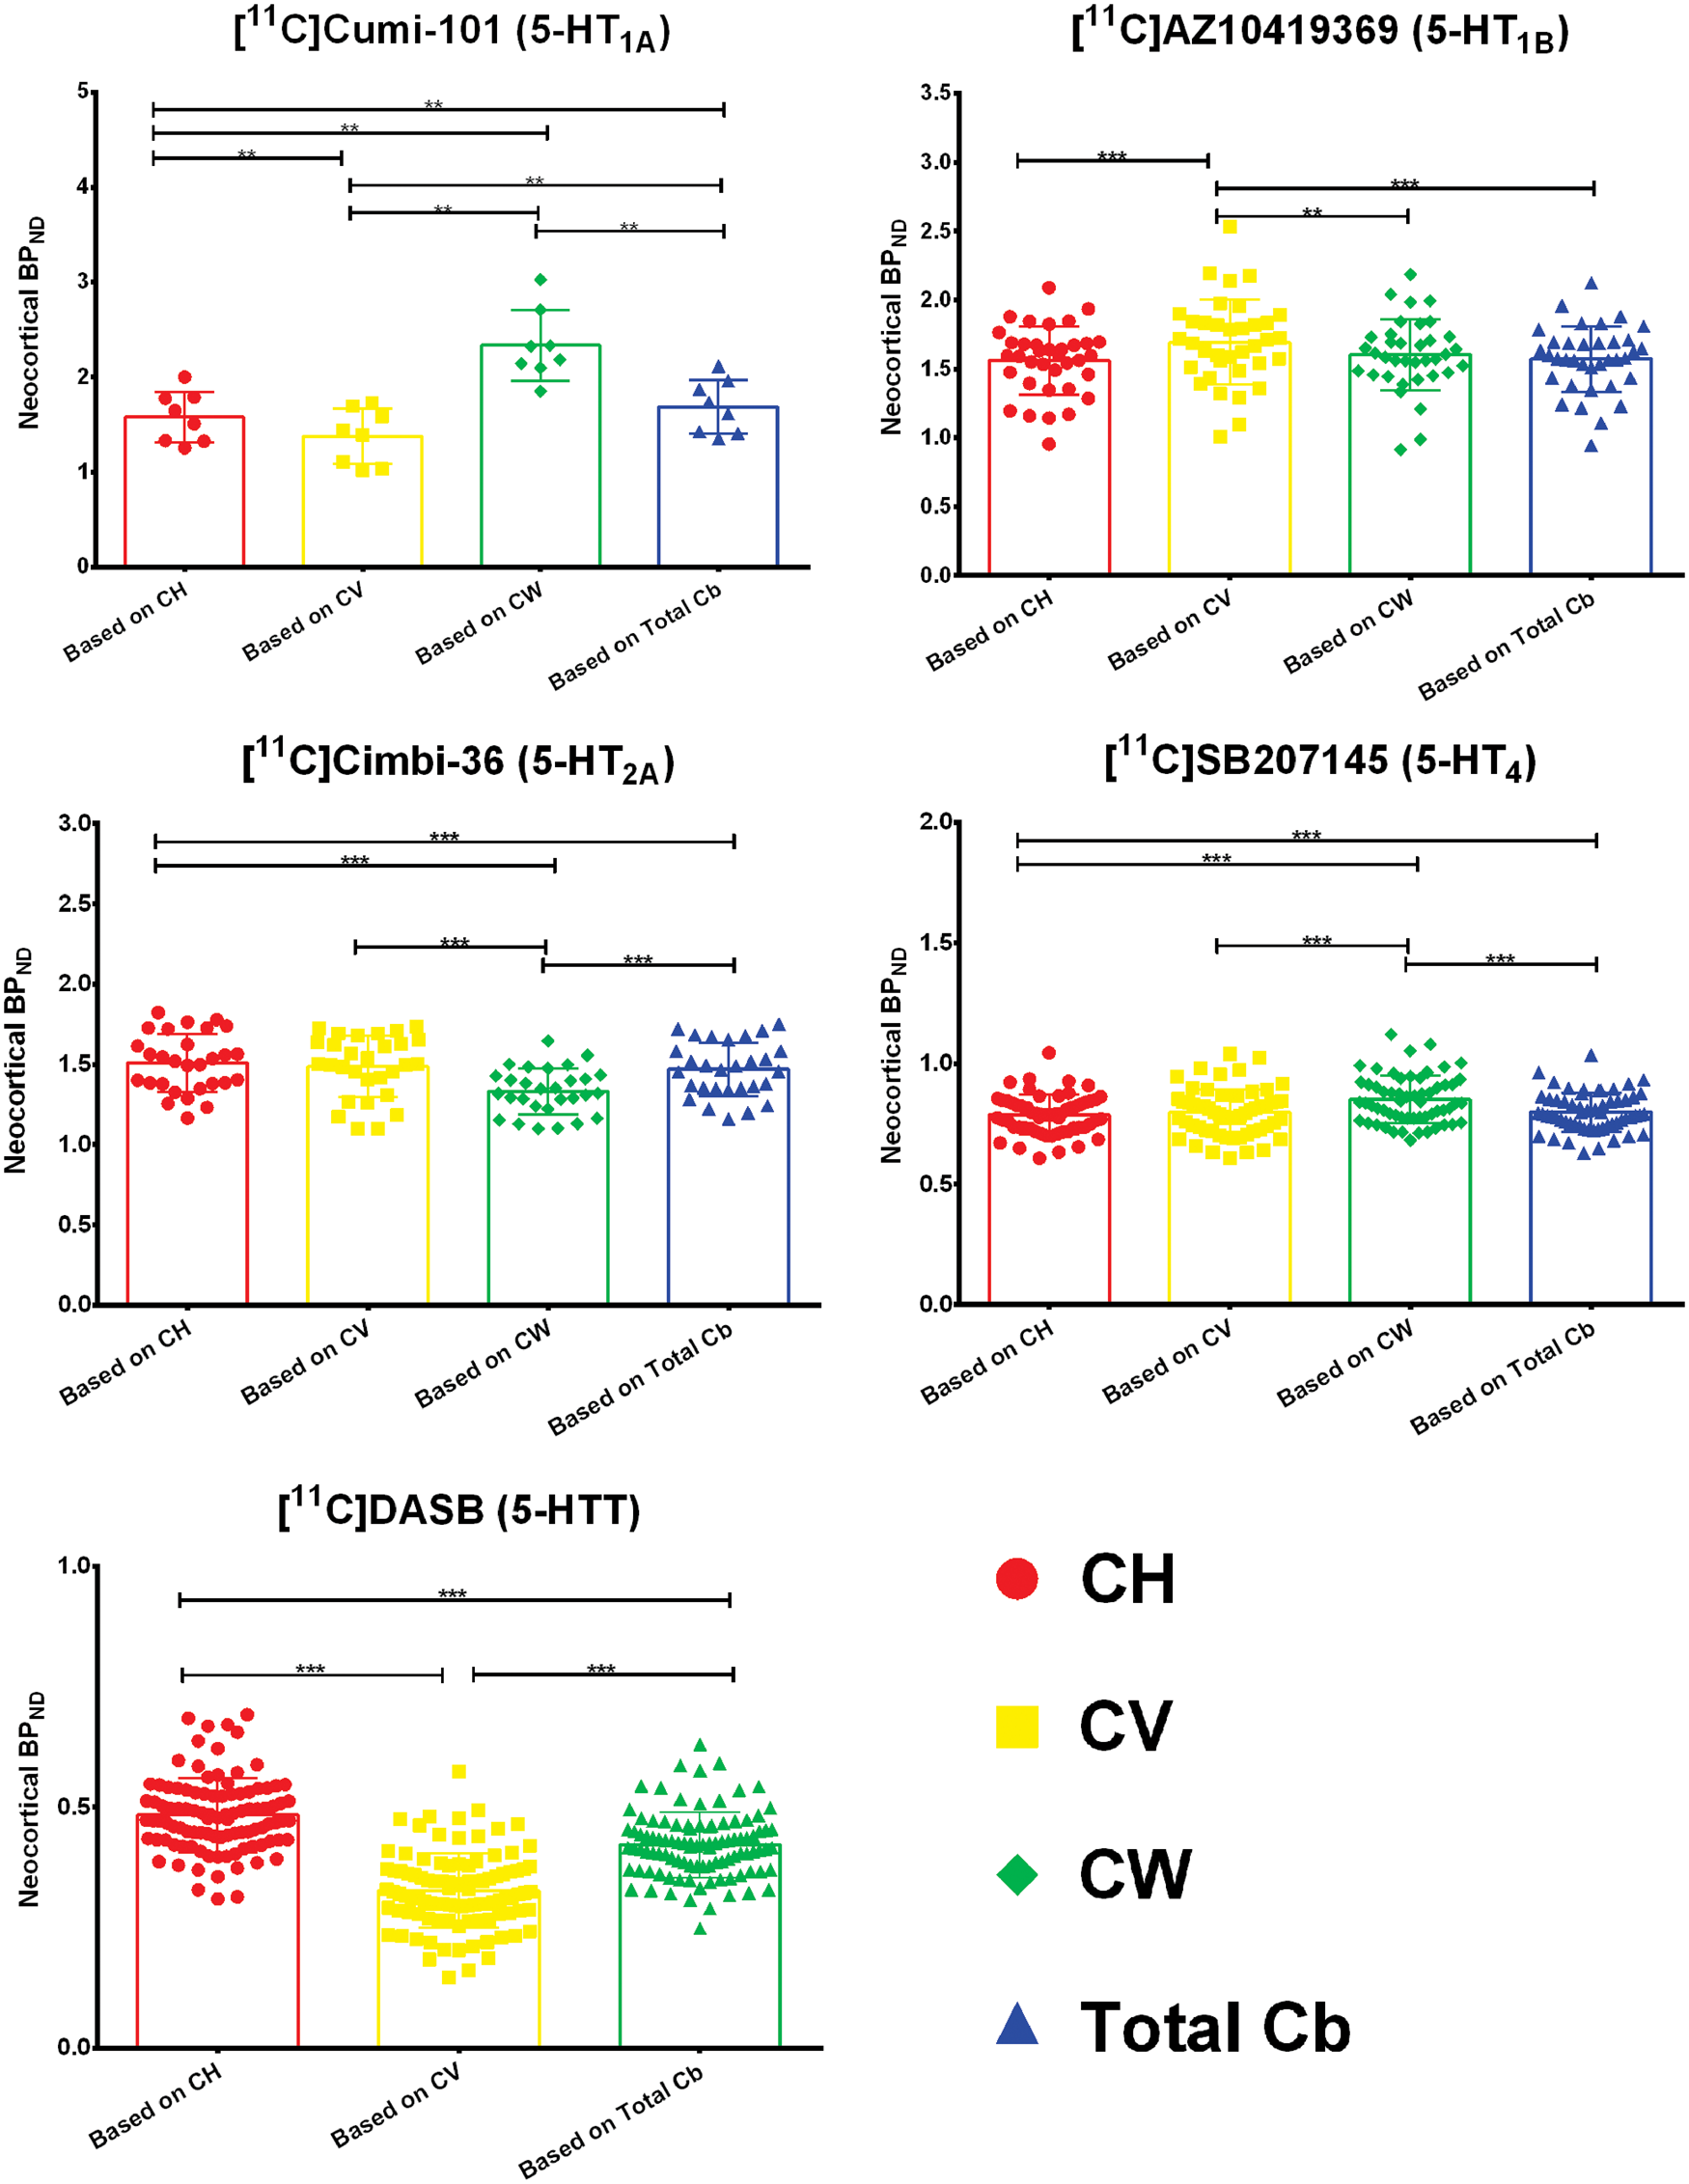
To highlight the large difference in sizes of the different regions and especially of CV, we also calculated the percentage difference (BPND,CV+CH - BPND,CH)/ BPND,CH, i.e. when CV and CH is combined into a single reference region (CV+CH). We found the same statistical differences when we compare the neocortical BPND based on CH versus CH+CV. The differences are though much smaller and range from 0 to 2% for [11C]CUMI-101, 0 to 2% for [11C]AZ10419369, 0 to 1% for [11C]Cimbi-36, and 0 to 3% for [11C]DASB.
Detailed results for the arterial input modeling of the blocking data are shown in the supplementary material. The single 5-HT1AR blocking experiment shows a blocking effect in CV (see Figure 2 in the supplementary material). Of the three cerebellar subregions, CW seems to have the lowest uptake of [11C]CUMI-101; this was corroborated by the arterial input modeling, where VT of this region was found to be closer to VND determined from the occupancy plot (see Table 5 in the supplementary material). The tracer kinetics of [11C]CUMI-101 in CW was not markedly different from CH and CV, and the uptake of [11C]CUMI-101 in CW was not affected by administration of pindolol. For all other radioligands, the kinetics in CW was slower than in CH and CV (see Figure 3 in the supplementary material). Investigation of specific binding of the 5-HT2AR in the cerebellar subregions revealed that CH is the best reference region based on the VT of this region being closest to the VND, as determined from the occupancy plots (see Table 4 in the supplementary material).
Discussion
Our measurement of global cerebellar size fits well with other MR-based studies, 24 which reported a total cerebellar volume of 141 ± 13 cm3 in a population of 97 young (age 33.7 ± 13.6 years) healthy adults.
Regarding the differences in uptake measured by mean SUV the results from the literature vary between receptor systems. Looking at the 5-HT1AR there has been in vitro evidence of limited 5-HT1AR binding in CV,3,25 in vivo experiments have reported an individual with exceptionally high accumulation of [11C]WAY-100635 in the cerebellum, which was most marked in cerebellar cortical grey matter and vermis, 26 as well as significantly reduced cerebellar grey matter (∼30%) binding after a challenge with pindolol, a 5-HT1AR antagonist. 27 This aligns with our findings where [11C]CUMI-101 had higher uptake in CV than CH. With regard to CW our results agree with the ex-vivo and in-vivo literature and show the lowest concentration of 5-HT1A receptors in CW. 3
For the 5-HT1B receptor sparse evidence exists. In vitro results using [3H]GR125743 report that binding in general was low in the cerebellum, 28 but higher in an inner layer of cerebellar cortex close to the white matter. 29 To our knowledge there have been no in vivo reports of higher binding in CH versus CV. Varnäs et al. 30 report a low concentration of [11C]AZ10419369 binding in cerebellar cortex and state that BPND values obtained with kinetic compartment analysis and RTM using the cerebellar cortex as reference region were well correlated. Furthermore, a blocking study in six humans using [11C]AZ10419369 and AZD3783 31 reports absence of any consistent dose-dependent reduction in radioactivity in the cerebellum; lower concentrations were seen in two subjects, higher concentrations in another two subjects, and no change in the two last subjects. Our results using [11C]AZ10419369 indicate the same as the autoradiography data and point to a slightly higher uptake in CH compared to CV. Our results show significantly lower uptake in CW than in CH, which fits the description in Varnäs et al. 29 More details on in-vivo CW uptake are not described in the aforementioned literature on [11C]AZ10419369 binding.
The literature for 5-HT2AR is more cohesive on the subject of cerebellar binding. Several in vitro studies report low to very low 5-HT2AR densities over the different layers of cerebellar cortex using [3H]MDL100907 28 and ketanserin; 32 they concluded that the cerebellum is virtually devoid of 5-HT2ARs (with [3H]MDL100907). 33 Furthermore, there is also an in vivo study that reports no detectable cerebellar binding to 5-HT2ARs using [18F]Altanserin. 34 Our SUV results contradict the literature and indicate a higher uptake in CV compared to CH using [11C]Cimbi-36; however, there was no significant difference in BPND when using CH or CV as reference. The reason that the SUV, but not the BPND, is significantly different between CV and CH might stem from the higher susceptibility of the SUV towards noise. A higher uptake in CV could also be explained by the fact that Cimbi-36 is less selective for the 5-HT2AR compared to MDL100907: The ratio of 5-HT2AR/5-HT2CR selectivity for [11C]Cimbi-36 is 15 35 while it is 142 for MDL100907. 36 Thus, the binding of Cimbi-36 in CV could be due to the off-target binding to the 5-HT2CR. On the other hand the presence of 5-HT2CR in the cerebellum is unconfirmed. 37 With regard to uptake in CW, our results indicate significantly lower uptake compared to CH and CV which also has not been reported in the literature before.
Three in vitro studies of 5-HT4R report low and inconsistently detectable levels in cerebellar cortex with [3H]GR113808 38 or find no evidence for specific binding in the cerebellum with [125I]SB207710.28,39 The autoradiography findings are partially in line with our results, where we see no difference in cerebellar subregion uptake for [11C]SB207145 between CH and CV, but we observe significantly lower uptake in CW than in CH and CV.
Finally, there exists conflicting evidence regarding the binding of 5-HTT transporters in cerebellum. One in vitro study reported that concentration of the 5-HTT protein in both cerebellar cortex and white matter is very low. 40 However, Varnäs et al. 28 reported that [3H]Citalopram binding was concentrated in a band that probably corresponded to the Purkinje cell layer. Parsey et al. 41 found specific 5-HTT binding to be much higher in CV (8.4 fmol/mg) compared with CH (1.25 fmol/mg) and CW (0.23 fmol/mg) using [3H]cyanoimipramine. Conversely, one in vivo study states the opposite and reports a negligible level of specific binding with [11C]McN 5652. 42 Our results seem to support the findings in Parsey et al. 41 in that we see higher uptake of [11C]DASB in CV compared to CH. Furthermore, we observe that CW has a significantly higher uptake than CH, though lower than CV, which is contradictory to the ex-vivo results reported in Parsey et al., 41 but consistent with the in vivo results reported in the same paper.
We also evaluated the influence of using different cerebellar subregions as the reference region for neocortical RTM. The differences in neocortical binding when using CH or CH+CV are in general small. The largest differences were found when using CV as reference. Since CV is a very small region, the signal is very noisy and hence the RTM is affected by this higher noise level. Furthermore, the protein/lipid composition may differ between CV and CH and hence the kinetics of CV as reference region could be unsuitable. The influence of including or excluding CV from the reference region when calculating cortical BPND is small, yielding a difference in cortical BPND below 5% for all tracers.
To corroborate our findings based on the mean SUV and BPND measurements we also performed arterial modeling in a subset of our data. It is common practice to investigate different reference tissue models and identify the best model as the one giving the highest correlation with the BPND computed from arterial input modeling, but this does not guarantee that the chosen reference region is appropriate. A more accurate way to detect which reference region is the most appropriate is to include pharmacological blocking in the study design; this enables computation of the nondisplaceable volume (VND), which then can be compared to the distribution volume in the reference region of interest, VT, as measured with arterial input modeling. Our results from the [11C]CUMI-101 blocking study revealed specific binding in CV but not in CH and CW, thus CV cannot be recommended as a reference region. Data from [11C]Cimbi-36 blocking experiments with ketanserin all showed that CH was the most ideal reference region.
For all radioligands except [11C]CUMI-101, we found slower tracer kinetics in CW compared to the grey matter regions CH and CV (see Figure 3 of the supplementary material). We presume this is due to the difference in tissue composition. Our data cannot rule out using CW as a reference region when quantifying [11C]CUMI-101 data. However, nonspecific binding may differ between grey and white matter, so CW as the reference region may violate the theoretical assumption for the RTM that reference and target regions are identical except for specific binding. These considerations lead us to recommend against using CW as reference region for 5-HT1BR, 5-HT2AR, 5-HT4R, and 5-HTT and to caution against the use of CW for 5-HT1A.
Because we find significant differences in uptake and neocortical BPND for several 5-HT receptors, we hypothesize that there is (1) a difference in the actual receptor densities in the two areas, (2) that there exists off-target binding of the radioligand or (3) that there is a difference in the nondisplaceable binding in the two tissue types. While the presence of radioactive metabolites in the brain could cause the aforementioned difference in the nondisplaceable binding and off-target binding, there is evidence for either no or very little metabolite passing the blood–brain barrier for all of our tracers.9,43–47 Fortunately, we can also show that the differences between including or excluding CV when calculating neocortical BPND are small. They can, however, bias results and since the bias is different for each patient and each tracer 2 this can be a confounding factor especially for small size PET studies.
Furthermore, the bias from including or excluding CV is possibly larger in disease groups, because the distribution and quantity of receptors can be different in disease groups compared to controls and hence influences group studies to a greater degree. For example, a recent article covering contradictory results regarding 5-HT1A receptors in major depressive disorder 48 highlighted the importance of choosing the right reference region for determining the BPND. Hence, the authors also recommended using common methods for quantification of BPND in order to make studies comparable across multiple centres. This includes a common and robust way to define a reference region from MR.
Based on our results we recommend to use CH as the reference region and exclude CV. But for the 5-HT1B receptor where we have found a slightly higher uptake of [11C]AZ10419369 in CH compared to CV, we recommend to use CH as reference region with caution. We cannot recommend to only use CV as reference region, since our BPND calculations vary strongly due to the small size and possibly different tissue composition of the region.
Limitations of our study are that we cannot address age effects, since our population consists of young healthy individuals. Furthermore, invasive kinetic modeling data (baseline and blocking studies) was available for two of the five 5-HT receptors and hence additional arterial input data to resolve the impact of cerebellar heterogeneity on 5-HT PET data quantification is needed. Finally, our findings cannot be generalized to clinical populations, because differences in the receptor distribution within the cerebellum have been reported in patient populations such as schizophrenics and major depression disorder.25,49 To resolve this issue, one may need to conduct a blocking study in the different patient groups, to determine the VND and the VT of the different reference regions.
Conclusion
We demonstrated radioligand specific regional differences in cerebellar uptake, of relevance for its use as a reference region in PET imaging. These differences may be ascribed to differences in concentration of the receptor or transporter in question in CV, CW, and CH, could reflect off-target binding of the radioligands or differences in the nondisplaceable binding in the two tissue types. There was evidence from post-mortem autoradiography and in vivo studies of the presence of 5-HT1ARs in CV and we observed a significantly higher [11C]CUMI-101 uptake in the CV compared to CH and overall a significantly lower uptake in CW. We also found significantly higher uptake of [11C]AZ10419369 in CH compared to CV and CW, which is consistent with an autoradiographic study showing presence of 5-HT1BRs in CH. Our results on 5-HT2A receptor binding in CV were contrary to the in vitro as well as in vivo literature, but this may be explained by the binding of [11C]Cimbi-36 to the 5-HT2CR. We also found significantly lower uptake in CW, which has not been reported before. With regard to 5-HT4 receptor binding in the cerebellum, our results agreed with the literature on CH and CV. Additionally, we observed significantly lower uptake in CW than in CH and CV. Finally, we found a higher uptake of [11C]DASB in CV and CW compared to CH; this agrees with the data reported in Parsey et al. 41 but has not been confirmed in other studies.
Besides the regional differences in cerebellar uptake, we also evaluated the influence of using different cerebellar regions for neocortical RTM. While we observe large difference when using CV alone as the reference region, which is most likely due to the unsuitability of SRTM for this region, the influence of including or excluding CV from the reference region is small and yields a difference in cortical BPND below 5% for all tracers.
In conclusion, our data highlighted the importance of validating each radioligand carefully with regard to the suitability of including or excluding CV in the reference region definition.
Footnotes
Funding
The author(s) disclosed receipt of the following financial support for the research, authorship, and/or publication of this article: Collection of data that was included in the study was supported by the Lundbeck Foundation Center of Excellence Cimbi [R90-A7722]. Melanie Ganz’ research was supported by the Carlsberg foundation [2013-01-0502] and National Institutes of Health (NIH) [5R21EB018964-02]. Hanne Demant Hansen was supported by a postdoc grant from the Lundbeck Foundation [R90-A7722]. Ling Feng was supported by the European Union's Seventh Framework Programme (FP7/2007-2013) under grant agreement no. HEALTH-F2-2011-278850 (INMiND). Vincent Beliveau was supported by the Danish Council for Independent Research - Medical Sciences [4183-00627] and the Research Council of Rigshospitalet [R84 A3300]. Doug Greve was supported by National Institutes of Health (NIH) [1R21EB018964-01 and S10RR023043].
Acknowledgement
Declaration of conflicting interests
The author(s) declared the following potential conflicts of interest with respect to the research, authorship, and/or publication of this article: Melanie Ganz, Hanne Demant Hansen, Ling Feng, Vincent Beliveau, Claus Svarer, and Douglas Greve declare that they have no conflict of interest. Gitte Moos Knudsen has been an invited lecturer at Pfizer A/S, worked as a consultant and received grants from H. Lundbeck A/S and is a stock holder of Novo Nordisk/Novozymes.
Authors’ contributions
MG and LF jointly developed the concept and performed the data analysis. HDH contributed to the literature review. VB performed the preprocessing of the data and investigated approaches to delineate vermis. CS and DG contributed greatly to the discussion of the method and its assumptions. GMK strongly contributed to the discussion of the application of the method and its clinical relevance. MG wrote the first draft and searched for relevant articles. LF, HDH, VB, CS, GMK, and DG reviewed the choice of references, tables, and figures and edited the initial draft and every subsequent draft. All authors approved the final manuscript.
References
Supplementary Material
Please find the following supplemental material available below.
For Open Access articles published under a Creative Commons License, all supplemental material carries the same license as the article it is associated with.
For non-Open Access articles published, all supplemental material carries a non-exclusive license, and permission requests for re-use of supplemental material or any part of supplemental material shall be sent directly to the copyright owner as specified in the copyright notice associated with the article.