
Abstract
Ethanol is a vasoactive agent as well as psychoactive drug. The neurovascular response, coupled with neuronal activity, can be disturbed by alcohol intake. Hence, blood oxygenation level-dependent (BOLD) fMRI, which relies on neurovascular coupling, might not be reliable to reflect alcohol-induced neuronal responses. Recently, diffusion fMRI has been shown to be more sensitive to neural activity than BOLD fMRI even when neurovascular coupling is disrupted. Especially, the apparent diffusion coefficient (ADC) is sensitive to changes occurring in the cellular tissue structure upon activation. In the present study, we compared BOLD fMRI signals, ADC, and local field potentials (LFPs) in the nucleus accumbens (NAc) following injection of an ethanol solution (0.4 g/kg body weight) in rats under medetomidine anesthesia. An increase in the gamma oscillation power of LFP and an ADC decrease were observed 5 min after the injection of EtOH. The BOLD signals showed a negative slow drift, similar to mean arterial pressure with a peak approximately 10 min after the injection. These results confirm that DfMRI can be a better marker of the neuronal activity than BOLD fMRI, especially when the brain hemodynamic status is changed by vasoactive drugs such as ethanol.
Introduction
Functional MRI (fMRI) is an important tool to investigate brain activity in vivo non-invasively. Especially, the blood oxygenation level-dependent (BOLD) method 1 has been extensively used, although the BOLD hemodynamic response only indirectly reflects neural activity and may fail in specific situations, such as neurovascular uncoupling by anesthesia 2 or cerebrovascular disease. 3 There have been several reports investigating the alteration of brain activity following alcohol (EtOH) drinking with BOLD fMRI,4–6 but as alcohol has a vasodilation effect disrupting the neurovascular coupling,7,8 genuine BOLD signals response related to neuronal activity have been difficult to be observed.5,9
On the other hand, diffusion fMRI (DfMRI) has been introduced as an alternative approach to BOLD fMRI 10 which is supposed to reflect more closely neuronal activity. Especially, DfMRI responses persist when the neurovascular coupling mechanism is disrupted by nitroprusside, a vasodilator 11 Hence, DfMRI may be more suitable to investigate acute neuronal effects of ethanol independently of vascular events. In the present study, we have compared the BOLD fMRI, DfMRI and local field potential (LFP) changes induced by ethanol injection in the rat nucleus accumbens (NAc), a structure known to be involved in the alcoholic addiction through dopamine over-secretion by alcohol intake.
Materials and methods
Animals preparation
Number and body weight of rats in each group.
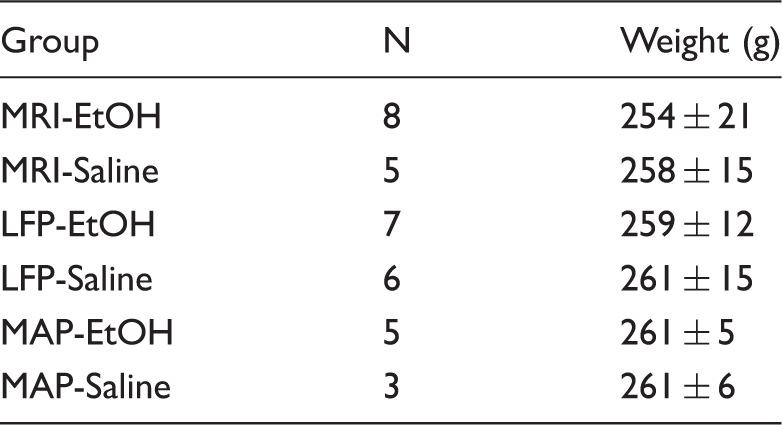
Note: There were no significant differences in the body weight among all groups.
Medetomidine anesthesia and EtOH injection
Medetomidine (0.25 mg/kg body weight/h, i.v.), which is widely used for anesthesia, was continuously infused during the fMRI, LFP experiments, and MAP measurements, respectively. The rats were anesthetized with 1.5% isoflurane during the initial setup. The i.v. medetomidine infusion cannula and i.p. EtOH injection cannula were implanted into the tail vein and the abdominal cavity, respectively. Then, a bolus of 0.136 mg medetomidine was infused subcutaneously and the isoflurane was stopped and replaced with medetomidine anesthesia. The infusion of the medetomidine started just after the bolus. Isoflurane was discontinued when bolus was injected. Therefore, there was no overlap of isoflurane and medetomidine during the acquisition of the data reported in this study.
An EtOH solution (0.4 g/kg body weight, dissolved in physiological saline (10%)) or physiological saline (0.9% NaCl) was injected intraperitoneally 5 min after start of data acquisition (MRI, LFP, or MAP) (Figure 1(a)).
(a) Schematic flow of EtOH or saline injection experiment. (b) ROI of the NAc in fMRI analysis.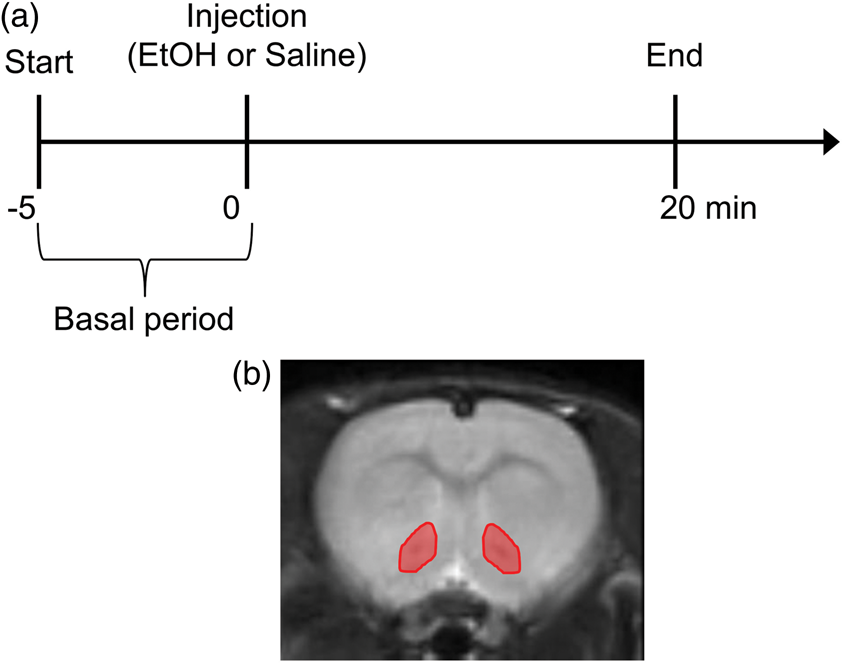
FMRI procedure
The MRI experiments were performed using a horizontal bore, 7T MRI scanner (BioSpec, Bruker, Ettlingen, Germany) equipped with a volume coil for radiofrequency reception and transmission. The animals were intubated and mechanically ventilated (MRI ventilator; CWE, Inc.). The respiration rate and the body temperature were monitored throughout the experiment. The body temperature was maintained at 36.5℃ using an MR-compatible, feedback-controlled air heating system (model 1025; SA Instruments, NY). Six slices (1.2 mm thickness) were selected between +3.5 and −5.5 mm from the Bregma using Tripilot scans. After adjusting the field homogeneity, diffusion and BOLD fMRI images were acquired continuously using a diffusion-sensitized double spin echo EPI sequence, repetition time (TR) = 9 s, echo time (TE) = 35 ms, field of view (FOV) = 32 mm × 32 mm, acquisition matrix =100 × 100, slice thickness = 1.2 mm, slice gap = 0.2 mm, slice number = 6, b = 200, 1000 and 1800 s / mm2. The images acquired with b = 1000 and 1800 s/mm2 were used for DfMRI (calculation of the apparent diffusion coefficient, ADC) and those with b = 200 s/mm2 were used as spin echo BOLD fMRI. We have previously shown that the ADC change calculated from 2 b-values (b = 1000 and 1800 s/mm2) was optimal to reflect the neuronal activation in a rat somatosensory stimulation model. 11 The images acquired within the first 5 min of the scanning were used as baseline. Subsequent images acquired for 20 min were used for analysis to assess the effect of EtOH or saline (Figure 1(a)). After fMRI acquisition, structural images were obtained with a relaxation enhancement (RARE) sequence using the following parameters: TR = 2.5 s, effective TE = 60 ms, RARE factor = 8, FOV = 32 × 32 mm, acquisition matrix = 128 × 128, slice number = 6 with same position and thickness as DfMRI, 4 averages.
LFP
The electrophysiological recording was performed separately outside the MRI bore as previously described. 11 LFPs, which primarily reflect the sum of currents arising predominantly from synchronized synaptic input. The animals, first anesthetized with 1.5% isoflurane, were placed in a stereotaxic frame (David Kopf instrument, CA), and a hole centered at 2.0 mm lateral, 2.0 mm anterior from the Bregma was drilled on the left or right side of the skull. A single tungsten microelectrode electrode (< 1.0 MΩ, with 1 µm tip and 0.127-mm shaft diameter, Alpha Omega Engineering, Nazareth, Israel) was positioned at a depth of 7 mm from the cortical surface. After surgery, anesthesia was changed to medetomidine. LFPs in the NAc were continuously recorded for 20 min after injection of EtOH or saline following 5-min basal recording. LFP signals were acquired at 1 kHz sampling rate using dedicated data acquisition software (Power Lab, AD Instruments, Dunedin, New Zealand). The reference electrode was positioned on the scalp.
MAP measurement
The measurements of MAP were performed parallel to fMRI experiments. The catheters were surgically placed into the tail artery and MAP was measured using the animal monitoring system (Model 1025, SA Instruments, Stony Brook, NY). Then MAP was continuously measured throughout the experiment.
LFP data analysis
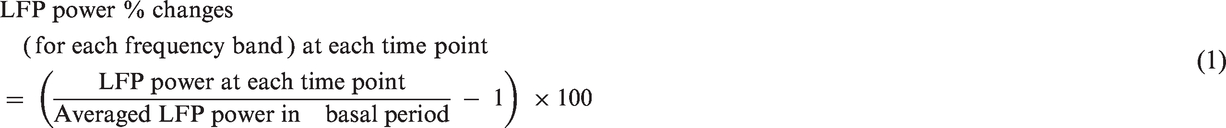
The standard LFP two-dimension power spectrum density was calculated using PowerLab (AD Instruments, Dunedin, New Zealand). The power of each frequency band (alpha, 8–12 Hz; beta, 18–30 Hz; gamma, 60–80 Hz) was calculated for each frequency range. The time-course of the percent change at each frequency was then calculated using MatLab (Mathworks, Inc., Tokyo, Japan). To compare the LFP time-course for each frequency band with fMRI responses, the power of frequency bands was averaged every 9 s to adjust to the temporal resolution of MRI data. The baseline was set as the average of the signals during 5 min before EtOH or saline injection. The percent changes of LFP bands were calculated in each rat with equation (1).
MRI data processing
SPM8 software (Welcome Trust Center for Neuroimaging, UK) was used for fMRI preprocessing, including slice timing correction in each volume, realignment, through the time series, and spatial normalization to the template images of the functional data.
Time-course of BOLD signals
Regions of interest (ROI) of the NAc were anatomically defined and manually drawn using a rat brain atlas
12
(Figure 1(b)). The ROI-based time-courses of the changes in BOLD signals were calculated as follows
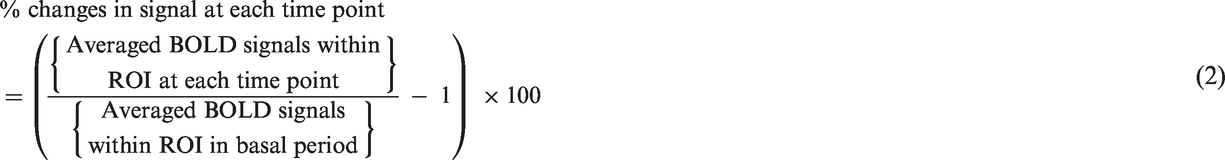
Time-course of ADCs
The ROI-based time-course of the ADC changes were also calculated
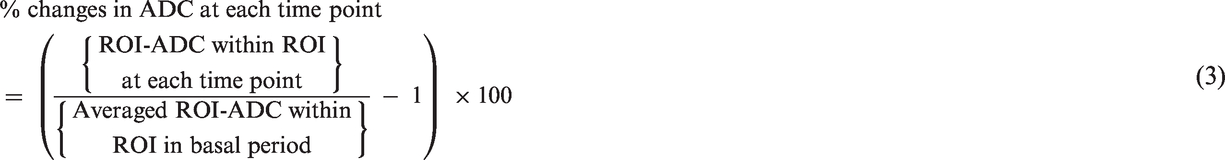
The ROI-ADC was calculated using equation (4) at each time point as

Correlation between LFP bands and fMRI
To investigate the correlation between averaged LFP in NAc and fMRI images, T-contrast images were constructed using SPM8 software. As the electrophysiology and fMRI experiments were performed in different rats, the averaged time-course of frequency bands of LFPs in NAc was used for template of regression analysis in SPM. For the correlation between ADC and LFP bands, the ADC in each pixel was calculated at each time-point using equation (4) but using for
The investigators knew the group allocation and no blinding was done for the data analysis. However, all of the experimental data were included for analysis and the data processing and the statistical analysis were performed using programs automatically without handling by investigators.
Statistics
First, the normality of all data was confirmed using Anderson–Darling Normality and Jarque-Bera Normality tests (p < 0.05). The significance of ethanol effect on the time-course was assessed via statistical analysis using t-test at each time point following two-way repeated measures ANOVA between ethanol and saline group. The significance of time-to-peak was assessed via Tukey–Kramers test among ADC, BOLD, LFP, and MAP.
Results
LFP power bands were altered by EtOH
The raw LFP signals during the basal period (before injection) in the NAc are shown in Figure 2(a). Figure 2(b) shows the time-course of color-coded power spectra of one representative rat. After the start of the injection, the power between 60 and 80 Hz increased. The comparison of the power spectra before (P1) and after (P2) injection of EtOH showed the increase of the power only between 60 and 80 Hz (Figure 2(c)). The averaged time-courses of the alpha band (8–12 Hz) and beta band (18–30 Hz) show significant decrease intermittently 5 min after the injection of EtOH (Figure 2(d) and (e)). In contrast, averaged power in the gamma band significantly increased following EtOH injection reaching a peak within 5 min, then decreased gradually to baseline around 10 min (Figure 2(f)).
(a) Representative raw LFP signals in the NAc of a representative rat. (b) Time-courses of the power spectrum of the LFP in the NAc and (c) band powers at the period of P1 (before EtOH injection) and P2 (5 min after the EtOH injection) in same representative rats. Black arrow, EtOH injection. (d–f) Time-course of the averaged signal changes in (d) alpha band (8–12 Hz), (e) beta band (18–30 Hz) and (f) gamma band LFP (60–80 Hz) in the NAc in EtOH group. Data are expressed as mean ± SEM. Black arrow shows the EtOH injection. *p < 0.05 compared to base line (during 5 min before infusion) by t-test.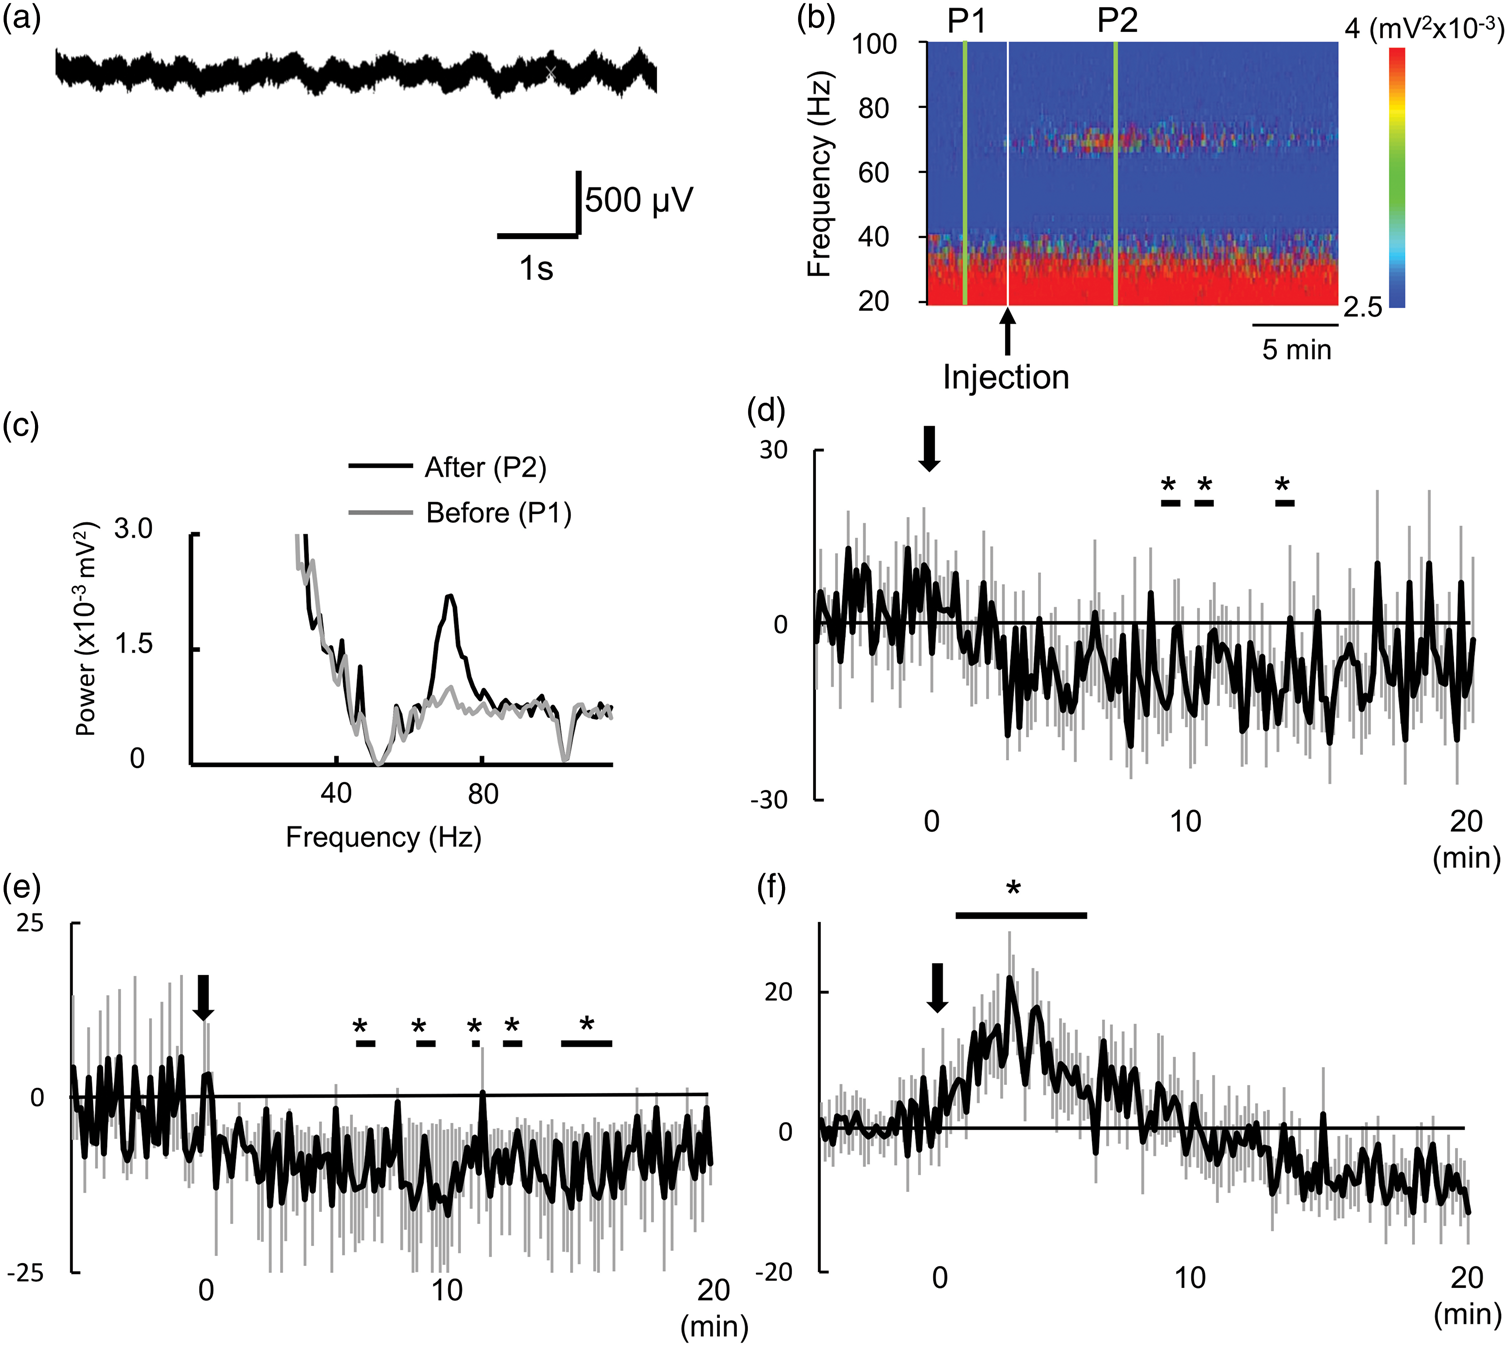
LFPs and fMRI signal time-courses following EtOH injection
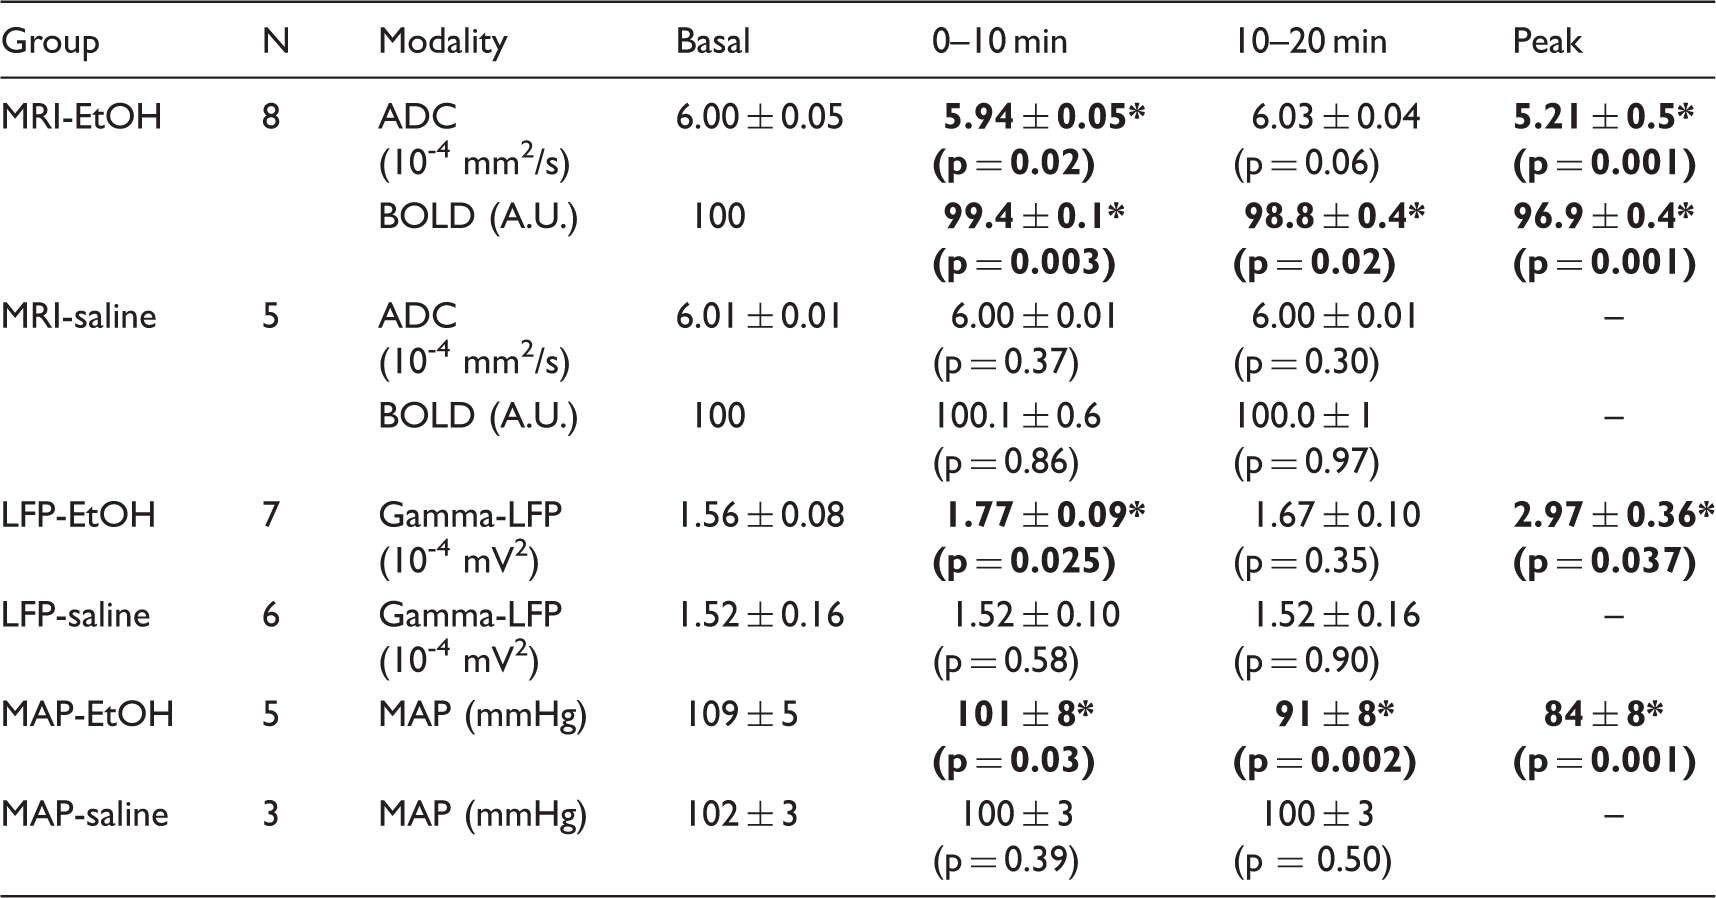
The averaged time-courses of ADC, BOLD signals, and gamma band LFP in the NAc following EtOH and saline injections are shown in Figure 3. There were significant changes in LFP gamma band, ADC, and BOLD signals with the EtOH injection, while no observable response followed the saline injection. Mirroring the LFP gamma band response, the ADC decreased after EtOH injection, reaching a peak within 5 min and then returning to baseline after 10 min (Figure 3(a) and (b)). The averaged ADC and LFP were significantly changed within 10 min after injection of EtOH, but not in the 10–20 min range after injection (Table 2). In contrast, the BOLD signal gradually decreased, reaching a plateau about 10 min after EtOH injection (Figure 3(c)). The averaged BOLD signal in both 0–10 min and 10–20 min ranges after injection of EtOH was significantly decreased (Table 2). A continuous decrease of the MAP following EtOH infusion was observed, similar to the time-course of BOLD signals (Figure 3(d)), with a significantly decreased in 0–20-min range (Table 2). The time-to-peak of BOLD signal (12.28 ± 1.48 min) and MAP (13.50 ± 1.12 min) were significantly longer than that of gamma LFP power (2.23 ± 0.78 min) and ADC (3.26 ± 0.28 min), while the time-to-peaks for the gamma LFP power and ADC responses were similar (Figure 3(e)).
Averaged time-course of percent changes of (a) gamma band LFP, (b) ADC and (c) BOLD signals in EtOH injection group (black line) and saline injection group (grey line). Data are expressed as mean ± SEM. Black arrow shows the EtOH or saline injection. *p < 0.05 compared to saline group at each time point by means of t-test following two way repeated measures ANOVA. (d) Time-course of MAP following injection of EtOH (black line) or saline (grey line). Data are expressed as mean ± SEM. Black arrow shows the EtOH or saline injection. *p < 0.05, compared to saline group at each time point by means of t-test following two way repeated measures ANOVA. (e) Time-to-peak of LFP, ADC, BOLD response and MAP. Data are expressed with mean ± SEM. *p < 0.05 vs LFP, #p < 0.05 vs. ADC, using Tukey–Kramers multiple comparison test. BOLD, ADC, LFP and basal MAP changes in each group. Note: Averaged BOLD signals in basal period were normalized to 100 arbitrary unit (A.U.). Averaged ADC, BOLD, LFP and MAP in basal (before injection), 0–10 min after injection and 10–20 min after injection, peak values are expressed as mean ± SEM (p-value). *p < 0.05, compared to basal period using paired t-test in each group.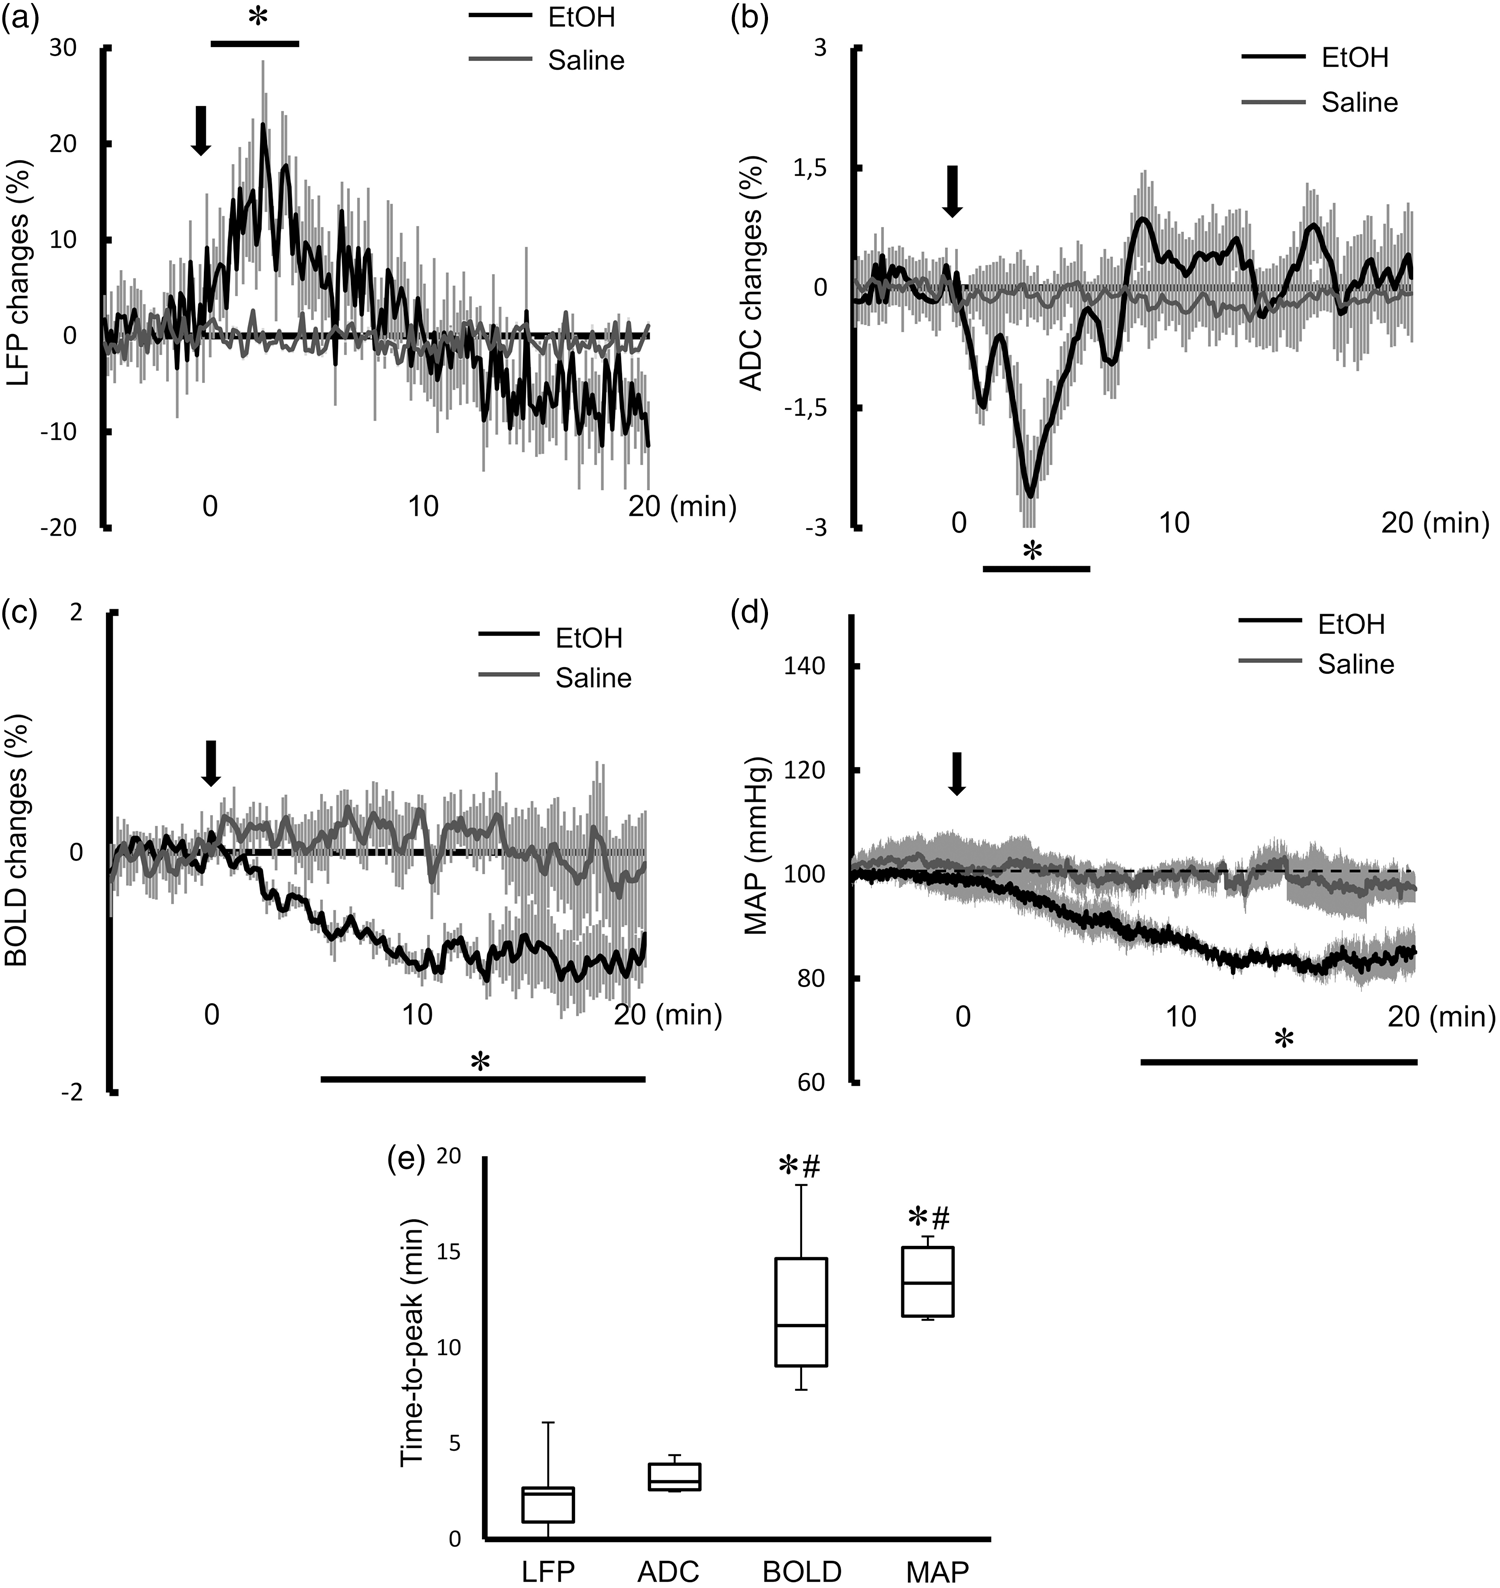
Correlation maps of ADC and BOLD with LFP bands in EtOH groups
To assess the correlation of the MRI signal changes and LFP changes at the voxel level, a correlation analysis was conducted using each of the LFP bands (alpha, beta and gamma) as time-course templates. No correlation was found between LFPs and BOLD signal changes, and there was no significant correlation of ADC and BOLD changes with the LFP alpha and beta bands (Figure 4(a) and (b)). However, a significant negative correlation between the averaged gamma band power and ADC was observed only in the NAc and the posterior insular cortex (Figure 4(c)).
Correlation maps between BOLD/ADC and averaged (a) alpha, (b) beta or (c) gamma band at 2.0 mm and −2.5 mm from the Bregma (p < 0,001, uncorrected). Color bar, t-values.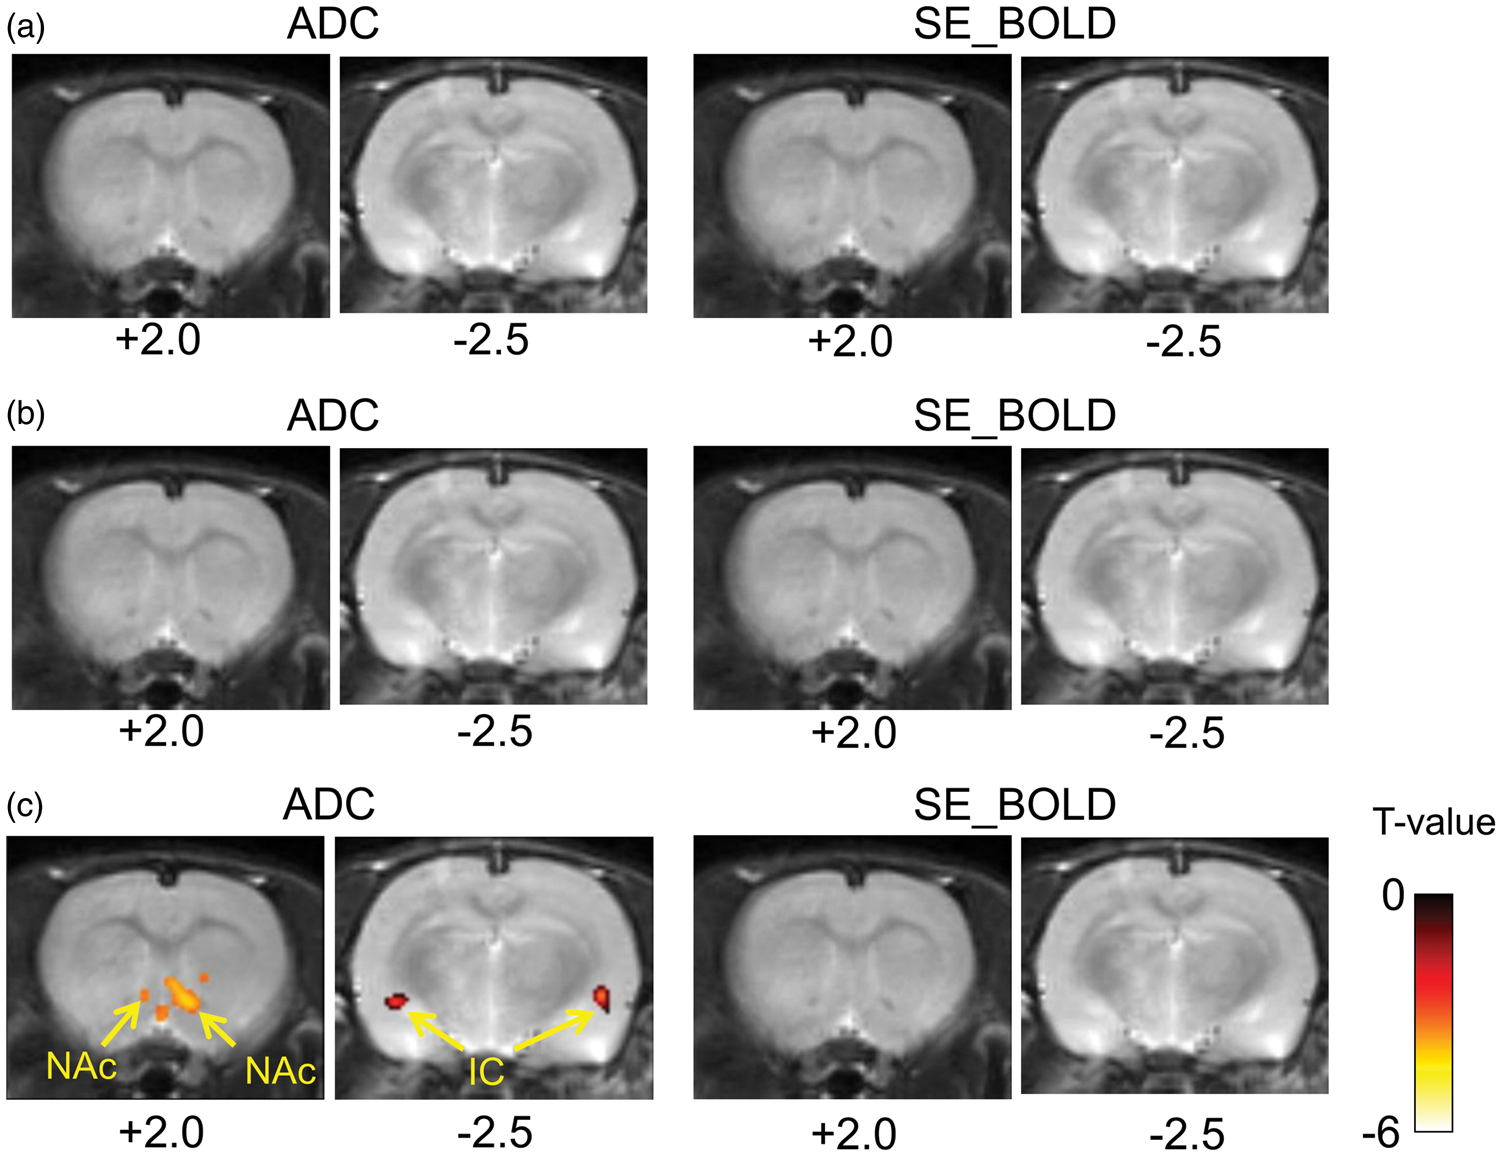
Discussion
Acute alcohol intake results in dopamine over-secretion in the NAc (leading to alcohol addiction) and GABAergic deactivation of neurons in the cerebral cortex and cerebellum (resulting in motor dysfunction). 13 Especially, ethanol directly deactivates interneurons in the ventral tegmental area, resulting in the facilitation of dopamine secretion in the NAc 14 and the insular cortex. 15 This alteration of dopaminergic pathway also leads to the alcohol addiction. Because of the facilitation of risky behaviors and alcohol addiction, studies investigating changes in human brain activity following alcohol drinking are of primary importance.5,16 However, as ethanol has a vasodilation effect disrupting the neurovascular coupling, 7 neuronal responses have been difficult to observe with BOLD fMRI.5,9
In the present study, a negative correlation between the water ADC derived from DfMRI and LFP gamma band time-courses of LFP was found specifically in the NAc. On the other hand, the BOLD fMRI response in the NAc showed a negative drift paralleling systemic changes in MAP. This negative drift should not be confused with the residual small BOLD signal decrease (reflecting an increase in oxygen consumption) which can be observed when neurovascular coupling is suppressed.1,11,17 Here, the negative BOLD response was not correlated to any LFP pattern and just reflected EtOH-induced vasoactive effects, as seen on the MAP time-courses. 18 Indeed, effects of EtOH on regional cerebral blood flow (rCBF), glucose metabolism, and BOLD signals are well known.4,8,19,20 Our results show that such confounding vascular effects can be avoided when using diffusion-based fMRI. It should be noticed that diffusion-weighted MRI signals are also always T2-weighted, 21 and, thus include a residual BOLD component. The diffusion component to the diffusion-weighted signal increases with the b-value, while the BOLD (T2) component does not. At low b values, such as b = 200 s/mm2, the T2 contribution (and related BOLD effect) largely predominates, while when calculating an ADC from 2 b values following equation (4) (here 1000 and 1800 s/mm2), the T2 contribution vanishes, which explains the completely different behaviors of BOLD and ADC time-courses, pointing to different mechanisms. Other confounding vascular effects, so called Intravoxel Incoherent Motion (IVIM) effects that are present at very low b values are also eliminated by using moderate b values, such as 200 s/mm2. 22
It would have been very challenging technically to record LFP and fMRI signals simultaneously in the same animals. This is why statistical correlations reflect LFP and fMRI signals obtained from separated animal groups, a common practice in the field.
23
Those animals were otherwise identical and same stimulation protocol was used in all experiments. Thus, there is obviously no reason to suggest that they could have different behaviors related to EtOH injection. Although the physiological basis underlying the LFP gamma oscillation is not fully understood, gamma oscillations are considered to emerge from the coordinated interaction of excitation and inhibition of neuronal activity.24,25 The gamma oscillation is modified by drugs interfering with NMDA receptors, GABA receptors, serotonergic pathways, and the dopaminergic pathways in the NAc.26–29 EtOH is expected to modify the gamma oscillation in the NAc because EtOH reinforces the dopamine release in the NAc through the activation of VTA neurons
14
(Figure 5). Hence, the temporal correlation of the LFP gamma band power and the ADC likely reflects sensitivity to similar neuronal activity patterns, which is not the case for BOLD.
Schematic figure of the pharmacological effects of EtOH in the NAc.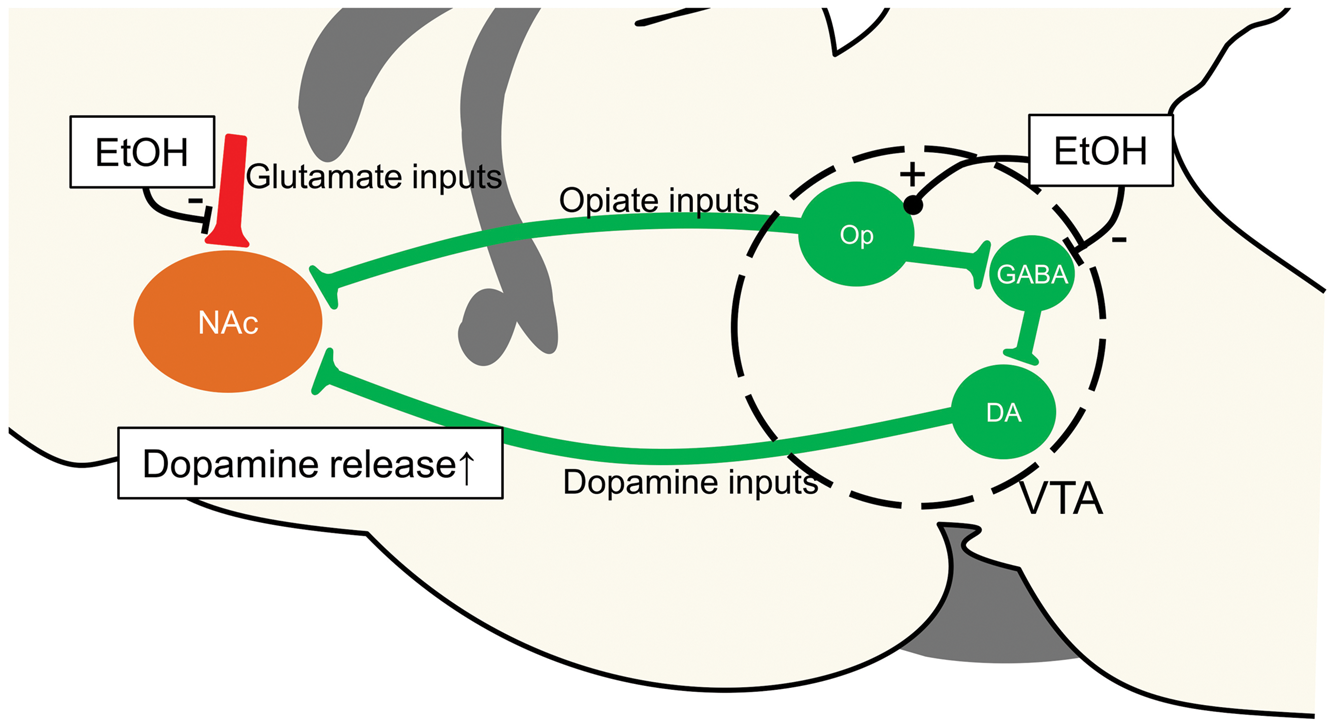
Diffusion MRI is exquisitely sensitive to changes in tissue microstructure30,31 and it has been hypothesized that the ADC decrease observed during neuronal activation results from the swelling of neurons or neuron elements, such as dendritic spines.10,32 A decrease in ADC resulting from neuronal swelling has been evidenced in Aplysia ganglia neurons, 33 and rat hippocampal slices during kainate-induced neuronal activation. 34 The absence of vascular effects in the ADC responses is evidenced by the persistence of those responses when neurovascular coupling is disrupted by nitroprusside (while the BOLD response is abolished), 11 and by the observation of ADC responses to pharmacological challenges in blood-free tissue preparation.34,35 Near-infrared intrinsic optical signals which are also sensitive to dynamic microstructural changes in tissues through water movements of the extracellular space, clearly showed cell swelling occurring in the rat olfactory bulb during neuronal activation 36 and in the somatic layer and the striatum radiatum of acute rat brain hippocampal slices, in association with LFP responses. 37 A recent study based on organotypic slice cultures also showed that the ADC decreased in relation to cell swelling induced by kainate or high potassium stimulation; however, no ADC changes correlated with spontaneous calcium signals (supposed to reflect spiking activity, <1 Hz), could be observed. 35 Indeed, organotypic slices are known to have a drastic reduction in the density of dendritic spines and functional synapses (associated to a close loop connectivity), poorly reflecting in vivo baseline neural network activity of mammal brain cortex.38,39 Altogether, those results lead to speculate that the ADC response originates from a dynamic state of a great number of cellular components continuously swelling or retracting upon their activation/deactivation status, especially dendritic spines and synapses which are present in very large quantities in rodent brain cortical tissue (approximately 1–2 × 10⁹ / mm3) 40 and mammalian brains. In short, while the BOLD signal is based on the neurovascular coupling principle, the DfMRI signal could originate from a electromechanical coupling underlying neuronal activity, directly reflecting synaptic activity within neural networks. 41 Clearly, more studies will be necessary to establish the mechanisms underlying DfMRI, in correlation with other modalities (multi-unit or single-unit electrophysiology, etc.).
In conclusion, ADC responses were found to be more closely related to neuronal activity, as reflected by the LFP gamma power band than BOLD fMRI during alcohol injection. DfMRI appears more suitable than BOLD for fMRI studies performed under anesthesia, such as preclinical studies, especially when pharmacological challenges may alter the neurovascular coupling.
Footnotes
Funding
The author(s) disclosed receipt of the following financial support for the research, authorship, and/or publication of this article: This work was supported by the Louis-Jeantet Prize for Medicine; Ajinomoto Co. Inc for data acquisition and publication.
Acknowledgments
We thank M Boucif DJEMAI for technical assistance with the MRI experiments.
Declaration of conflicting interests
The author(s) declared no potential conflicts of interest with respect to the research, authorship, and/or publication of this article.
Authors’ contributions
TT, YA and DLB conceived the experiment(s), TT and YA conducted the experiment(s), and TT analyzed the results. TT and DLB contributed to the writing of the manuscript.