
Abstract
Tissue sodium concentration increases in irreversibly damaged (core) tissue following ischemic stroke and can potentially help to differentiate the core from the adjacent hypoperfused but viable penumbra. To test this, multinuclear hydrogen-1/sodium-23 magnetic resonance imaging (MRI) was used to measure the changing sodium signal and hydrogen-apparent diffusion coefficient (ADC) in the ischemic core and penumbra after rat middle cerebral artery occlusion (MCAO). Penumbra and core were defined from perfusion imaging and histologically defined irreversibly damaged tissue. The sodium signal in the core increased linearly with time, whereas the ADC rapidly decreased by >30% within 20 minutes of stroke onset, with very little change thereafter (0.5–6 hours after MCAO). Previous reports suggest that the time point at which tissue sodium signal starts to rise above normal (onset of elevated tissue sodium, OETS) represents stroke onset time (SOT). However, extrapolating core data back in time resulted in a delay of 72±24 minutes in OETS compared with actual SOT. At the OETS in the core, penumbra sodium signal was significantly
Keywords
Introduction
Ischemic stroke is a catastrophic event that causes pathological restrictions in arterial blood flow to a specific brain region. In the penumbra, tissue viability can nevertheless be maintained by a mix of aerobic and anaerobic metabolism for several hours after stroke onset. Eventually, if hypoperfusion persists, cells in the penumbra become irreversibly damaged and incorporated into the ischemic core. The term ‘penumbra’ is used in this paper to describe hypoperfused tissue identified on magnetic resonance imaging (MRI) perfusion scans that did not exhibit markers of irreversible damage on subsequent post-mortem histological analysis (i.e., potentially viable hypoperfused tissue).
The accurate identification of penumbral tissue is critical in identifying stroke patients who could benefit from thrombolysis and in designing future clinical trials of potential neuroprotectants. Indeed, it has been shown that thrombolytic treatment outcomes are improved in patients selected using an MRI diagnosis. 1 Brain tissue viability strongly depends on the severity and duration of hypoperfusion. 2 Nevertheless, while hypoperfusion can be determined noninvasively with MRI, stroke onset time (SOT) and duration of hypoperfusion cannot be accurately determined from acute scans. For instance, in ‘wake-up’ patients, which account for ∼25% of strokes, 3 the exact SOT cannot be determined accurately, preventing established acute stroke treatments such as thrombolysis with recombinant tissue plasminogen activator being applied. 4 Thus, an onset time-independent method that could accurately identify core and penumbra tissue in patients would be a valuable addition to MRI protocols. However, the identification of subregions within hypoperperfused tissue (i.e., core and penumbra) using MRI remains elusive. The most promising approach relies on measuring water mobility in tissue via hydrogen diffusion MRI. The resulting quantitative value, the apparent diffusion coefficient (ADC), drops rapidly within minutes after stroke onset in regions that are initially smaller than the volume of hypoperfused tissue. Such ADC reduction, however, is not exclusively restricted to irreversibly damaged tissue during acute stroke. Low ADC values have also been measured in still viable stroke tissue, 5 requiring a specific threshold to be defined to support the ADC/core tissue hypothesis. For example, ADC values reduced and maintained below a threshold of 0.53 μm2/ms were reported for permanently damaged tissue as determined by triphenyl-tetrazolium chloride staining analysis at 24 hours after experimental stroke (middle cerebral artery occlusion, MCAO) in rats. 6 Such ADC thresholds may hence serve as a prospective marker for core tissue during the acute phase. Validation of this hypothesis remains a challenge because of the lack of histological markers that could serve as an independent gold standard to define early tissue damage during the acute phase.
Monitoring changes in local sodium ion concentration may provide an alternative or complementary MRI approach for identification of core and penumbra regions noninvasively via sodium MRI. It is reported that following an ischemic insult, sodium concentration (intracellular plus extracellular) increases within core tissue at a rate of ∼2%/hour in humans,7, 8, 9 ∼5-8%/hour in monkeys,
10
∼12%/hour in rabbits,
11
and ∼22–25%/hour in rats.12, 13, 14 The core lesion size appears to determine the rate of sodium increase as a function of time, with faster rates in smaller lesions as described recently in a mathematical adaptation of Fick's second law.
15
A study by Wang
In a previous rat MCAO study, variable delays were observed in the hemisphere ipsilateral to the stroke before the tissue sodium concentration (TSC) increased, with an early increase in the presumed core and a delayed increase in the presumed penumbra (regions of interest (ROIs) estimated from experience with this model).13,17 Furthermore, an initial decrease in sodium concentration of ∼4 mmol/L was observed in the presumed penumbra.
13
Bartha
Recent patient data indicate that the sodium signal remains unchanged in presumed penumbra tissue8,9 and that sodium signal changes in the core do not reverse after reperfusion.
19
During acute stroke it has been reported that the lesion identified from increased sodium concentration can be smaller than the lesion identified from decreased ADC.
19
However, the heterogeneity in stroke progression between individual patients as well as the need for a dedicated ADC threshold to determine lesion size poses a challenge. The lack of sufficient clinical data at different acute time points makes it difficult to interpret these results with respect to sodium signal changes in relation to the time after arterial occlusion and the time of tissue viability loss.
The aim of the current study was to investigate the changes in sodium signal and ADC values in penumbra and core tissues and to check the validity of using sodium image intensity, first, to predict the SOT and, second, to identify potentially salvageable penumbral tissue. Using an established model of permanent focal cerebral ischemia (MCAO), alternating sodium and ADC measurements were made from 0.5 to 6 hours after stroke with subsequent perfusion imaging for penumbra assessment using perfusion/histology mismatch. To check the validity of using tissue sodium to predict the SOT, the time point after MCAO at which sodium increases above normal tissue sodium in the affected hemisphere is hereinafter called the onset of elevated tissue sodium (OETS).
We hypothesize that in the penumbra, where cells are still capable of maintaining a membrane potential and a sodium concentration gradient, the sodium signal will be normal or reduced and will remain below or at the sodium signal level from nonischemic (contralateral ROI) tissue. As time progresses and the tissue loses its viability—transitioning to core tissue—the sodium signal in this region will increase and will be higher than contralateral sodium levels.
Materials and Methods
Sodium- and Hydrogen MRI
A double-tuned sodium/hydrogen surface resonator was used for sodium-and hydrogen—MRI; the design of this transceiver (TXRX) coil is described in detail elsewhere.
17
A three-dimensional 3D Fast Low Angle SHot (FLASH) sequence was used to acquire sodium images with high spatial and temporal resolution using a 7T system (Bruker BioSpec 70/30 system, Ettlingen, Germany). A
1H diffusion weighted images (DWIs) were acquired using an echo planar imaging sequence with TR/TE=4,000/32 ms, a
Hydrogen perfusion images (PI) were acquired before the rats were killed by swopping the sodium coil system with a standard transmit-only receive-only (TORO) resonator system (72 mm diameter linear volume resonator and 20 mm diameter receive-only surface coil) in a pseudocontinuous arterial spin labeling (pCASL) echo planar imaging-based sequence 22 with repetitive labeling pulse applied every 60 ms (50 pulses) and slice selective labeling once around the neck and once above the head. The read-out EPI parameters were as follows: TR/TE=4,000/22 ms, TA=2 minutes per slice, in-plane resolution=(0.26 × 0.26) mm2, and slice thickness=2 mm. Five slices were acquired that matched the diffusion slice positions. Perfusion images were computed as the difference between the labeled and unlabeled images, and values reported herein are given as a percentage change relative to the contralateral cortex.
A final hydrogen DWI data set was then acquired with the same hydrogen TORO resonator system using a 2D echo planar imaging sequence with the following: TR/TE=4,000/26 ms, voxel size (0.25 × 0.25 × 1.9) mm3, eight slices with 0.1 mm slice gap, and 2 minutes 8 seconds acquisition time. A
Stroke Model
Experimental Workflow
Following induction of cerebral ischemia, the rat was positioned on a support cradle, for movement in and out of the magnet bore, and kept warm by a warm water circulation jacket. The double-tuned surface resonator was tuned and matched
Infarct Size Analysis
Following completion of scanning (330±50 minutes after MCAO, Table 1) animals were killed (time of killing=378±42 minutes after SOT, Table 1) by transcardial perfusion fixation using 4% paraformaldehyde in phosphate buffer and the location and volume of irreversible ischemic damage was determined from histology sections. The brains were harvested, processed, and embedded in paraffin wax, subsequently sectioned at 6 μm and collected over eight stereotaxic coronal levels covering the same rostrocaudal extent of MCA territory as the MRI slices (2–12.2 mm from the interaural line 24 ) with appropriate sections matched up to each of the sodium-MRI brain slices using neuroanatomical landmarks. Histology sections were stained with hematoxylin and eosin and examined with light microscopy. The boundary of the ischemic lesion was determined on the basis of neuronal morphology (darkly stained, pyknotic neurones) and vacuolated neuropil. This boundary was then transcribed on coronal line diagrams from a stereotaxic atlas 24 as described elsewhere 25 to correct infarct measurements for any ischemia-associated brain swelling and brain shrinkage associated with histological processing.
Timings and sodium data in the penumbra and core
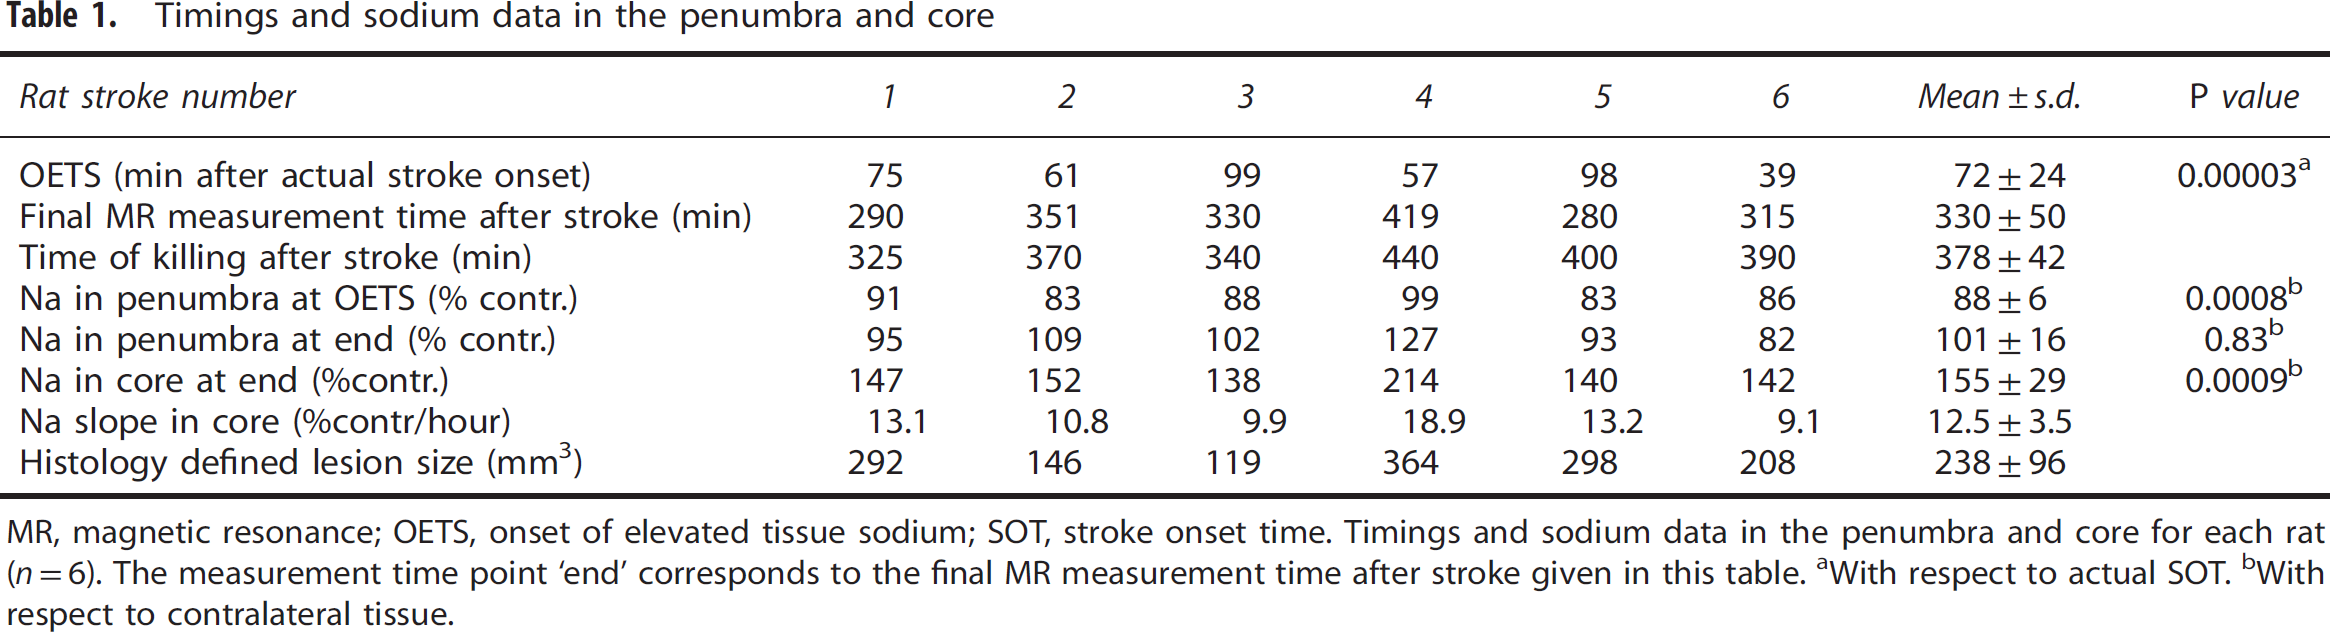
MR, magnetic resonance; OETS, onset of elevated tissue sodium; SOT, stroke onset time.
Timings and sodium data in the penumbra and core for each rat (
With respect to actual SOT.
With respect to contralateral tissue.
Image Co-Registration
The fourth stereotaxic coronal level covering the center slice of the rostrocaudal extent of MCA territory (8.2 mm from the interaural line) was used to carry out noninvasive perfusion, ADC, and sodium measurements on a single slice.
The hydrogen-PI and -DWI images acquired with the hydrogen TORO system and the histology maps were co-registered to the sodium and hydrogen ADC images that were acquired with the double-tuned surface resonator. In order to maintain the high spatial resolution of the histology maps, all images were resized using nearest neighbor interpolation to a matrix size of 1,024 × 1,024. Image co-registration was carried out by setting corresponding markers in anatomically identical regions of the brain using the control point selection tool in Matlab (The Mathworks, Natick, MA, USA), with an affine transformation used to register the images. This allowed for the accurate placement of ROIs in the different multimodal images and parametric maps for later computation purposes, some examples of which are shown in Figure 1.
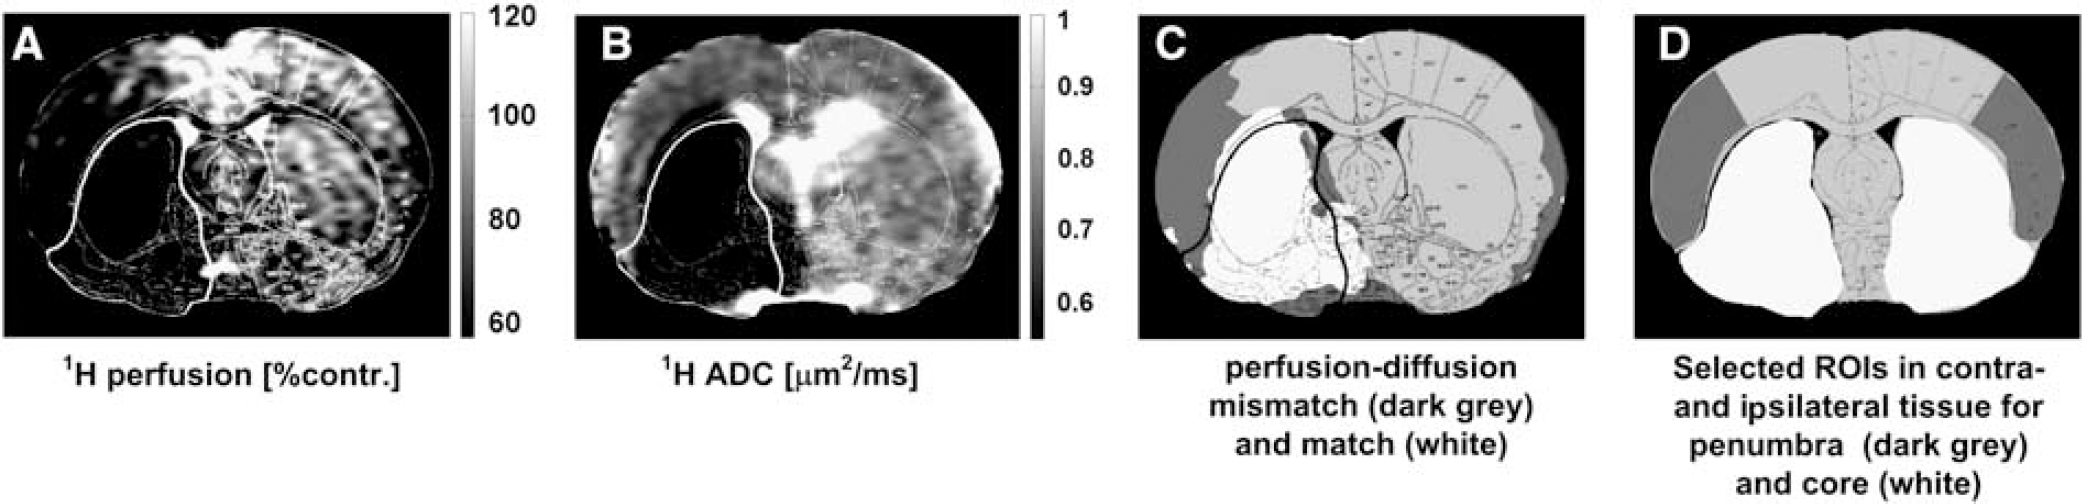
Region of interest (ROI) selection for penumbra and core tissue for one representative rat (stroke 2) using imaging data acquired at the end of the experiment (5 hours after middle cerebral artery occlusion (MCAO)) and histology maps. (
Determination of Penumbra and Ischemic Core
In this study the core ROI was defined within the boundary of the histologically verified, irreversibly damaged tissue, and the penumbra ROI from the mismatch between the area of hypoperfusion and the histology defined area of irreversible tissue damage. The area of perfusion deficit was calculated on the basis of a 57% reduction of the cerebral blood flow relative to the mean contralateral cerebral blood flow in the cortex25,26 using a code developed in Matlab (The Mathworks). ROIs delineating core and penumbra regions (Figure 1d) were manually defined, guided by the location of hypoperfusion and histology at 5–6 hours after stroke in order to observe the temporal sodium signal and hydrogen ADC evolution in each distinct region. Corresponding ROIs were also manually defined in contralateral tissue homotopic to the core and penumbra in order to correct for the slight sodium coil-sensitivity profile; an example of all ROIs thus defined for one representative rat are presented in Figure 1d. The sodium values were then computed as the mean and s.d. of the respective ROIs relative to the contralateral tissue. All images were masked to the rat brain, wherein the mask was computed from manually drawn contours drawn around the edge of the brain as visualized in a diffusion-weighted image.
23Na and Apparent Diffusion Coefficient Data Analysis
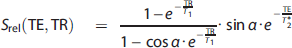
For qualitative presentation of the ADC maps and sodium MR images, each pixel value was normalized to the mean sodium signal values and ADC in contralateral tissue using a ROI placed over the entire contralateral hemisphere. For quantitative measurements of the sodium signal, the mean signal in the core and penumbra was normalized to the mean sodium signal values measured in ROIs contralateral to the core and penumbra, respectively. Assuming a linear increase in the sodium signal in ischemic core tissue (as reported in previous studies12,13,17), the signal in core ROI was fitted to a linear function according to

where the line to which the sodium signal was fitted was characterized by the intercept
The OETS—the time after MCAO at which tissue sodium in the ischemic core ROI starts to rise above contralateral tissue sodium—was computed from the linear regression results according to
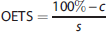
The s.d. and the mean values were computed for the ADC and sodium signal in both the core and penumbra ROIs at OETS and at the end of the experiment.
Statistical Analysis
Data are presented as the mean±s.d. The paired samples’
Results
Middle cerebral artery occlusion induced a region of reduced ADC with a larger perfusion deficit and an increase in tissue sodium signal within MCA territory. The spatial change in the ADC and the normalized sodium signal as a function of time after MCAO, are presented for a representative rat in Figure 2. The quantitative sodium values for the group, together with experimental timings, histology-defined lesion size, and OETS, are listed in Table 1. The corresponding ADC values are listed in Table 2.
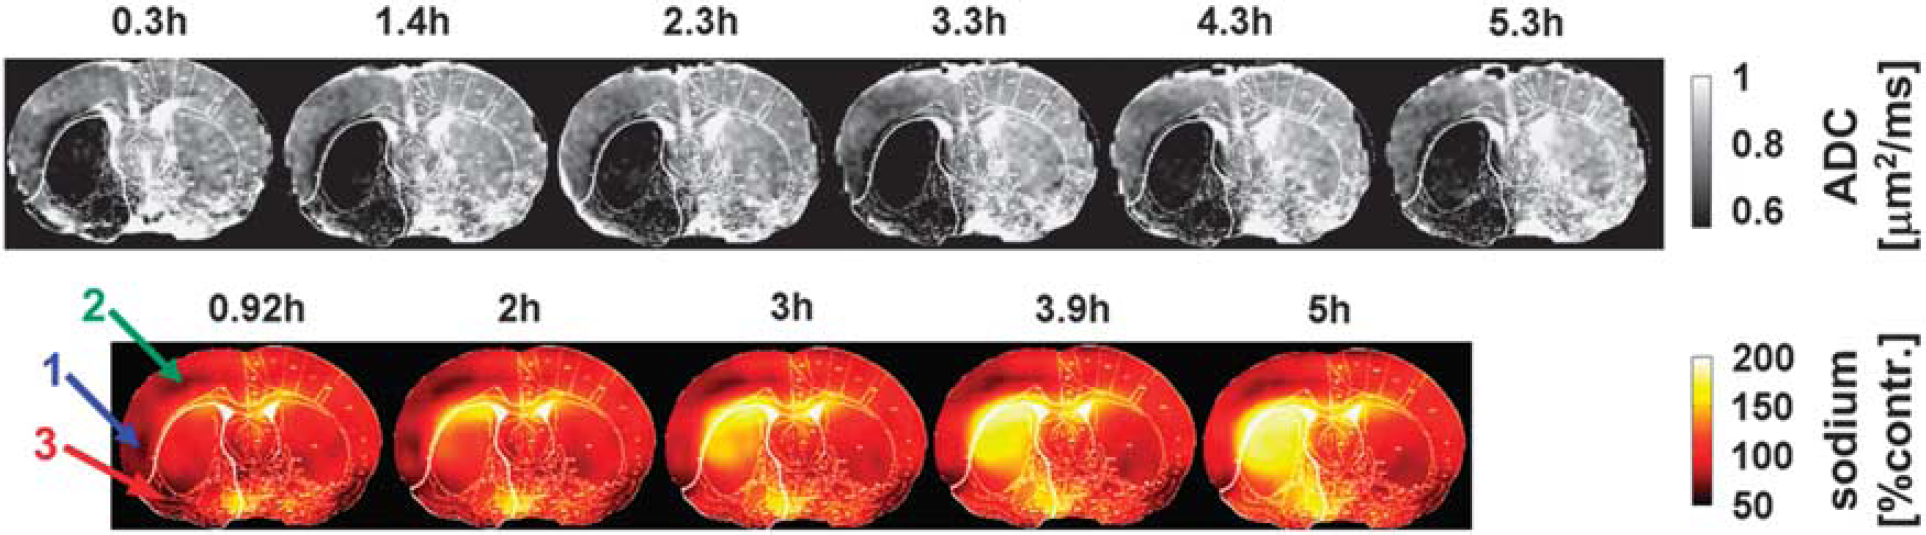
Apparent diffusion coefficient (ADC) maps (upper row) and sodium images (lower row) for one representative rat (stroke 2), where the signal in the latter was normalized to the contralateral hemisphere. Numbers above each image indicate the time after middle cerebral artery occlusion (MCAO). The lower boundary of the gray scale on the ADC maps represents the 0.53-μm2/ms core threshold and delineates the ADC-defined lesion. The histology defined white outline, delineating permanently damaged core tissue is superimposed on each of the ADC and sodium images. Note the low sodium signal in the ipsilateral cortex during the early time points (arrow 1) and during the entire experiment (arrow 2). Sodium signal change is highly heterogeneous in core and penumbra. Within the core territory, the ipsilateral ventral cortex (arrow 3) presenting with initially low sodium exhibits a delayed onset of tissue sodium elevation at 3 hours after stroke. Note that the sodium signal is approximately twofold higher in voxels containing cerebrospinal fluid (i.e., within the ventricles) compared with voxels containing brain tissue. 34
Hydrogen ADC results in the penumbra and core
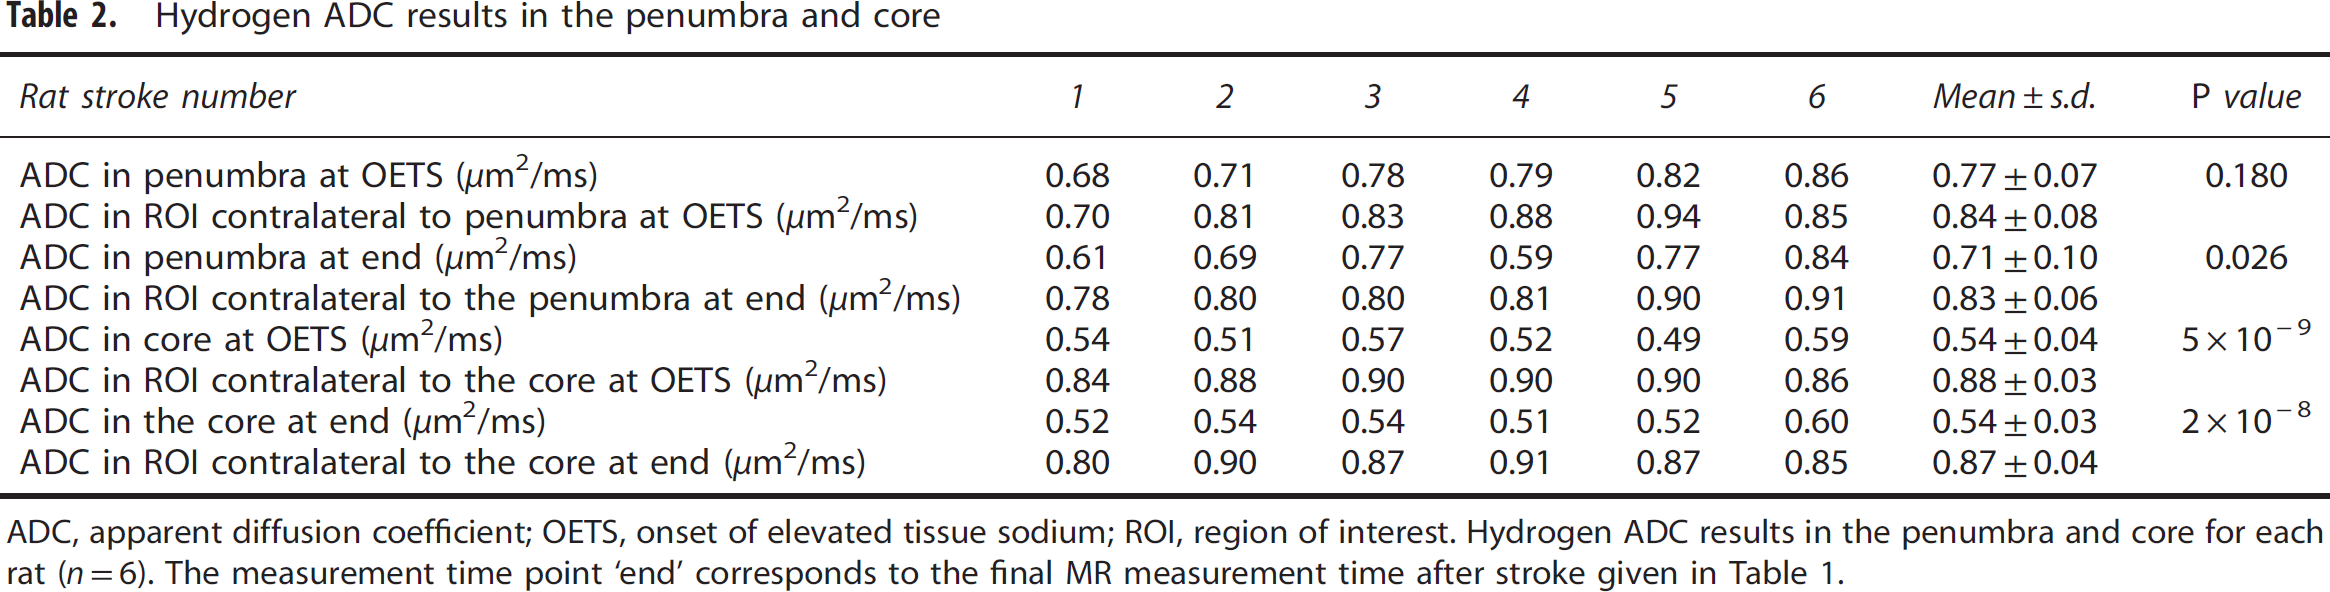
ADC, apparent diffusion coefficient; OETS, onset of elevated tissue sodium; ROI, region of interest.
Hydrogen ADC results in the penumbra and core for each rat (
In the contralateral hemisphere, the ADC values were 0.83±0.06 and 0.87±0.04 μm2/ms, respectively, for ROIs homotopic to the penumbra and core. The ipsilateral ADC data were thresholded at 0.53 μm2/ms, 6 with values below this threshold shaded black. Qualitative data in Figure 2 show that tissue with ADC values below this threshold appeared rapidly within the first 20 minutes in a large fraction of the (later defined) core ROI. Thereafter, there was a slight increase in ADC-defined lesion size in this and other animals in the group (Figures 2 and 3).
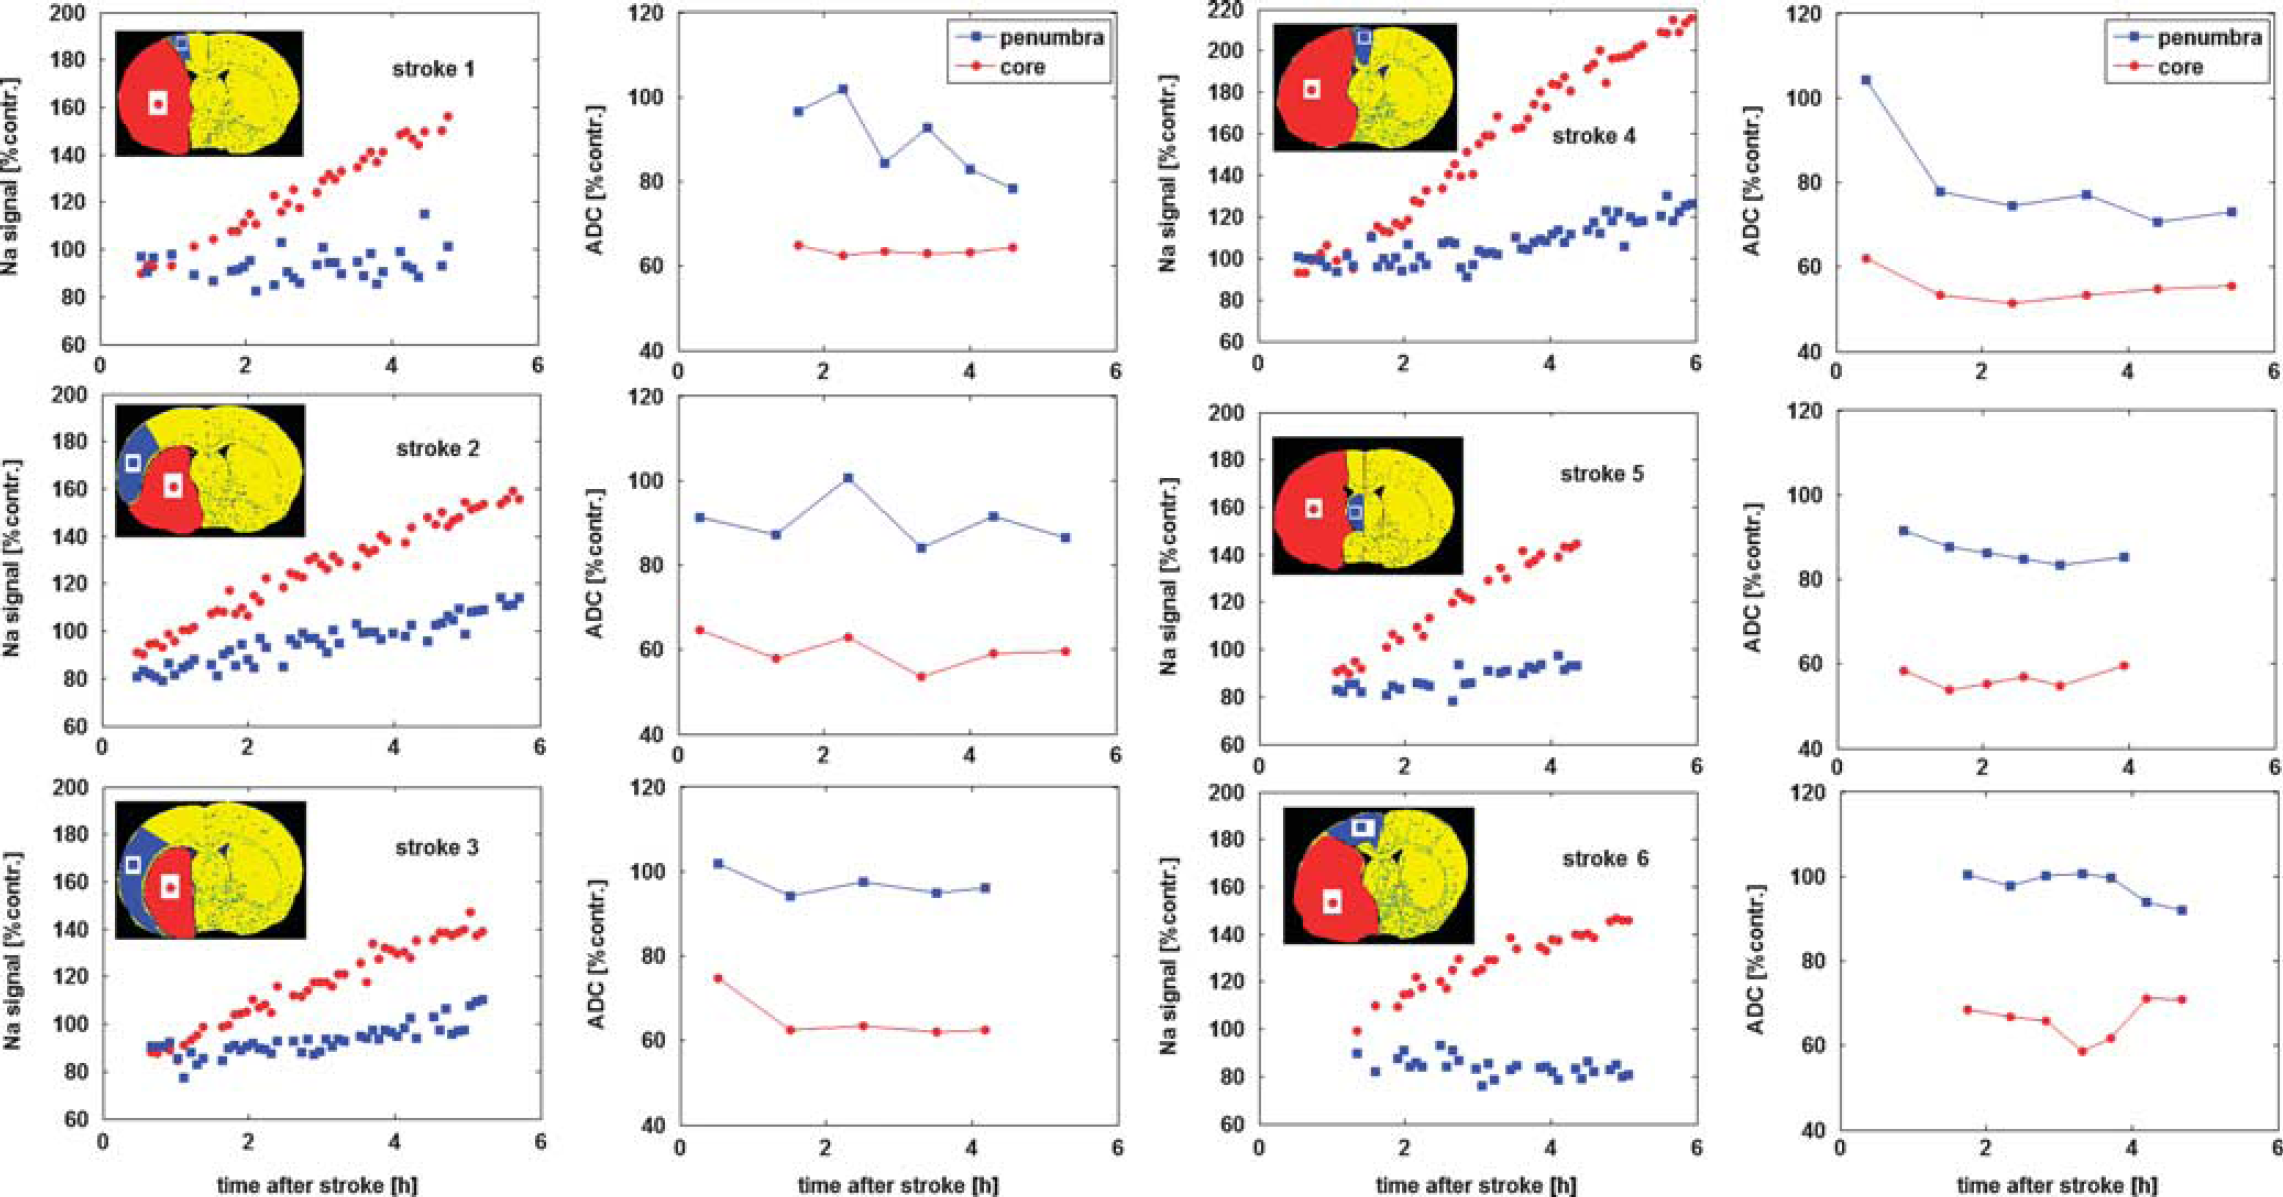
Relative sodium signal and apparent diffusion coefficient (ADC) profiles in each animal. Data are averaged across regions of interest (ROIs) in the penumbra and core tissue (shown in the inset stereotaxic atlas plates), expressed as a % of the contralateral ADC of ROI ADC and sodium values and plotted as a function of time after middle cerebral artery occlusion (MCAO). Note that linear extrapolation of the core sodium signal (red circles) back to the
A linear increase in the sodium signal was observed in core tissue (Figure 3). By the end of the experiment (330±50 minutes after MCAO), the sodium signal in core tissue averaged 155±29% of contralateral values. The OETS, averaged across the group, deviated by 72±24 minutes from the actual time of arterial occlusion.
When sodium in the core starts to rise above contralateral values (OETS=72±24 minutes after MCAO), the penumbra sodium signal was significantly decreased (88±6% of contralateral,
At the OETS, the ADC value in histologically defined core was already significantly lower than in the contralateral ROI, whereas the ADC value in the penumbra was not significantly different from the contralateral ROI (Table 2). By the end of the experiment, the penumbra ADC value was significantly lower than the contralateral ROI but was still above the viability threshold (group data 0.71±0.10 μm2/ms,
Discussion
Because viability of brain tissue requires maintenance of a strong sodium concentration gradient between the intra- and extracellular spaces, the ischemic penumbra may be defined as a region of constrained blood supply in which the sodium concentration gradient is maintained. If perfusion is not restored, energy stores become exhausted, membranes depolarize and the concentration gradient is lost as sodium levels increase in the intracellular space. When this occurs, the tissue takes on the characteristics of the ischemic core, which also includes a significant reduction in ADC. We have explored two potential uses for MR-defined TSC: (1) to predict SOT and (2) to identify penumbral tissue.
1. Tissue Sodium Signal to Predict Stroke Onset Time
The time point at which tissue sodium, in the affected hemisphere, increases above contralateral levels (i.e., the OETS) has been reported to provide an estimation of the SOT; the present study highlights the limitations of such an approach, given the heterogeneity in ischemic stroke patients.
Defining the onset of elevated tissue sodium from linear regression data
Jones
2. TSC to Identify Penumbral Tissue—23Na Decrease in Penumbra Tissue
At the OETS, in comparison with the core, the penumbra displays a significant decrease in sodium signal (88±6% compared with contralateral sodium signal) coincident with a small nonsignificant decrease in ADC value (Tables 1 and 2). A similar-sized decrease in sodium signal was observed in a previous study, 11 although the authors did not differentiate between penumbra and core tissues. We have previously reported a 4 mmol/L decrease in sodium at various times after MCAO in presumed penumbra tissue, 13 whereas a nuclear magnetic resonance study reported a 5% sodium signal decrease after artery occlusion in normoglycemic tissue, with no change in hypo- and hyperglycemic tissues. 18 Factors that could conceivably contribute to the observed decrease in tissue sodium in the penumbra include the following:
A perfusion effect
Immediately after arterial occlusion, blood flow reduces in the territory of the blocked blood vessel, whereas the intravascular volume remains constant, which will have no effect on the overall sodium content in the intravascular space of hypoperfused voxels. Consequently, perfusion effects are not thought to contribute significantly to the observed decrease in tissue sodium in the penumbra.
Relaxation-time effect
The relaxation time differences between intra- and extracellular sodium nuclei can have a strong effect on the measured sodium signal, particularly considering that intra- and extracellular
Considering that the intravascular compartment (with a 5% volume fraction) and the extracellular compartment (20% volume fraction) both contain a 140-mmol/L concentration of sodium, whereas the intracellular compartment (75% volume fraction) has a lower concentration of 10 mmol/L, the net density-weighted sodium signal originating from the extracellular space is ∼82%. At 9.4 T, the transversal relaxation time for the sodium nuclei
At 8.5 T, the intracellular longitudinal relaxation time,
The relative sodium signal for each compartment (
The signal levels measured for different sodium concentrations, (Na), and volumes,

To give a numerical estimation, it is further assumed that the influx of sodium ions into still viable penumbra cells leads to an increase in intracellular sodium concentration to 20 mmol/L 33 because the Na/K ATPase pump is still active and the extracellular sodium compartment is much smaller volumetrically so that it would be hard to increase the intracellular concentration drastically from 10 to 140 mmol/L within minutes. Then we further assume that the net amount of sodium ions contributing to the MR signal measured from a single voxel in such tissue remains constant and that the volumetric ratios are unchanged during the acute stroke phase. To raise the intracellular sodium concentration by 10 mmol/L through an influx of ions from the extracellular compartment, the extracellular sodium concentration must decrease from 140 to 110 mmol/L. This would result in a 4% signal reduction. If the extracellular sodium concentration were to be reestablished at 140 mmol/L, a 14% signal increase would thus be expected, in obvious contradiction to the measured values in the penumbra in the current study. Although present, the relaxation time effect on the measured sodium reduction may thus be negligible when a sufficiently short TE is used in the data acquisition, as in this study.
Cell swelling effect
A decrease in TSC of 7±2% has been measured in the presumed penumbra in a rat permanent MCAO study in which there was no relaxation time weighting. 13 It is thus assumed that the sodium signal reduction observed in the current study most likely results from an actual TSC reduction in observed penumbra tissue. An actual TSC decrease can be caused by an increase in intracellular sodium concentration, resulting in disturbed homeostasis and subsequent water influx, which in turn increases the intracellular compartmental volume fraction. Because the measured voxel size is constant during the experiment, the extracellular space thus decreases and consequently the total sodium concentration reduces. Assuming an increase in the intracellular volume normally comprising 75% of a tissue voxel to 79% and an intracellular sodium concentration that, hence, is diluted to the normal content of 10 mmol/L with 140 mmol/L extracellular sodium concentration, a 13% signal decrease is computed using the above-mentioned equations. This is in good agreement with the measured reduction of 12% in this study. Cell swelling will be accompanied by an ADC decrease, as measured in penumbra in the current study where an ADC decrease of ∼15% was evident by 6 hours after stroke. Indeed, the reduction in ADC values because of cellular edema during the acute stroke phase is a well-documented phenomenon. 5 The specific time at which the ADC decreases below the viability threshold appears to occur later in tissue that remains viable for longer, 5 whereas the sodium signal was observed to be decreased in penumbra tissue long before ADC values reduced significantly below contralateral values in the same region (Figure 3).
Reduced sodium signal may hence serve as a measure for cell swelling in still-viable tissue. A decreased sodium signal in hypoperfused tissue was also previously reported in a study involving stroke in rabbits. 11 However, no pathophysiological interpretation was proffered because separate penumbra and core identification was not possible.
Temporal Variations in Sodium Signal in Core and Penumbra Tissue
The observed sodium slope in the core was measured to be 12.5±3.5%/hour, which is below the rate reported in previous rat studies (∼22–25%/hour).12, 13, 14 However, considering the
After the OETS, the subsequent gradual increase of 2.5%/hour observed in the penumbra sodium signal could potentially be explained by the gradual rupturing of cellular membranes within the affected region, that is, as the tissue gradually becomes irreversibly damaged. The resulting increase in TSC this would engender has been described previously; 7 in the model proposed here, the occurrence of an intermediary phase in tissue at risk, wherein cellular swelling results in a reduction in TSC, is added. Further studies are required to verify this hypothesis.
It remains unclear, however, whether the slow increase in sodium signal observed in penumbra tissue is occurring in still-viable tissue, or whether it is because of the loss of cellular integrity for progressively large numbers of individual cells within the penumbra tissue, with the rest remaining intact. It should be noted that the observed increase could be influenced by a partial volume effect from the neighboring core area, given the relatively small penumbral area in these animals, or diffusion in extracellular Na+ along the concentration gradient from the core, to the neighboring penumbral tissue. This question could be answered by chemical shift imaging experiments. Shift reagents have acute toxicity issues
Prolonged Tissue Survival in the Penumbra
By 6 hours after MCAO, it had been expected, from previous experience with this model that no penumbra would remain. Over the first 4–6 hours after MCAO, the ADC lesion normally grows until it encompasses the whole of the hypoperfused region. The results in this study show that this was the case for none of the six investigated strokes (suggesting that the penumbra can survive for longer than previously thought). We assume that the tight control and maintenance of the physiology of the animals within normal limits (e.g., PaO2, PaCO2, blood pressure, and temperature) during MRI scanning may have resulted in the prolonged tissue survival.
Sodium magnetic resonance imaging for Clinical Acute Stroke Diagnostic Imaging
The current treatment guidelines for stroke patients recommend a time window of 4.5 hours from stroke onset for thrombolytic therapy. In cases where SOT is unknown, a technique that could determine SOT would clearly be of benefit within this framework. However, a technique that could reveal the extent of penumbral tissue is arguably of more utility to stroke clinicians. Thrombolytic therapy could benefit some patients who still have penumbra beyond 4.5 hours, but put patients lacking penumbra within the 4.5-hour window at increased risk of hemorrhage. It may be here that sodium MRI has most to offer, through identification of the presence of penumbral tissue, leading to a more patient-specific treatment regime. A combination of sodium MRI and DWI, for example, could represent an optimal protocol for guiding patient management: the former indicating whether at-risk but potentially salvageable tissue is still present in the patient, with the latter giving an overall sense of the extent of damage in the brain, and the combination used to determine whether the patient is likely to benefit from the treatment.
Conclusion
A significant decrease in the sodium signal in the acute phase of stroke has been measured for the first time in penumbra tissue identified using a combination of perfusion and histology data. It is clear from the current and previous studies that increased tissue sodium levels indicate irreversibly damaged tissue, suggesting that a threshold for tissue viability lies close to normal values. Given that it is now accepted that the DWI (or ADC) lesion is likely to include some penumbral tissues at early time points after stroke, sodium MRI may more accurately identify both potentially viable penumbra and nonviable core tissue, although its potential to accurately determine a patient's SOT seems doubtful. Nevertheless, by serving as a marker for tissue viability, sodium MRI may obviate the need to estimate SOT, opening the way for a more patient-specific treatment regime, perhaps via a combination of sodium and diffusion MRI. Normal and reduced sodium levels are a good indicator for still-viable tissue.
Footnotes
ACKNOWLEDGMENTS
Dr Friedrich Wetterling acknowledges funding from the School of Physics and the Faculty of Engineering (Marie Curie Fellowship, SYSWIND) at the Trinity College Dublin as well as financial postdoctoral fellowship support from the University of Heidelberg.
The authors declare no conflict of interest.