
Abstract
It is becoming evident that type 2 diabetes mellitus is affecting brain energy metabolism. The importance of alternative substrates for the brain in type 2 diabetes mellitus is poorly understood. The aim of this study was to investigate whether ketone bodies are relevant candidates to compensate for cerebral glucose hypometabolism and unravel the functionality of cerebral mitochondria in type 2 diabetes mellitus. Acutely isolated cerebral cortical and hippocampal slices of db/db mice were incubated in media containing [U-13C]glucose, [1,2-13C]acetate or [U-13C]β-hydroxybutyrate and tissue extracts were analysed by mass spectrometry. Oxygen consumption and ATP synthesis of brain mitochondria of db/db mice were assessed by Seahorse XFe96 and luciferin-luciferase assay, respectively. Glucose hypometabolism was observed for both cerebral cortical and hippocampal slices of db/db mice. Significant increased metabolism of [1,2-13C]acetate and [U-13C]β-hydroxybutyrate was observed for hippocampal slices of db/db mice. Furthermore, brain mitochondria of db/db mice exhibited elevated oxygen consumption and ATP synthesis rate. This study provides evidence of several changes in brain energy metabolism in type 2 diabetes mellitus. The increased hippocampal ketone body utilization and improved mitochondrial function in db/db mice, may act as adaptive mechanisms in order to maintain cerebral energetics during hampered glucose metabolism.
Introduction
Type 2 diabetes mellitus (T2DM) is a complex metabolic disorder characterised by a persistent increase in blood glucose often accompanied by obesity. It is estimated that 8.5% of the adult population suffers from diabetes and the prevalence is growing. 1 Several well-known peripheral complications arise from untreated T2DM, but it is becoming evident that T2DM also affects the brain.2,3 T2DM is a risk factor for the development of dementia and it is estimated that patients with T2DM have a two-fold higher risk of developing Alzheimer’s disease.3–5 The exact mechanisms are yet unknown, but alterations in cerebral energy metabolism and mitochondrial function have been proposed as causal links.3,6 Cerebral glucose hypometabolism has been observed in both T2DM and Alzheimer’s disease, which may suggest a mechanistic relation.2,6
T2DM disturbs peripheral glucose metabolism and elevated plasma levels of the ketone bodies acetoacetate and β-hydroxybutyrate are seen in untreated diabetic patients.7–9 Ketone bodies are formed in the liver and released to the blood for utilisation by other organs, including the brain. The brain is known to metabolise ketone bodies with region specific variations in utilisation.10,11 Yet little is known about brain ketone body metabolism in T2DM. Accordingly, we aimed to investigate whether metabolism of ketone bodies may compensate for the glucose hypometabolism observed in the diabetic brain. Acutely isolated brain slices from the T2DM animal model, the db/db mouse, were exposed to 13C labelled substrates to gain detailed insights into brain energy metabolism in T2DM. The db/db mouse is a well-known and commonly used animal model of T2DM. The homozygote mice express dysfunctional leptin receptors, leading to overeating and causing the T2DM phenotype including hyperglycemia, obesity, and elevated levels of serum ketone bodies.12–14
Mitochondria are the main producers of ATP in the cell and mitochondrial function is essential for cellular energy homeostasis. Malfunction of cerebral mitochondria is suspected to play a major role in development of dementia in T2DM.3,6 Several studies have already reported alterations in mitochondrial function in the diabetic brain.15–17 However, these studies assess the activity or expression of the individual complexes in the electron transport chain and not the full functional entity of the electron transport chain and oxidative phosphorylation. Hence, critical knowledge regarding functional energetics of cerebral mitochondria in T2DM is still lacking. Here, we investigate two major aspects of mitochondrial function, namely respiration, i.e. oxygen consumption and ATP production in brains of db/db mice.
Materials and methods
Materials
The stable isotopes [U-13C]glucose (99%) and [U-13C]β-hydroxybutyrate (99%) were from Cambridge Isotope Laboratories (Tewksbury, MA, USA) and [1,2-13C]acetate (99%) was from ISOTEC® (Miamisburg, OH, USA). Antibodies were from abcam (Cambridge, United Kingdom): pyruvate dehydrogenase antibody (ab110334), glutamine synthetase antibody (ab73593), and ADP-ATP-translocase antibody (ab195630). All other chemicals used were of the purest grade available from regular commercial sources.
Animals
Heterozygote (db/−) and homozygote (db/db) B6.BKS(D)-Lepdb/J mice were purchased from Jackson Laboratories (Bar Habor, ME, USA) and colonies were bred at Department of Drug Design and Pharmacology, University of Copenhagen. The animals were kept in humidity and temperature-controlled facility, 12/12-h light/dark cycle and free access to water and standard chow. The homozygote animals become obese after three to four weeks of age, and animals were grouped based on this phenotype, meaning that both wild-type and heterozygote littermates were included in the lean control group. Wild-type and heterozygote mice cannot be phenotypically distinguished and displays a uniform metabolic state.12,18 Both male and female mice were included. The investigators were aware of the phenotype; however, all experimental conditions were performed on each individual animal. Blood glucose was assessed, in neck blood immediately after decapitation, using a BAYER Breeze 2 instrument. The experiments were approved by the Danish National Ethics Committee and performed according to the European Convention (ETS 123 of 1986) and reported according to ARRIVE guidelines.
Brain slice incubations
Incubation of acutely isolated brain slices was performed as described in Andersen et al. 19 Animals were euthanised by cervical dislocation and decapitated. The brain was quickly submerged in ice-cold artificial cerebrospinal fluid (ACSF), containing in mM: NaCl 128, NaHCO3 25, KCl 3, CaCl2 2, MgSO4 1.2, KH2PO4 0.4, pH = 7.4. D-glucose (10 mM) was added to the ACSF. Cortices and hippocampi were dissected and sliced (350 µm) using a McIlwain tissue chopper (The Vibratome Company, O’Fallon, MO, USA). The slices were kept just below the surface of 10 mL 37℃ oxygenated (95%CO2/5%O2) ACSF and allowed to recover from slicing (60 min). Subsequently, slices were incubated in ACSF (60 min) containing either 5 mM [U-13C]glucose, 5 mM [1,2-13C]acetate, or 5 mM [U-13C]β-hydroxybutyrate, the latter two containing additionally 5 mM D-glucose. Metabolism was terminated by transferring the slices to ice-cold 70% ethanol. The slices were sonicated, centrifuged at 20,000 g × 20 min and the supernatant removed for gas chromatography-mass spectrometry (GC-MS) and high-performance liquid chromatography (HPLC) analysis. Pellets were saved for protein determination by Pierce method.
Mitochondrial isolation
Whole-brain mitochondria of db/db and control mice were isolated by a Percoll method, and analysed in tandem. Animals were euthanised by cervical dislocation and decapitated. All procedures were performed on ice or at 4℃. The brain was quickly removed and placed in isolation buffer (MSHE) containing in mM: mannitol 210, sucrose 70, HEPES 5, EGTA 1 and 0.5% BSA (fatty acid free), pH = 7.2, and homogenised using a Teflon douncer, 750 revolutions/min for seven to eight strokes. The homogenate was centrifuged, 500 g × 5 min and pellet discarded. The supernatant was centrifuged, 14.000 g × 10 min and pellet re-suspended in 12% Percoll MSHE solution. This suspension was layered on top of 21% Percoll MSHE solution and centrifuged, 18,000 g ×15 min. The supernatant was discarded and the mitochondrial fraction was rinsed with two subsequent centrifugations (18,000 g × 5 min and 14,000 g × 5 min) by suspending the mitochondria in MSHE and discarding the supernatant after each centrifugation. The final mitochondrial pellet was re-suspended in MSHE and the amount of protein was determined by the Bradford method.
Mitochondrial oxygen consumption rate
The isolated mitochondria were assessed at 37℃ using a Seahorse XFe96 flux analyser (Seahorse Biosciences, MA, USA). The isolated mitochondria were diluted in buffer containing in mM: mannitol 220, sucrose 70, KH2PO4 10, MgCl2 5, HEPES 2 and 0.2% BSA (fatty acid free), pH = 7.2, and 4 µg of protein were added to each well. The plate was centrifuged, 2,000 g × 20 min, at 4℃. Subsequently, the mitochondria were provided with pyruvate (10 mM, final concentration) to mimic substrate availability from glycolysis and malate (2 mM, final concentration) to support the pool of tricarboxylic acid (TCA) cycle intermediates. The compounds added were, in final concentrations: ADP (4 mM), oligomycin A (2.5 µg/mL), carbonyl cyanide-p-trifluoromethoxyphenylhydrazone (FCCP, 8 µM) and antimycin A (8 µM). Results are presented as O2 consumption in pmol/min.
Mitochondrial ATP synthesis rate
The ATP synthesis assay measures luminescence from the luciferase catalysed reaction of ATP and luciferin, using a NOVOstar plate reader (BMG Labtech, Ortenberg, Germany). The isolated mitochondria were diluted in buffer, containing in mM: sucrose 250, K2HPO4 15, MgSO4 2, EDTA 0.5 and 0.5% BSA (fatty acid free), pH = 7.2. Mitochondria (2.5 µg of protein) were added to each well, containing pyruvate and P1, P5-diadenosine pentaphosphate at final concentrations of 5 mM and 10 µM, respectively, and a luciferin-luciferase cocktail. Subsequently, ADP and malate were injected at final concentrations of 2 and 2.5 mM, respectively. Finally, ATP (250 µM) was injected, as internal standard. The assay was performed at 28℃ for optimal luciferin-luciferase response. Results are presented as ATP synthesis in nmol/(min × mg).
Metabolic mapping by GC-MS
The method is described in Walls et al. 20 Shortly, amino acids and TCA cycle intermediates were extracted by 96% ethanol and benzene under acidified conditions and derivatised using N-tert-butyldimethylsilyl-N-methyl-trifluoroacetamide. The samples were analysed by gas chromatography (GC, Agilent Technologies 7820A, J&W GC column HP-5MS) coupled to a mass spectrometer (MS, Agilent Technologies 5977E). Isotopic enrichment was corrected for natural abundance of 13C as described in Walls et al. 20 The data are presented as molecular carbon labelling (MCL), an average of total 13C enrichment in the given molecule. 20
Amino acid and lactate determination
Quantitative determination of amino acids in brain extracts was determined by reverse phase HPLC (Agilent Technologies 1260 Infinity, Agilent ZORBAX Eclipse plus C18 column). A pre-column o-phthalaldehyde derivatisation and fluorescent detection (excitation λ = 338 nm, emission λ = 390 nm) was performed. A gradient elution with aqueous mobile phase A (10 mM NaH2PO4, 10 mM Na2B4O7, 0.5 mM NaN3, pH = 8.2) and mobile phase B (acetonitrile 45%: methanol 45%: H2O 10%, V:V:V), was used. Mobile phase B increased linearly from 2% to 57% from 0 to 30 min, then from 57% to 100% in 0.1 min, to return again to 2% in minute 33.6 with a total run time of 35 min. The amounts of amino acids were determined from standards containing the amino acids of interest. Lactate released from brain slices to the medium was assessed by a lactate assay-kit from R-Biopharm AG (Darmstadt, Germany), according to the manufacturer’s instructions.
Western blots
Whole-brain homogenate and isolated mitochondria of db/db and control mice were analysed by Western blotting using primary antibodies against pyruvate dehydrogenase, glutamine synthetase, and ADP-ATP-translocase. Equal amounts of protein were separated by SDS-PAGE using NuPAGE® 4–12% Bis-Tris gels (ThermoFisher Scientific) before transferring of proteins to PVDF-membranes. The membranes were stained with a Ponceau S solution for validation of equal protein amounts, washed and incubated in the given primary antibodies. Appropriate HRP-conjugated secondary antibodies (Dako) were used. The blots were subsequently analysed with ECL™ Prime Western Blotting Detection Reagent. Quantification of Western blots was performed using ImageJ software.
Statistical analysis
Data are presented as means ± standard error of the mean (SEM) unless other is noted. Significant outliers were identified by Grubbs’ test (α = 0.05). Statistical significant differences between the db/db and control group were tested using Student’s unpaired t-test unless other is noted. Significance level was set at p < 0.05 and indicated with a single asterisk.
Results
Metabolic parameters and amino acids levels
Multiple studies have investigated the brains of db/db mice, and found several age-related cerebral complications, including: reduction in brain weight, mitochondrial dysfunction and tau phosphorylation.15,18,21,22 We employed db/db mice at an age of 15–16 weeks in order for the diabetes and obesity to be well established, but without late stage complications. At 15–16 weeks of age, homozygote db/db mice were significantly heavier compared to controls (51.5 ± 0.8 g vs. 28.1 ± 1.0 g), and displayed a significant increase in blood glucose levels (25.4 ± 1.4 mmol/L vs. 11.1 ± 0.4 mmol/L), confirming the establishment of obesity and diabetes.
HPLC analysis showed no alterations in amounts of amino acids (aspartate, glutamate, glutamine, serine, alanine and GABA) in extracts of cerebral cortical and hippocampal slices of db/db mice compared to controls. Representative results of amino acids amounts from cortical and hippocampal slices of db/db and control mice incubated in medium containing [U-13C] glucose are presented in Supplementary Figure 1.
Glucose metabolism in acute cerebral cortical and hippocampal slices
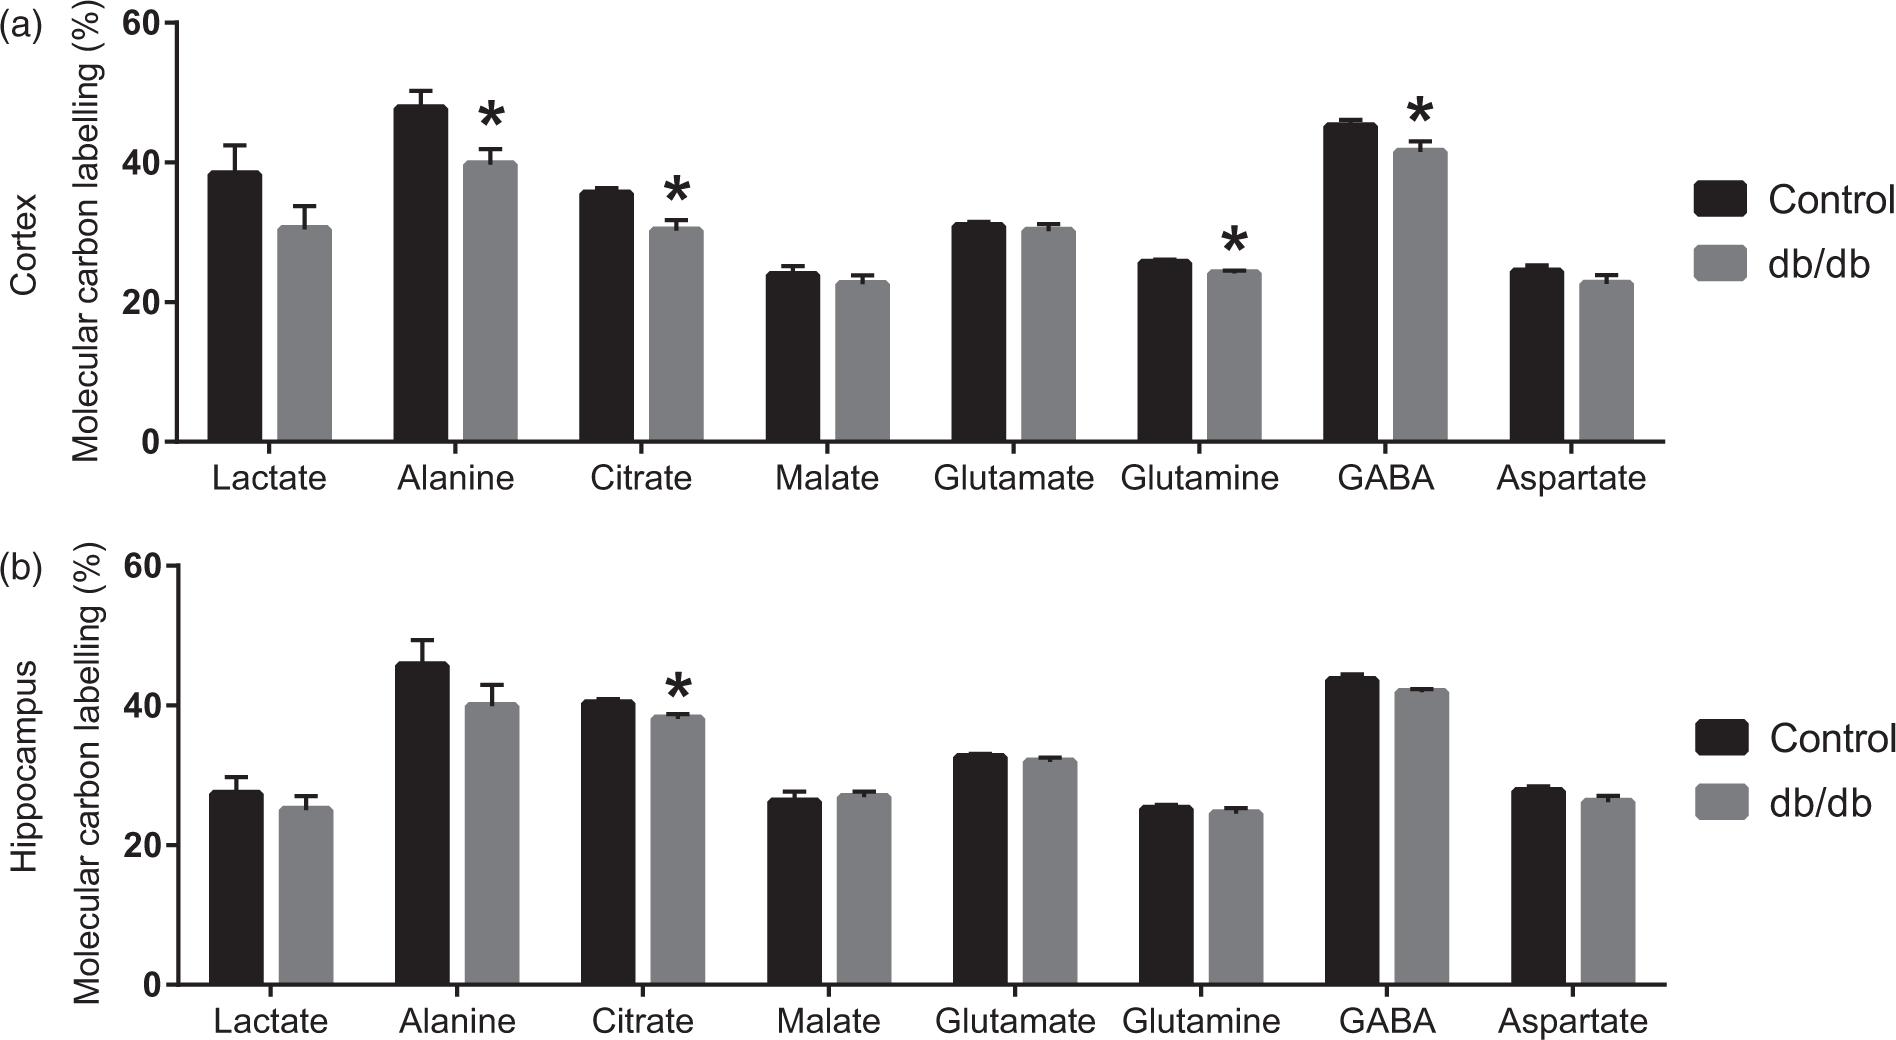
[U-13C]Glucose is metabolised to pyruvate via glycolysis and may subsequently be converted into lactate or alanine in both neurons and astrocytes (Figure 1). Molecular 13C labelling (MCL) of TCA cycle intermediates and amino acids obtained from incubations of cerebral cortical and hippocampal slices from control and db/db mice in medium containing [U-13C]glucose are presented in Figure 2. Decreases in 13C labelling in lactate and alanine from [U-13C]glucose were observed, the latter being significant, for cerebral cortical slices of db/db mice when compared to controls, indicating reduced glycolysis. The same tendencies were seen, though not significant, for the hippocampal slices. Entrance of [1,2-13C]acetylCoA into the TCA cycle gives rise to labelled citrate. A significant reduction in the labelling of citrate was observed in both cerebral cortex and hippocampus of the db/db mice. The decrease was larger in the cerebral cortex likely reflecting the more pronounced reduction in glycolysis. A decrease in labelling of neurotransmitter GABA and glia specific glutamine was observed when comparing cerebral cortical slices of controls to db/db mice, indicating metabolic impairments in GABAergic neurons as well as astrocytes. No changes were seen in the labelling of malate, glutamate and aspartate for both regions. These results demonstrate compromised glucose utilisation in both the cerebral cortex and hippocampus of the db/db mice, being more prominent in the cerebral cortex. Altered brain glucose metabolism in db/db mice may affect the amount of lactate released from the slices to the medium. However, we observed no change in lactate release (data not shown).
Metabolism of [U-13C]glucose, [1,2-13C]acetate and [U-13C]β-hydroxybutyrate in neurons and astrocytes. Glucose is the main oxidative fuel in the brain and is mainly metabolised through glycolysis to pyruvate. Pyruvate is converted into alanine or lactate or transported into the mitochondria. In the mitochondria, pyruvate is decarboxylated to acetylCoA by pyruvate dehydrogenase (PDH), and acetylCoA condenses with oxaloacetate to form citrate, the first intermediate of the tricarboxylic acid (TCA) cycle. α-Ketoglutarate formed in the TCA cycle may be converted into glutamate. In the astrocyte, glutamate is amidated to glutamine by the enzyme glutamine synthetase (GS) and can subsequently be transferred to the neuron. Here, the enzyme phosphate activated glutaminase (PAG) catalyses the hydrolysis of glutamine into glutamate. The neuron specific enzyme, glutamate decarboxylase (GAD) catalyses the conversion of glutamate into GABA. Glutamine and GABA are therefore used as markers of astrocytic and neuronal metabolism, respectively. During diabetes or starvation, the ketone bodies, acetoacetate and β-hydroxybutyrate, are formed in the liver and released to the blood. The compound acetate has been found to be predominantly metabolised in astrocytes. Both acetate and β-hydroxybutyrate are enzymatically converted into acetylCoA for entrance into the TCA cycle. Metabolism of [U-13C]glucose, [1,2-13C]acetate and [U-13C]β-hydroxybutyrate give rise to [1,2-13C]acetylCoA, i.e. acetylCoA containing two 13C carbons. This labelled acetylCoA enters the TCA cycle and give rise to incorporation of 13C in several TCA cycle intermediates and amino acids. Molecular 13C labelling from [U-13C]glucose metabolism. TCA cycle intermediates and amino acids labelled from [U-13C]glucose during incubation of brain slices from lean control and db/db mice. (a): cerebral cortical slices. (b): hippocampal slices. Results are presented as mean ± SEM, n = 7 – 11 obtained from individual animals. Statistically significant differences were tested employing Student’s t-test, p < 0.05.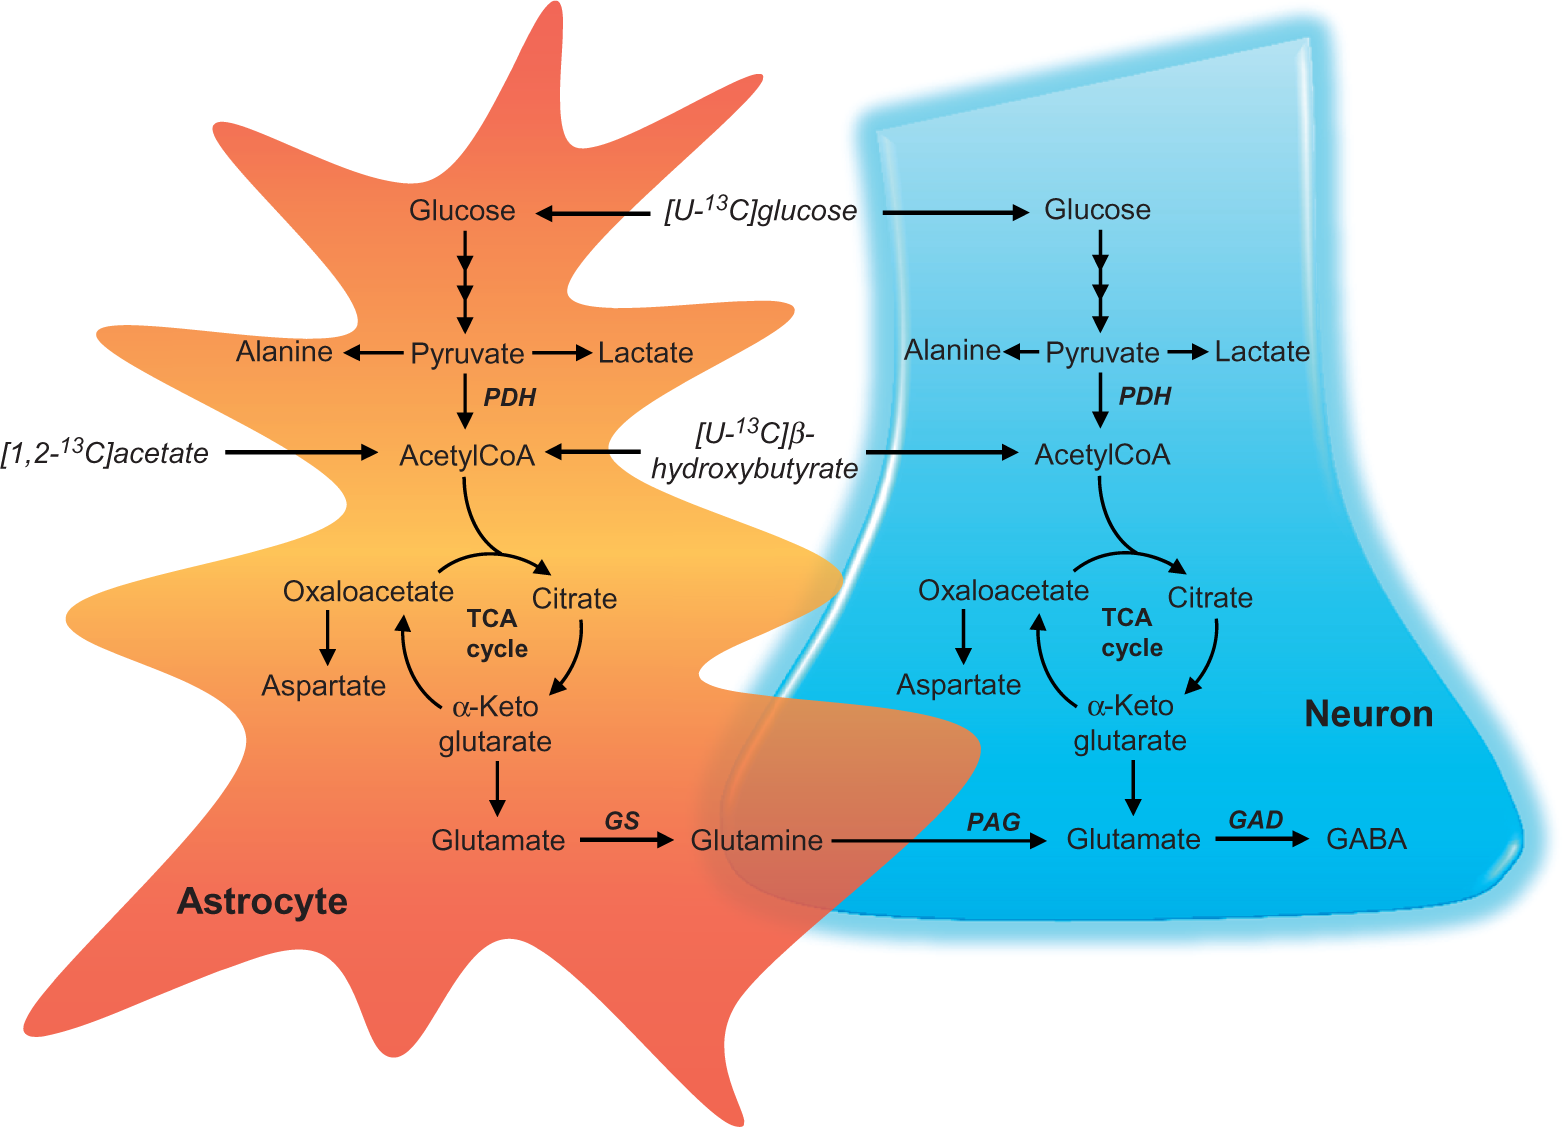
Metabolism of acetate and β-hydroxybutyrate in acute cerebral cortical and hippocampal slices
The labelling of TCA cycle intermediates and amino acids obtained from incubations of cerebral cortical and hippocampal slices from control and db/db mice in medium containing [1,2-13C]acetate or [U-13C]β-hydroxybutyrate, both in the presence of D-glucose, are presented in Figures 3 and 4. Metabolism of [1,2-13C]acetate and [U-13C]β-hydroxybutyrate both give rise to labelled acetylCoA (Figure 1). No changes in labelling were observed for the cerebral cortical slices from db/db mice when incubated with [1,2-13C]acetate being mainly metabolised in astrocytes.
23
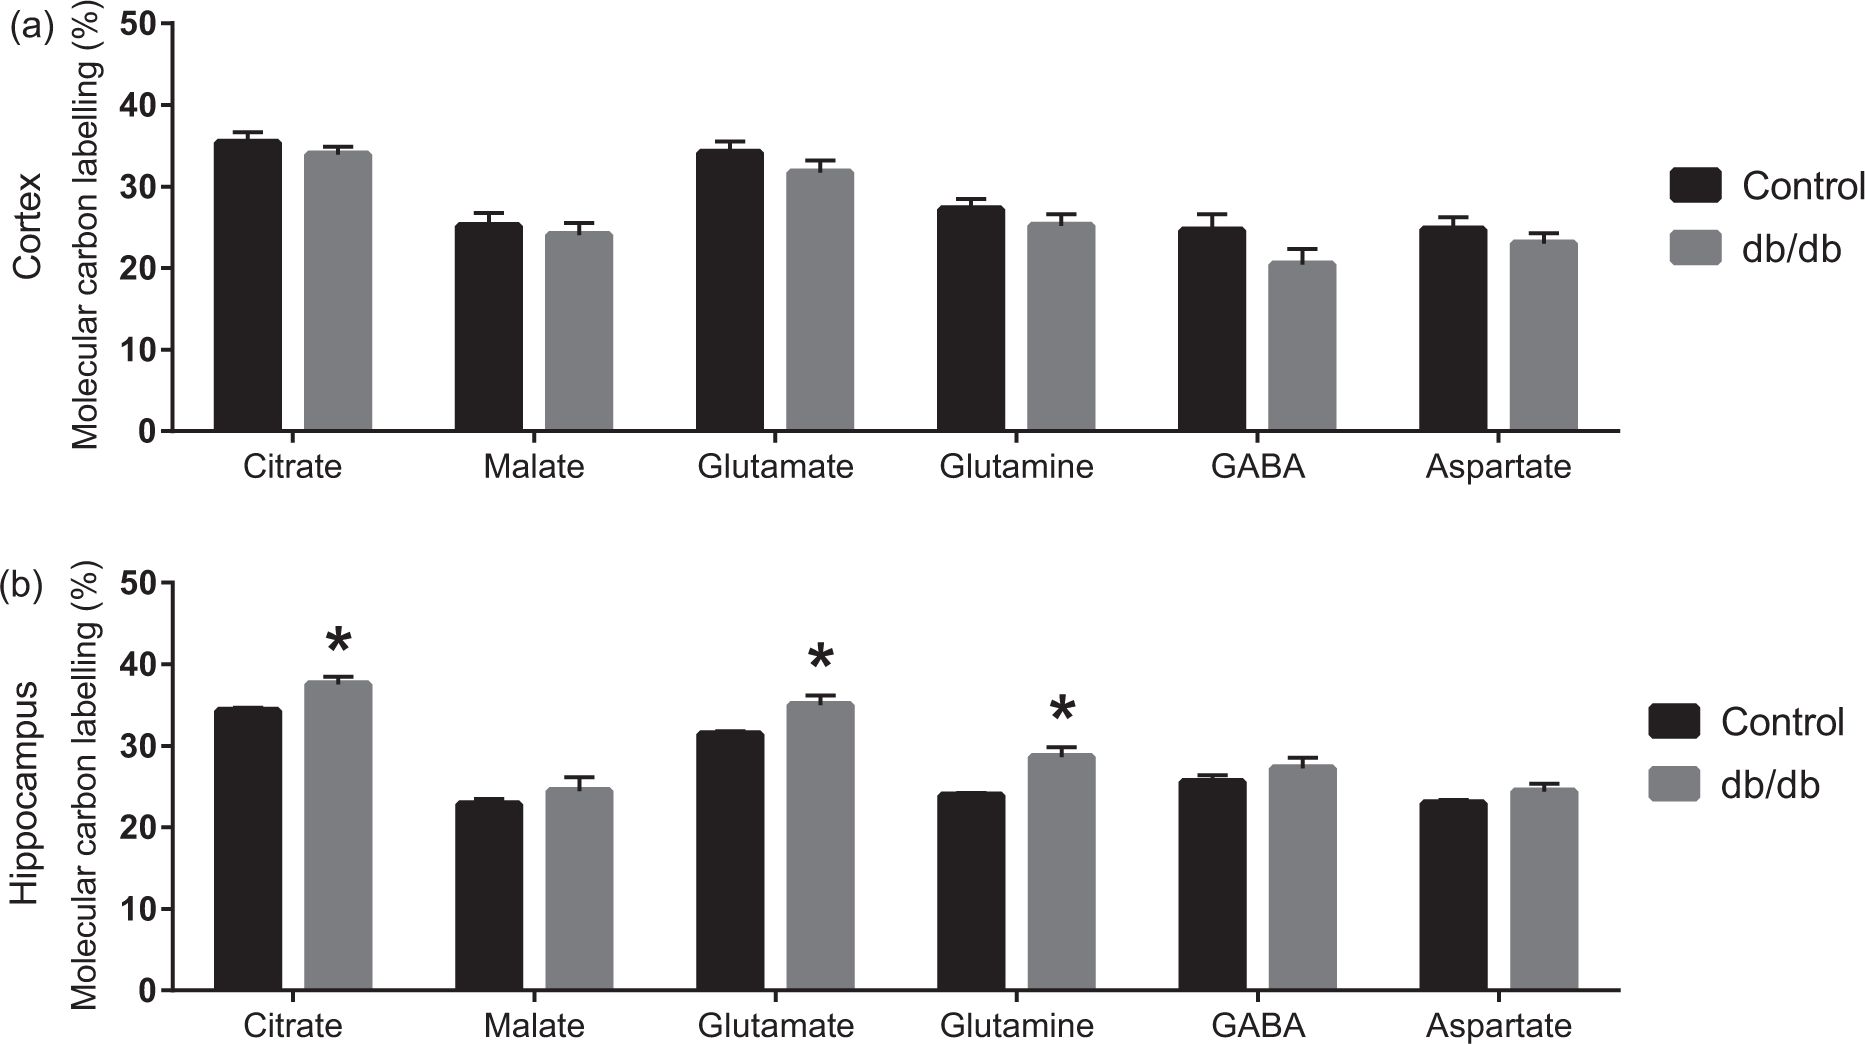
In contrast, labelling in citrate and glutamine was markedly higher in the hippocampal slices from db/db mice when incubated in medium containing [1,2-13C]acetate. This indicates that astrocyte metabolism is affected in the hippocampus of the db/db mice. Similar results were observed when incubations were performed in media containing [U-13C]β-hydroxybutyrate, the labelling from which was unchanged in cerebral cortical slices. In contrast, a significant increased labelling of citrate, glutamine and glutamate were observed for hippocampal slices from db/db mice incubated in medium containing [U-13C]β-hydroxybutyrate compared to hippocampal slices from control mice. Taken together, these results indicate that the utilisation of ketone bodies is up-regulated in the hippocampus, but not in the cerebral cortex of the db/db mouse. Moreover, the increased labelling of glutamine may suggest that the astrocyte specific enzyme glutamine synthetase has a higher expression or activity in the brain of db/db mice.
Molecular 13C labelling from [1,2-13C]acetate metabolism. TCA cycle intermediates and amino acids labelled from [1,2-13C]acetate during incubation of brain slices from lean control and db/db mice. (a): cerebral cortical slices. (b): hippocampal slices. Results are presented as mean ± SEM, n = 7–11 obtained from individual animals. Statistically significant differences were tested employing Student’s t-test, p < 0.05. Molecular 13C labelling from [U-13C]β-hydroxybutyrate metabolism. TCA cycle intermediates and amino acids labelled from [U-13C]β-hydroxybutyrate during incubation of brain slices from lean control and db/db mice. (a): cerebral cortical slices. (b): hippocampal slices. Results are presented as mean ± SEM, n = 8–10 obtained from five animals. Statistically significant differences were tested employing Student’s t-test, p < 0.05.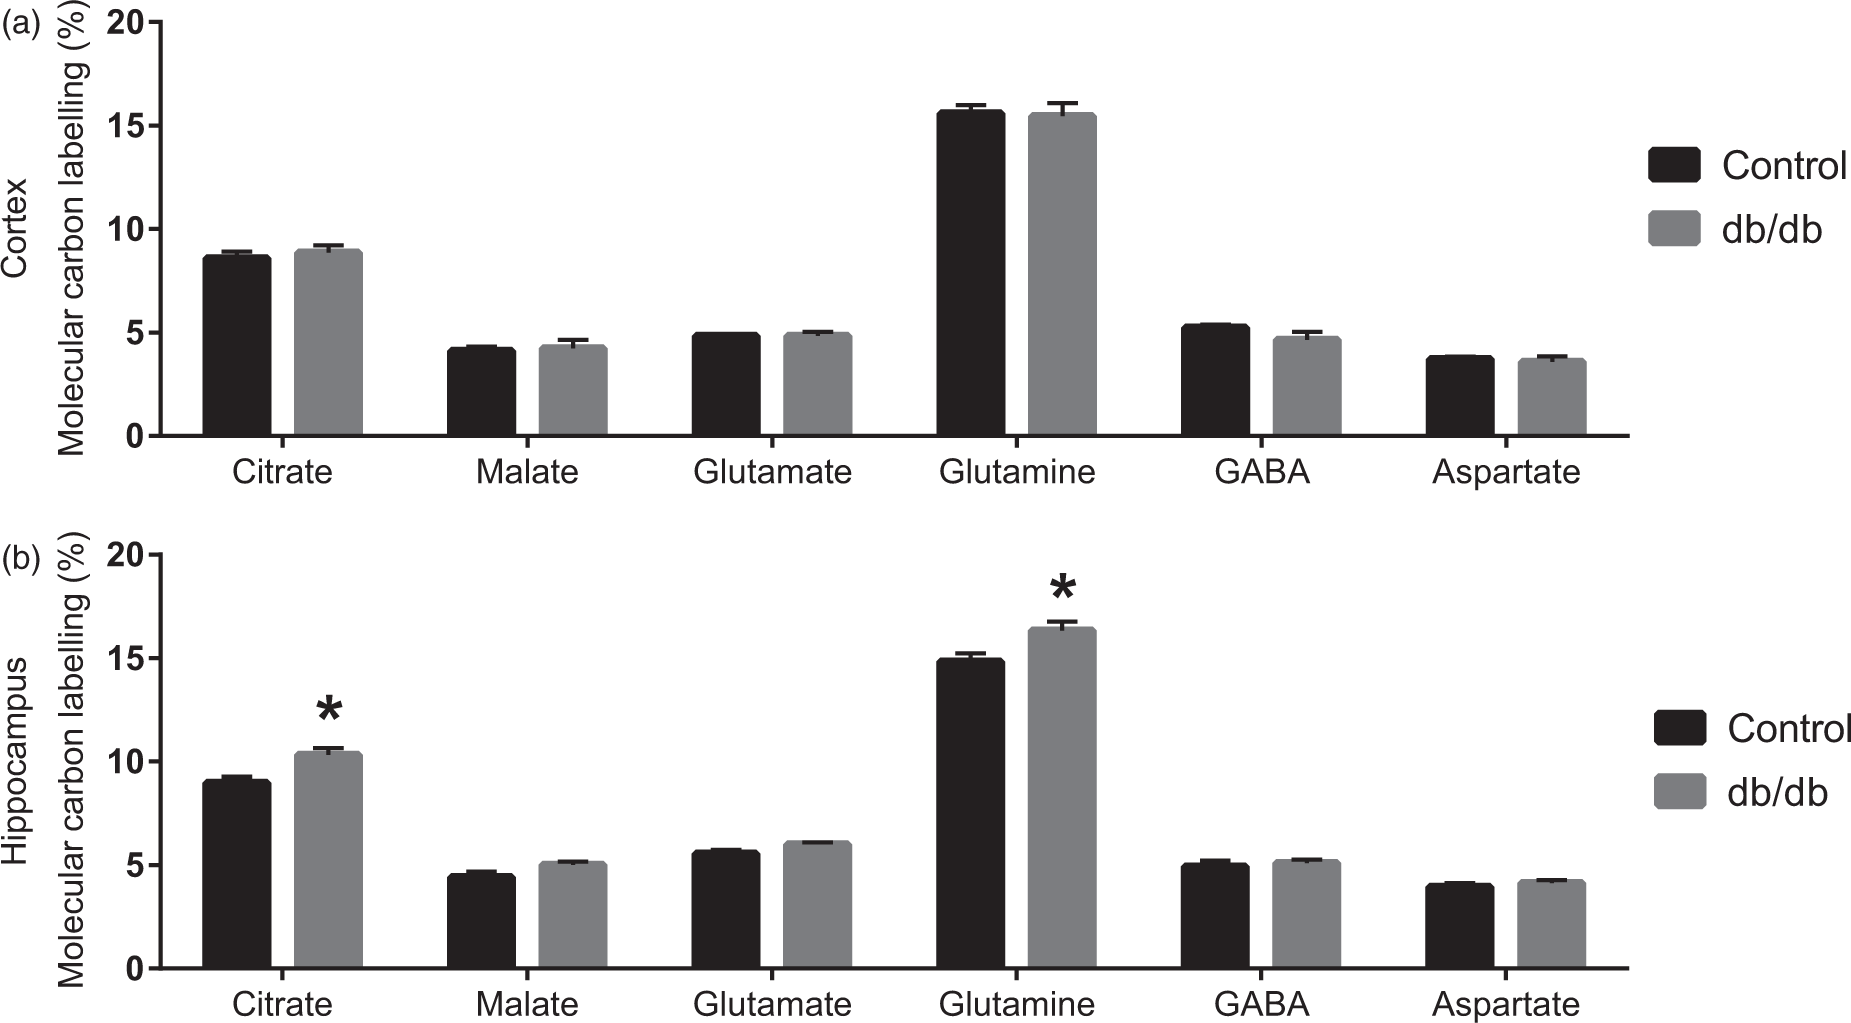
Cerebral mitochondrial function
Altered substrate utilisation may affect mitochondrial energetics, why this was investigated next. The oxygen consumption rate (OCR) and the ATP synthesis rate of isolated brain mitochondria from db/db and control mice are presented in Figure 5. No significant change was observed for basal respiration of mitochondria from db/db mice and controls. However, the isolated mitochondria of the db/db mice exhibited a significant increase in OCR upon the addition of ADP compared to controls (Figure 5(a) and (b)). The increase in ADP response is coupled to an increase in ATP synthase activity, since the response was completely blocked by oligomycin A, a specific inhibitor of the ATP synthase (Figure 5(a) and (b)). Moreover, the increased capacity to synthesise ATP upon addition of ADP of mitochondria isolated from the db/db mice was confirmed by an on-line ATP synthesis assay (Figure 5(c)). No differences in OCR were observed by addition of oligomycin A or the complex III inhibitor antimycin A. The maximal respiration induced by FCCP was not different in the mitochondria isolated from the db/db mice compared to those isolated from the control mice, suggesting that the maximum functional capacity of the electron transport chain is not altered. These data point toward a compensatory mitochondrial mechanism at the level of oxidative phosphorylation in brain mitochondria of the db/db mouse.
Mitochondrial oxygen consumption and ATP production of isolated brain mitochondria from lean control and db/db mice. (a): Representative oxygen consumption rates of brain mitochondria isolated from one lean control and db/db mouse. Arrows indicate the specific time point of addition of compounds. Results are presented as mean ± standard deviation, n = 21. Statistically significant differences were tested employing Student’s t-test corrected for multiple comparisons using the Holm-Sidak method, p < 0.05. (b): Quantitative oxygen consumption rates of brain mitochondria obtained from lean controls and db/db mice. Basal refers to the point before ADP addition (see (a)), the remaining quantifications are made from the measurement after the addition of the respective compound (see (a)). Results are presented as mean ± SEM, n = 7. Statistically significant differences were tested employing Student’s t-test, p < 0.05. (c): ATP synthesis rate of brain mitochondria from lean control and db/db mice. Results are presented as mean ± SEM, n = 4. Statistically significant differences were tested employing Student’s t-test, p < 0.05.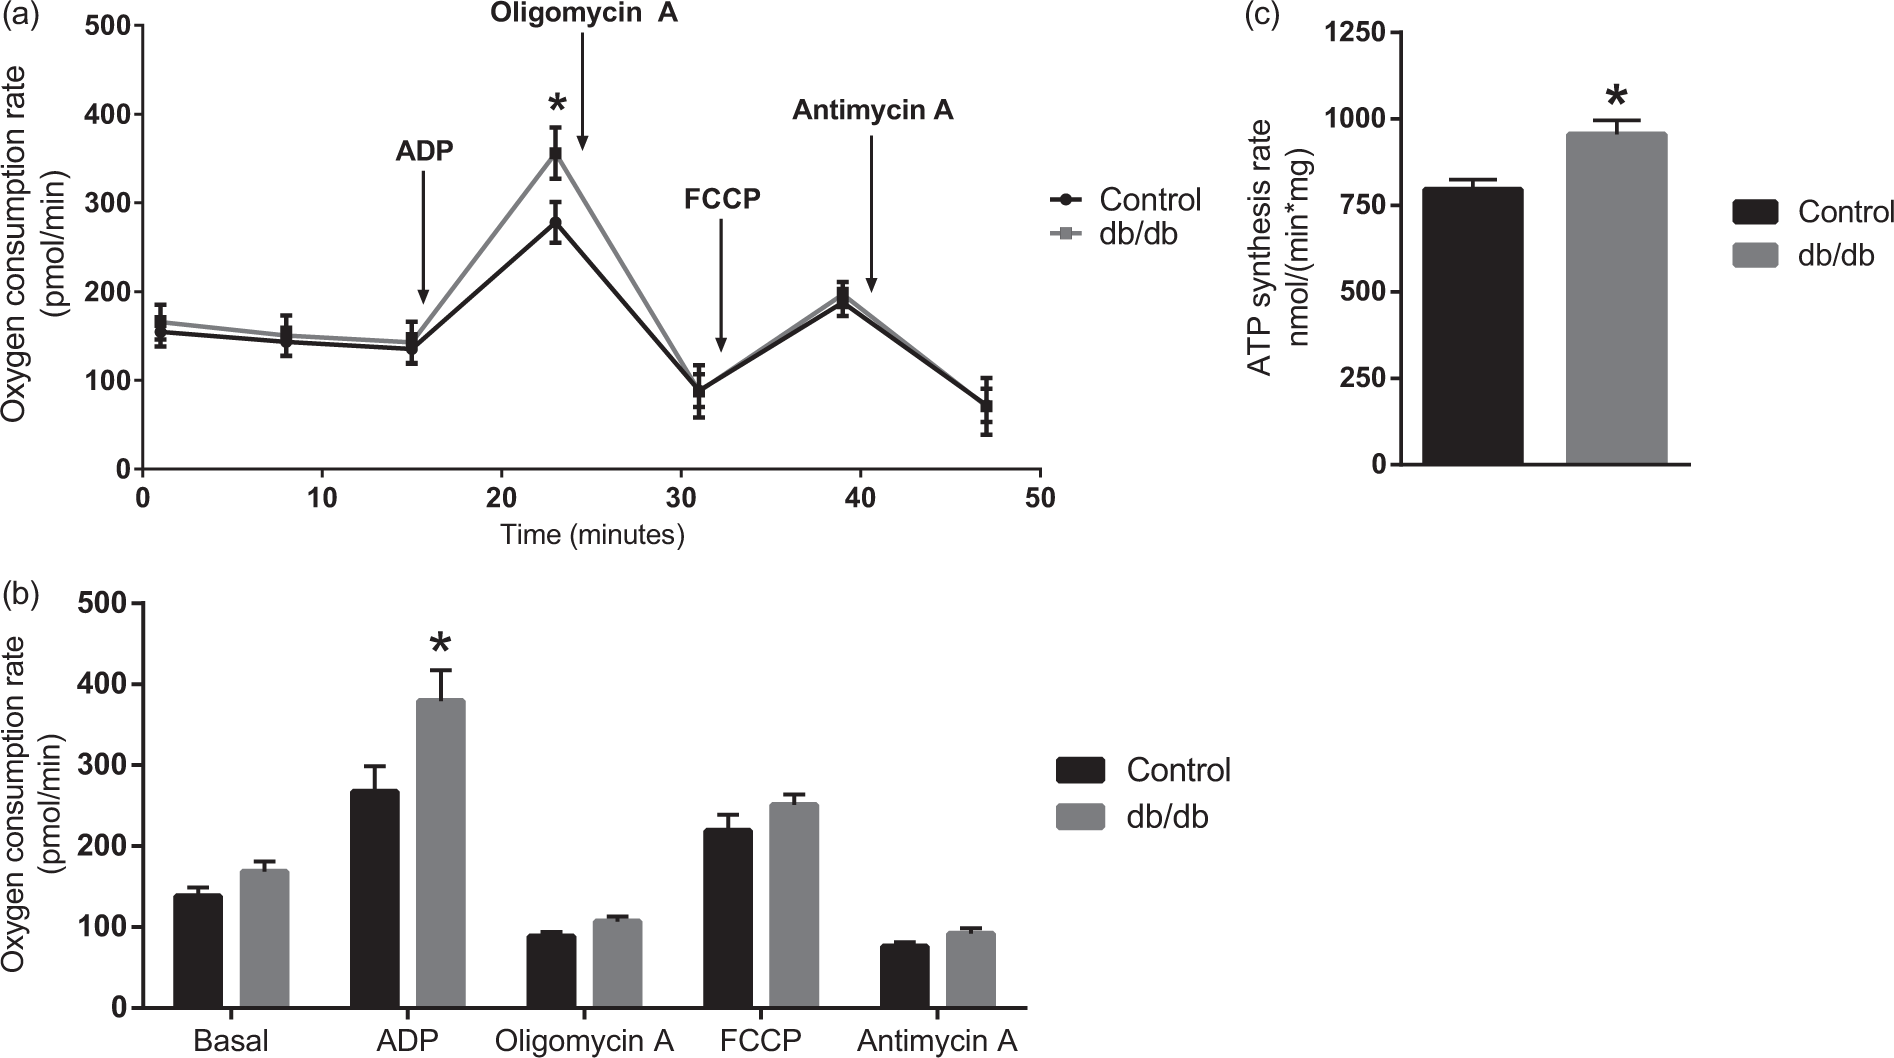
Protein expression of metabolic enzymes
Several of our observations might be explained by alterations in expression of key metabolic proteins. To determine whether this was the case, Western blotting was performed on whole-brain homogenate and isolated mitochondria from db/db and control mice. We did not observe any difference in the expression of pyruvate dehydrogenase and glutamine synthetase (Suppl. Figure 2) in the brain of db/db mice when compared to controls. In addition, the observed increase in oxidative phosphorylation might be explained by an up-regulated expression of the mitochondrial ADP-ATP-translocase. However, we found no significant change in the expression levels of the ADP-ATP-translocase in the brain of db/db mice (Suppl. Figure 2). Changes in the levels of these proteins are therefore not a likely explanation for the observed alterations in brain energy metabolism of the db/db mouse.
Discussion
We present evidence of glucose hypometabolism in cerebral cortical and hippocampal brain slices of db/db mice. Glucose metabolism was more affected in the cerebral cortex than in the hippocampus. In contrast, metabolism of acetate and β-hydroxybutyrate was elevated in hippocampal slices of db/db mice, while this was not the case for the cerebral cortex. Finally, isolated brain mitochondria of db/db mice displayed an augmented respiration and ATP synthesis upon addition of ADP.
Cerebral glucose hypometabolism in db/db mice
The expression level of the main enzyme processing pyruvate in brain, pyruvate dehydrogenase, was not altered in the db/db mice. However, it has previously been shown that the activity of this enzyme is decreased in brain homogenate from db/db mice. It was suggested that pyruvate dehydrogenase might be allosterically suppressed by an elevated concentration of acetylCoA, the concentration of which may be increased due to an elevated ketone body metabolism. 24 The reduced labelling of citrate from [U-13C]glucose in both cortical and hippocampal slices of the db/db mice may reflect reduced activity of pyruvate dehydrogenase. However, the lower labelling of alanine and lactate from [U-13C]glucose and no change in the amount of lactate released to the medium in brain slices of db/db mice indicate that glucose utilisation is affected upstream of pyruvate dehydrogenase. The distribution of glucose transporters in brain slices of db/db mice has previously been investigated and the hampered glucose utilisation was concluded not to be due to transport deficiency. 13 However, a decreased expression of phosphoglycerate kinase in the brains of db/db mice, a critical glycolytic enzyme, may contribute to the reduced glucose utilisation. 25 Interestingly, we have recently shown altered glucose metabolism and reduced TCA cycle activity in the cerebral cortex, but not the hippocampus, of the APPswe/PSEN1dE9 mouse model of Alzheimer’s disease prior to amyloid plaque formation. 19 The present study, likewise suggests that metabolism of glucose in the cerebral cortex is impaired to a greater extent, compared to the hippocampus, in T2DM. Taken together, these observations may suggest that metabolic impairments of the cerebral cortex represent an important mechanistic link in the development of Alzheimer’s disease in relation to T2DM.
Augmented ketone body metabolism in hippocampus of db/db mice
The level of serum ketone bodies is elevated in diabetic patients and in diabetic animal models such as the db/db mouse.13,14 The moderate elevation of plasma ketone bodies in the db/db mice is comparable to the levels observed in human type 2 diabetic patients. 9 Pierre et al. 26 have shown that both hippocampus and some areas of the cerebral cortex in db/db mice display an increased expression of the monocarboxylate transporters 1 and 2 already at 6 weeks of age. These transporters mediate the uptake of ketone bodies and acetate, across the plasma membrane. 27 An increased expression of these transporters may elevate the capacity for utilisation of ketone bodies, but interestingly this was not functionally reflected in our studies in the cerebral cortical slices of db/db mice. The elevated capacity for metabolism of acetate has been shown in both animal models and patients with type 1 diabetes.28,29 In contrast, Zheng et al. 30 recently found a decrease in 13C labelling of brain metabolites subsequent to intraperitoneal injection of [1,2-13C]acetate in db/db mice. 30 However, one might argue that this was due to dilution of the 13C labelling from the increased amount of circulating acetoacetate and β-hydroxybutyrate, which was not taken into account.
We show that the hippocampus but not the cerebral cortex of db/db mice exhibits an increased utilisation of ketone bodies. The increased 13C enrichment in glutamate observed from incubations with [U-13C]β-hydroxybutyrate, but not from incubations with [1,2-13C]acetate, likely reflects metabolic compartmentation of the two substrates (Figure 1). Acetate is primarily metabolised in the astrocytic compartment. 23 However, the largest pool of glutamate is neuronal, which would be labelled to a greater extent by metabolism of [U-13C]β-hydroxybutyrate and not from [1,2-13C]acetate. This observation furthermore suggests that the augmented ketone body metabolism is present in both neurons and astrocytes in the hippocampus of db/db mice. The enhanced hippocampal metabolism of ketone bodies is intriguing as several studies have shown memory impairments, increased tau burden and accumulation of amyloid β in the brains of db/db mice, all hallmarks of Alzheimer’s disease.18,22,31,32 Increased plasma levels of ketone bodies, through dietary supplementation, have been shown to exhibit beneficial effects in several neuropathological conditions, including stroke. 33 In patients with Alzheimer’s disease, ketone bodies have been shown to improve mental function, likely due to changes in cerebral energetics.34,35 In light of this, the regional augmentation of hippocampal ketone metabolism, presented in this study, could be an adaptive mechanism to maintain energetic homeostasis during hampered utilisation of glucose. However, further studies are needed to investigate if the elevated hippocampal ketone metabolism affects cognition in db/db mice.
Cerebral mitochondrial changes in T2DM
We have provided evidence that brain mitochondria from db/db mice exhibit an increased respiration and ATP synthesis in response to ADP. Several studies have investigated the expression and activity of the individual respiratory complexes in the brain of diabetic animal models. One study recently found a significant decrease in complex I and complex IV expression in the cerebral cortex of db/db mice, while another study found no such difference.16,36 Multiple other studies have found either reduced complex expression or activity in brains of animal models of both type 1 and type 2 diabetes.15,37,38 Electron transport chain complex expression and activity provide only indications of mitochondrial function from assessment of an isolated part of the coupled process between electron transport, formation of proton gradient and ultimately oxidative phosphorylation. Our results, measuring the function of the full entity of electron transport and ATP synthesis of isolated mitochondria do not suggest alterations in electron transport chain complex expression or functionality, but predict a compensatory mechanism increasing the capacity of oxidative phosphorylation in the type 2 diabetic brain. This observation might be linked to increased expression of the ADP-ATP translocase in the hippocampus of db/db mice as described by Ernst et al., 25 although we were not able to confirm this in brain mitochondria. Moreover, our observations are supported by studies showing an increased expression of specific subunits of the ATP synthase, in the diabetic brain.17,39 A limitation of this study is that mitochondria were isolated from whole-brain homogenates. Since the metabolic mapping using 13C substrates revealed region specific changes, this could be reflected as differences in regional mitochondrial function. Interestingly, it has been reported that a ketogenic diet increases the gene expression of subunits of the ATP synthase in the hippocampus. 40 It may be speculated that the elevated ketone body metabolism in the db/db brain enhances mitochondrial function.
Huang et al. 15 have recently shown that db/db mice at 26 weeks of age display a significant decrease in numbers of mitochondria, complex I activity (35%) and ATP content in the hippocampus. In contrast, they found that db/db mice at 13 weeks of age only displayed a slight (15%) reduction of complex I activity with no changes in number of mitochondria or ATP content. These results suggest that oxidative phosphorylation fully compensate for the hampered complex I activity at 13 weeks of age and show a clear age-dependent effect on mitochondrial health and function in the brain of db/db mice. In line with this we find intact electron transport chain activity combined with an increased ADP induced oxidative phosphorylation at 15–16 weeks of age.
Conclusions
We provide evidence for several changes in brain energy metabolism of the db/db mouse. The hippocampus exhibits an enhanced metabolism of ketone bodies and cerebral mitochondria display an increased level of oxidative phosphorylation. We suggest that these metabolic alterations, in the db/db mouse, may be adaptive changes related to the hypometabolism of glucose. Our findings are intriguing due to the observations of accelerated development of Alzheimer’s disease in T2DM, and further studies have to reveal if a possible metabolic link exists between the two pathologies.
Footnotes
Funding
The author(s) disclosed receipt of the following financial support for the research, authorship, and/or publication of this article: This project is financially supported by the Novo Nordisk Foundation (NNF-12359, HSW), the Lundbeck Foundation (JVA), the Memorial Foundation of Eva and Hans Carl Adolf Holm (JVA) and the Scholarship of Peter and Emma Thomsen (JVA).
Declaration of conflicting interests
The author(s) declared no potential conflicts of interest with respect to the research, authorship, and/or publication of this article.
Authors’ contributions
JVA, JDN and HSW designed the experiments. JVA, SKC and JDN performed the experiments and data analysis. JVA and HSW wrote the manuscript. All authors have approved and provided critical input for the final manuscript.
References
Supplementary Material
Please find the following supplemental material available below.
For Open Access articles published under a Creative Commons License, all supplemental material carries the same license as the article it is associated with.
For non-Open Access articles published, all supplemental material carries a non-exclusive license, and permission requests for re-use of supplemental material or any part of supplemental material shall be sent directly to the copyright owner as specified in the copyright notice associated with the article.