
Abstract
Regional temperature and quantitative regional cerebral blood flow responses to cortical spreading depolarization in the rat were continuously monitored in the same tissue using a microfabricated thermal diffusion sensor that recalibrates and measures in 5-s cycles. The regional cerebral blood flow response had four phases, including early hyperemia (peak: 226% of baseline; duration: 113.1 ± 14.4 s) and late oligemia (minimum: 57%, duration: 28.4 ± 3.7 min). Temperature rose with the start of the regional cerebral blood flow response to a peak increase of 0.28 ± 0.06℃ and returned to baseline near the start of oligemia. This technology may be useful for multimodal monitoring in both the laboratory and clinic.
Keywords
Introduction
Spreading depolarization (SD) describes an actively propagating (2–5 mm/min), near-complete breakdown of homeostasis in cerebral gray matter characterized by mass depolarization of neurons and astrocytes and the largest increase in metabolism of any known condition.1–3 The occurrence of SD, the hemodynamic response, and the local duration of sustained depolarization are key determinants of neuronal lesion development in acute brain injury. 4 In the human brain, SDs recur continuously for days or more following various forms of stroke or trauma and are monitored by subdural or intraparenchymal electrode arrays.5–7 In addition to electrophysiology, regional cerebral blood flow (rCBF) and partial pressure of tissue oxygen are useful in determining the local tissue impact of SD.7–10 Such multimodal measures, including temperature, may also aid in identifying SD when use of focal, minimally invasive electrodes limits detection of the spreading wave over a broader region.
The rCBF response to SD is usually measured as relative changes using laser Doppler flowmetry.1,10 Quantitative measures of absolute rCBF during SD have been achieved using 14C-iodoantipyrine autoradiography,11–13 the hydrogen clearance method, 14 or other diffusable tracers. 15 However, these methods cannot be applied continuously, and the absolute temporal rCBF changes during SD were estimated by the spatial pattern, providing a history of the propagating wave, at a single time point. 15 Continuous quantitative assessment of rCBF at present can only be measured using thermal diffusion flowmetry.9,16,17 This technique also has limitations, however, since it requires assumption that the temperature gradient between two sensors is constant during continuous measurement between calibration cycles. We eliminated the need for this assumption by developing a microfabricated thermal diffusion sensor that cycles rapidly (≤10 s) between heating and cooling phases and thus recalibrates for each rCBF measure.18–20 Here, we used this sensor to record the first accurate, real-time quantitative measures of the hemodynamic response to SD while simultaneously measuring temperature with the same sensor.
Methods
Animal procedures
Twenty-six male Sprague-Dawley rats weighing 250–450 g were used to study SD-induced temperature responses at two depths (n = 17) and cortical temperature and rCBF responses simultaneously (n = 9). Rats were housed in a temperature-controlled room (12-h light/dark cycle) with feeding ad libitum. Procedures were approved by the Institutional Animal Care and Use Committee of The Feinstein Institute for Medical Research and complied with the Guide for the Care and Use of Laboratory Animals (Institute of Laboratory Animal Resources). Results are reported in accordance with ARRIVE guidelines.
Rats were anesthetized (5% isoflurane for induction; 2.5%–3% during surgery; 1.5%–2% maintenance), and the head fur was shaved. They were then placed in a stereotaxic frame on a heating plate to maintain body temperature at 36.5℃ (Physitemp TCAC-2LV closed-loop controller) and breathed spontaneously (20/80 oxygen/nitrogen). Following midline scalp incision, a small (∼0.8 mm2) craniotomy was drilled over right parietal cortex, and the dura was incised before implanting the multisensor neural probe to a depth of 4.5 mm. A small burr-hole 3 mm anterior to the probe was made for SD induction. The scalp incision was then closed, and the neural probe and wound margins secured with dental cement, leaving only a small well for SD induction. After a waiting period of 2 h following surgery, SD was mechanically induced by pricking the cortex with a 30-gauge syringe needle, and the response was monitored for 2 h. At the end of experiments, rats were deeply anesthetized and euthanized by decapitation.
Multisensor neural probe and data acquisition
We developed a technique of integrating multiple microsensors, including electrocorticography (ECoG) electrodes and temperature and rCBF microsensors, on a flexible polyimide substrate. Detailed fabrication and operation procedures have been reported previously.18–20 The probe used here (0.7 mm o.d.) included two iridium oxide microelectrodes (300 µm diameter) for ECoG lead and reference and two temperature sensors as shown in Figure 1(a). The temperature sensors (375 × 625 µm) could operate in continuous temperature mode, or alternatively, in dual mode measuring rCBF and temperature simultaneously. In dual mode, quantitative rCBF is measured with a single sensor according to the thermal diffusion principle by periodic heating–cooling of the sensor in 5-s cycles. Within each cycle, the baseline temperature and thermal conductivity of tissue are measured. Thus, after measurement of the voltage response during heating of the tissue 2℃ above baseline, thermal convection and hence rCBF can be calculated.18,19 Signals were recorded with previously developed signal conditioning interface circuit boards.19–21 Analog outputs were recorded and analyzed with a Powerlab 16/SP analog/digital converter and CHART-7 software (ADInstruments). Before each experiment, sensors were calibrated using a commercial temperature probe (IT-21, WPI) and a tissue perfusion simulator.
22
Transient brain temperature increases during spreading depolarization (SD). (a) Schematic representation of the multisensor neural probe used in this study: two electrodes (diameter = 300 µm) for ECoG and two temperature microsensors are placed at two depths below the brain surface. The superficial temperature sensor was operated in dual mode for simultaneous rCBF monitoring (Figure 2). (b) Transient brain temperature responses associated with cortical SD at two different brain depths. (c) Definition of parameters used to quantify amplitudes and durations of DC shifts of SD and temperature and rCBF responses. (d) Transient cortical temperature fluctuations occurring spontaneously and in response to SD. Blue arrows indicate temperature elevations associated with increased spontaneous AC-ECoG (0.5–50 Hz) activity, and red arrow indicates the temperature elevation from SD. rCBF did not change substantially during spontaneous fluctuations (<3.6 mL/100 g/min). To quantify AC-ECoG activity, a leaky integral of the total power of spontaneous AC-ECoG activity was computed using a 60-s decay time constant. Spontaneous fluctuations caused ∼2-fold greater changes in the power integral than the spreading depression of SD. By contrast, the temperature response to SD reached a 3.1-fold greater maximum amplitude and showed a 5-fold greater rate of increase than spontaneous temperature fluctuations.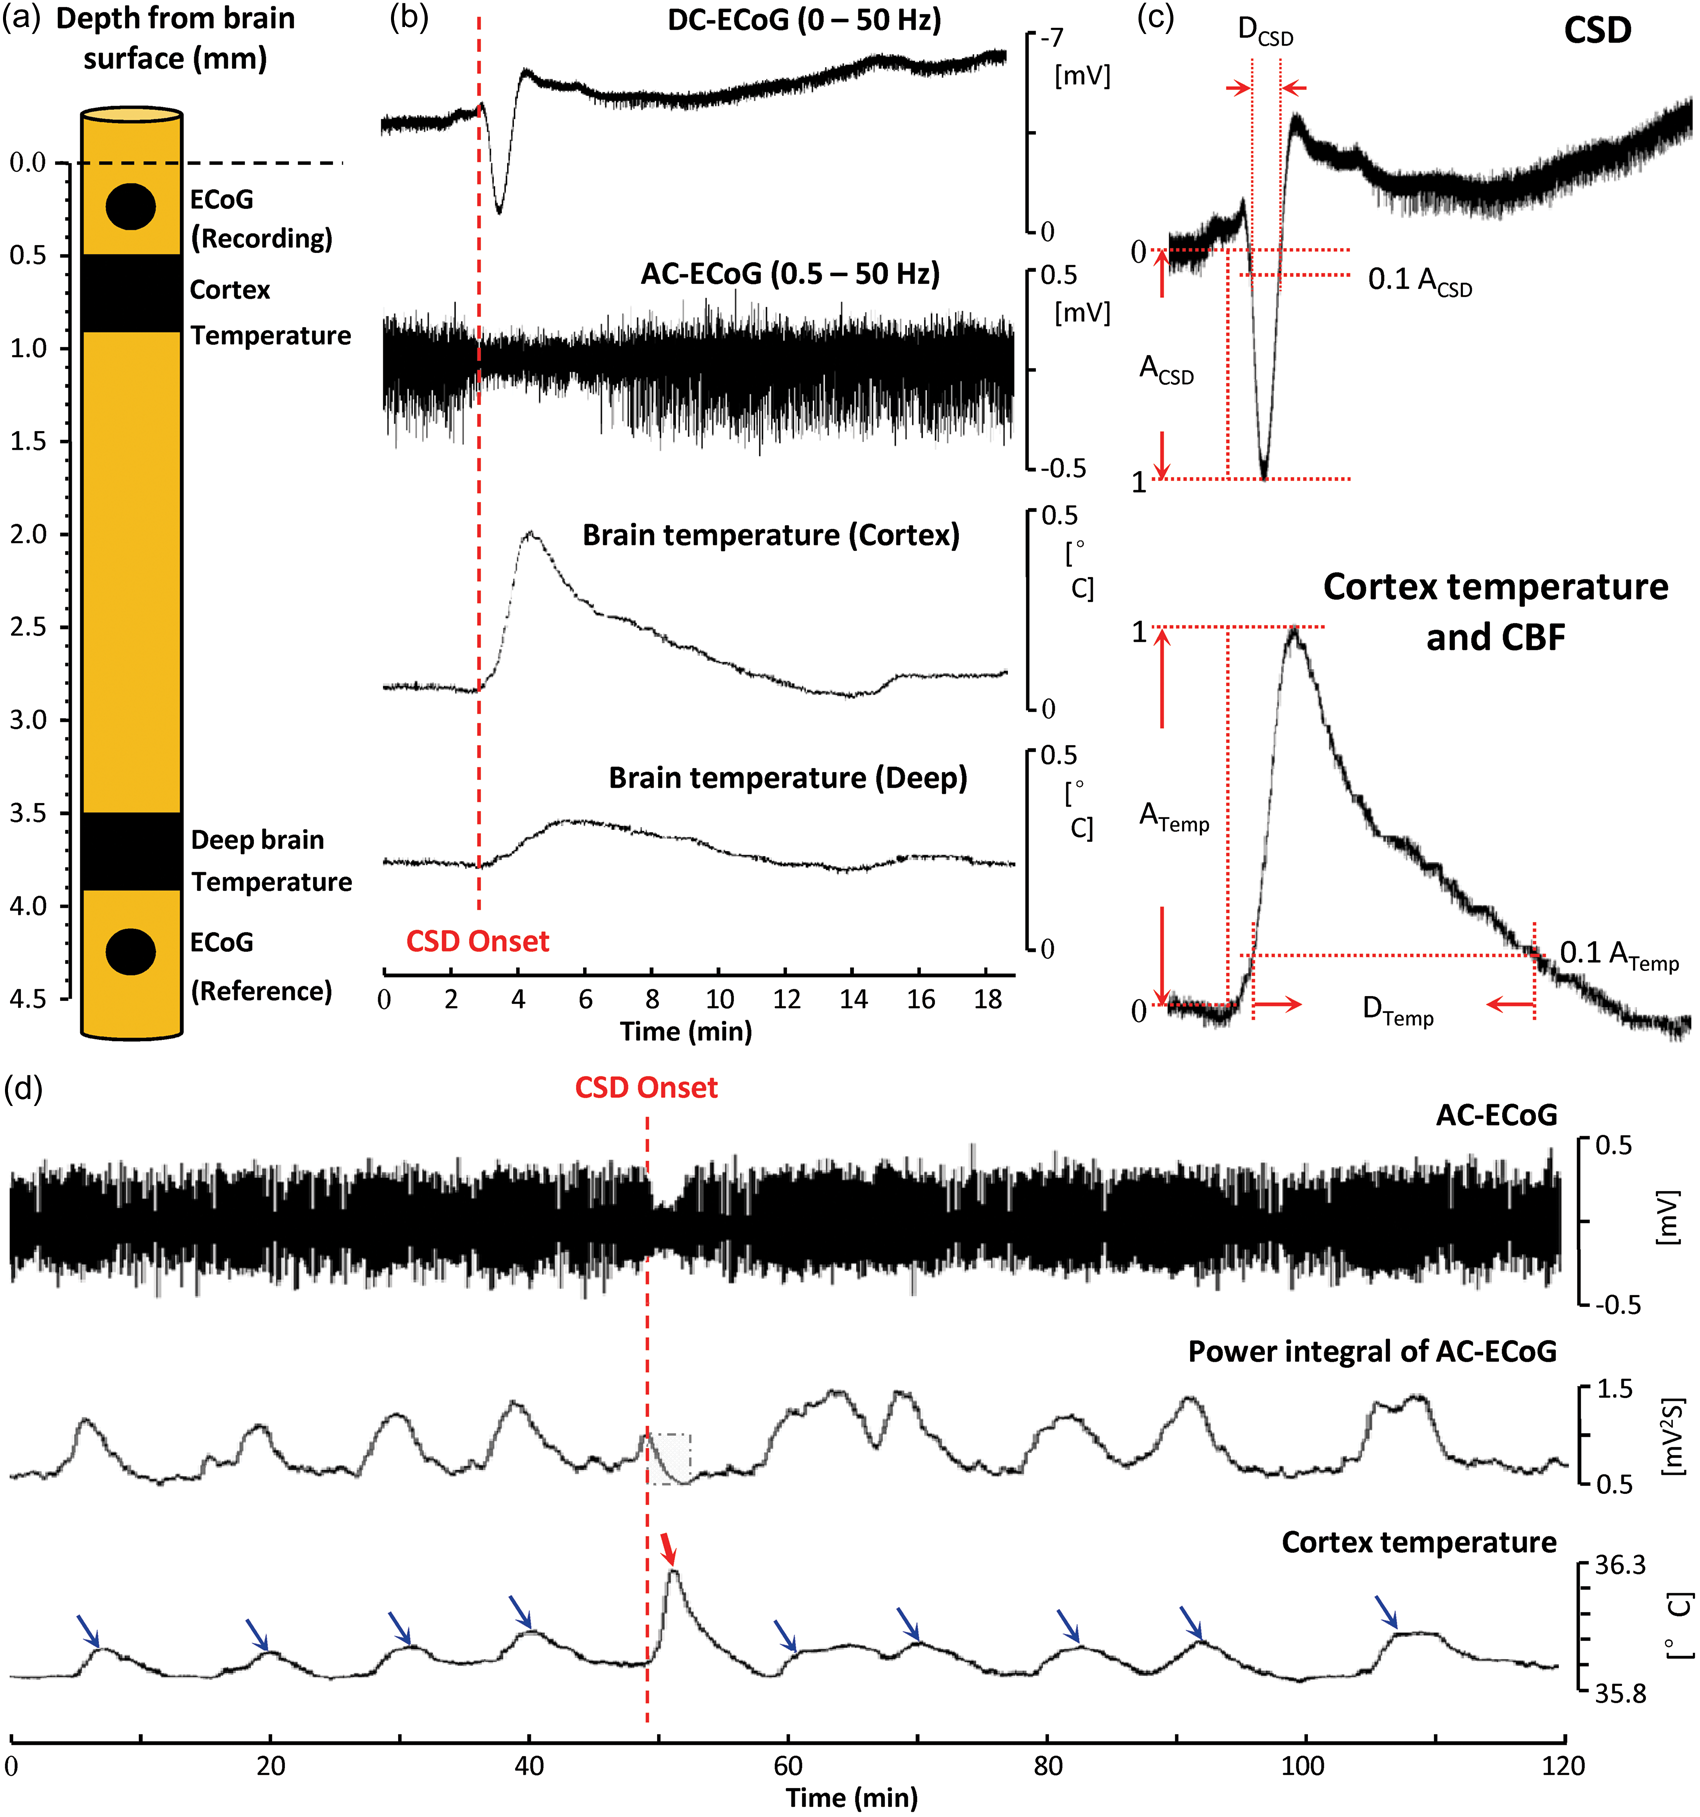
Data analysis
Direct-current (DC) shifts of SD as well as temperature and rCBF responses were quantified in the same manner (Figure 1(c)). Amplitudes were measured from baseline to peak. Rates of response onsets were calculated as the slope of the change between 10% and 90% maximal amplitude, and rise times were taken as the duration of this change (i.e., slope denominator). Response durations were measured at 10% of maximal amplitude. Data are presented as mean ± standard deviation with significance defined as p < 0.05.
Results
Transient brain temperature increase during SD
SD induced by needle prick 2 h after neural probe implantation was identified by a negative shift of the DC potential (3.59 ± 1.13 mV; n = 17) and transient suppression of spontaneous AC-ECoG activity (0.5–50 Hz) at the electrode in superficial cortex. Beginning at the start of the DC shift, temperatures in superficial cortical and deeper subcortical tissue initially increased and then slowly decreased toward baseline (Figure 1(b)). The maximal temperature increase in cortex (0.29 ± 0.08℃) was ∼3.6-fold greater than the subcortical increase (0.079 ± 0.029℃). The rate of temperature increase was also greater in cortex (4.2 ± 0.5 vs. 0.8 ± 0.2 m℃/s; rise time: 49.6 ± 6.2 vs. 93.3 ± 11.2 s), as was the duration of temperature elevation (537.6 ± 58.9 vs. 397.1 ± 93.1 s). The DC shifts of SD lasted 55.25 ± 4.42 s and had a frequency content of 0–0.023 Hz (peak: 0.008 Hz). Cortical temperature responses occurred in the same frequency band (0–0.015 Hz; peak: 0.008 Hz).
Comparison of temperature and hemodynamic responses
The differences in temperature transients induced by SD in tissue separated by only 3 mm suggested that the deeper sensor could not be used as a surrogate for baseline cortical temperature fluctuations when measuring rCBF by the thermal diffusion method. Therefore, to measure rCBF, the cortical sensor was operated in dual mode by cycling through heating and cooling periods every 5 s, allowing alternate measures of temperature and quantitative rCBF at the same location.
In nine animals, baseline cortical temperature and rCBF were 35.97 ± 0.31℃ and 34.7 ± 7.6 mL/100 g/min, respectively, at 2 h after probe implantation. The rCBF response to subsequently induced SD was stereotyped in all animals and showed the characteristic four phases observed in normally perfused cortex (Figure 2).
1
Phase I was a brief shallow hypoperfusion (−4.54 ± 2.27 mL/100 g/min; duration = 67.2 ± 25.8 s) that was followed by a primary hyperemia (Phase II), reaching a peak of 78.5 ± 11.8 mL/100 g/min (226.2% of baseline values or 126.2% increase from baseline). The duration of Phase II at 10% maximal amplitude was 113.1 ± 14.4 s. Phase III was a mild hyperemia that occurred as a shoulder at the end of Phase II. Finally, Phase IV was a prolonged oligemia that reached a minimum of 19.8 ± 6.8 mL/100 g/min (57.1% of baseline values or 42.9% reduction from baseline). The duration of oligemia at 10% amplitude was 28.4 ± 3.7 min.
Temperature and regional cerebral blood flow responses to spreading depolarizations. Two examples of cortical temperature and rCBF responses to SD recorded simultaneously from the same sensor. Blue arrows in rCBF traces indicate the initial shallow hypoperfusion (Phase I); subsequent phases are labeled II–IV. Expanded view of dashed box compares the time course of temperature and rCBF with the DC shift of SD.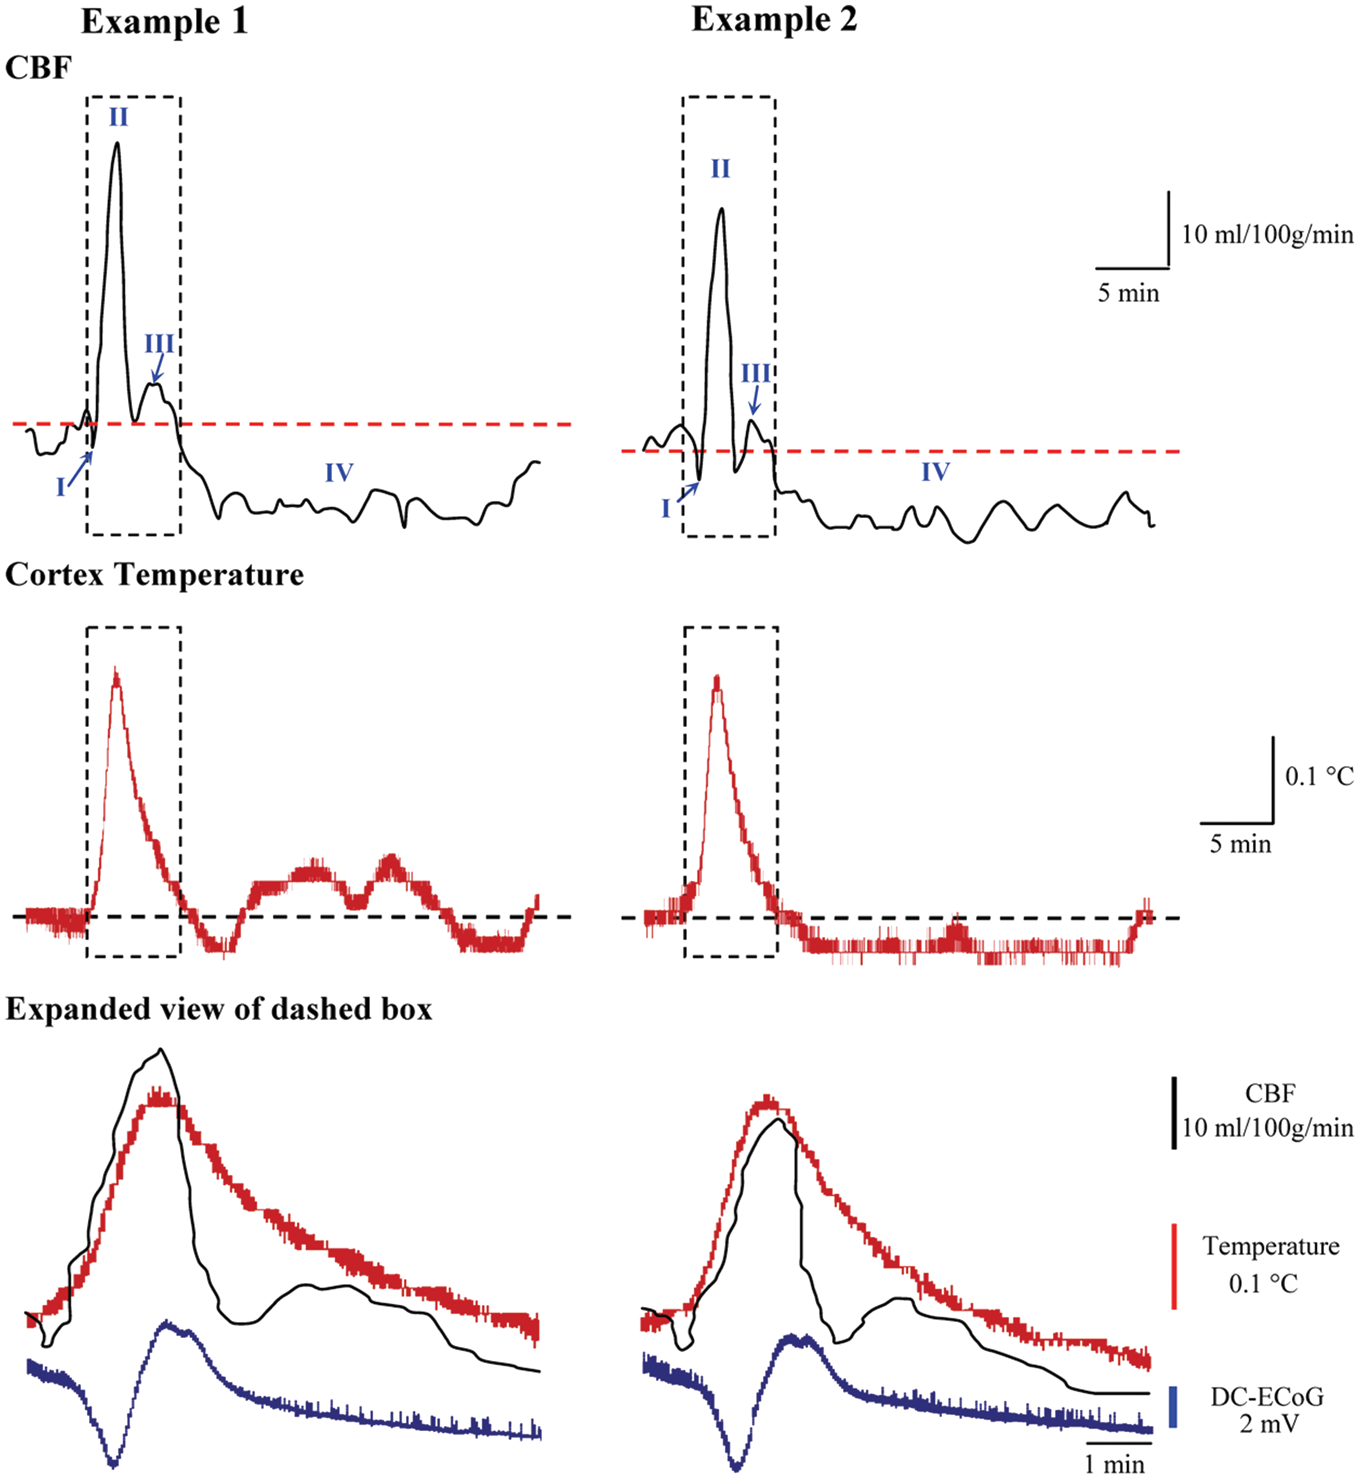
The temperature response (maximum amplitude: 0.28 ± 0.06℃, duration: 551.2 ± 36.2 s) measured simultaneously at the same location was similar to that measured in continuous temperature mode (p = 0.36 and p = 0.24, respectively), thus demonstrating reliable sensor operation in dual mode (Figure 2). Temperature begins to rise at the start of the initial dip of rCBF response and then rises sharply during the onset of the hyperemic Phase II, with temperature peaking 11.5 ± 8.2 s before rCBF. Temperature then decreased through the remainder of rCBF Phase II/III and was 0.026 ± 0.004℃ above baseline at the start of the oligemic Phase IV of the rCBF response.
Sensitivity and specificity of the SD temperature response
In monitoring periods before and after SD induction, we observed spontaneous fluctuations in baseline cortical temperature and AC-ECoG activity. Figure 1(d) shows an example of nine baseline fluctuations interrupted by a single needle-induced SD. We quantified 72 spontaneous temperature increases (not associated with SD) observed in 26 recording sessions. Maximum temperature increases ranged 0.04℃–0.11℃ and rates of increase ranged 0.27–0.93 m℃/s. In every case, these changes were less than the smallest SD-induced temperature increases (range: 0.18℃–0.40℃) and rates of increase (2.14–4.67 m℃/s). Thus, in these recordings, a simple threshold for temperature change is 100% sensitive and specific for identifying SDs.
Discussion
Here, we examined the rCBF and temperature response to SD evoked in normal brain using a novel sensor based on the thermal diffusion principle. The thermal diffusion technique measures rCBF as thermal convection based on the power required to elevate tissue temperature a set amount, after measuring baseline temperature and thermal conduction. During continuous rCBF monitoring, baseline temperature changes are measured with a separate sensor beyond the thermal influence of the heating sensor.23,24 As shown here, however, the assumption of a constant baseline temperature gradient between the two sensors is violated during SD, which induces a greater temperature increase in cortex than in tissue only 3 mm distant. This difference can introduce substantial error in rCBF calculations. Therefore, we used our previously developed thermal diffusion rCBF technology to measure baseline temperature and thermal conduction and convection with a single sensor. This allowed the simultaneous measurement of temperature and accurate, quantitative rCBF with the same sensor every 5 s.
Temperature and rCBF responses to SD measured with this technique were similar to previous in vivo studies. LaManna et al. 25 found monophasic cortical temperature increases of >0.2℃ that lasted ∼5 min. By comparing responses to a variety of manipulations, they concluded that the warming was attributable not only to metabolic heat production but also to increased blood flow, since body temperature and presumably arterial blood were 1℃–2℃ higher than brain temperature. Our results showed that the temperature increase begins with the initial hypoperfusion and then greatly accelerates during the hyperemic Phase II of the rCBF response, supporting a main contribution of perfusion. Temperature increases attributable to metabolism are estimated at only 5–30 m℃.26,27 Ueda et al., 28 by contrast, found that cortical temperature decreased ∼0.2℃ during the hyperemic phase of SD before then increasing by the same amount. This different response is likely attributable to hypothermic (35℃) core temperatures and low rCBF that caused even lower cortical temperature (∼32.7℃) and longer transition times to increased temperatures. 29 The lower (0.5℃) baseline cortical compared to core temperature in the present study is typical for the effects of anesthesia, 30 reflecting decreases in brain metabolism and thus the temperature shielding effect of baseline CBF. 31
rCBF responses recorded with the thermal diffusion technique exhibited all four phases described previously for the normally perfused, uninjured rat cortex.1,12 This technique thus allows, for the first time, a method for measuring quantitative rCBF in a near-continuous manner adequate to resolve these various components. By comparison, other quantitative rCBF methods allow only a single measurement or repeated measures on the order of several minutes. A disadvantage of the probe used here, however, is its large diameter and invasive nature. In particular, probe insertion induces SD and can thereby depress rCBF for hours,32,33 and larger probe sizes and greater depths of insertion can exacerbate this effect independent of the evoked SD. 34 Thus, the 700 µm width and 4.5 mm depth of probe insertion here are likely responsible for the low baseline rCBF values of 35 mL/100 g/min. A shortcoming of this study was that arterial blood gases were not measured, although the possibility of hypercarbia in spontaneously breathing animals would cause increased, not decreased, baseline flow. 35 Since a 2-h waiting period was imposed before eliciting SD, the rCBF response was likely not affected by the initial SD during probe insertion. 1
In conclusion, this novel thermal diffusion method offers significant advantages for monitoring cerebral physiology. Although large in its current implementation, the sensor could be microfabricated on a less invasive planar structure or incorporated into clinical probes of similar size. Particularly, dual simultaneous monitoring of quantitative rCBF and temperature could assist in identification of SDs with minimally invasive techniques, such as depth electrode arrays, since the temperature and rCBF transients of SD are larger than those of any other pathologic phenomenon or insult.1,25
Footnotes
Funding
The author(s) disclosed receipt of the following financial support for the research, authorship, and/or publication of this article: This work was supported by the U.S. Department of Defense CDMRP PH/TBI Research Program under Project No. PT090526P4 (W81XWH-10-1-0978).
Declaration of conflicting interests
The author(s) declared no potential conflicts of interest with respect to the research, authorship, and/or publication of this article.
Authors’ contribution
CL conceived and designed the study, conducted the experiments, analyzed the data, and drafted, edited, and approved the manuscript. RKN contributed to study design and edited and approved the manuscript. PW contributed to data analysis and edited and approved the manuscript. JAH conceived and designed the study and drafted, edited, and approved the manuscript.