
Abstract
P-glycoprotein (PgP), a drug efflux pump in blood–brain barrier endothelial cells, is a major clinical obstacle for effective central nervous system drug delivery. Identifying PgP regulatory pathways that can be exploited clinically is critical for improving central nervous system drug delivery. We previously found that PgP activity increases in rat brain microvessels concomitant with decreased central nervous system drug delivery in response to acute peripheral inflammatory pain. In the current study, we tested the hypothesis that PgP traffics to the luminal plasma membrane of the microvessel endothelial cells from intracellular stores during peripheral inflammatory pain. Using immunofluorescence microscopy, we detected PgP in endothelial cell nuclei and in the luminal plasma membrane in control animals. Following peripheral inflammatory pain, luminal PgP staining increased while staining in the nucleus decreased. Biochemical analysis of nuclear PgP content confirmed our visual observations. Peripheral inflammatory pain also increased endothelial cell luminal staining of polymerase 1 and transcript release factor/cavin1 and serum deprivation response protein/cavin2, two caveolar scaffold proteins, without changing caveolin1 or protein kinase C delta binding protein/cavin3 location. Our data (a) indicate that PgP traffics from stores in the nucleus to the endothelial cell luminal membrane in response to peripheral inflammatory pain; (b) provide an explanation for our previous observation that peripheral inflammatory pain inhibits central nervous system drug uptake; and (c) suggest a novel regulatory mechanism for PgP activity in rat brain.
Keywords
Introduction
The blood–brain barrier (BBB) provides a physical and biochemical barrier between the blood and central nervous system (CNS). The BBB is required to prevent CNS infection and toxicity; 1 however, it presents a clinical challenge for drug delivery during treatment of pathologies with a CNS component such as pain, stroke, or epilepsy. 2 The physical component of the BBB consists of an extensive network of non-fenestrated microcapillaries. 3 The capillary lumen is surrounded by endothelial cells, tethered to each other by tight junctions. The endothelial cells, along with the associated pericytes and astrocyte end feet of the neurovascular unit, comprise the physical barrier that limits paracellular diffusion.3,4 Transcellular movement of substances across the BBB is limited by biochemical mechanisms in BBB cells. The biochemical barrier consists of metabolizing enzymes and ATP-driven efflux pumps of the ATP-binding cassette transporter family. 1
In humans, P-glycoprotein (PgP; multidrug resistance protein1 (MDR1)/ABCB1) is the most abundant transporter present in the microvessel endothelial cells of the brain. PgP has a wide range of structurally diverse substrates including morphine, the major drug used to treat pain.5–7 The abundance and efflux efficiency of PgP means that PgP is a major factor in determining CNS drug uptake. In addition, many pathological conditions and treatment with PgP substrates increase PgP activity over basal levels2,3 exacerbating the problem. Direct inhibition of PgP has proved a failure in the clinic because patients die of infection and xenobiotic toxicity when basal PgP activity is blocked.8,9 However, an alternative strategy, blocking pathways that regulate the increase in PgP activity levels over basal levels, has clinical potential for improved CNS drug delivery.
PgP regulation is complex; two recent reviews summarize the current knowledge of PgP regulation at the BBB and identify gaps in our knowledge.2,10 As indicated in these reviews, post-translational regulation of PgP plays a significant role in PgP activity at the BBB; however, few of these regulatory pathways have been elucidated. This is in part because in vitro BBB models do not accurately recapitulate the complexity of the neurovascular unit making it difficult to translate in vitro observations to in vivo outcomes. Our laboratory uses an in vivo acute peripheral inflammatory pain (PIP) model to study post-translational PgP regulatory mechanisms at the BBB. Use of an acute PIP model, 3 h after a λ carrageenan (CAR) injection in the rat paw compared with a saline (SAL)-injected control, allows us to measure post-translational PgP alterations in vivo. Our previous studies using this model indicate that PIP increases PgP activity in BBB endothelial cells 11 concomitant with decreased morphine efficacy and accumulation in the brain. 5 PIP also causes a redistribution of PgP in BBB endothelial membrane fractions. 11 These data suggest that PIP causes PgP trafficking between intracellular compartments. However, the intracellular source and destination of PgP after PIP is unknown.
Trafficking of PgP to the luminal membrane could explain our earlier observations that PIP decreases morphine accumulation in the brain. 5 Morphine tolerance in rats 12 and drug treatment in human brain capillary endothelial cell culture cells, hCMEC/D3, 13 increases PgP in endothelial cell membranes. A portion of the PgP is located in plasma membrane (PM) caveolae in rat brain endothelial cells 14 and in BBB endothelial cells in cell culture. 15 Caveolae are dynamic structures that participate in protein trafficking and regulation of signaling cascades. 16 Caveolar localization may influence PgP activity; 17 binding of caveolin1 (CAV1), a caveolar scaffold protein, to PgP has been implicated in the regulation of PgP activity. 18 Taken together, these data suggest that PgP trafficking between intracellular compartments or within membrane microdomains is a potential PgP regulatory mechanism in vivo.
In the current study, we measured trafficking of PgP in rat cerebral microvessels isolated post-PIP to determine whether PgP moves to the luminal endothelial cell membrane during PIP. We also measured caveolar protein trafficking to determine whether these proteins could contribute to post-translational redistribution of PgP in response to a pain stimulus. We found that PgP traffics from the nuclear compartment to the luminal membrane in BBB endothelial cells during PIP. These data suggest a novel PgP trafficking pathway in vivo. Two caveolar proteins, polymerase 1 and transcript release factor (PTRF)/cavin1 and serum deprivation response protein (SDPR)/cavin2, also move to the luminal membrane indicating PM microenvironment alterations that can impact PgP activity.
Materials and methods
Reagents
EDTA-free complete proteinase inhibitor was purchased from Roche (Indianapolis, IN). Tris(2-carboxyethyl)phosphine hydrochloride, 4× sample loading buffer and Precision Plus prestained molecular weight standards were obtained from Bio-Rad (Hercules, CA). All other reagents and chemicals were purchased from Sigma-Aldrich (St. Louis, MO) unless otherwise stated.
Animals and treatments
Animal protocols used for this study were written according to the guidelines of the National Institutes of Health and approved by the University of Arizona Animal Care and Use Committee. Results were reported according to ARRIVE guidelines to the best of our ability. Female Sprague-Dawley rats (200–250 g) (Harlan Sprague-Dawley, Indianapolis, IN) were maintained under standard conditions in the University of Arizona Animal Care Facility and allowed to acclimate to the new surroundings for 1 week before each experiment. Three hours prior to sacrifice, the left hind paw was injected with 100 µl 0.9% NaCl or CAR (3% in 0.9% NaCl).
Microvessel isolation
Cerebral microvessels were isolated as previously described. 11 Briefly, after decapitation, rat brains were excised and the meninges and choroid plexis removed. The brains were minced and homogenized using a Potter-Elvjehm homogenizer. Samples were centrifuged (20 min at 5800 × g at 4 ℃) using 30% Ficoll to separate most of the lipids from the vessel preparation. The vessels in the pellet were resuspended in buffer and filtered through a series of nylon mesh filters resulting in a final sample that contained vessel segments between the sizes of 300 µm and 40 µm. Samples were frozen at −20 ℃ or processed for immunofluorescence. This procedure results in a nine-fold enrichment of endothelial cell glucose transporter1 (GLUT1) over that found in brain homogenates. 19
Immunofluorescence sample preparation and staining
Isolated microvessels were fixed in 10% neutral-buffered formalin then embedded in paraffin; the paraffin block was subsequently cut into 3 µm sections and the sections mounted on glass slides by the Tissue Acquisition Cellular/Molecular Analysis Shared Resource (TACMASR) at the University of Arizona on a fee for service basis. Integrity of the tissue was confirmed on a section that was stained with hematoxylin and eosin (H & E) and inspected via brightfield microscopy. Blocks were stained for fluorescence using the protocol accompanying the Nxgen Decloaking Chamber (Biocare Medical, Concord, CA). Briefly, the sections were deparaffinized, washed with PBS and loaded into the Decloaking Chamber for antigen retrieval in citrate buffer, pH 6.0, for 30 min at 95 ℃. Primary antibodies and AlexaFluor-labeled secondary antibodies were sequentially applied to slides and incubated for 1 h at room temperature in a humidified chamber. Slides were counterstained with DAPI (Biotium, Hayward, CA) for 3 min, washed and allowed to air dry. Cover slips were mounted on the sections using Fluoromount-G (eBioscience, San Diego, CA). Slides were stored at 4 ℃ until analysis. The following primary antibodies and AlexaFluor-labeled secondary antibodies were used for staining: MDR1 (orb11267; 1:5 dilution) from Biorbyt (San Francisco, CA); MDR1 (ab3366; 1:5 dilution), GLUT1 (ab32551; 1:10 dilution), GLUT1 (ab40084; 1:10 dilution), PTRF/cavin1 (ab48824; 1:5 dilution), and von Willebrand factor (vWF; ab6994; 1:10 dilution) from AbCam (Cambridge, MA); CAV1 (BD606100; 1:20 dilution) from BD Biosciences (San Jose, CA); SDPR/cavin2 (SDPR-12339-1-AP; 1:5 dilution) and protein kinase C delta binding protein (PRKCDBP)/cavin3 (PRKCDBP-16250-1-AP; 1:10 dilution) from ProteinTech (ThermoFisher, Waltham, MA); and AlexaFluor488 goat anti-rabbit (A-11008; 1:20 dilution), AlexaFLuor488 goat anti-mouse (A-11001; 1:20 dilution), AlexaFLuor568 goat anti-rabbit (A-11011; 1:20 dilution) and AlexaFLuor568 goat anti-mouse (A-11004; 1:20 dilution) from Life Technologies (Carlsbad, CA).
Microscopy
Images for brightfield and widefield fluorescence used for antibody validation were acquired on a Leica DMI6000B inverted microscope (Leica Microsystems, Buffalo Grove, IL) equipped with a Leica DFC450 color CCD camera and a 16 bit Hamamatsu Flash 4.0 sCMOS camera (Hamamatsu Corp., Bridgewater, NJ). Images were acquired using Leica LAS X 1.x software (Leica). For colocalization analysis, images were acquired using a DeltaVisionRT Deconvolution Microscopy System (GEHealthcare, Piscataway, NJ). This system includes an inverted Olympus IX 70 microscope and color CCD camera that acquires widefield fluorescence images coupled to SoftWorx software that controls the image acquisition and deconvolution.
Image analysis—Antibody validation
All images used for antibody validation were acquired using the same settings as the no primary antibody controls using the Leica DMI6000B microscope. Images were exported as TIF files containing a micron scale. Images were cropped in Photoshop (Adobe Systems, San Jose, CA) and then the channels split into single color images using FIJI. 20 The figures were assembled from the single color images. In some cases, the brightness and contrast were increased in the merged image, prior to channel splitting, to enhance printing. Images from samples with primary antibodies received the same adjustments of brightness and contrast as the corresponding no primary antibody controls. Supplementary Figure 1 shows an example of the steps used to create the antibody validation figures.
Image analysis—Colocalization
For each antibody pair, 10–12 vessel images were captured from each of three individual slides per treatment. Each of the three slides was prepared from an independent microvessel isolation. Each microvessel isolation contained vessels pooled from three rats. This resulted in at least 30 images for each treatment for each antibody pair representing sample from nine total rats. Each image was acquired as a series of 20–30 z-stack slices. Exposure settings for each image were set, so that there were no saturated pixels in the target microvessel in any slice for each of the three channels. Each z-stack slice underwent deconvolution using DeltaVision software and was saved as a TIF. Deconvolved images were opened in Photoshop and a mask applied to eliminate any signal that did not originate from the endothelial cells in the vessels. A threshold was then applied to the images by setting the lower brightness level at full width half maximum above the lowest peak in the histogram for each channel. This method removed tissue autofluorescence and non-specific background staining. Processed images were then opened with FIJI. 20 To analyze the images in FIJI, the images were first split into three separate channels (RGB). Each channel was then compared with the others using the Coloc2 plugin. The Manders' Correlation Coefficient algorithm 21 was used for analysis; the Manders' M1 values without threshold are reported for colocalization of particular antigens (i.e. PgP, CAV1, PTRF, SDPR, or PRKCDBP) with either GLUT1 or DAPI. Images used for the colocalization analysis were always stained with AlexaFluor568-labeled secondary for the GLUT1 antigen and AlexaFluor488-labeled secondary for the other antigens. Overlap of the DAPI (nuclear marker) and GLUT1 (endothelial cell luminal membrane marker) served as an internal control for setting the threshold for each vessel since these signals should not overlap spectrally or biologically. The z-stack slice used for colocalization analysis for each individual vessel cross section was chosen by finding the slice number that contained the best possible focal plane in each of the three channels (RGB). Only vessels with a diameter of 15 µm or less were included in the analysis. Supplementary Figure 2 illustrates the steps used for the colocalization analysis on a representative vessel.
Image analysis—Representative deconvolution microscopy images
Representative deconvolution microscopy images for the figures were constructed by selecting the same series of sequential 4 to 7 z-stack slices from each of the three channels (chosen to represent the best focal plane) used to acquire the images. The images in each channel were opened in FIJI 20 and stacked independently, so that a Max intensity projection of the slices in each channel was constructed. The Max intensity TIF files from each channel were merged and RGB color assigned using Photoshop (Adobe Systems). Brightness and contrast were adjusted to enhance representative features. For some images, a histogram stretch was applied to the cropped image to increase signal in a particular channel. This adjustment was required because the exposure settings for image acquisition did not always result in signal intensity in each slice optimal for visualization. Choice of image for illustration of a particular feature depended on the feature and occasionally required use of vessels larger than 15 µm in diameter. Images used to demonstrate the location of PgP with other antigens (e.g. CAV1, PTRF, SDPR, or PRKCDBP) were acquired in the same manner as those used for the colocalization analysis. For these images, PgP was always stained with AlexaFluor488-labeled secondary antibody.
Nuclear/cytosolic protein analysis
Nuclear and cytosolic fractions from the microvessel isolates were separated using the Pierce NE-PER kit (ThermoFisher) according to the manufacturer's protocol. Total protein recovered in the nuclear and cytosolic fractions was measured using the Pierce BCA Protein Assay kit (ThermoFisher). Equal amounts of nuclear and cytosolic protein were separated by SDS-PAGE gel electrophoresis on Criterion TGX 4-20% gels (Bio-Rad). Proteins were blotted onto polyvinyldifluoride membranes (Imobilon, Millipore, Waltham, MA) using Genie Electroblotters (Idea Scientific, Minneapolis, MN). Proteins were measured on the blots using antibodies to MDR1 (sc8313), nucleoporin p62 (sc25523), and α-tubulin (sc23948) from Santa Cruz Biotechnology (Santa Cruz Biotechnology, Dallas, TX); laminin B1 (12987-1-AP) from ProteinTech (ThermoFisher); and HRP-linked anti-rabbit secondary (GEHealthcare). Proteins were detected by chemiluminescence using the Clarity bioluminescence kit (Bio-Rad) and exposure to film (ISC Bioexpress, Kaysville, UT) or measurement on a ChemiDoc System (Bio-Rad). Bands were quantitated by scanning the films and quantitating the bands using the algorithm in FIJI. 20 Scans were cropped and auto contrast was applied to the entire cropped portion prior to constructing the figures.
Statistics
Difference between means was tested with the Student's t-test using the algorithms in Excel (Microsoft, Redmond, WA).
Results
Validation of sample integrity
Structurally, the BBB microvessels consist of endothelial cells, tethered to each other by tight junctions, surrounding the capillary lumen. 3 The abluminal surface of the endothelial cells is covered by a basement membrane (BM). Pericytes attach to the BM and extend processes over the endothelial cell surface.4,22 The surface of the pericytes distal to the endothelial cells is also covered with BM. Attached to this BM are specialized processes from astrocytes called astrocyte end feet. 4
As a first step to ensure the microvessels we isolated were intact and determine what other structures were included in our isolates, we examined the morphology of H & E stained sections of the microvessel pellets. As shown in Figure 1(a), the pellet contained both longitudinal sections and cross sections of cerebral microvessels. Endothelial cells surrounded an identifiable lumen; pericyte nuclei were often seen on the abluminal periphery of the endothelial cells. Some of the endothelial cell nuclei extended into the lumen as a result of our fixation process. Staining for vonWillebrand factor (vWF) confirmed our identification of endothelial cells (Figure 1(b)). Punctate staining surrounding the lumen is consistent with vWF in Weibel-Palade bodies at the luminal surface of the microvessel endothelial cells. We did not see vWF staining in the pericytes. Published studies report GLUT1 staining in cerebral microvessels is luminal dominant, abluminal dominant, or relatively equally distributed23–26 (and references therein). The conflicting reports are, at least in part, due to differences in measurement technique and antibodies used. To determine whether we could use GLUT1 staining as a luminal marker in our study, we stained our formalin fixed paraffin embedded (FFPE) sections with two different GLUT1 antibodies. In our hands, staining for GLUT1 was on the luminal surface of the endothelial cells (Figure 1(c)). We did not see GLUT1 staining on the abluminal endothelial surface or in the pericytes indicating that we could use this staining as a luminal surface marker. Staining for glial fibrillary acidic factor, which would indicate astrocyte end feet attached to the abluminal microvessel surface, was minimal (data not shown).
Characterization of PgP staining in microvessel endothelial cells and pericytes in rat cerebral microvessel isolates. (a) Brightfield images of longitudinal and cross sections of rat brain microvessels in a hematoxylin & eosin stained section of a FFPE pellet of isolated rat microvessels. Bars represent 20 µm. (b) Representative immunofluorescent image of vonWillebrand factor (vWF) staining (green) in rat cerebral microvessels counterstained with DAPI (blue) to indicate nuclei. Bars represent 20 µm. (c) Representative immunofluorescent image of GLUT1 (red) in rat cerebral microvessels counterstained with DAPI (blue) to indicate nuclei. Bars represent 20 µm. (d) Representative image of a microvessel isolate section stained for PgP (orb11267: green) and GLUT1 (ab40084: red) with a DAPI (blue: nuclear) counterstain compared with the no primary control. Images were acquired using a 40× objective. Bars represent 20 µm. (e) Representative deconvolution microscopy microvessel image stained for PgP (green) and GLUT1 (red) with a DAPI (blue: nuclear) counterstain. Image was acquired using a 60× objective. Bar represents 5 µm. Abbreviations: microvessel endothelial cells (E); pericytes (P); lumen (L).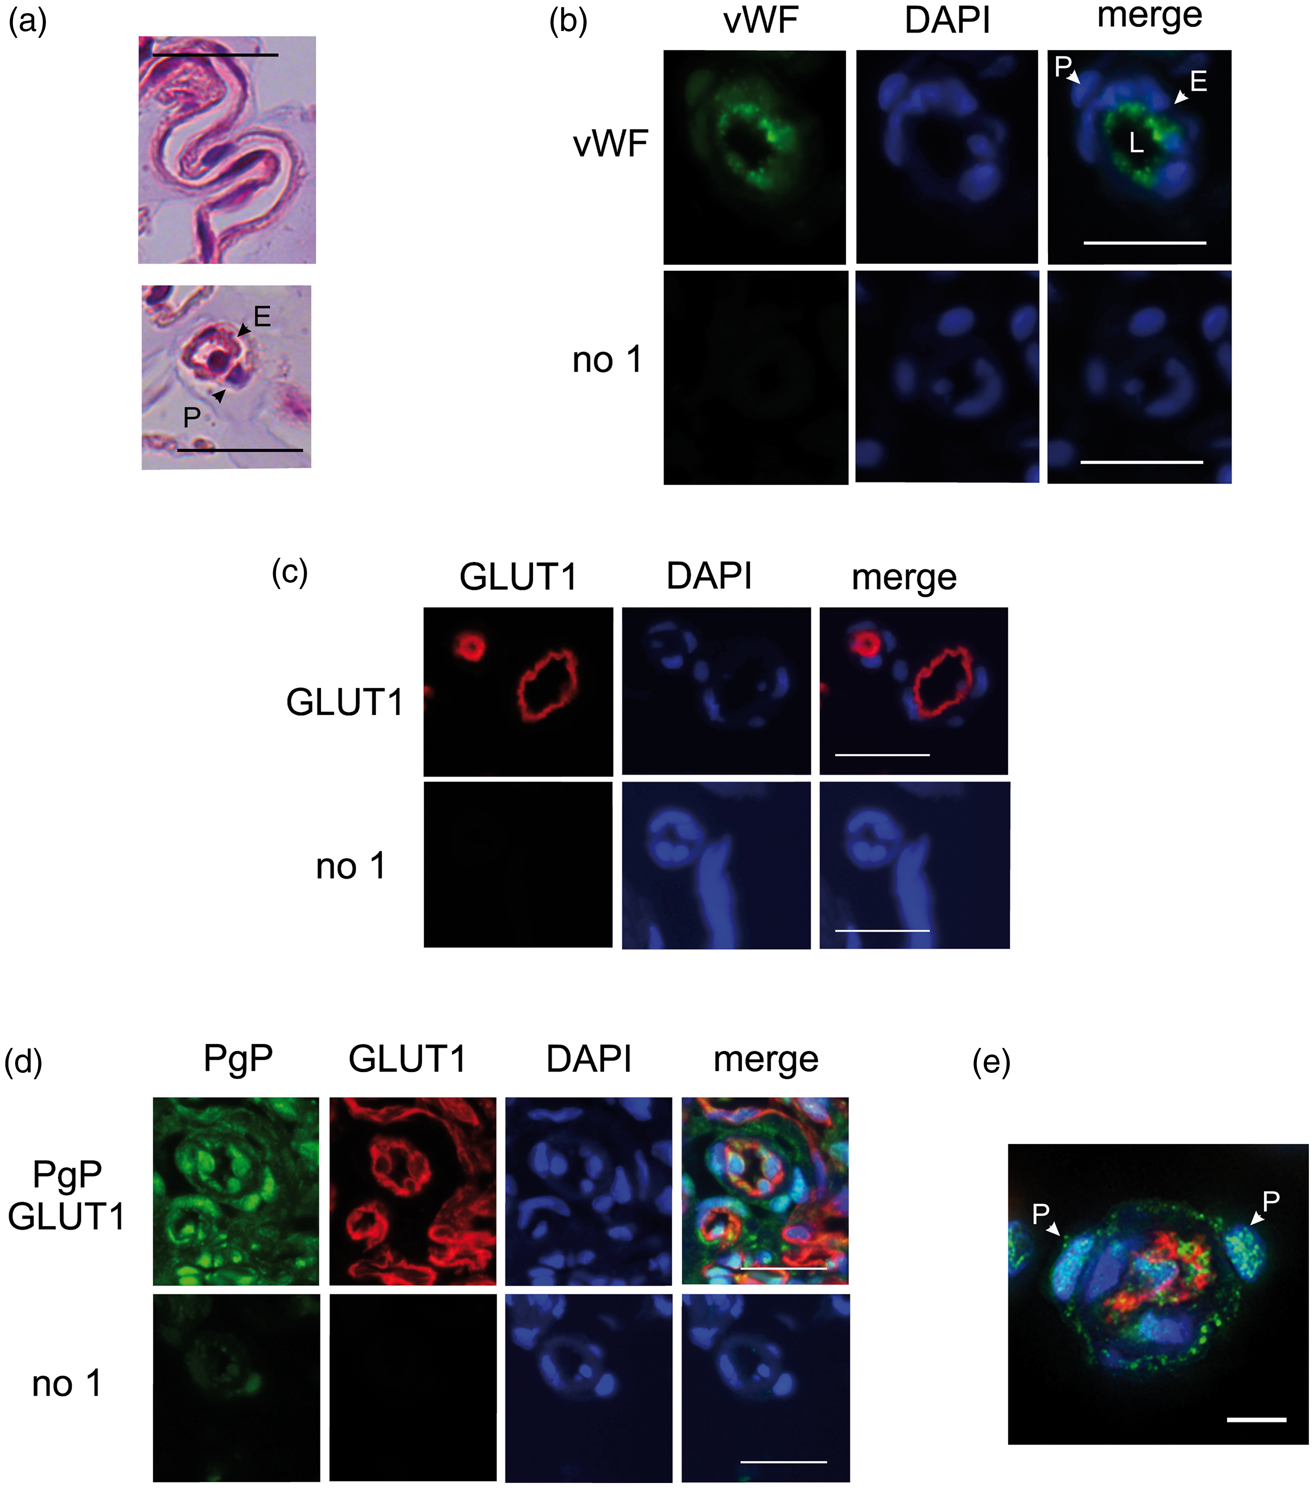
Localization of PgP in rat cerebral microvessels
We initially used a rabbit polyclonal antibody (orb011267, from Biorbyt, Inc.) to visualize PgP location in the endothelial cells. As shown in Figure 1(d) and (e), the rabbit polyclonal antibody showed specific staining in the endothelial cell nuclei and on the luminal surface of the endothelial cells. There was also faint cytoplasmic staining and a small amount of abluminal staining, although both were close to the lower staining threshold set by our non-specific background values. There was considerable PgP in the pericyte nuclei and on the pericyte PM particularly where the pericyte PM abuts the endothelial cells (Figure 1(e)). Some of the abluminal PgP staining on the endothelial cells may be of pericyte origin from the processes these cells extend from the pericyte cell body over the surface of the endothelial cells.
PIP decreases nuclear PgP concomitant with increased PgP at the endothelial cell luminal membrane
To determine whether PgP traffics to the luminal surface during a PIP stimulus, we examined the relative colocalization of PgP with GLUT1 (used as an endothelial cell luminal marker) in microvessels from SAL- and CAR-injected animals. As shown in Figure 2(a), grayscale images of the PgP signal showed a different staining pattern in the treated (CAR) and control (SAL) groups. When the PgP signal was merged with those for GLUT1 and DAPI (nuclear marker), we saw that luminal staining for PgP was increased (increased overlap of PgP in green with GLUT-1 in red) in the CAR samples. There was a decrease in the overlap of the PgP (green) with DAPI (blue) in the endothelial cell nuclei in the CAR samples. With PIP, pericyte membranes still showed considerable PgP content (Figure 2(a)).
PgP traffics to the endothelial cell lumen with acute peripheral inflammatory pain. (a) Representative deconvolution microscopy images of microvessels in saline (SAL)-injected (control) and λ carrageenan (CAR)-injected animals stained for PgP (orb11267: green) and GLUT1 (ab40084: red) with a DAPI (blue: nuclear)) counterstain. Grayscale images are PgP only. Images were acquired using a 60× objective. Bars represent 5 µm. Abbreviations: pericyte (P). (b) Colocalization analysis of the overlap of the PgP signal with the GLUT1 and DAPI signals in microvessel endothelial cells. Values are the mean + SEM (n = 37 images representing a total of nine animals/treatment). *indicates significantly different from SAL values for GLUT1 (p = 5.17E-04) and DAPI (p = 4.77E-05). (c) Representative immunoblot showing the relative amounts of PgP in nuclear (N) and cytosolic (C) fractions of microvessel isolates. Nucleoporin, laminB1, and α-tubulin blots are included to show the purity of the preparations.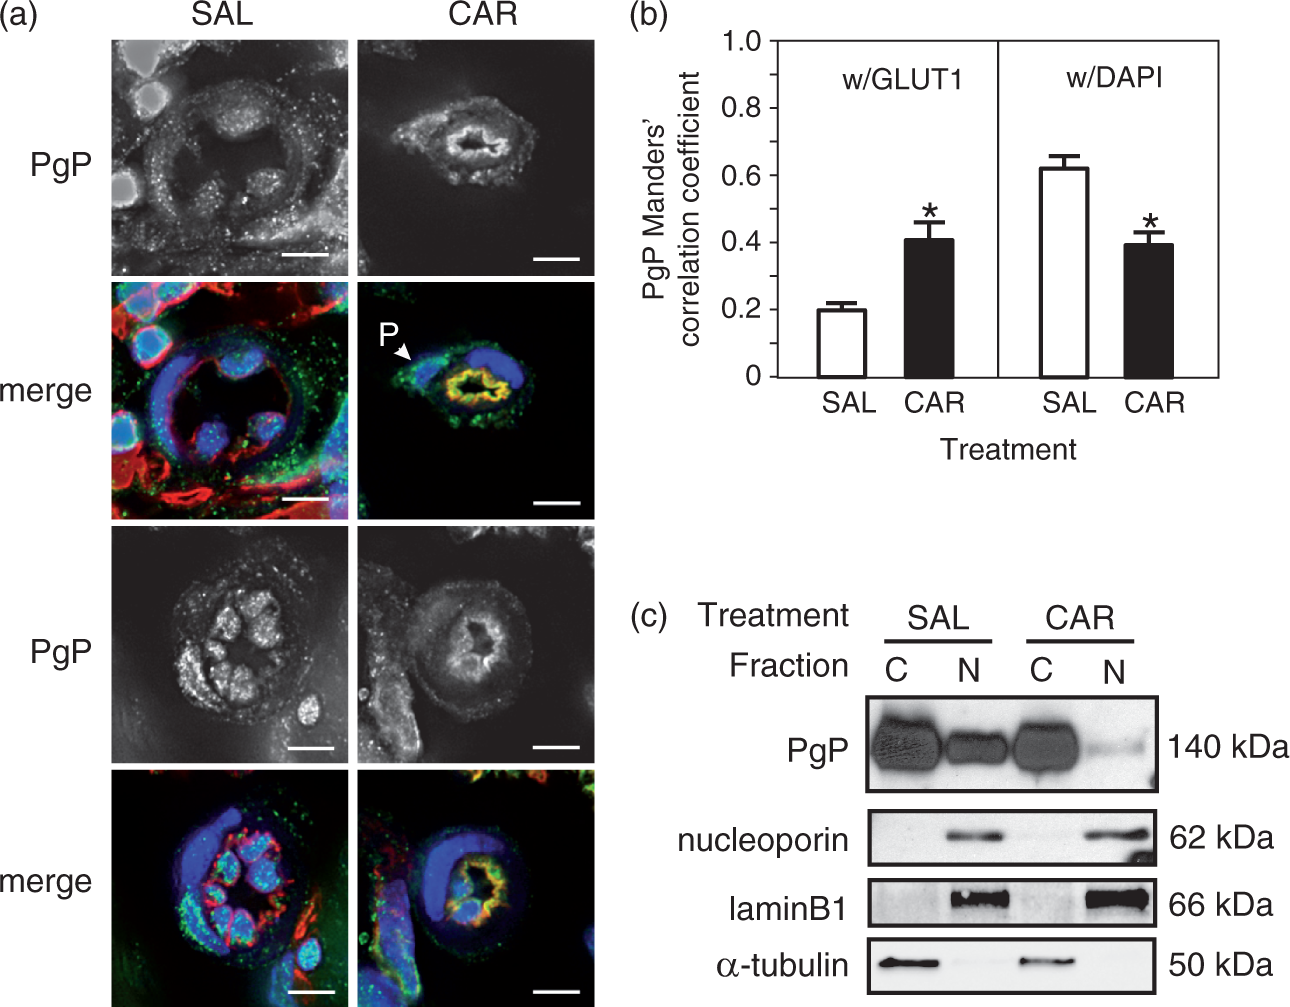
To determine whether our empirical observations in the images were significant, we used three different approaches. First, we performed a colocalization analysis of our deconvolution microscopy images (Figure 2(b)). PgP was primarily located in the nucleus in control (SAL-injected) animals; a decreased amount of PgP was located at the vessel luminal surface. In the CAR-injected animals, there was a significant decrease in nuclear PgP (PgP overlap with DAPI) concomitant with significantly increased luminal PgP (PgP overlap with GLUT1).
Second, using biochemical methods, we analyzed the PgP in the cytosolic and nuclear fractions from the isolated rat microvessels. Immunoblots indicated that PgP in the nuclear fraction decreased after CAR treatment (Figure 2(c)). The mean relative amount of nuclear PgP, corrected for nucleoporin values, was significantly greater in the SAL-treated animals (1 ± 0.37) compared with the CAR-treated animals (0.048 ± 0.013) (n = 3 pools of three rats per treatment; p ≤ 0.05).
Finally, because PgP is difficult to detect via immunofluorescence, we verified staining with a different PgP antibody (mouse monoclonal ab3366, AbCam). Similar to the results with the rabbit polyclonal antibody, samples stained with the mouse monoclonal antibody showed strong nuclear and moderate luminal staining (Supplementary Figure 3) in control animals. We also observed slight abluminal staining and staining of the pericytes. With CAR injection, vessels exhibited increased luminal PgP staining and a decreased PgP signal in the endothelial cell nuclei (Supplementary Figure 3). Taken together, these data indicate that PgP traffics from the nuclear environment to the luminal membrane of microvessel endothelial cells during a PIP stimulus.
Localization of CAV1 in rat brain microvessels
A portion of the total PgP in naïve rat brain microvessel endothelial cells is found in caveolae. 14 Caveolae are dynamic structures that are involved in protein and lipid trafficking as well as regulation of signaling cascades. 16 Based on the observation that caveolar localization may influence PgP activity, 17 we tested whether caveolar proteins moved within the rat brain endothelial cells in vivo in response to PIP. Movement of caveolar proteins during PIP could indicate trafficking events directly involved with the transfer of PgP to the PM or a change in membrane microenvironment that would influence PgP activity at the PM.
Several studies indicate that CAV1 binds to PgP.15,18,27 CAV1 is a caveolar scaffold protein
28
that is also located in non-caveolar membranes and performs trafficking functions.16,29 To determine the location of CAV1 in the microvessels, we optimized CAV1 staining in our FFPE sections. As shown in Figure 3(a) to (c), CAV1 is located at the luminal membrane of the endothelial cells. There is also considerable punctate cytosolic staining that has a regular pattern (Figure 3(b)). There is moderate abluminal staining and strong staining of the pericyte PM (Figure 3(b)).
Location of CAV1 in microvessels and pericytes of animals after a peripheral inflammatory pain stimulus. (a) Representative fluorescence microscopy image of a microvessel section stained for CAV1 (green) and GLUT1 (red) with a DAPI (blue: nuclear) counterstain compared with the no primary control. Images were acquired using a 40× objective. Bars represent 20 µm. (b) Representative deconvolution microscopy images stained for CAV1 (green) and GLUT1 (red) or CAV1 alone with a DAPI (blue: nuclear) counterstain. Images were acquired using a 60× objective. Bars represent 5 µm. Abbreviations: pericyte (P); lumen (L). (c) Representative deconvolution microscopy images of microvessels in saline (SAL)-injected (control) and λ carrageenan (CAR)-injected animals stained for CAV1 (green) and GLUT1 (red) with a DAPI (blue: nuclear) counterstain. Grayscale images are CAV1 only. Images were acquired using a 60× objective. Bars represent 5 µm. (d) Colocalization analysis of the overlap of the CAV1 signal with the GLUT1 and DAPI signals in microvessel endothelial cells. Values are the mean + SEM (n = 27 (GLUT1) or 25 (DAPI) total images representing vessels from nine animals/treatment). (e) Representative fluorescence microscopy image of a microvessel section stained for PgP (ab3366: green) and CAV1 (red) with a DAPI (blue: nuclear) counterstain compared with the no primary control. Images were acquired using a 40× objective. Bars represent 20 µm. (f) Representative deconvolution microscopy images of microvessels in SAL-injected and CAR-injected animals stained for PgP (green) and CAV1 (red) with a DAPI (blue: nuclear) counterstain. Images were acquired using a 60× objective. Bars represent 5 µm.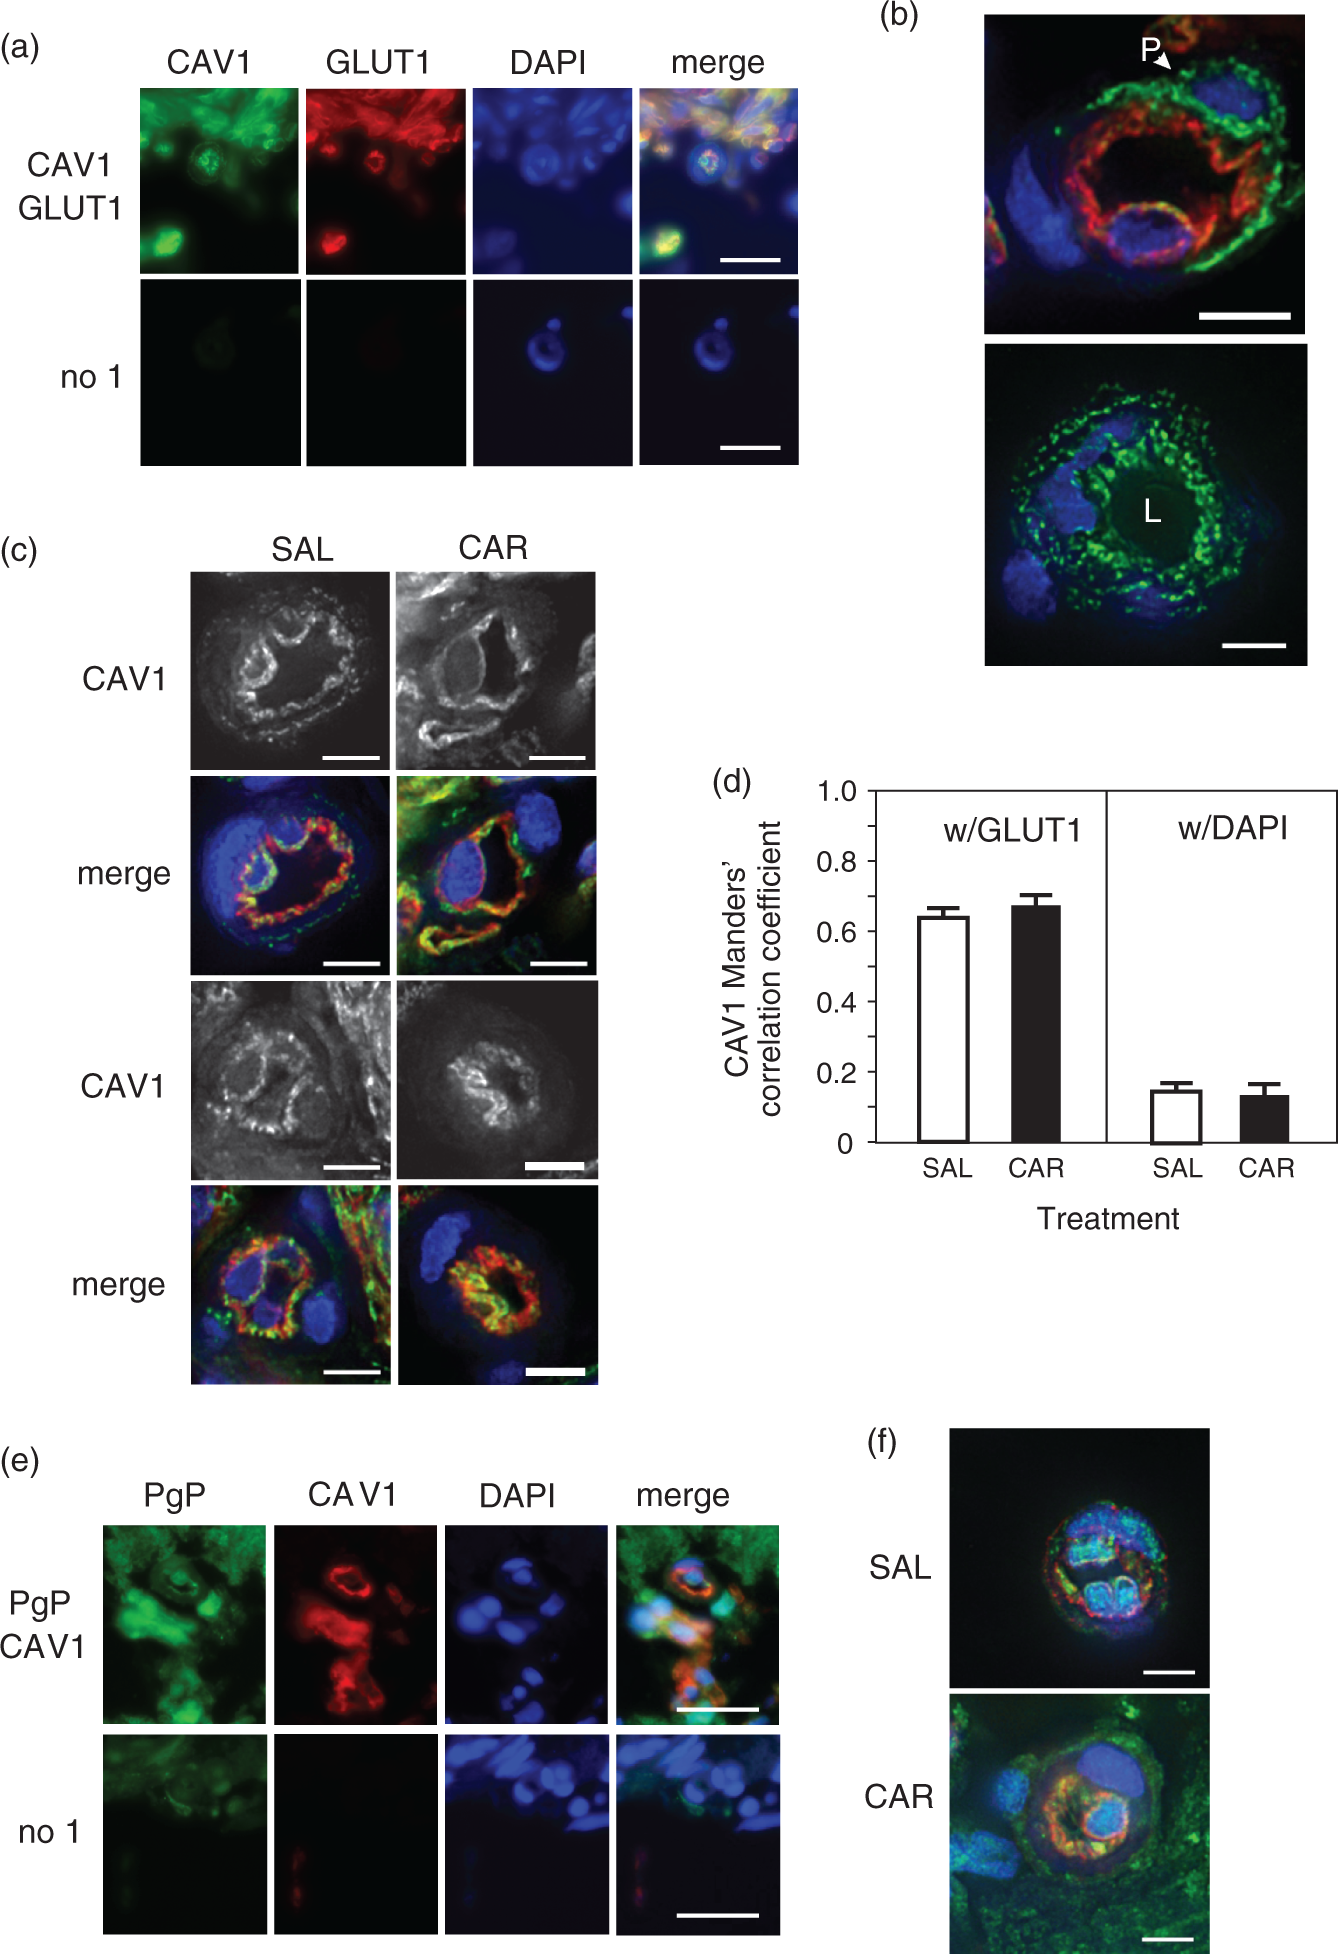
CAV1 does not traffic in response to a PIP stimulus
If CAV1 is involved in PgP trafficking to the endothelial cell lumen, we would expect CAV1 to move to the lumen in response to PIP. We measured CAV1 trafficking in response to PIP by calculating colocalization of the CAV1 signal (green) with GLUT1 (red) as a luminal marker and DAPI (blue) as a nuclear marker. As shown in the images in Figure 3(c), we did not detect an increase in CAV1 staining at the endothelial cell lumen in response to PIP. Both grayscale images of CAV1 staining and merged images showed a similar pattern in vessels from the control and CAR-injected animals. Colocalization analysis of the deconvolution images showed that there was no increase in CAV1/GLUT1 overlap (Figure 3(d)). In images from vessels stained for PgP (green) and CAV1 (red) (Figure 3(e) and (f)), we observed an increase in overlap of the PgP and CAV1 signals (yellow) at the lumen after PIP. However, based on our data that showed no increase in CAV1 at the lumen, the increased overlap in signal is likely due to the increase of PgP at the lumen.
PTRF/cavin1 location in rat brain microvessels
PTRF/cavin1 is a transcription termination release factor
30
that is also required for the formation of caveolae
31
and has been implicated in cholesterol transport.
16
The location of PTRF in rat microvessel endothelial cells and pericytes is unknown. Based on its function in caveolae, we measured the location of PTRF in the rat microvessels. As shown in Figure 4(a) and (b), we found that PTRF was located at the luminal surface of endothelial cells. We also found considerable punctate cytoplasmic staining in the endothelial cells (Figure 4(b)); we did not see nuclear staining. Staining of the PM of the pericytes was prominent (Figure 4(b)). Endothelial cell abluminal staining was often noted; however, whether this staining originates from the abluminal PM of the endothelial cells or the PM of the pericyte processes is not possible to determine from these images.
PTRF traffics to the lumen of microvessel endothelial cells after a peripheral inflammatory pain stimulus. (a) Representative fluorescence microscopy image of a microvessel section stained for PTRF (green) and GLUT1 (red) with a DAPI (blue: nuclear) counterstain compared with the no primary control. Images were acquired using a 40× objective. Bars represent 20 µm. (b) Representative deconvolution microscopy images of microvessels stained for PTRF (green) and GLUT1 (red) with a DAPI (blue: nuclear) counterstain. Images were acquired using a 60× objective. Bars represent 5 µm. Abbreviations: pericytes (P). (c) Representative deconvolution microscopy images of microvessels in saline (SAL)-injected (control) and λ carrageenan (CAR)-injected animals stained for PTRF (green) and GLUT1 (red) with a DAPI (blue: nuclear) counterstain. Grayscale images are PTRF only. Images were acquired using a 60× objective. Bars represent 5 µm. (d) Colocalization analysis of the overlap of the PTRF signal with the GLUT1 and DAPI signals in microvessel endothelial cells. Values are the mean + SEM (n = 35 (GLUT1) or 29 (DAPI) total images representing vessels from nine animals/treatment). * indicates significantly different from SAL values (p = 2.31E-04). (e) Representative fluorescence microscopy images of a microvessel section stained for PgP (ab3366: green) and PTRF (red) with a DAPI (blue: nuclear) counterstain compared with the no primary control. Images were acquired using a 40× objective. Bars represent 20 µm. (f) Representative deconvolution microscopy images of microvessels in SAL-injected and CAR-injected animals stained for PgP (green) and PTRF (red) with a DAPI (blue: nuclear) counterstain. Images were acquired using a 60× objective. Bars represent 5 µm.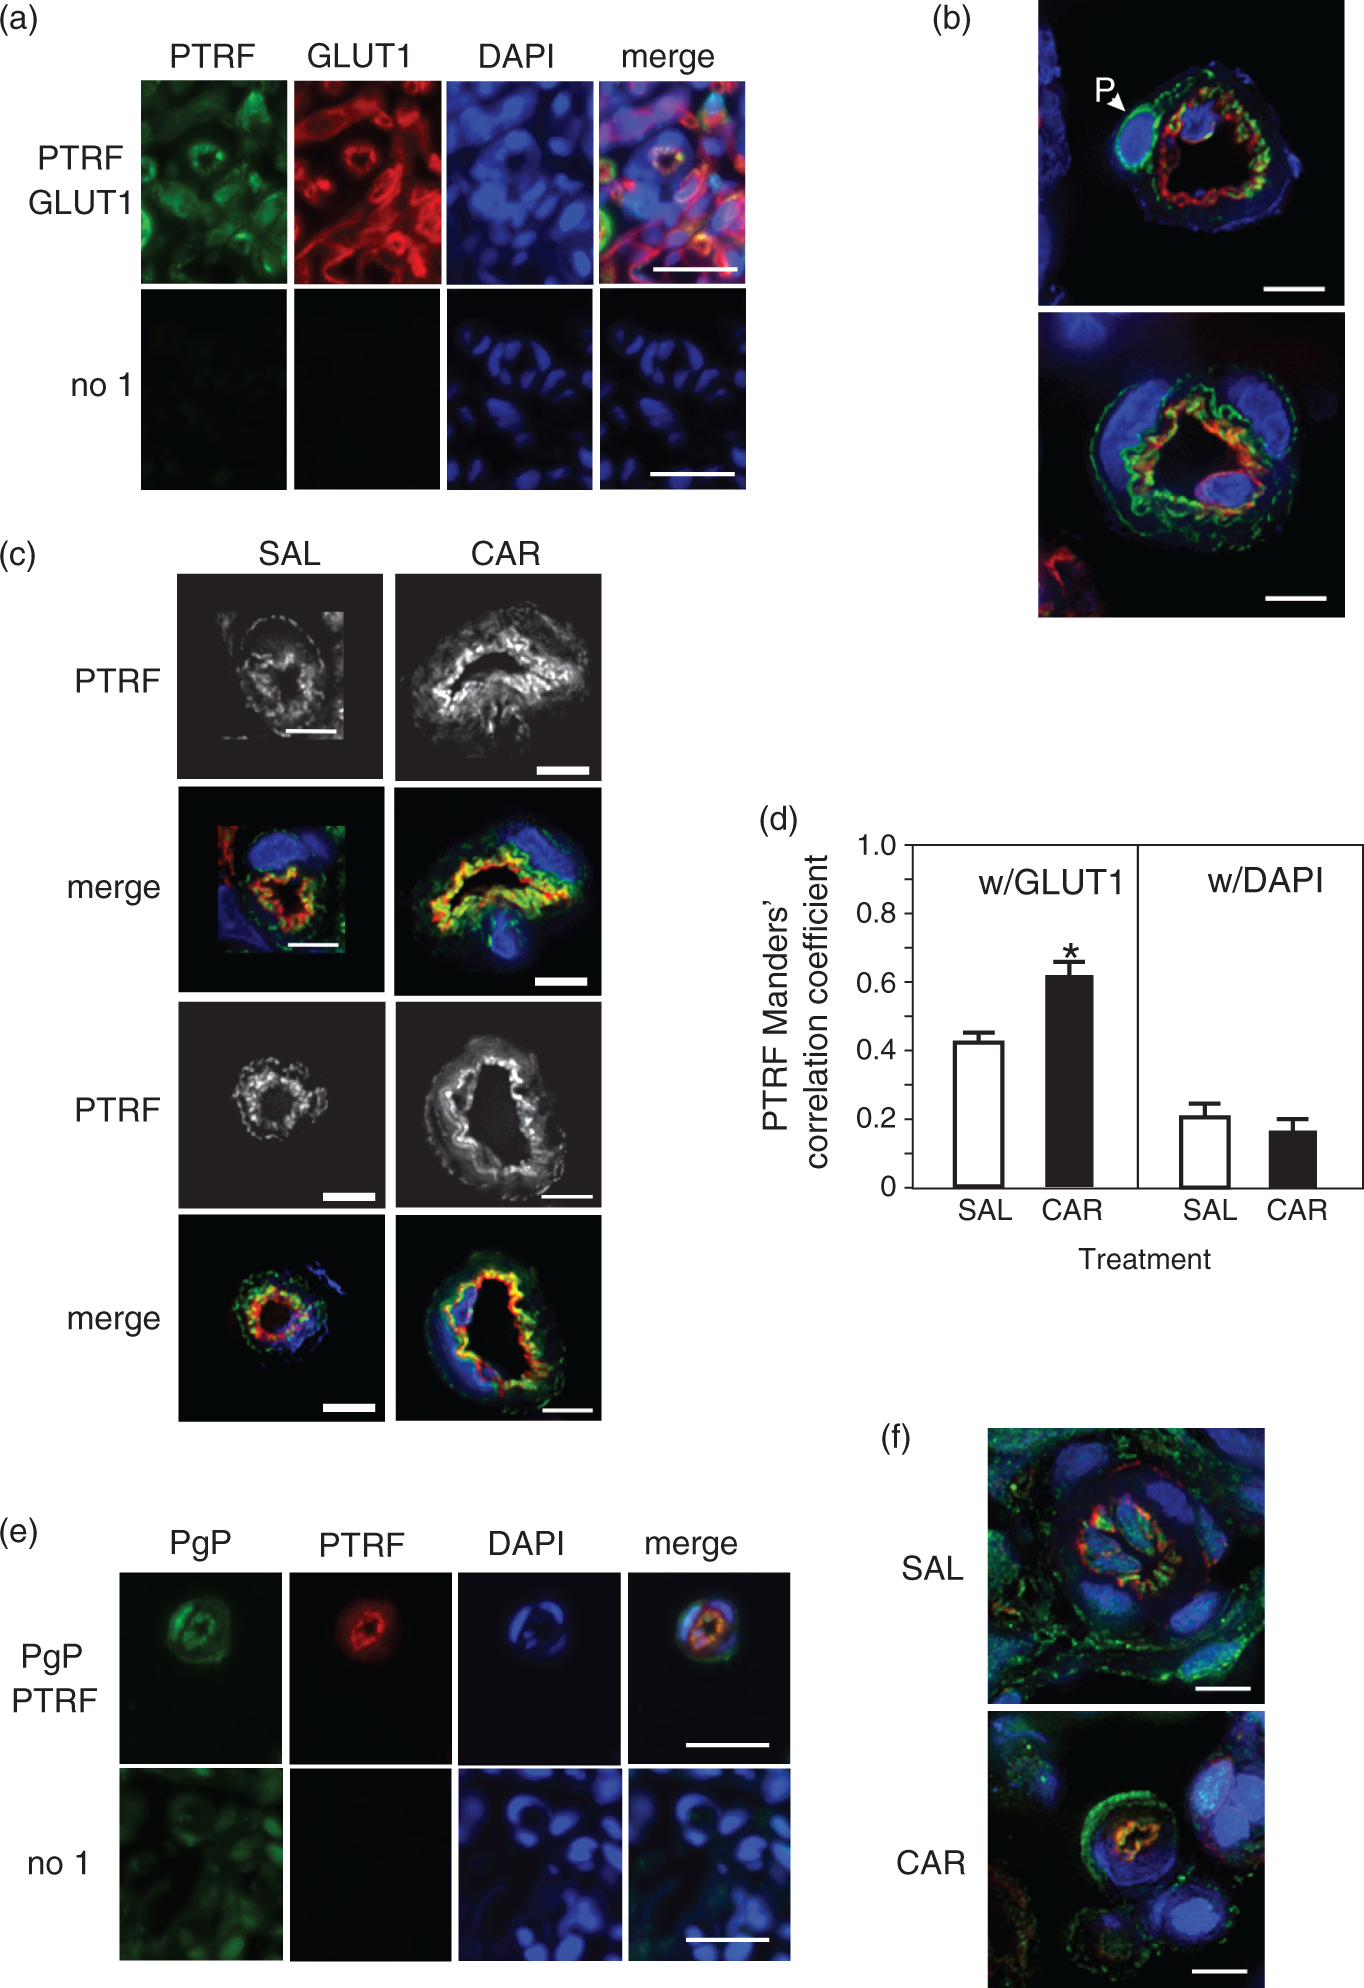
PTRF/cavin1 traffics to the PM in response to PIP
In response to PIP, we observed increased luminal staining for PTRF (Figure 4(c)) as indicated by the increased overlap of the PTRF signal (green) with that for GLUT1 (red). The grayscale images of PTRF staining showed that the staining pattern changed from punctate and diffuse in the control animal microvessels to a more intense ring around the lumen in the CAR-injected animal microvessels. Colocalization analysis (Figure 4(d)) of the deconvolution images indicated there was significantly increased overlap of the PTRF and GLUT1 signals. Although a nuclear location for PTRF would be expected if it is acting as a transcription termination factor, we did not detect PTRF in the endothelial cell nuclei and saw no change in nuclear PTRF with PIP. During PIP both PgP (green) and PTRF (red) moved to the luminal membrane (Figure 4(e) and (f)). This resulted in increased overlap of the PgP and PTRF signals (yellow) at the luminal surface of the endothelial cells.
SDPR/cavin2 location in rat brain microvessels
SDPR/cavin2, along with PTRF, regulates the caveolar structure; in particular, SDPR regulates membrane curvature in the caveolae.
16
SDPR has also been implicated in regulating the cholesterol content of the PM.
16
SDPR location in microvessel endothelial cells and pericytes is unknown. Based on the function of SDPR in caveolar structure, we identified the intracellular location of SDPR in both cell types. In the microvessel endothelial cells, we found that SDPR was located in the nuclei and at the lumen (Figure 5(a) and (b)). We did not detect SDPR in the cytosol. Pericyte PMs and nuclei also contained SDPR. As with the other caveolar proteins, we observed endothelial cell abluminal staining; however, the origin of the staining could be pericyte PM.
SDPR traffics to the lumen of microvessel endothelial cells after a peripheral inflammatory pain stimulus. (a) Representative fluorescence microscopy images of a microvessel section stained for SDPR (green) and GLUT1 (red) with a DAPI (blue: nuclear) counterstain compared with the no primary control. Images were acquired using a 40× objective. Bars represent 20 µm. (b) Representative deconvolution microscopy images stained for SDPR (green) with a DAPI (blue: nuclear) counterstain. Image was acquired using a 60× objective. Bars represent 5 µm. Abbreviations: pericytes (P); lumen (L). (c) Representative deconvolution microscopy images of microvessels in saline (SAL)-injected (control) and λ carrageenan (CAR)-injected animals stained for SDPR (green) and GLUT1 (red) with a DAPI (blue: nuclear) counterstain. Grayscale images are SDPR only. Images were acquired using a 60× objective. Bars represent 5 µm. (d) Colocalization analysis of the overlap of the SDPR signal with the GLUT1 and DAPI signals in microvessel endothelial cells. Values are the mean + SEM (n = 30 (GLUT1) or 32 (DAPI) total images representing vessels from nine animals/treatment). * indicates significantly different from SAL values for GLUT1 (p = 2.37E-09) or DAPI (p = 1.77E-02). (e) Representative fluorescence microscopy image of a microvessel section stained for PgP (ab3366: green) and SDPR (red) with a DAPI (blue: nuclear) counterstain compared with the no primary control. Images were acquired using a 40× objective. Bars represent 20 µm. (f) Representative deconvolution microscopy images of microvessels in SAL-injected and CAR-injected animals stained for PgP (green) and SDPR (red) with a DAPI (blue: nuclear) counterstain. Images were acquired using a 60× objective. Bars represent 5 µm.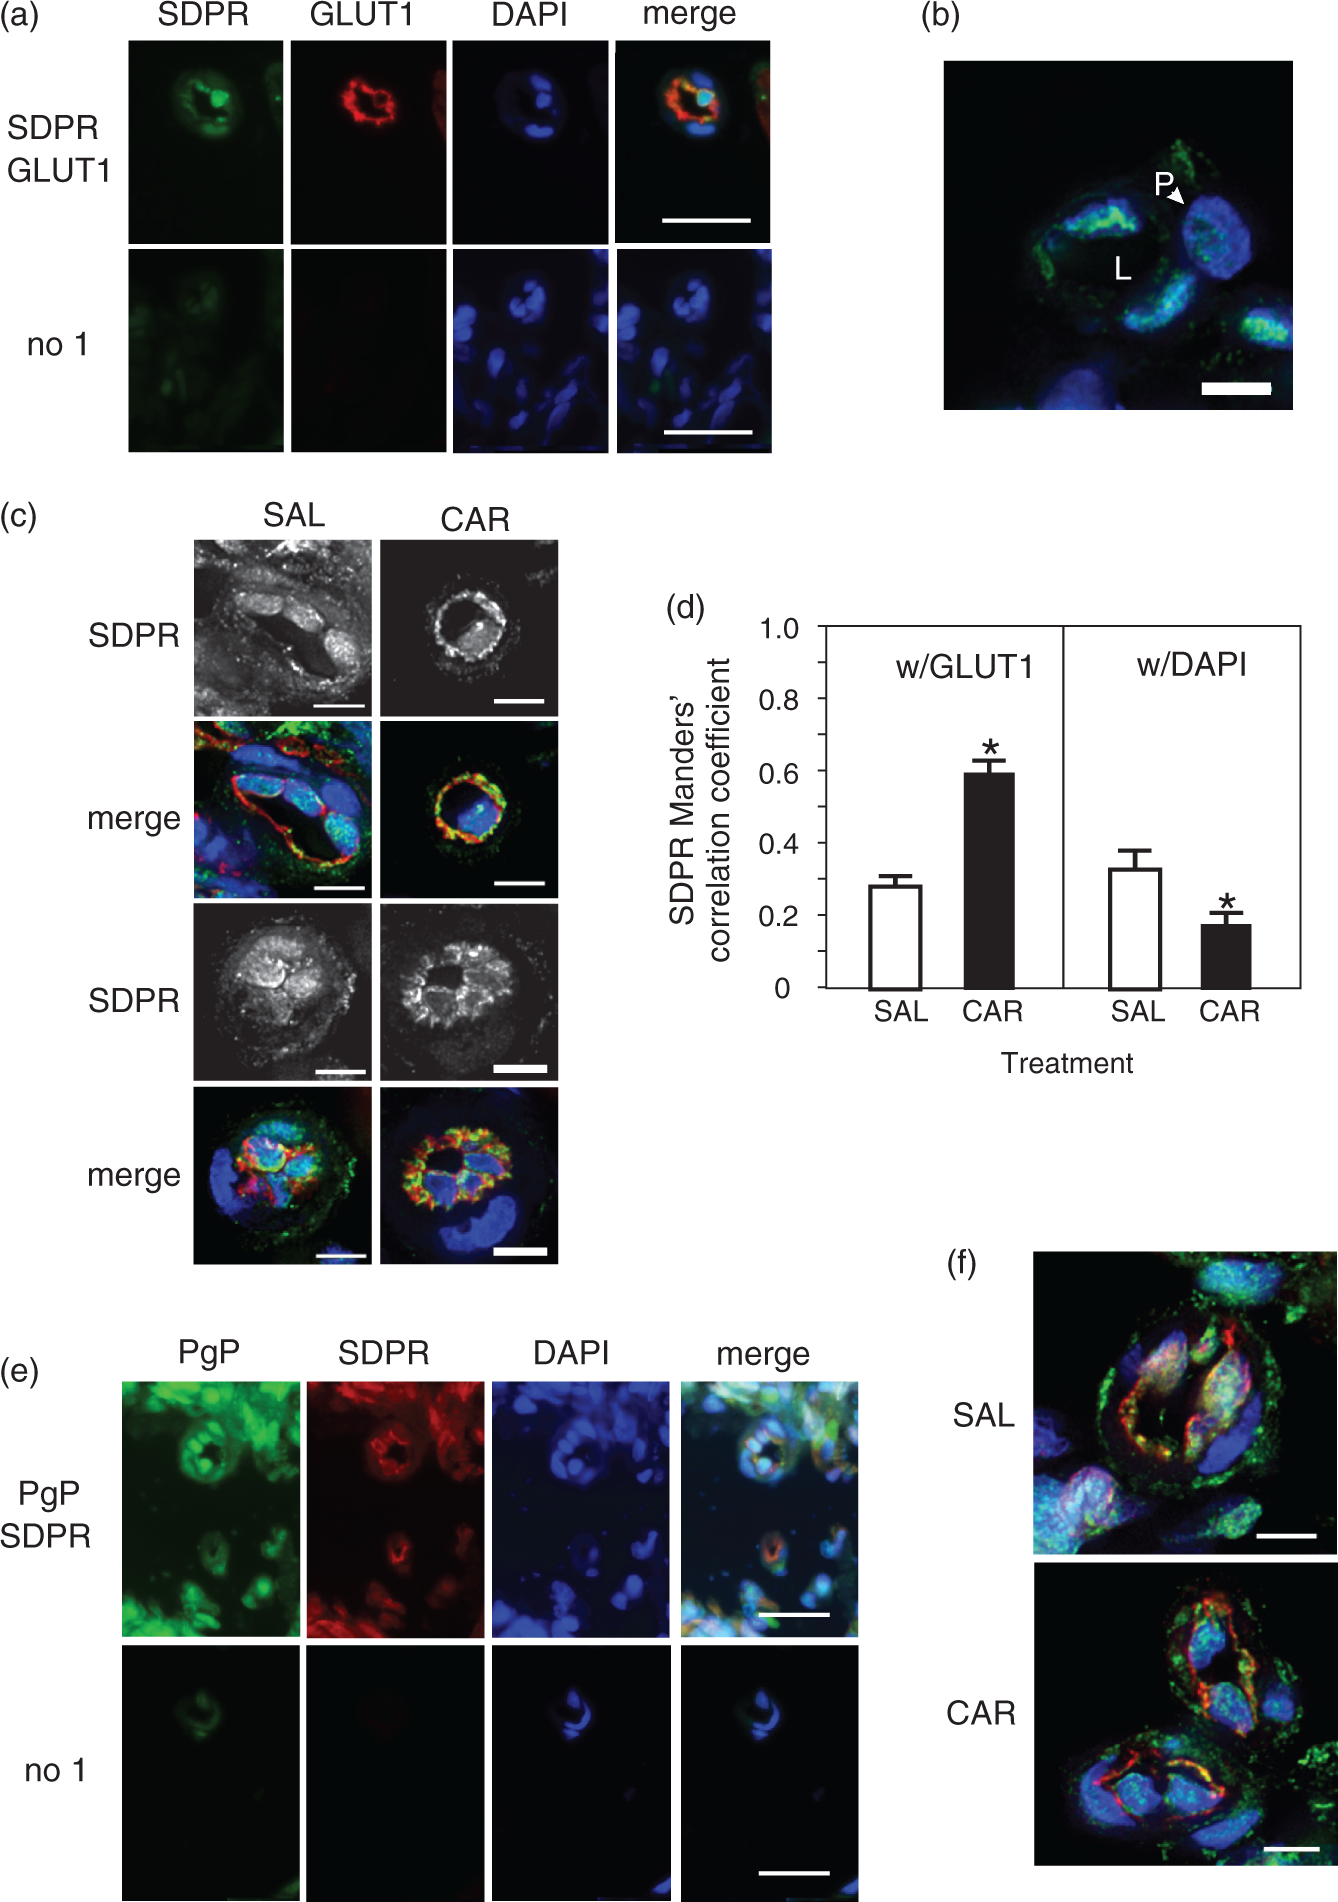
SDPR/cavin2 traffics from the nucleus to the PM in response to PIP
During a PIP stimulus, SDPR staining decreased in the nucleus and increased at the endothelial cell lumen (Figure 5(c)). Grayscale images showed that SDPR staining within the endothelial cells changed from punctate in the nuclear region to a more intense ring pattern around the vessel lumen. We found a significantly increased overlap of the SDPR signal (green) with the GLUT1 signal (red) concomitant with a decreased overlap of the SDPR signal with the DAPI (nuclear) signal in the CAR-injected animals (Figure 5(d)). In the images from samples stained for PgP (green) and SDPR (red), we observed a decreased signal from both antigens in the endothelial cell nuclei with an increased signal at the luminal membrane (Figure 5(e) and (f)) after a PIP stimulus. These data indicate that PgP and SDPR remain colocalized during the PIP stimulus, as they move from the nucleus to the luminal PM.
Localization of PRKCDBP/cavin3 in rat brain microvessels
Protein kinase C delta binding protein (PRKCDBP/cavin3) is a caveolar protein involved in vesicular transport to and from caveolae.
32
Our analysis showed that the endothelial cell luminal membranes contained a considerable amount of this protein (Figure 6(a) and (b)). There was considerable overlap of the PRKCDBP signal (green) with the GLUT1 signal (red). In addition, we observed prominent punctate PRKCDBP cytosolic staining arranged in a regular pattern in the endothelial cells (Figure 6(b)). Pericyte PMs also stained for PRKCDBP/cavin3 (Figure 6(b)). We did not observe nuclear staining for PRKCDBP.
Location of PRKCDBP in rat microvessels and pericytes after a peripheral inflammatory pain stimulus. (a) Representative fluorescence microscopy image of a microvessel section stained for PRKCDBP (green) and GLUT1 (red) with a DAPI (blue: nuclear) counterstain compared with the no primary control. Images were acquired using a 40× objective. Bars represent 20 µm. (b) Representative deconvolution microscopy images stained for PRKCDBP (green) and GLUT1 (red) with a DAPI (blue: nuclear) counterstain. Images were acquired using a 60× objective. Bars represent 5 µm. Abbreviation: pericytes (P). (c) Representative deconvolution microscopy images of microvessels in saline (SAL)-injected (control) and λ carrageenan (CAR)-injected animals stained for PRKCDBP (green) and GLUT1 (red) with a DAPI (blue: nuclear) counterstain. Grayscale images are PRKCDBP only. Images were acquired using a 60× objective. Bars represent 5 µm. (d) Colocalization analysis of the overlap of the PRKCDBP signal with the GLUT1 and DAPI signals in microvessel endothelial cells. Values are the mean + SEM (n = 28 total images representing vessels from nine animals/treatment). (e) Representative fluorescence microscopy image of a microvessel section stained for PgP (ab3366: green) and PRKCDBP (red) with a DAPI (blue: nuclear) counterstain compared with the no primary control. Images were acquired using a 40× objective. Bars represent 20 µm. (f) Representative deconvolution microscopy images of microvessels in SAL-injected and CAR-injected animals stained for PgP (green) and PRKCDBP (red) with a DAPI (blue: nuclear) counterstain. Images were acquired using a 60× objective. Bars represent 5 µm.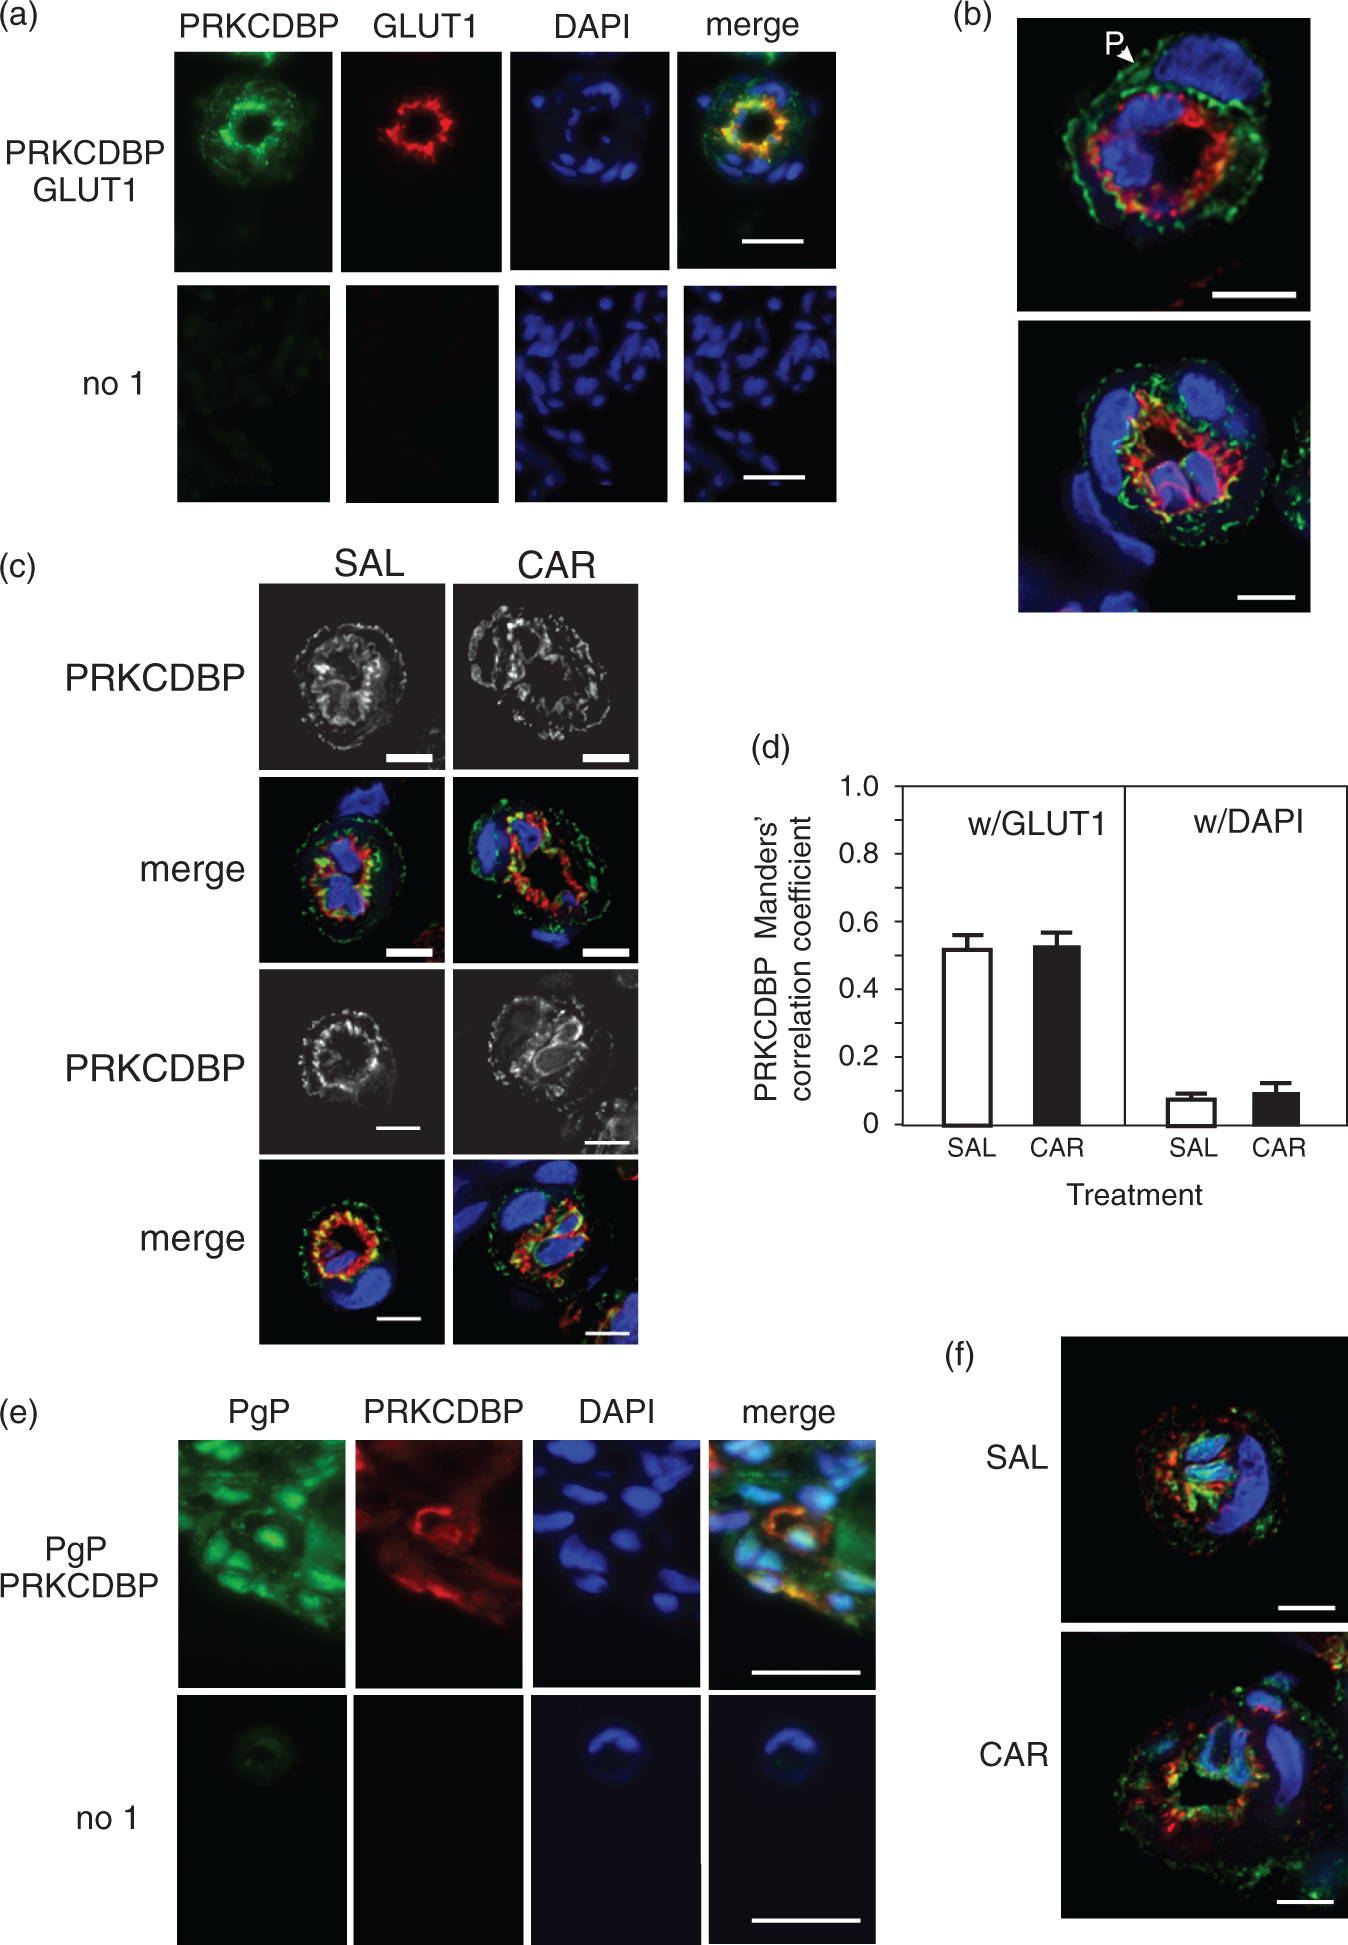
PRKCDBP/cavin3 does not traffic in response to PIP
During a PIP stimulus, we did not observe any change in the localization of the PRKCDBP (green) signal (Figure 6(c)). Grayscale images of PRKCDBP highlight the lack of movement with PIP. Colocalization analysis of the deconvolution images indicated that the PRKCDBP signal showed the same overlap with the GLUT1 signal in both SAL and CAR samples (Figure 6(d)). There was negligible overlap with DAPI in either sample (Figure 6(d)). When we examined images stained for both PgP (green) and PRKCDBP (red), we saw that there was a small amount of signal overlap (yellow) at the endothelial cell lumen in the control animals (Figure 6(e) and (f)). In microvessels from CAR-injected animals, there was an increase in signal overlap at the lumen (Figure 6(f)) due to the increased amount of PgP located at the lumen following a PIP stimulus.
Discussion
In this study, we identified three protein trafficking events in rat BBB capillary endothelial cells that occur during acute PIP. Our data indicate that PgP traffics from the nucleus to the endothelial cell luminal surface in cerebral microvessels after a PIP stimulus. The results suggest that the nucleus acts as a storage pool of PgP that can be mobilized to the PM in response to an acute stimulus. The model in Figure 7 summarizes our findings. PTRF and SDPR trafficking to the luminal membrane in the endothelial cells during PIP suggests PIP induces alterations to caveolae. Alterations in caveolar protein or lipid composition will impact signaling events during PIP including PgP activation. Each of these trafficking events may contribute to the PgP activity increase during PIP we reported previously
11
and provide an explanation for the physiological observation that CNS morphine efficacy decreases after PIP.
5
Model indicating PgP trafficking from the nucleus to the luminal membrane of the microvessel endothelial cells after a peripheral inflammatory pain (PIP) stimulus. In control animals, PgP is located in the nuclear membrane and the plasma membrane in caveolar and non-caveolar regions. After a PIP stimulus, PgP decreases in the nuclear membrane suggesting that PgP traffics from the nuclear membrane to the plasma membrane.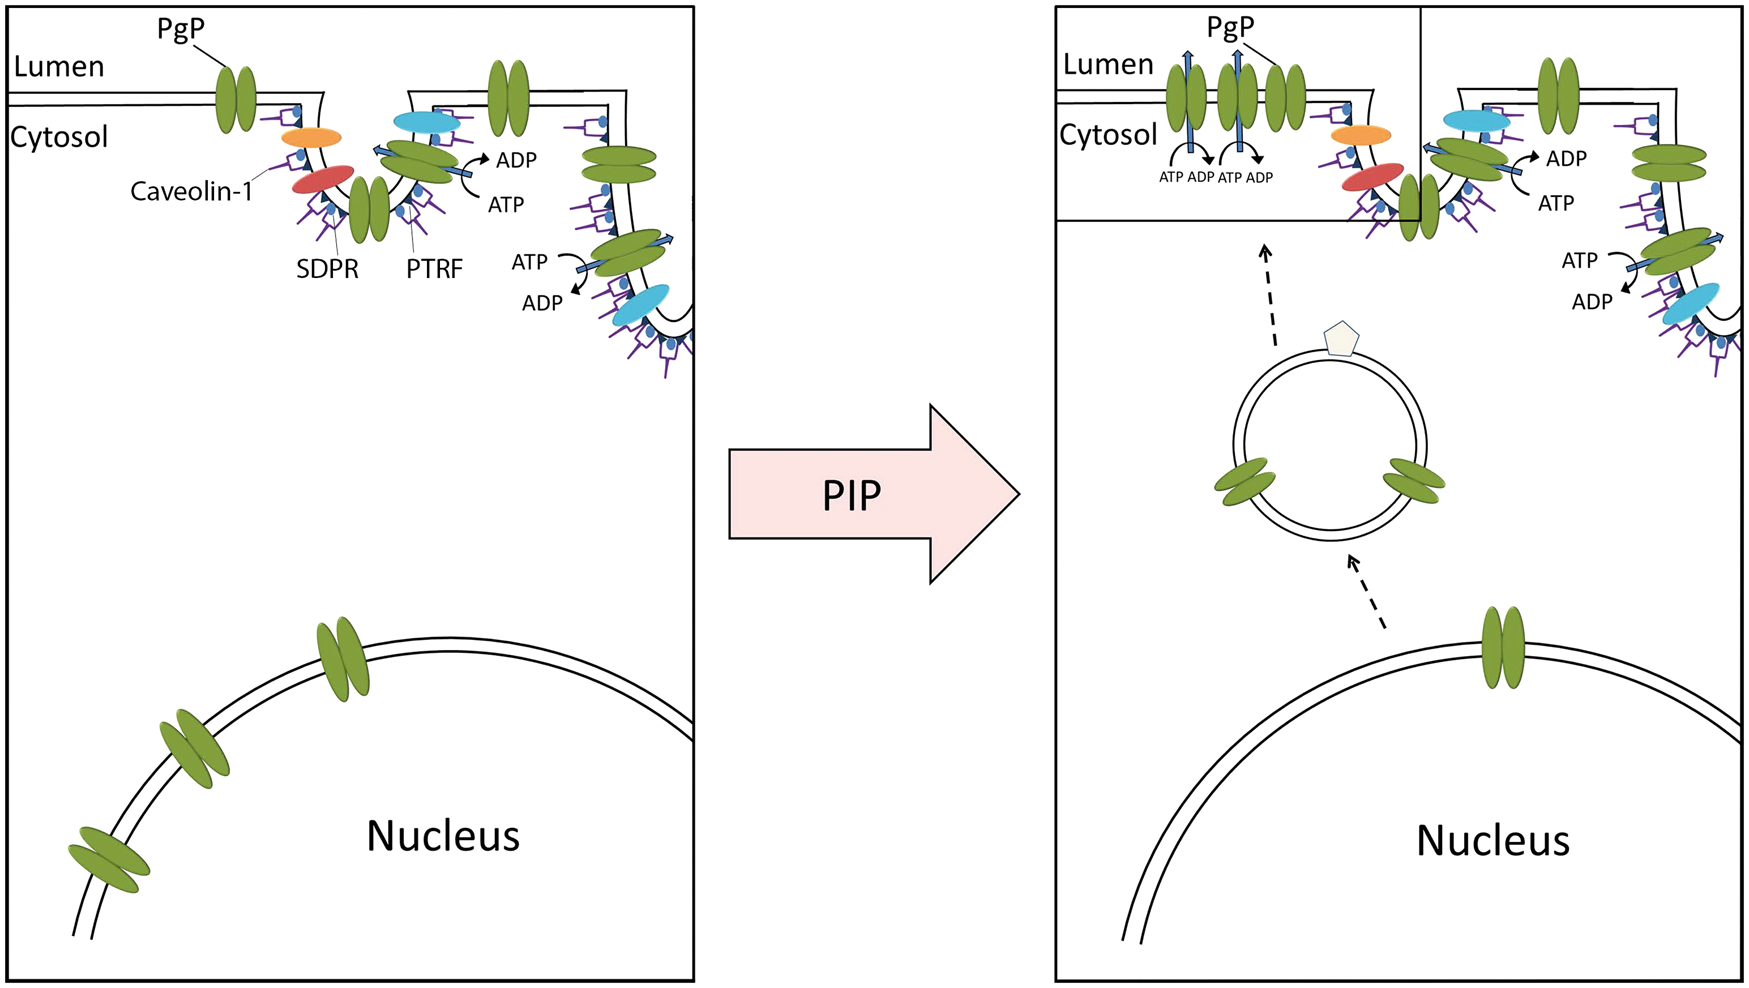
The combination of an increase in PgP at the endothelial cell luminal surface concomitant with a decrease in PgP in the nuclear compartment after PIP suggests we are measuring a protein trafficking event. The acute, 3 h, timepoint makes it unlikely that de novo PgP synthesis accounts for our observations. 13 PgP has been found in the nuclear envelope in BBB endothelial cells in vivo by electron microscopy 14 consistent with our observations in the current study. In some tumor cells, PgP is glycosylated and active in the nuclear membrane where it functions to keep drugs (particularly doxorubicin) out of the nucleus, thereby contributing to tumor cell survival. 33 In the case of BBB endothelial cells, our data argue for location in the nuclear membrane being a storage mechanism whereby the cells can respond to a stimulus by trafficking mature PgP to the luminal cell membrane for activation and prevention of drug/toxic substance uptake into the CNS.
Our data fit with mature PgP trafficking from the nucleus to the PM in response to PIP; however, there are other possibilities. Newly synthesized PgP moves through the trans-Golgi network and via Rab-mediated endosomal sorting pathways to reach the PM in a cell type-specific manner. 34 There are known mechanisms in other cell types by which a mature large glycosylated protein such as PgP can reach the nuclear membrane. One is through Rab6-mediated endosomal sorting of vesicles that bud off the trans-Golgi network. 35 A second is via endocytosis of mature protein from the PM into vesicles that are targeted to the nuclear envelope. 36 The mechanism by which newly synthesized PgP reaches the PM or the nuclear membrane in BBB endothelial cells in vivo remains unknown. We cannot rule out that there is also perinuclear PgP or cytosolic PgP that transits to the membrane as well, since this would be below our limits of detection. Alterations in multiple pathways may contribute to our observations. Movement from the nuclear envelope would suggest a nuclear export process. Recent data suggest nuclear export processes are cargo dependent. 37 Although the mechanism by which PgP is exported from the nucleus is unknown, one possibility is that it depends on Hsc70. We identified Hsc70 as a protein that co-immunoprecipitates with PgP in rat brain microvessel isolates. 38 Hsc70 is a nucleocytoplasmic shuttle protein in other cell types in culture.39,40 By identifying both the source and destination of the PgP in the endothelial cells, we can direct our efforts toward elucidating the steps in the PgP trafficking pathways that result in increased PgP at the PM after PIP.
Trafficking of PTRF and SDPR to the BBB endothelial cell luminal PM suggests that PIP alters caveolar protein and/or lipid composition. PgP is located in caveolae and non-caveolar regions in the PM of BBB endothelial cells in naïve rats. 14 Studies in cell culture cells indicate that the cholesterol rich environment in the caveolae and lipid rafts is necessary for, or at least can modulate, PgP activity.17,41 Movement of PgP into cholesterol rich regions or altering cholesterol content of domains containing PgP is a potential mechanism to regulate PgP activity.
PTRF was identified first as a polymerase I transcription release factor, but more recent data indicates it is required for caveolae formation.31,42 This protein has a cholesterol binding motif, binds CAV1 in a cholesterol-dependent manner and alters membrane cholesterol dynamics. 31 PTRF is essential for multidrug resistance in cancer cells in culture, a component of which is functional PgP activity. 43 In control animals, we do not see PTRF staining in the nucleus, but we do see punctate cytosolic staining. After PIP, we observe an increase in both PTRF and PgP at the lumen. We cannot quantitate the cytosolic staining with our current staining protocol; however, the implication is that the increase in PM PTRF is from the molecules in the cytosol. Increased colocalization of PTRF and PgP would be consistent with an increase in caveolar PgP. Trafficking of PTRF to the PM could have functional implications for PgP activity by increasing caveolae number/stability or membrane cholesterol/dynamics. Our data suggest that PTRF is unlikely to be directly involved in regulating PgP trafficking to the PM because, although the destination for both molecules is the same, the origin differs.
SDPR traffics from the nucleus to the luminal membrane with a PIP stimulus; SDPR is involved in the formation of the caveolar scaffold and binds both CAV1 and PTRF. 32 Knockout animals indicate that it contributes to the formation of the membrane curvature in the caveolae by an unknown mechanism.44,45 SDPR trafficking to the caveolae is very sensitive to the cholesterol content in adipocytes in culture. 46 With increased membrane cholesterol, SDPR moves to the PM, but with low cholesterol SDPR is located in the cytosol. Our data indicate that SDPR moves from the nucleus to the PM concomitant with PgP. PgP activity is influenced by membrane fluidity largely controlled by cholesterol in vivo.41,47 These data suggest three possibilities: (a) that SDPR is involved in PgP trafficking to the PM from the nucleus; (b) SDPR alters caveolar structure which impacts PgP activity; or (c) cholesterol increases at the PM and SDPR is an indicator of increased PM cholesterol content. This would indicate PM cholesterol content is changing with PIP and this change in cholesterol may impact PgP activity.
CAV1 and PRKDBP did not traffic in response to PIP in a way that we could measure with the techniques used in this study. CAV1 can bind PgP both inside and outside caveolae. 48 Direct binding of CAV1 to PgP acts to inhibit it; although it may be only the Tyr14—phosphorylated form of CAV1 that inhibits PgP activity.18,27 There is greater overlap of PgP and CAV1 signals at the luminal surface after PIP because PgP moves there while CAV1 stays in place. If CAV1 is regulating PgP during PIP, our data would be consistent with CAV1 regulation of PgP by phosphorylation of CAV1 in a PgP/CAV1 complex or via CAV1-dependent trafficking of PgP between caveolar and non-caveolar domains in the PM. This remains to be tested. Qualitatively we observed that (a) the punctate cytosolic staining of PRKCDBP in the CAR-treated rats had a different pattern than that in the SAL-injected animals; and (b) there was increased cytosolic PRKCDBP in vessels from the CAR-treated animals. These observations are consistent with altered vesicular movement to and from the caveolae during PIP; however, additional work is needed to measure this activity.
The intense staining of the pericytes for PgP suggests these cells could contribute to impeding the import of drugs into the CNS. We did not measure PgP trafficking events in the pericytes because we were unable to sample enough nuclei to determine whether PgP moves from the nucleus to the PM in these cells. Our qualitative observations suggest this might be true in the pericytes as well. We did observe a number of pericyte nuclei that did not stain for PgP in the CAR-treated samples. This would fit with our biochemical measurements of PgP location after PIP because pericytes are represented in the microvessel isolate. CAV1, PTRF, SDPR, and PRKCDBP all were clearly located in the pericyte PM; we did not see evidence for trafficking of these proteins in pericytes with PIP. Electron microscopy studies show the presence of numerous PM caveolae in pericytes; 14 our study suggests these caveolae are rich in caveolar proteins.
Our PgP trafficking data provide an explanation for the physiological observation that CNS morphine uptake and efficacy decrease during PIP. 5 Our observation that PgP leaves the nucleus during PIP suggests mechanisms by which PgP traffics to the luminal PM that have not been suggested by cell culture experiments. One of the clinical challenges for drug delivery to the CNS has been how to prevent the increase in PgP activity at the endothelial cell lumen during a pathological insult while leaving the basal level intact, so that toxins and pathogens do not accumulate in the brain during the drug delivery period. Our data suggest novel trafficking pathways that may contribute to the increase in PgP activity during PIP. These pathways provide potential targets for pharmacological intervention to selectively increase drug delivery to the CNS under pathological conditions such as pain, stroke, and epilepsy.
Footnotes
Funding
The author(s) disclosed receipt of the following financial support for the research, authorship, and/or publication of this article: DA 011271 and NS 042652 (to T.P.D.) and Cancer Center Core Grant (P30-CA23074) support of TACMASR.
Acknowledgments
We thank Doug Cromey, MS, Monika Schmelz PhD, for advice expert assistance with the microscopy.
Declaration of conflicting interests
The author(s) declared no potential conflicts of interest with respect to the research, authorship, and/or publication of this article.
Authors' contributions
Study concept and design (M.E.T., J.M.H., T.P.D.); data acquisition and analysis (M.E.T., J.M.H., C.P.S., L.M.J., Y.Z., C.K.J.); data interpretation (M.E.T., J.M.H., T.P.D.); wrote the manuscript (M.E.T.).
References
Supplementary Material
Please find the following supplemental material available below.
For Open Access articles published under a Creative Commons License, all supplemental material carries the same license as the article it is associated with.
For non-Open Access articles published, all supplemental material carries a non-exclusive license, and permission requests for re-use of supplemental material or any part of supplemental material shall be sent directly to the copyright owner as specified in the copyright notice associated with the article.