
Abstract
[11C]Ro15-4513 has been introduced as a positron emission tomography radioligand to image the GABAAα5 receptor subtype thought to be important in learning, memory and addiction. However, the in vivo selectivity of the ligand remains unknown and a full assessment of different analysis approaches has yet to be performed. Using human heterologous competition data, with [11C]Ro15-4513 and the highly selective GABAAα5 selective negative allosteric modulator Basmisanil (RG1662), we quantify the GABAAα5 selectivity of [11C]Ro15-4513, assess the validity of reference tissues and evaluate the performance of four different kinetic analysis methods. The results show that [11C]Ro15-4513 has high but not complete selectivity for GABAAα5, with α5 representing around 60–70% of the specific binding in α5 rich regions. Competition data indicate that the cerebellum and pons are essentially devoid of α5 signal and might be used as reference regions under certain conditions. Off-target non-selective binding to other GABAA subtypes means that the choice of analysis method and the interpretation of outcome measures must be considered carefully. We discuss the merits of two tissue compartmental model analyses to derive both VT and VS, band-pass spectral analysis for estimation of
Introduction
γ-Aminobutyric acid (GABA) is the most abundant and influential inhibitory neurotransmitter in the brain. Investigation of the GABA system in humans in vivo has been made possible, through the development of radioligands selective for the allosteric benzodiazepine site on the GABAA receptor, with positron emission tomography (PET). PET radioligands for the benzodiazepine site have been developed with good brain penetration, specific binding and reversible kinetics, though in most cases with a degree of non-selectivity for GABAA receptor subtypes. The best known example is [11C]Ro15-1788 (or [11C]flumazenil), which is a non-selective benzodiazepine antagonist with similar affinities for the GABAAα1,2,3,5 subtypes. The non-selective nature of [11C]flumazenil means that the PET signal is a composite of the local subtype concentrations, which vary regionally and between clinical populations. The heterogeneous regional distribution of the different benzodiazepine-sensitive GABAA subtypes, as well as their markedly different functional roles, has led to the search for more selective ligands. The extrasynaptic GABAAα5 receptor has been of particular interest due to its putative role in learning, memory and addiction.
The imidazodiazepine Ro15-4513 is a partially selective inverse-agonist for the GABAAα5 receptor, developed in the 1980s by Roche for the labelling of benzodiazepine sites and therefore, by allosteric interaction, the GABA/benzodiazepine complex. 1 Originally applied for visualisation of receptor sites in the rodent brain, 2 Ro15-4513 later epitomised the concept of inverse agonism after demonstrating inhibition of the behavioural intoxication effects of ethanol.3,4 When labelled with carbon-11, Ro15-4513 has been used as a PET radioligand to enable investigation of the GABAAα5 receptor subtype and its dysregulation in a number of disorders including addiction. However, whilst kinetic analysis methods have been developed previously in order to try to isolate the GABAAα5 component of the signal,5,6 the true in vivo selectivity of [11C]Ro15-4513 and the magnitude of the GABAAα5 specific signal have yet to be fully characterised in vivo in man.
Autoradiography studies confirm that [11C]Ro15-4513 has partial selectivity for the GABAAα5 receptor subtype, with an affinity, Ki, approximately 20-fold greater over the other GABAA subtypes (∼10 nM GABAAα1,2,3; ∼0.5 nM GABAAα5).7,8 The high proportion of α5-specific signal, and its subcortical localisation, were demonstrated using the highly selective ligands RY80 and L655,708 in the rat, 9 though it has also been suggested that there is some binding to the benzodiazepine-insensitive GABAA subtypes GABAAα4 and GABAAα6, shown with high concentrations of diazepam and GABA. 10
A portion of cerebellum binding of [11C]Ro15-4513 has been shown to be displaceable by the benzodiazepines flumazenil and clonazepam both in vitro and in vivo in non-human primates and humans.11,12 Furthermore, the relatively high concentrations of GABAAα1,2,3 demonstrated by autoradiography, particularly in the cortex and cerebellum,
13
suggest that despite a lower relative affinity, there will be some measurable signal from these sites due to a greater
To date, quantification of dynamic [11C]Ro15-4513 PET data in non-human primates and humans has been undertaken in several ways. Initial validation of the ligand involved homologous and heterologous competition studies with clonazepam in non-human primates.11,14 These studies identified regions of the brain in which heterologous and homologous blockade differs, suggesting that [11C]Ro15-4513 has specific binding targets not including those of other non-selective benzodiazepine agents. In humans, 2TCM quantification of VT revealed a pattern of differing tissue kinetics, suggesting regionally heterogeneous binding. 15 Similarly, application of spectral analysis for parametric mapping of [11C]Ro15-4513 VT in humans in vivo, identified its primarily limbic distribution. 9
The relatively low signal in the white matter, particularly the pons, suggested that this might be a suitable reference region for methods such as the simplified reference tissue model (SRTM), to avoid arterial sampling. 16 The presence of low signal alone is not sufficient to validate the region as an appropriate reference region and thus this method could underestimate target binding with some level of bias.17,18 Using [11C]flumazenil, for example, application of SRTM with the pons as a reference tissue performed poorly in test–retest and in clinical identification of hippocampal sclerosis.19,20 Given the proposed lack of GABAAα5 in the cerebellum, this provides an alternative candidate reference region for investigation.
To fully characterise both the selectivity of [11C]Ro15-4513 for the GABAAα5 subtype and evaluate whether there is a suitable reference tissue devoid of specific binding, heterologous competition studies with a selective GABAAα5 compound are required. We were provided access to a dataset previously acquired by F. Hoffmann-La Roche consisting of dynamic [11C]Ro15-4513 PET data measured in healthy human subjects following a range of doses of the highly selective GABAAα5 selective negative allosteric modulator Basmisanil.21,22
In this article, we use these heterologous competition data to: (a) elucidate the true regional in vivo selectivity of [11C]Ro15-4513 for the GABAAα5 receptor, (b) assess the validity of the cerebellum and pons as reference tissues and (c) evaluate the merits of different analytical techniques for quantifying GABAAα5 receptor availability from a dynamic [11C]Ro15-4513 PET scan.
Materials and methods
Data set
Data were taken from a PET study commissioned by F. Hoffmann-La Roche (Basel, Switzerland), which was performed by Hammersmith Imanet (Hammersmith, London, UK). The study was approved by the London-Brent research ethics committee, by the UK Administration of Radioactive Substances Advisory Committee and conducted under ICH GCP guidelines. The study from which our dataset is drawn aimed to evaluate receptor occupancy, which is not reported here.
Ten healthy male volunteers, who had provided informed consent, underwent three [11C]Ro15-4513 PET scans, one at baseline and two, at 3 and 9 h, following the administration of one of four separate doses (2 × 15 mg, 2 × 60 mg, 3 × 130 mg, 3 × 1250 mg) of the α5-selective negative allosteric modulator Basmisanil. Unavailability of baseline scan data for one subject led to this subject being excluded from our analyses. [11C]Ro15-4513 was synthesised by N-methylation of the N-desmethyl derivative with [11C]iodomethane, 1 and was administered through an intravenous cannula in the dominant vein of the antecubital fossa (372 ± 5 MBq in 4.68 ± 2.90 ml).
Dynamic PET scans were acquired over 90 min using a Siemens ECAT EXACT HR + (CTI/Siemens, model 962; Knoxville, TN, USA) scanner, with 63 transaxial image planes covering an axial field of view of 15.5 cm. PET emission data were corrected for attenuation and scatter using a 10-min transmission scan and reconstructed using Fourier rebinning and 2D filtered backprojection with a 2.0 mm kernel Ramp filter, into 24 dynamic frames (1 × 30, 4 × 15, 4 × 60, 2 × 150, 10 × 300 and 3 × 600 s). The final reconstructed volume had voxel dimensions of 2.094 × 2.094 ×2.42 mm3. All subjects also underwent T1-weighted magnetic resonance imaging (MRI) with a Philips 1.5 T Gyroscan Intera scanner (Philips, Best, The Netherlands) to provide anatomical images to aid in region definition.
Each subject had a radial arterial cannula inserted to allow for measurement of the arterial blood radioactivity concentration. For the first 15 min, continuous sampling was employed. Discrete blood samples were also taken at 4, 6, 8, 10, 20, 35, 50, 65, 80 and 90 min to measure the total plasma radioactivity concentration, whole blood radioactivity concentration and the parent fraction in plasma. Plasma concentrations of Basmisanil were measured at the start and end of each scan.
Data analysis: [11C]Ro15-4513 dynamic scans
For analysis, we used the PET data analysis and kinetic modelling toolkit, MIAKAT™ (www.miakat.org 23 ) which also uses software from SPM5 (Wellcome Trust Centre for Neuroimaging) and FSL (FMRIB, University of Oxford) and is implemented in MATLAB® (The Mathworks, Natick, MA, USA).
The brain was initially extracted from the T1-weighted MR image. Frame-by-frame motion correction of the dynamic PET data was performed using mutual information co-registration of the individual frames to a reference frame (frame 16). An average motion-corrected PET image was generated and used for co-registration with the extracted T1-weighted MR brain image. The CIC neuroanatomical atlas 24 was non-linearly registered to the individual’s extracted brain, via non-linear registration of the T1 anatomical images, to generate a personalised set of anatomically parcellated regions. Finally, regional tissue time-activity curves (TACs) were generated from this parcellation for a set of regions of interest (ROI) with varying signal strengths and GABAAα5 density; insular cortex, anterior cingulate, cingulate cortex, occipital lobe, temporal lobe, parietal lobe, frontal lobe, parahippocampal gyrus, cerebellum, nucleus accumbens, hippocampus, amygdala, caudate, putamen, thalamus, midbrain, medulla, pons.
The total plasma radioactivity was estimated by multiplying the whole blood radioactivity time course by a sigmoid model (equation (1)) that had been fitted to the discrete plasma:blood (POB) ratio. The parent plasma arterial input function was then generated by multiplying these data with a continuous estimate of the parent fraction. The parent fraction data were fit to the same sigmoid equation (1).

One (1TCM) and two (2TCM) tissue compartment plasma input models were fitted to the regional PET time activity data, with a fitted blood volume term, to identify an appropriate kinetic model and to subsequently derive estimates of VT for each ROI. All tissue and input function measurements were corrected for radioactive decay.
Data analysis: [11C]Ro15-4513 specific binding and selectivity
VT values obtained from the 2TCM were analysed, across all subjects and doses for the 18 ROIs, using a single-site competition model (see equation (2)).

Subsequently, a regression analysis of the regional

Having estimated

Evaluation of [11C]Ro15-4513 analysis approaches
Four analysis approaches, which have been previously proposed for the analysis of [11C]Ro15-4513, were investigated in the context of the gold standard regional GABAAα5 binding data (
Method I (2TCM – VT)
VT was derived from the 2TCM. In more detail, the time-activity curves were fitted by a convolution of the arterial plasma parent input function with an impulse response function comprising a sum of two exponentials, with a fitted blood volume (see equation (5)).


Method II (2TCM – VS)
VS, the volume of distribution of the second tissue compartment in the 2TCM, was estimated from the individual rate constants obtained from the 2TCM fit according to,

Method III (spectral analysis –
)
Previously, spectral partitioning of the [11C]Ro15-4513 kinetic components using spectral analysis
27
has been proposed as a method to estimate


Method IV (SRTM –
)

For each of the four analysis methods, the relationship between the outcome measure and the gold standard
Results
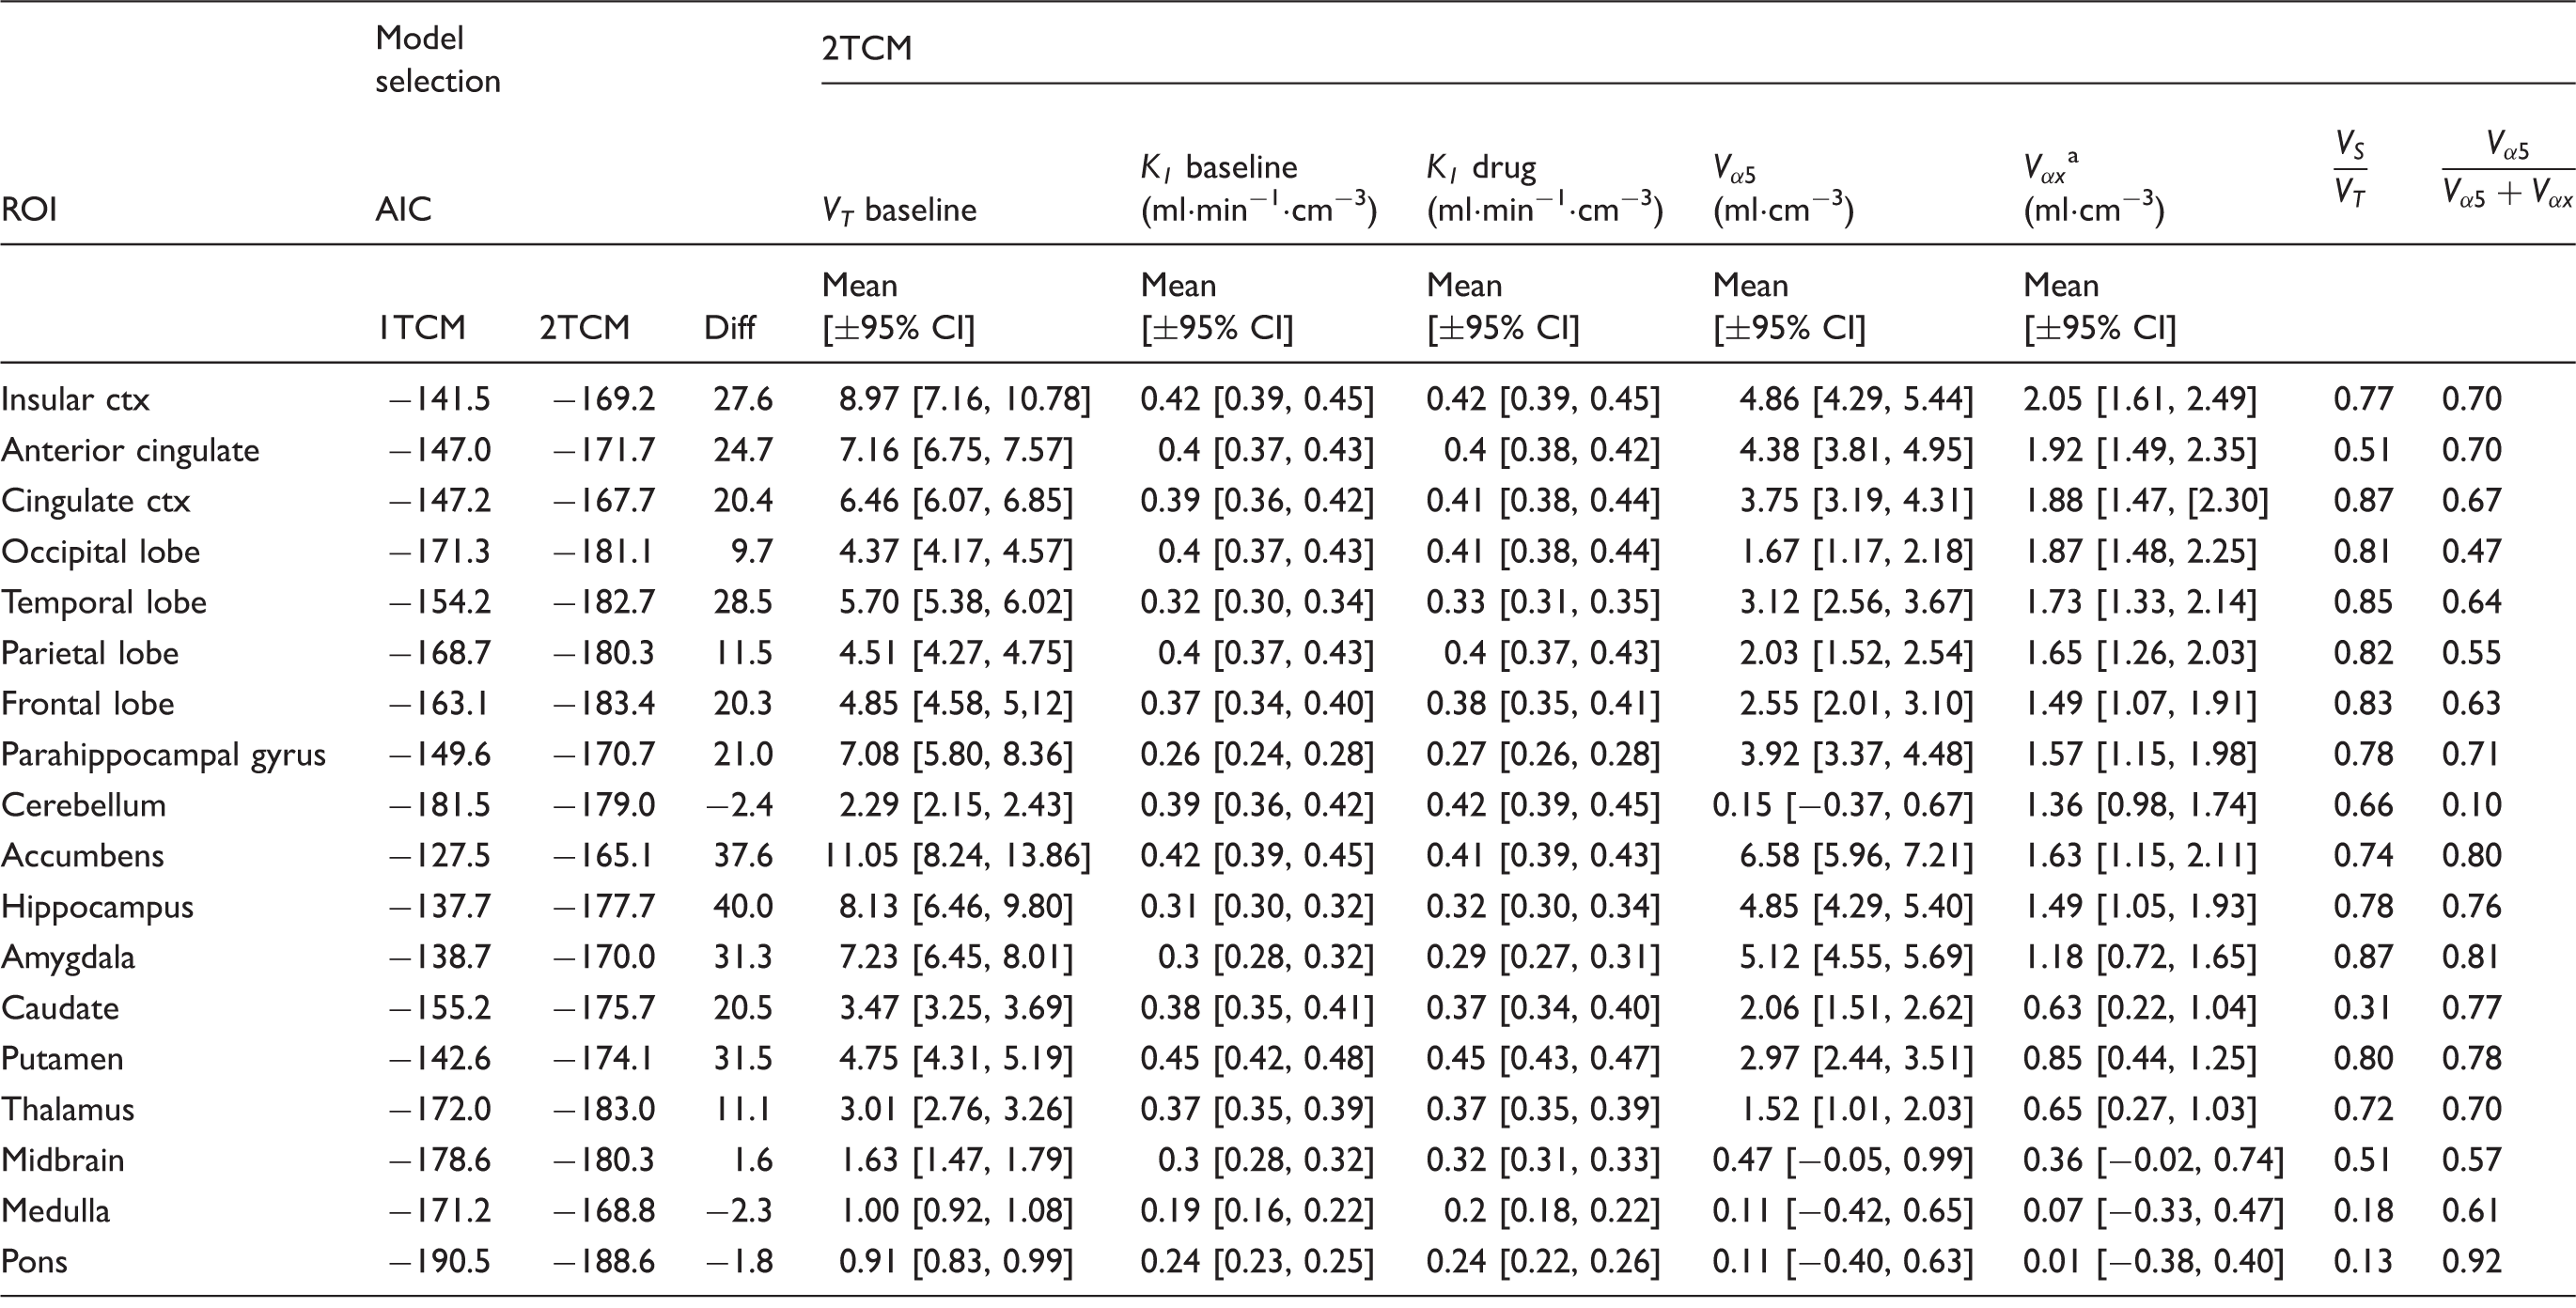
The results from fitting the 1TCM and 2TCM models to the 18 chosen ROIs are given in Table 1. In almost all regions, the 2TCM performed better according to the Akaike information criterion, with the four regions for which the two models performed equally well being the four with the lowest specific signal, as expected. The 2TCM was therefore chosen as the best model to describe the radioligand kinetics across the brain, and compartmental modelling parameters quoted henceforth are derived using 2TCM. K1 is high and relatively constant across the brain (∼0.4 ml cm3 min−1) consistent with a single pass extraction of at least 50%. No effect of drug was seen on K1 in any region (Student’s t-test: t < 0.55, p > 0.64 in all ROIs). Examples of 2TCM fits in the cerebellum, a region largely devoid of GABAAα5, and the temporal lobe, frontal lobe and hippocampus, where density is high, are given in Figure 1.
Representative regional [11C]Ro15-4513 time-activity curves (•) and two TCM fits (-) from a decay-corrected tracer alone scan for four regions of interest (hippocampus, temporal lobe, frontal lobe and cerebellum). Regional [11C]Ro15-4513 parameters derived from 2TCM and competition binding analysis. AIC: Akaike Information Criteria for model selection (smaller number indicates preferred model); VT: total distribution volume; K1: Delivery; Under the assumption that 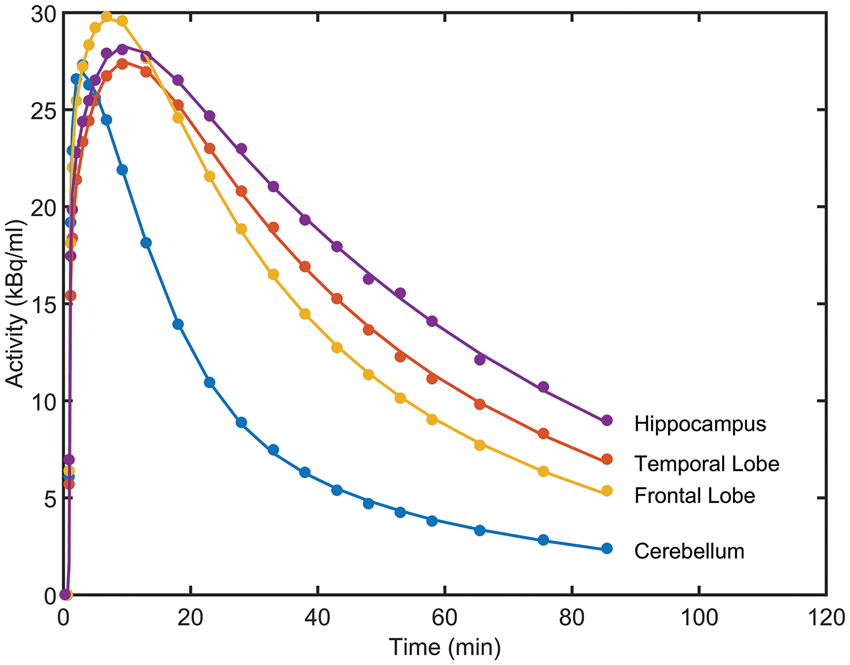
A competition binding model accounting for the selective modulator Basmisanil was fitted to all 18 ROIs. Examples of model fits from four representative regions are given in Figure 2. In each case, a good fit was obtained along with a corresponding estimate of Heterologous competition between [11C]Ro15-4513 and the GABAAα5 selective negative allosteric modulator Basmisanil (RG1162) in four regions of interest. (a) Cerebellum, (b) frontal lobe, (c) temporal lobe and (d) hippocampus. VT values from the 27 [11C]Ro15-4513 scans are plotted against the Basmisanil plasma concentration (•) along with model fits from the competition binding model given in equation (2) (-).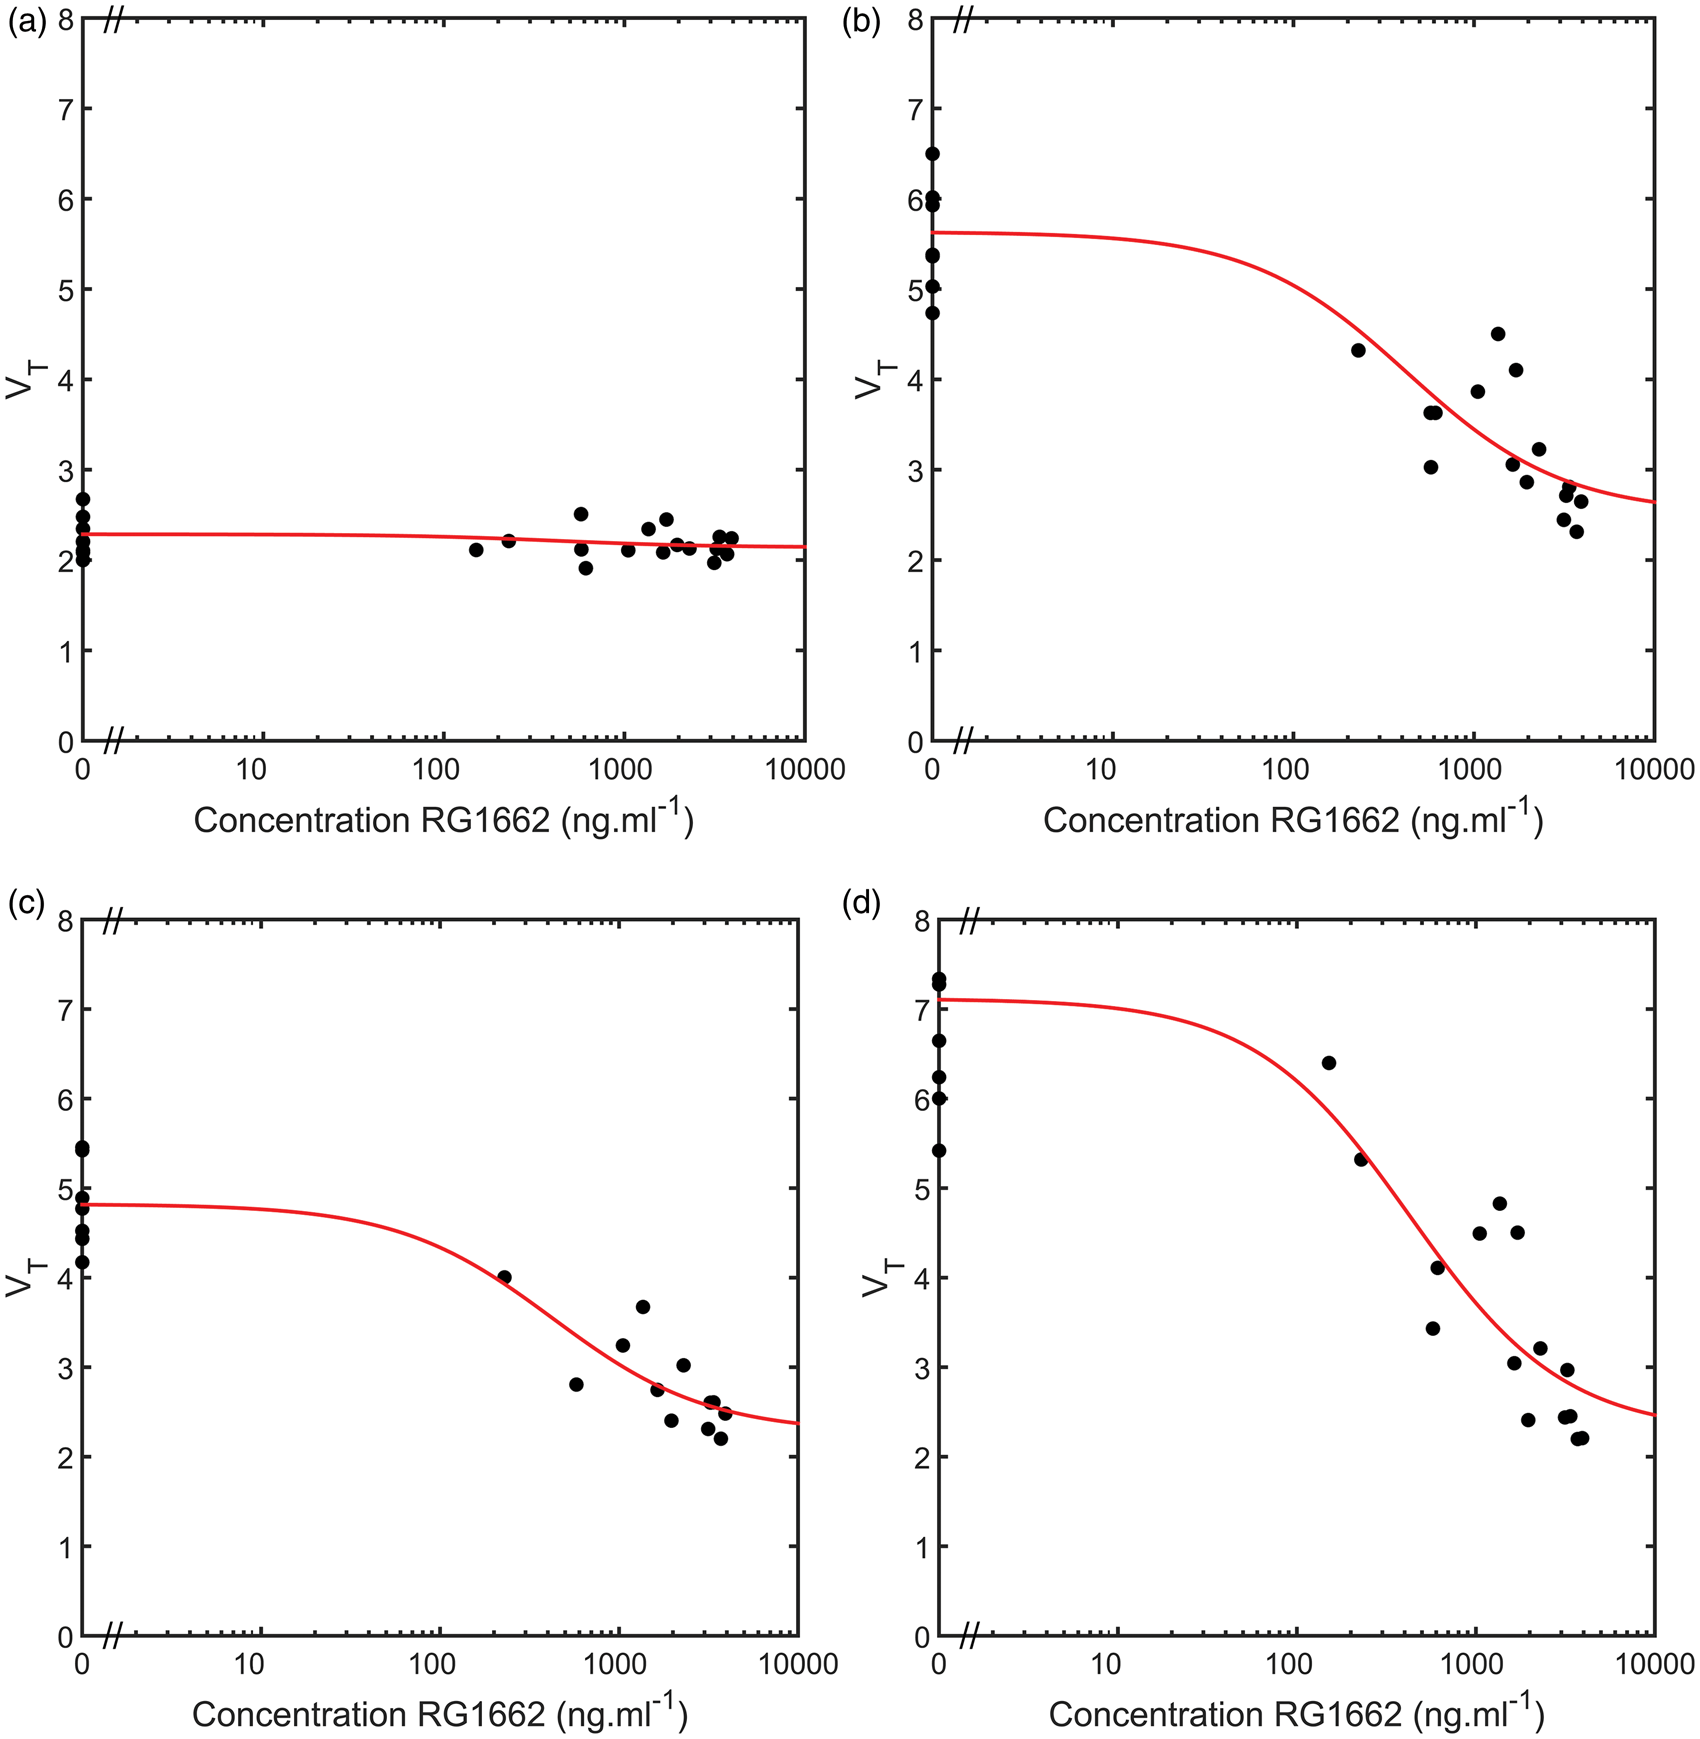
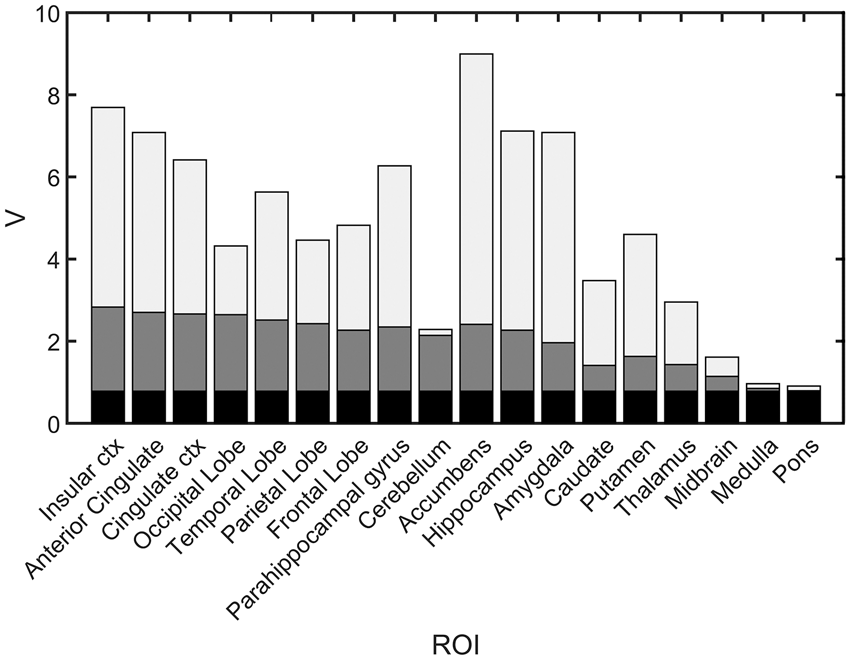
Optimisation of Optimisation of Regional in vivo selectivity of [11C]Ro15-4513 in humans. The partitioning of the total volume of distribution into non-displaceable (black), non-selective specific binding (dark grey) and GABAAα5 selective specific binding (light grey) are shown for 18 ROIs.
Parametric images of [11C]Ro15-4513 VT along with the specific Parametric images of [11C]Ro15-4513 in humans: (a) Total distribution volume (VT), (b) Percentage of specific binding which is 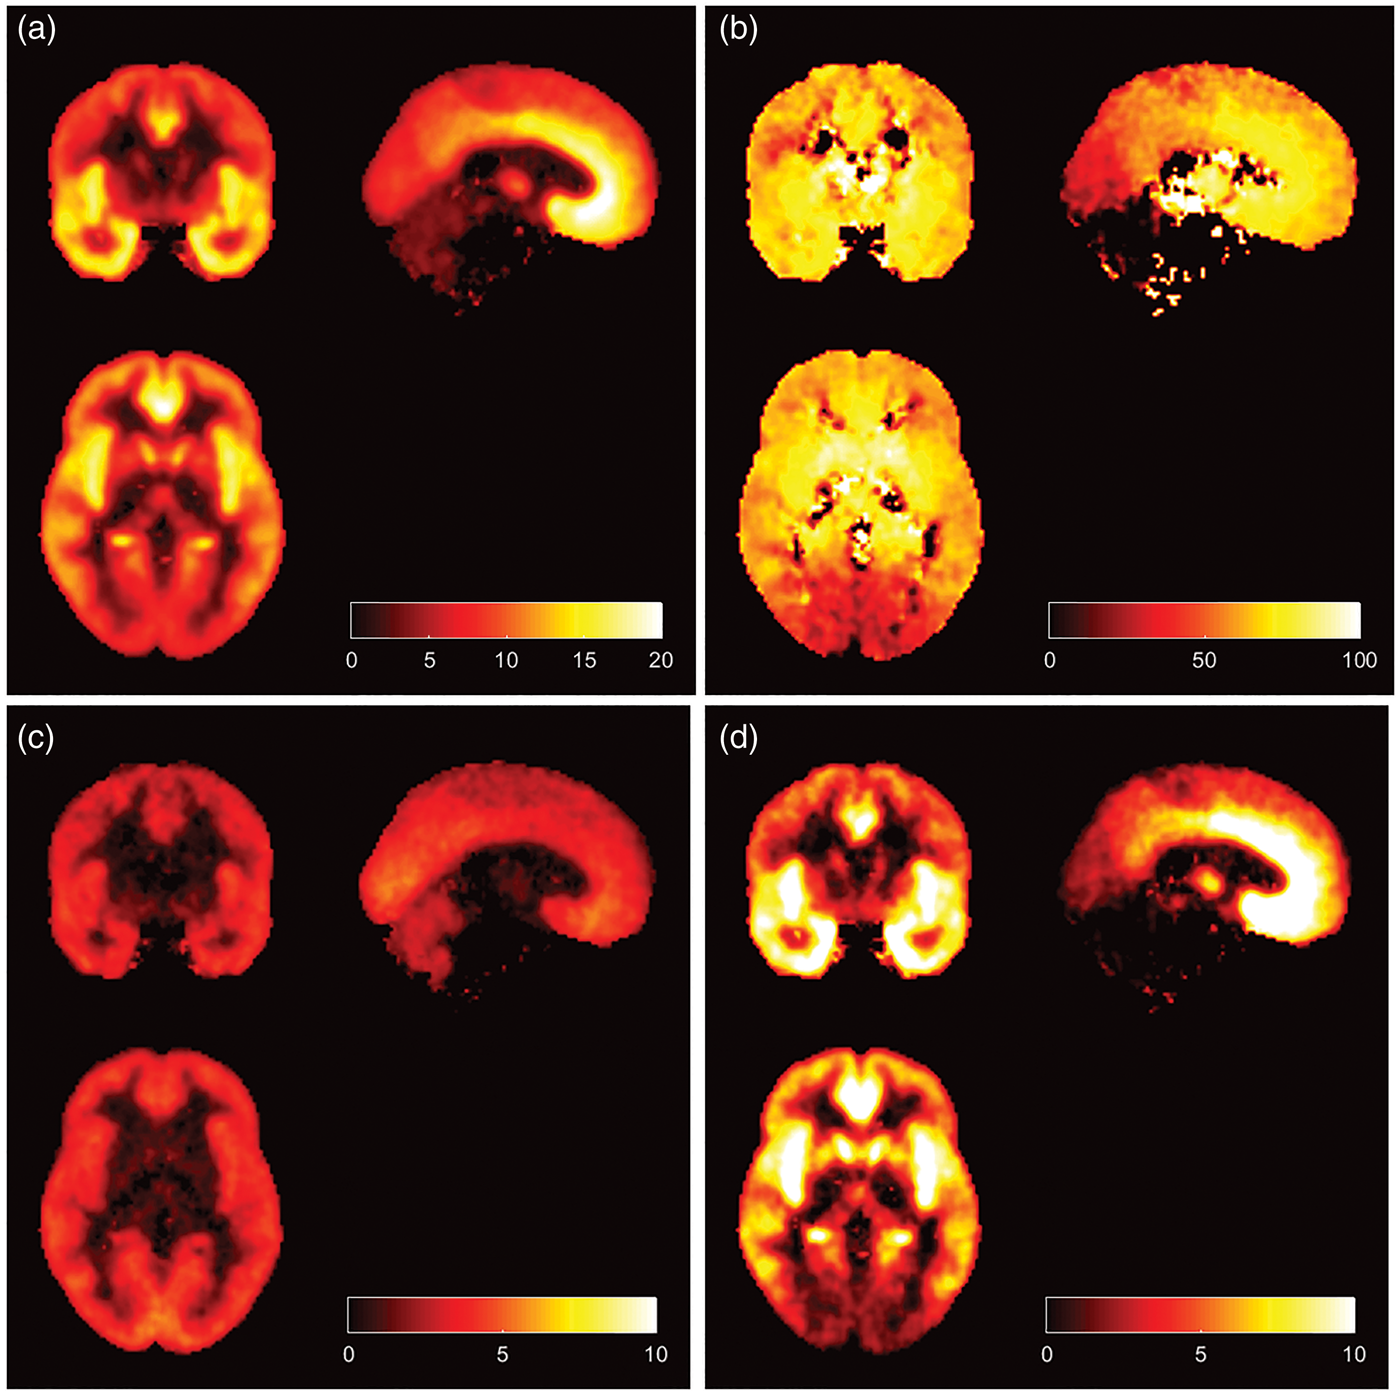
The results from the heterologous competition data then allowed for an assessment of the performance of four different analysis approaches that have been previously applied to [11C]Ro15-4513, in the absence of competition data, to estimate GABAAα5 binding. The four approaches considered involved the two tissue compartment model, spectral analysis and the simplified reference tissue model (see Figure 6). Total VT estimates from the 2TCM provided a good linear relationship with Performance of four analysis methods for the estimation of GABAAα5 binding with [11C]Ro15-4513. Model outcome measures plotted against the gold standard 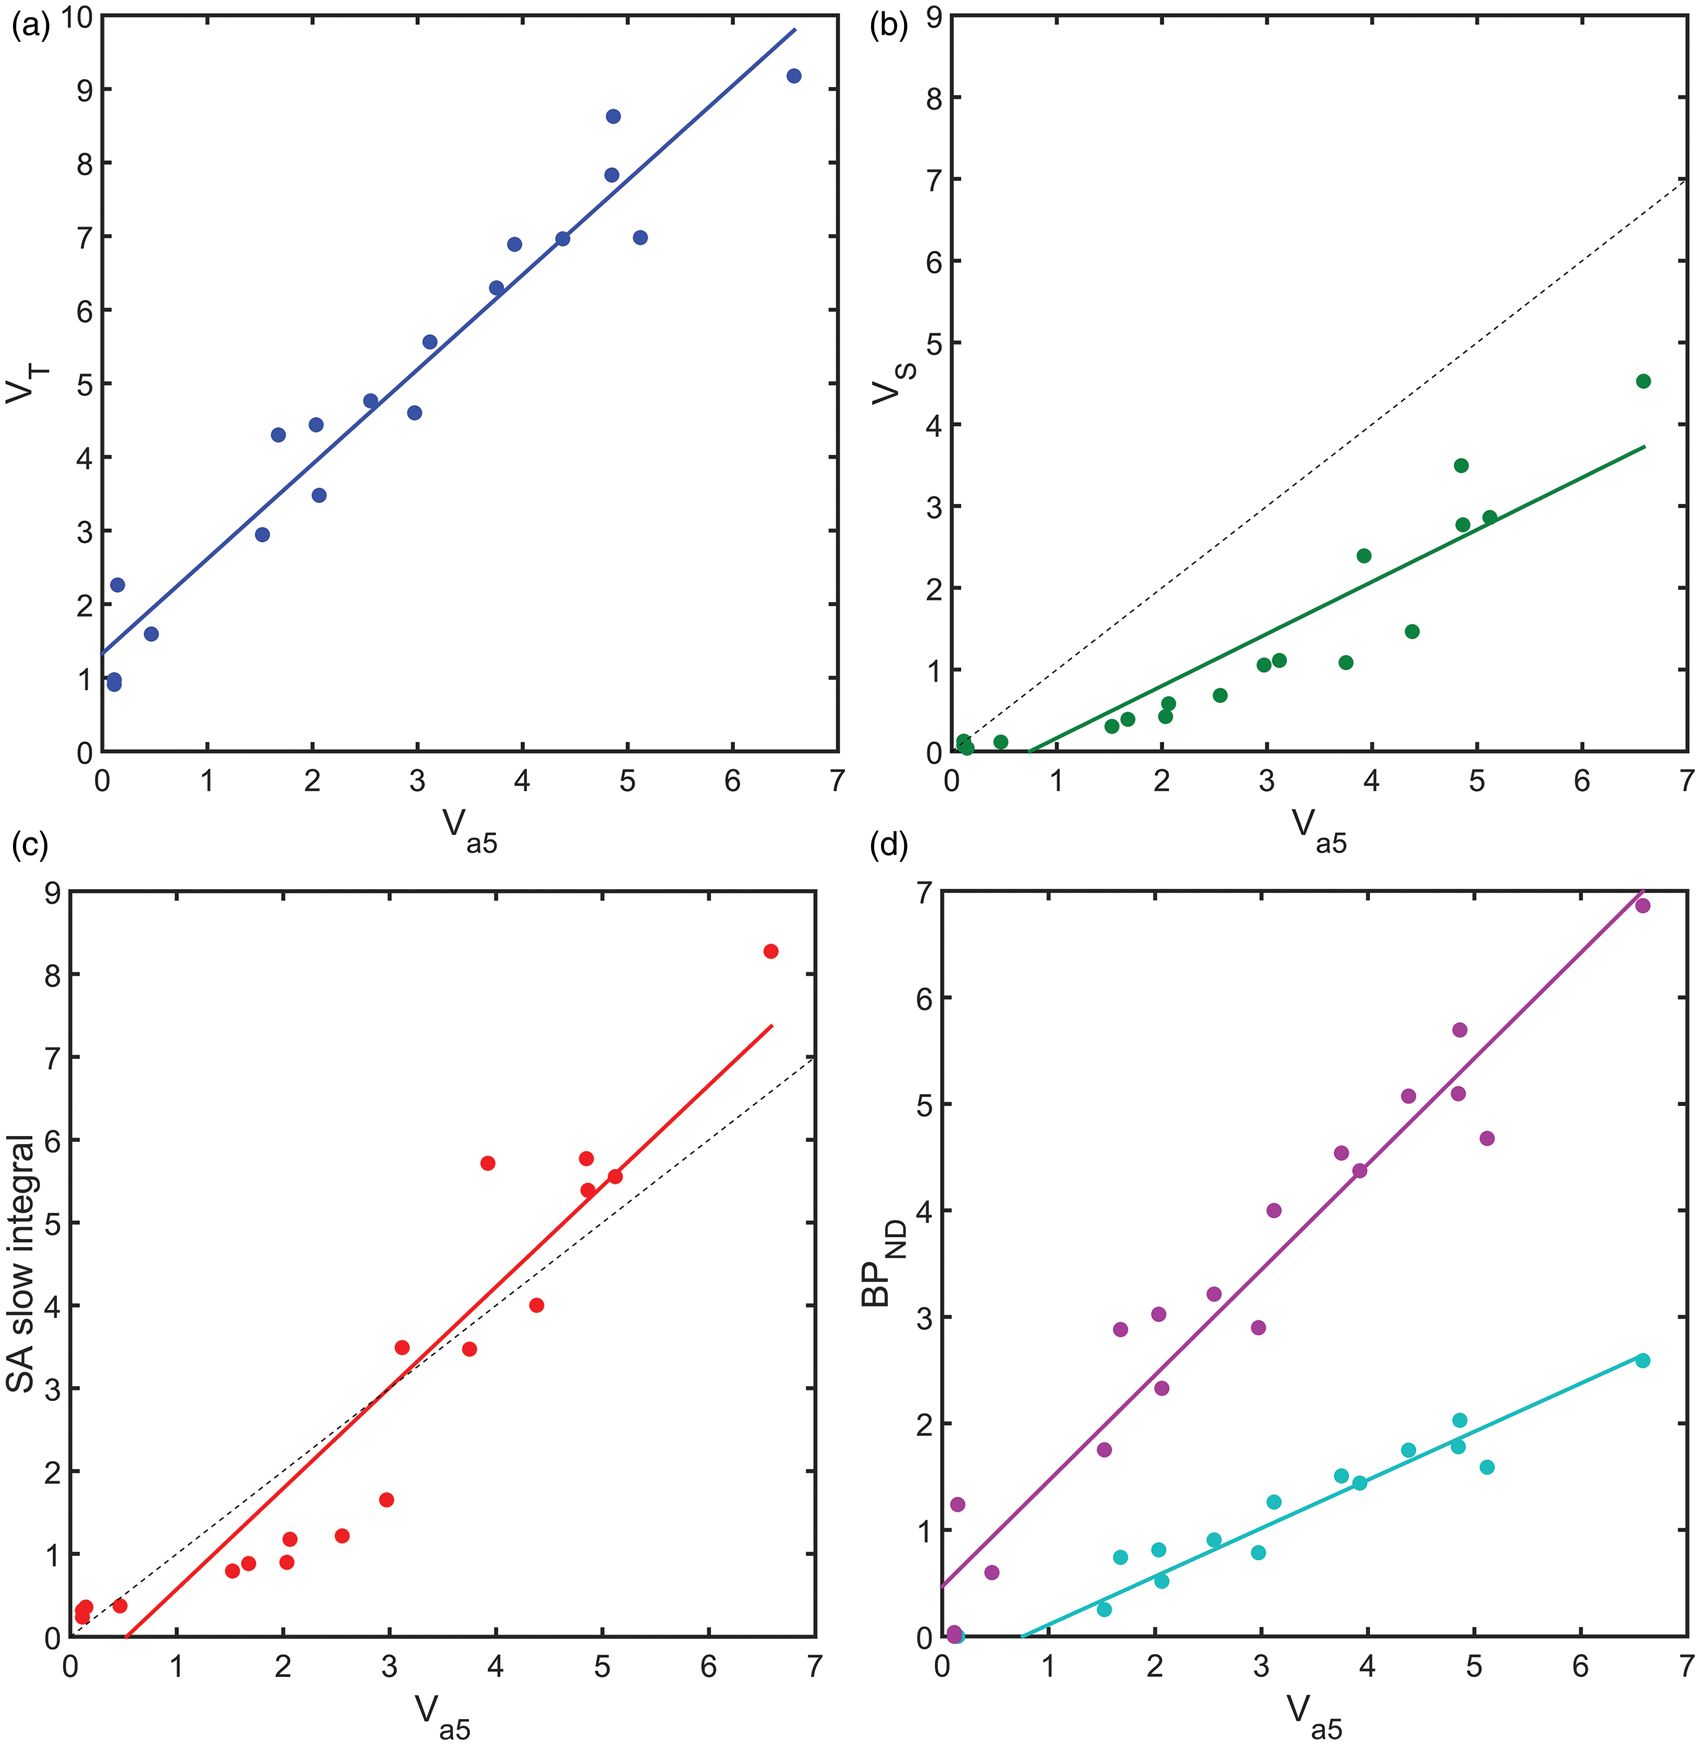
Discussion
A full characterisation of [11C]Ro15-4513 in humans using heterologous competition data has been presented that allows for the determination of the GABAAα5 specific binding signal, as well as an estimate of the remaining GABAA sub-type specific binding and non-displaceable signal across the brain. This provides important information to help with the interpretation of previous clinical studies employing [11C]Ro15-4513 PET in humans. Further, it provides gold standard data that permits the evaluation of alternative analysis strategies for [11C]Ro15-4513.
The human [11C]Ro15-4513 PET data used in our analysis included scans performed at baseline and following the administration of an α5-selective negative allosteric modulator (RG1662). Using competition data obtained across a range of different doses allowed us to isolate the specific binding component of the total volume of distribution that corresponds to GABAAα5 by applying an appropriate competition binding model. The remaining portion of the VT was partitioned into the non-displaceable and remaining GABAA subtype binding using [11C]flumazenil data obtained from the literature.
Our approach allowed careful validation of different approaches for quantification of GABAAα5 density, not possible before. Given that most studies using this radioligand will be undertaken in the absence of competitive blockade, it is important to understand the regional selectivity of [11C]Ro15-4513 and the limitations of different analysis approaches that attempt to quantify GABAAα5 binding.
The 2TCM was identified as the optimal tracer kinetic model to describe the kinetics of [11C]Ro15-4513 based on the Akaike information criteria. This is consistent with previous model identification analyses performed for this tracer.6,9,28 VT was greatest in the nucleus accumbens, anterior cingulate gyrus and amygdala, regions also found to have the greatest proportions of α5-specific signal contribution. Regions with relatively low α5-specific binding were found to be equally well fitted using a 1TCM model. Subcortical regions, such as the striatum, including the putamen and caudate nuclei, despite their relatively low total VT, display a relatively greater proportion of α5-specific signal as compared with the cortical structures. This proportion of α5-specific signal demonstrates good, but not complete, selectivity for the subtype, with an average of 66% of the specific signal across all measured regions, including low-signal regions such as the cerebellum.
Comparing the different analysis methods against the gold standard GABAAα5 data in this cohort of healthy human subjects showed that VT derived from 2TCM has a good linear relationship with GABAAα5 specific binding, consistent with GABAAα5 representing a significant portion of the specific binding in most regions considered although its use requires interpreting an outcome measure that contains a degree of non-selective binding. While inferences may be made regionally, there will not be any absolute certainty of the source of any change or difference in signal, from GABAAα5 or any other subtype.
VS, derived from the 2TCM, has a non-linear relationship with
The
Finally, the application of SRTM using the cerebellum or pons provides a linear relationship with the true GABAAα5 binding. For cortical regions, the cerebellum reference region with its increased statistics from a larger region and similar levels of off target non-selective binding may be most appropriate. In particular, given that without a homologous competition study, it has been necessary to make the assumption that
Overall, each of the four quantification approaches has their strengths and weaknesses. The overall estimations of VT and
Thus, the choice of method used in a clinical [11C]Ro15-4513 study should be considered carefully. The ideal situation would be to perform two scans, one with the tracer alone and the second in the presence of a blocking dose of a selective GABAAα5 drug such as Basmisanil; however, this is unlikely to be feasible routinely. If a single scan approach is employed with arterial blood data and one of the more exploratory methods (II and III) is used, then the VT from Method I should also always be presented. This would allow for a consensus analysis to determine whether all the results are consistent. If blood is not acquired and SRTM is used, then one should understand that the interpretation of the outcome measure would rely strongly on the credibility of the assumptions about the off target binding in the particular experimental paradigm under investigation.
In conclusion, we have fully characterised the in vivo selectivity of [11C]Ro15-4513 in humans using heterologous competition data. Overall, the tracer provides a good deal of selectivity for GABAAα5, with α5 representing at least 60–70% of the specific binding in most regions. Nevertheless, the presence of off-target non-selective binding to other GABAA subtypes means that the choice of analysis method and the interpretation of outcome measures must be considered carefully in the context of the experimental design of each [11C]Ro15-4513 clinical PET study.
Footnotes
Funding
The author(s) received no financial support for the research, authorship, and/or publication of this article.
Acknowledgements
Our post hoc analyses makes use of a subset of data obtained from a research study commissioned by F. Hoffmann-La Roche, performed by Hammersmith Imanet (a division of GE Healthcare) and Hammersmith Medicines Research in 2010. The authors would like to thank the staff of both organisations (including Kerstin Heurling, Lisa Desmond, Alan Forster and David J Brooks) for their role in the design of the study and data acquisition. The authors would also like to thank Sian Lennon-Chrimes, Xavier Liogier d'Ardhuy, Stephane Nave, Darshna Shah, Andrew Thomas and Nicholas Seneca from F. Hoffmann-La Roche for their work on the design and contact of that study. Finally, we would also like to thank Ilan Rabiner for discussions around this project, and Dr Edilio Borroni for his support.
Declaration of conflicting interests
The author(s) declared the following potential conflicts of interest with respect to the research, authorship, and/or publication of this article: RG is a consultant for Abbvie, GlaxoSmithKline and UCB. JM received a travel grant from F Hoffmann-La Roche for the presentation of this work at a scientific meeting. RC is an employee of F Hoffmann-La Roche.
Authors’ contributions
JM contributed to analysis of data and drafted the article. RC contributed to interpretation of the data and revised the article. RG contributed to analysis and interpretation of data, and revised the article. All authors approved the manuscript.
References
Supplementary Material
Please find the following supplemental material available below.
For Open Access articles published under a Creative Commons License, all supplemental material carries the same license as the article it is associated with.
For non-Open Access articles published, all supplemental material carries a non-exclusive license, and permission requests for re-use of supplemental material or any part of supplemental material shall be sent directly to the copyright owner as specified in the copyright notice associated with the article.