
Abstract
It is unclear whether cerebral blood flow responses to hypoglycemia are altered in people with type 1 diabetes and impaired awareness of hypoglycemia. The aim of this study was to investigate the effect of hypoglycemia on both global and regional cerebral blood flow in type 1 diabetes patients with impaired awareness of hypoglycemia, type 1 diabetes patients with normal awareness of hypoglycemia and healthy controls (n = 7 per group). The subjects underwent a hyperinsulinemic euglycemic–hypoglycemic glucose clamp in a 3 T MR system. Global and regional changes in cerebral blood flow were determined by arterial spin labeling magnetic resonance imaging, at the end of both glycemic phases. Hypoglycemia generated typical symptoms in patients with type 1 diabetes and normal awareness of hypoglycemia and healthy controls, but not in patients with impaired awareness of hypoglycemia. Conversely, hypoglycemia increased global cerebral blood flow in patients with impaired awareness of hypoglycemia, which was not observed in the other two groups. Regionally, hypoglycemia caused a redistribution of cerebral blood flow towards the thalamus of both patients with normal awareness of hypoglycemia and healthy controls, consistent with activation of brain regions associated with the autonomic response to hypoglycemia. No such redistribution was found in the patients with impaired awareness of hypoglycemia. An increase in global cerebral blood flow may enhance nutrient supply to the brain, hence suppressing symptomatic awareness of hypoglycemia. Altogether these results suggest that changes in cerebral blood flow during hypoglycemia contribute to impaired awareness of hypoglycemia.
Introduction
Hypoglycemia is the major and most feared complication of insulin therapy in patients with type 1 diabetes (T1DM). These patients experience on average two hypoglycemic events per week and one severe, potentially hazardous event every year. 1 A drop in blood glucose levels induces a hierarchically organized counterregulatory response, including activation of the sympathetic nervous system and endocrine responses, aimed at quickly restoring euglycemia. However, in about 20%–30% of the patients with T1DM, hypoglycemic warning symptoms and counterregulatory hormone responses appear only at very low plasma glucose levels or do not appear at all, which is known as the clinical syndrome of impaired awareness of hypoglycemia (IAH).2,3 Patients with T1DM and IAH are at a several fold higher risk of severe hypoglycemia than patients with normal awareness of hypoglycemia (NAH).
IAH is thought to result from a habituation process to recurrent hypoglycemia. The exact underlying mechanism of this process is unclear, but most certainly involves cerebral adaptations, which may include alterations in cerebral blood flow (CBF). An increase in global CBF has been reported in healthy volunteers4,5 and in T1DM patients 6 at plasma glucose levels of 2.2 mmol/L or lower. This could be a neuroprotective response, as it may improve nutrient supply to the brain. 7 At milder hypoglycemic levels, CBF was not found to change,8,9 whereas one study reported a slight decrease in CBF in response to a glucose nadir of 3.0 mmol/L. 10 Remarkably, Boyle et al. 11 found that plasma glucose values of 2.5 mmol/L caused a non-statistically significant increase in CBF in T1DM patients at optimal glycemic control, whereas CBF remained unchanged in poorly controlled patients and non-diabetic subjects.
Besides global effects, hypoglycemia has also been reported to cause a redistribution in CBF. In healthy individuals, hypoglycemia has been found to increase CBF to the thalamus,10,12,13 hypothalamus 14 and prefrontal cortex, 10 changes that have been correlated to neuronal activation. 15 Interestingly, Mangia et al. 13 found a blunted hypoglycemia-induced increase in thalamic CBF in T1DM patients with IAH as compared to healthy controls, which suggests that the thalamus is involved in the coordination of the sympathetic response to hypoglycemia. However, hypoglycemia has also been reported to enhance rather than suppress thalamic CBF in a human model of IAH. 16
With arterial spin labeling (ASL) magnetic resonance imaging (MRI), it is possible to reliably quantify CBF in a non-invasive manner, which can be applied in hypoglycemia research. The aim of our study was to assess both global and regional CBF changes in response to hypoglycemia in T1DM patients with IAH, T1DM patients with NAH and healthy controls.
Materials and methods
Subjects
Subject characteristics.
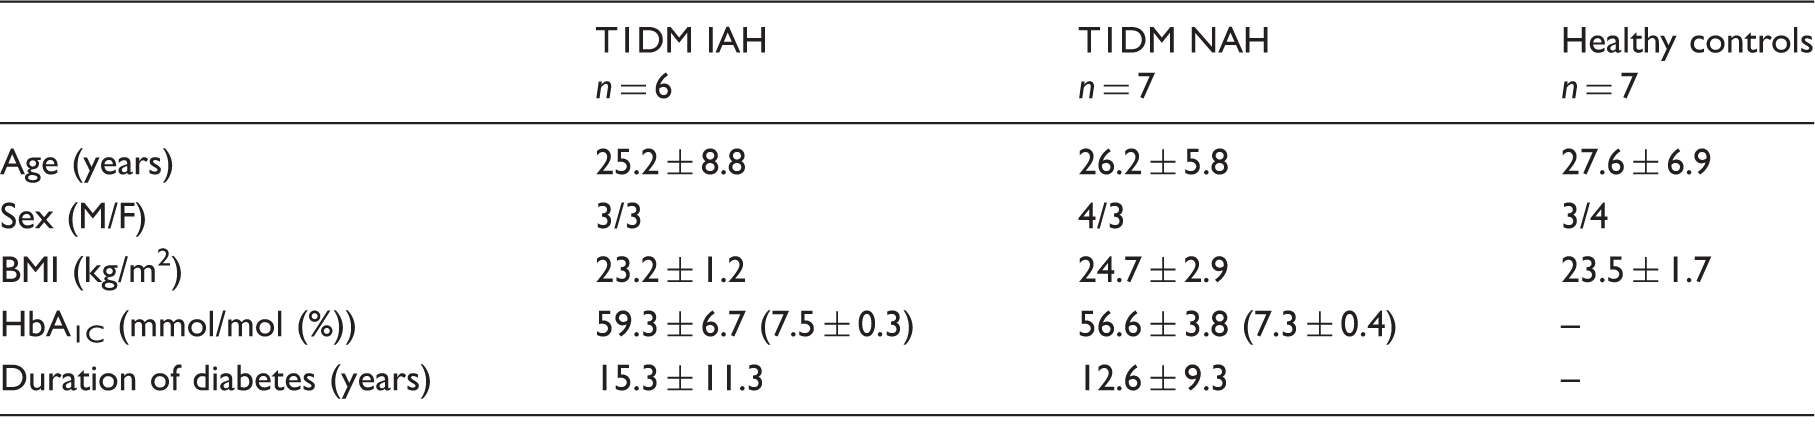
Data are presented as number or mean ± SD. F: female; M: male; BMI: body mass index; T1DM IAH: type 1 diabetes with impaired awareness of hypoglycaemia; T1DM NAH: type 1 diabetes with normal awareness of hypoglycaemia.
The state of awareness of the subjects with diabetes was determined at the time of recruitment according to the Dutch modified version of the Cox questionnaire, where scores of 0–1 out of 5 indicated NAH and scores ≥3 indicated IAH.17,18 Patients with T1DM were excluded from participation if they were poorly controlled (i.e., HbA1c exceeding 75 mmol/mol (9.0%)) or if there was evidence of micro- or macro-vascular complications, except for background retinopathy, that might alter the CBF or its response to hypoglycemia. Other exclusion criteria were contraindications to MR examination and a history of brain injury. The study was approved by and studied in accordance with the ethical standards of the institutional review board of the Radboud University Medical Center (Commissie Mensgebonden Onderzoek Arnhem-Nijmegen).
General experimental protocol
Subjects arrived at the MR facility in the morning after an overnight fast, having abstained from caffeine, alcohol and smoking for 24 h. Instructions to prevent hypoglycemia in the 24 h before the clamp were given to the subjects with T1DM. Experiments were to be rescheduled in cases of hypoglycemia in the 24 h before the clamp, but this did not occur in any of the subjects.
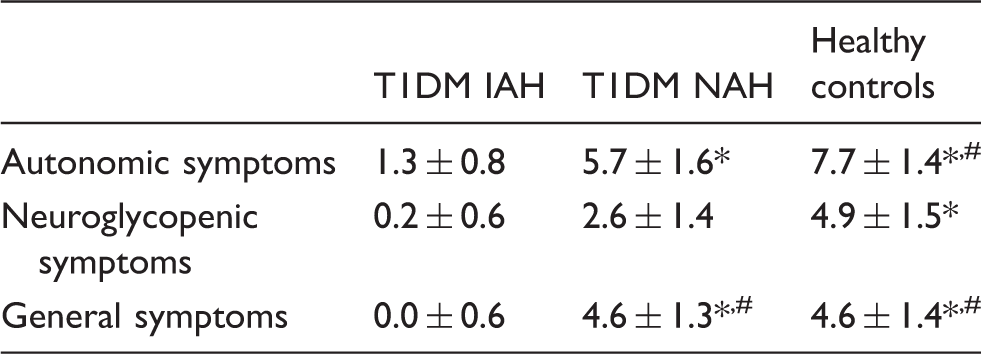
An intravenous catheter was placed in the antecubital vein for infusing insulin (Aspart insulin; Novo Nordisk, Bagsvaerd, Denmark) and glucose 20% (Baxter B.V., IL, USA). The brachial artery of the contralateral arm was cannulated under local anesthesia (Xylocaine 2%) for blood sampling. In cases of hyperglycemia in the subjects with T1DM, a small bolus of insulin was given immediately after cannulations. Subsequently, subjects were positioned in head-first supine position in the MR scanner, and a hyperinsulinemic (60 mU/m2/min) euglycemic–hypoglycemic glucose clamp was initiated. Arterial blood samples were collected every 5 min for immediate centrifugation and determination of plasma glucose levels (Biosen C-Line, EKF Diagnostics, Cardiff, UK). Plasma glucose levels were maintained at 5.0 mmol/L (30 min) and 2.8 mmol/L (45 min) during the euglycemic and hypoglycemic phase, respectively (Figure 1). Blood was also sampled immediately after cannulation for the determination of plasma insulin levels and at the end of both glycemic phases to determine plasma insulin, adrenaline and glucagon levels. Symptoms of hypoglycemia were quantified with a semiquantitative symptom questionnaire just prior to positioning the subject in the MR scanner and at the end of the hypoglycemic phase. Subjects were asked to score from 0 (none) to 6 (most severe) for each of 18 symptoms which included six autonomic symptoms, six neuroglycopenic symptoms, four general symptoms and two dummy symptoms. Questionnaires were not administered at the end of the euglycemic phase to avoid head movements that might interfere with data collection.
Schematic overview of the study protocol. ASL measurements were performed just prior to initiating the glucose clamp (i.e., at baseline (BL)), at the end of the euglycemic phase and at the end of the hypoglycemic phase. Hypoglycemic symptom scores (Symp) were acquired just prior to positioning the subject in the MR scanner and at the end of the hypoglycemic phase.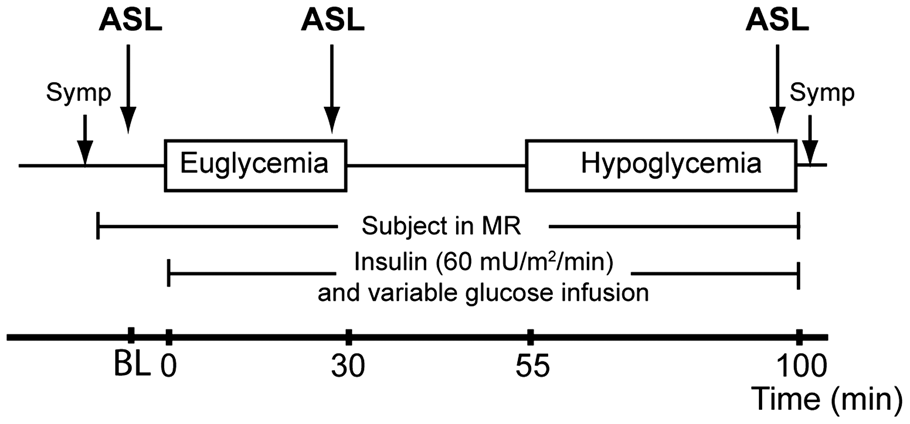
Laboratory analysis
Plasma insulin was assessed by an in-house radioimmunoassay (RIA). 19 Plasma glucagon was measured by RIA with a commercially available kit (Eurodiagnostica, Malmö, Sweden). Plasma adrenaline was measured by high-performance liquid chromatography combined with fluorometric detection. 20
Magnetic resonance imaging
The MR measurements were performed on a 3T MR scanner (TIM Magnetom Trio, Siemens, Erlangen) using a body coil for excitation and a 12-channel receive-only head coil. First, a 3D high-resolution structural image was acquired using a T1-weighted magnetization prepared rapid acquisition with gradient-echo (MPRAGE) sequence with a field of view (FOV) of 256 × 256 mm2 and 1 mm 3 isotropic voxels.
This study was an explorative part of an extensive study protocol that included 1H-MR spectroscopy 21 and ASL measurements. Perfusion images were obtained at three time points: just prior to initiating the glucose clamp (baseline), at the end of the euglycemic phase and at the end of the hypoglycemic phase (Figure 1). Before each perfusion measurement, a low-resolution 3D time of flight angiogram was performed to detect the brain-feeding internal carotid and vertebral arteries.
The CBF-weighted images were acquired with a pseudo-continuous ASL MRI (pCASL) research sequence. A 17-mm thick labeling plane was placed perpendicular to the brain-feeding arteries, between 2.0 and 3.5 cm below the cerebellum. Labeling duration was 1.8 s, and the post-labeling delay was set to 1.8 s. The imaging FOV was aligned with the anterior commissure—posterior commissure line. A 3D gradient and spin-echo (GRASE) readout was used (FOV: 230 × 173 mm2, 26 slices of 4.5-mm thickness, in-plane resolution: 3.6 × 3.6 mm2, interpolated to 1.8 × 1.8 mm2). A partial-Fourier factor of 6/8 was used in z-direction (inferior-to-superior direction) and two z-segments were acquired. Echo and repetition time (TE and TR) were 30.88 ms and 4.8 s, respectively. The total scan duration was 5.1 min in which 16 pairs of label and control images were acquired. Scans were acquired with two hyperbolic secant pulses for background suppression.
Additionally, for CBF quantification and for later distortion correction, two reference images without spin labeling were obtained after each ASL series. These images were acquired with the same sequence as the control images, but without background suppression and with a TR of 7 s. For the second measurement, in-plane phase-encoding direction was reversed.
Processing of perfusion images
Image analysis was performed with the FSL (FMRIB Software Library) software package. 22 ASL and reference images were motion-corrected via a six-parameter rigid-body transformation using MCFLIRT. 23 Label and control images were subtracted pairwise, and each series was averaged to generate one perfusion-weighted image. A susceptibility-induced off-resonance field was estimated from the two reference images with opposed phase-encoding directions.24,25 This off-resonance field-map was used to correct for susceptibility distortions with the FSL function TOPUP. 26 A quantitative value for CBF was estimated voxel-wise using the equation and parameters described in Alsop et al. 27 Global CBF values were obtained by averaging the CBF in gray matter. The resulting CBF maps were co-registered with the subject’s structural image. Furthermore, all structural images were linearly registered to the Montreal Neurological Institute (MNI) template MNI152 28 using a 12 degrees of freedom affine transformation (FLIRT) and additionally a non-linear registration (FNIRT). 23 To analyze the redistribution of regional CBF, each CBF map was resampled to the MNI152 template, normalized to its global gray matter mean and smoothed with a Gaussian filter of 6-mm full width at half maximum. A mask of the thalamus, implemented in FSL, was used to quantify regional CBF in the thalamus.
Statistical analysis
Group analyses on global CBF were performed in MNI152 space. The difference in global CBF between euglycemia and hypoglycemia within groups was calculated and expressed relative to euglycemia and compared with a two-sided Student’s t tests. Between group differences were assessed with a one-way analysis of variance (ANOVA) and Bonferroni multiple comparison test (IBM SPSS 20). To assess hypoglycemia-induced changes in regional CBF in each group, voxel-wise statistical analysis with cluster significance correction was performed in FMRI Expert Analysis Tool 29 (FEAT, Version 6.0). Average plasma glucose levels, counterregulatory hormone responses and symptom scores were compared between groups using ANOVA with a Bonferroni post-hoc test and within groups using a two-sided Student’s t test. Data are expressed as mean ± standard error of the mean (SEM), unless otherwise indicated. A p value less than 0.05 was considered statistically significant.
Results
Mean (±SD) plasma glucose levels were similar in the three groups during both the euglycemic phase (5.0 ± 0.1, versus 5.0 ± 0.2 and 4.9 ± 0.2 mmol/L for T1DM and IAH, T1DM and NAH and healthy subjects, respectively) and the hypoglycemic phase (2.8 ± 0.1, versus 2.8 ± 0.0 and 2.8 ± 0.1 mmol/L). Insulin levels were comparable between the groups at baseline, and increased to a similar extent during the euglycemic and hypoglycemic phase (data not shown). As expected, hypoglycemia failed to induce hypoglycemic symptoms, neither autonomic nor neuroglycopenic, in subjects with T1DM and IAH. In subjects with T1DM and NAH and in healthy controls, symptom scores increased significantly in response to hypoglycemia (Table 2). Glucagon levels increased in response to hypoglycemia in healthy subjects, but did not change in either of the two patient groups (Figure 2(a)). Adrenaline levels increased in response to hypoglycemia in healthy subjects by 2.7 ± 0.5 nmol/L (p < 0.01 versus euglycemia), by 1.8 ± 0.5 nmol/L in subjects with T1DM and NAH (p < 0.05) and by 1.1 ± 0.8 nmol/L in subjects with T1DM and IAH (p < 0.05) (Figure 2(b)).
Hypoglycemia-induced changes in glucagon (a) and adrenaline (b). Glucagon and adrenaline levels were assessed at the end of the euglycemic (open bars) and hypoglycemic (gray bars) phase. Means (with SEM) as well as individual values (dots) are depicted. *p < 0.05 for euglycemia versus hypoglycemia. Change in hypoglycemic symptom score. Difference between scores just before the euglycemic clamp and after 45 min of hypoglycemia. *p < 0.05 for baseline versus hypoglycemia and #p < 0.05 versus T1DM IAH. T1DM IAH: type 1 diabetes with impaired awareness of hypoglycaemia; T1DM NAH: type 1 diabetes with normal awareness of hypoglycemia.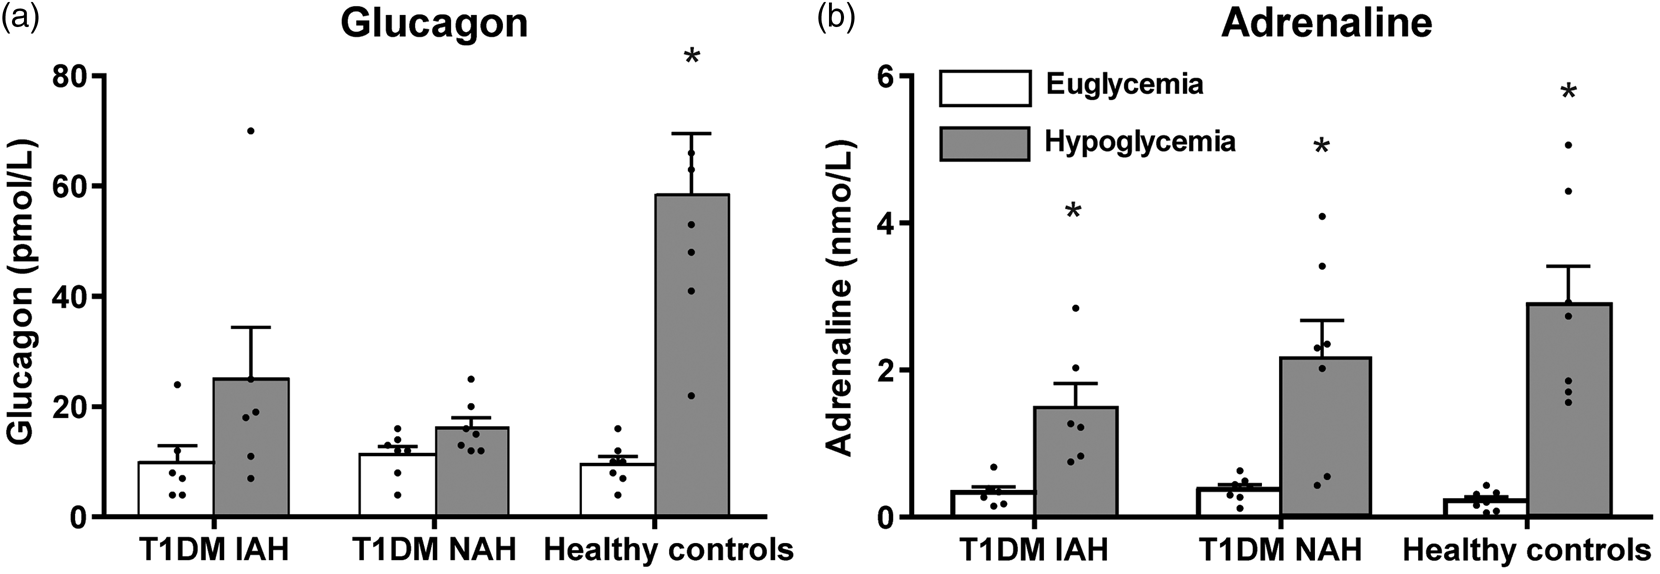
Global CBF
The quality of the perfusion maps was sufficient to include all subjects and time points in the analysis. There was no change in global CBF between baseline and the end of the euglycemic phase in any of the groups (0 ± 2%, −2 ± 1% and −1 ± 3% in T1DM and IAH, T1DM and NAH and healthy controls, respectively), which excludes an effect of insulin on global CBF. In response to hypoglycemia, global CBF increased in subjects with T1DM and IAH by 8 ± 3% (p < 0.05 versus euglycemia), tended to increase slightly in subjects with T1DM and NAH ( +5 ± 2%, p = 0.08), but did not change in healthy controls (−2 ± 2%, p = 0.70, p < 0.05 versus T1DM and IAH) (Figure 3).
Hypoglycemia-induced changes in global CBF (%). Mean (with SEM) change as well as individual values (dots) are depicted. *p < 0.05 for hypoglycemia versus euglycemia and #p < 0.05 versus healthy controls.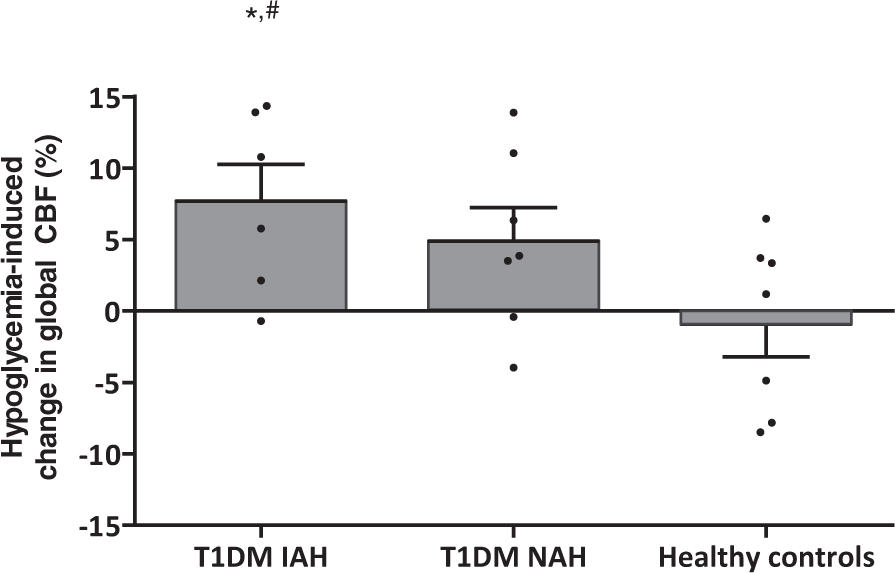
Regional CBF
Hypoglycemia altered the regional distribution of CBF in all three groups, but to a different extent (Figures 4 and 5). In healthy subjects and patients with T1DM and NAH, hypoglycemia increased regional CBF in the left and right thalamic area by 22 ± 4% (p < 0.01) and 14 ± 4% (p < 0.05), respectively (p = 0.6 for between group differences). No such increase in thalamic CBF was observed in subjects with T1DM and IAH. In subjects with T1DM and NAH, there was further redistribution of regional CBF during hypoglycemia with a relative increase in the bi-lateral frontal lobes and a relative decrease in CBF in the right occipital lobe and temporal lobe, and in the right insular cortices. In subjects with T1DM and IAH, regional CBF only decreased in the left lateral occipital lobe.
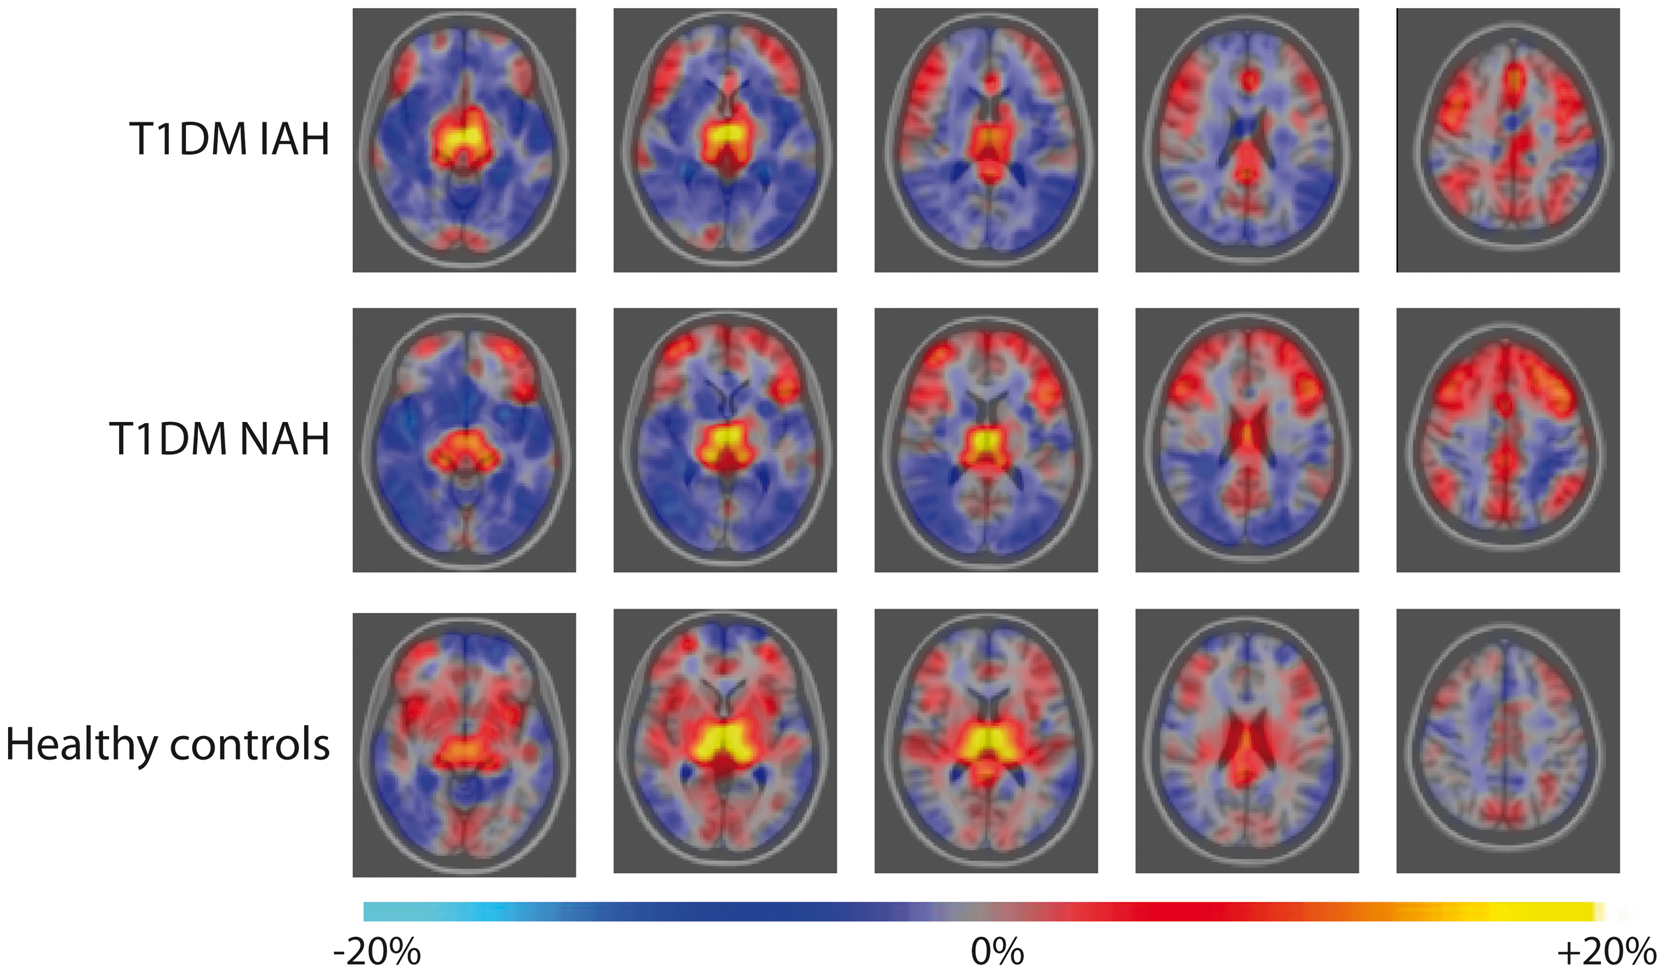
Redistribution of CBF normalized to its global gray matter mean in response to hypoglycemia for T1DM subjects with IAH (top row), T1DM subjects with NAH (middle row) and healthy controls (bottom row). Colors represent z-scores of hypoglycemia-induced significant changes in regional CBF, superimposed on the transverse view of the MNI-152 atlas (from left to right column: z = −8 mm, 2 mm, 12 mm, 22 mm, 42 mm in MNI-152 coordinate space) and indicate a significant increase (red to yellow) or decrease (dark to light blue) in relative regional CBF in hypoglycemia versus euglycemia. Mean quantitative redistribution of CBF in response to hypoglycemia for T1DM subjects with IAH (top row), T1DM subjects with NAH (middle row) and healthy controls (bottom row). Colors represent mean changes in regional CBF, superimposed on the transverse view of the MNI-152 atlas (from left to right column: z = −8 mm, 2 mm, 12 mm, 22 mm and 42 mm in MNI-152 coordinate space) and indicate an increase (red to yellow) or decrease (dark to light blue) in relative regional CBF in hypoglycemia versus euglycemia. Note that statistical significance was only reached for the increase in regional CBF in the left and right thalamic area in healthy controls and T1DM NAH, the redistribution towards the bi-lateral frontal lobes in T1DM NAH and the relative decreases in CBF in the right occipital lobe, temporal lobe and the right insular cortices in T1DM NAH and in the left lateral occipital lobe in T1DM IAH (as depicted in Figure 4).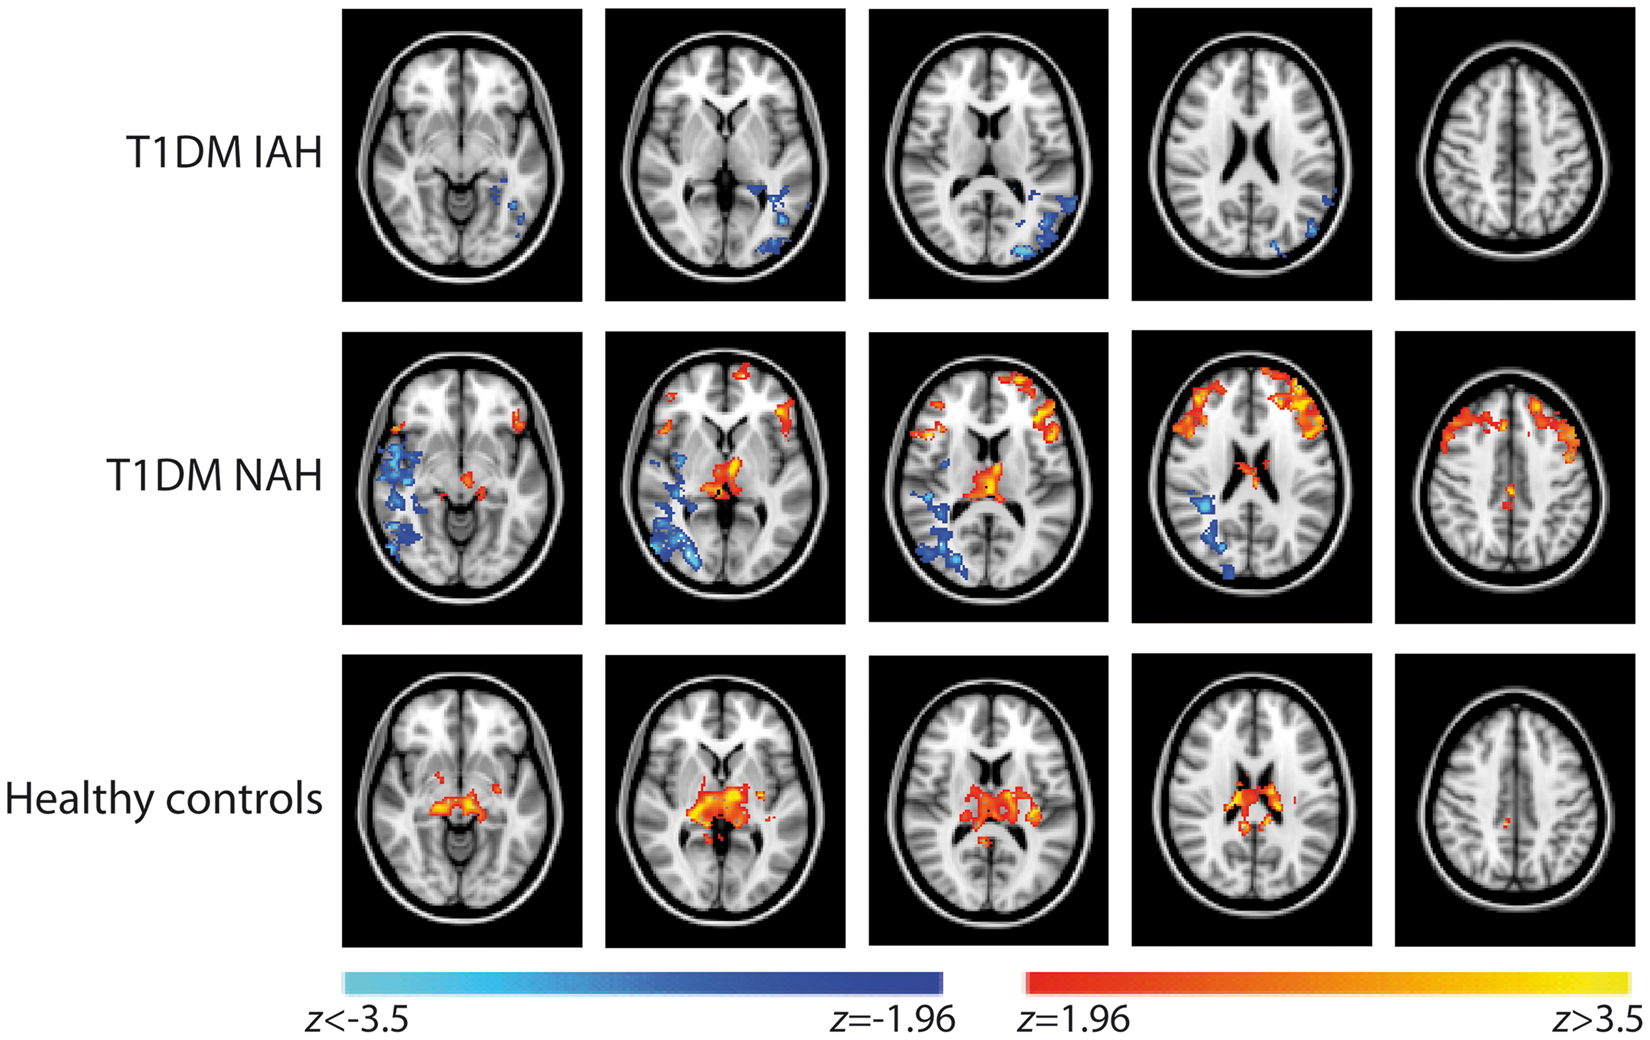
Discussion
Our study suggests that changes in CBF are involved in the pathogenesis of IAH. This conclusion is based on the finding of this study that hypoglycemia induced a significant increase in global CBF in T1DM patients with IAH, but not in the two control groups. Such an increase may enhance the supply of energy nutrients (e.g., glucose) to the brain, which could suppress the brain’s ability to detect a fall in metabolism required to induce hypoglycemic symptoms. This is in accordance with the blunted redistribution of CBF towards the thalamus in response to hypoglycemia in patients with T1DM and IAH and consistent with an attenuated activation of brain regions associated with the autonomic response to hypoglycemia.
Earlier studies among healthy subjects showed increases in global CBF in response to decrements in plasma glucose levels below 2.2 mmol/L,4–6 but not in response to milder forms of hypoglycemia.8,9 Accordingly, the glucose nadir of 2.8 mmol/L that we obtained did not elicit alterations in global CBF in the healthy controls. Our finding that global CBF increased in patients with T1DM and IAH in response to this relatively mild form of hypoglycemia is novel.
With regard to regional CBF, the hypoglycemia-induced increase in thalamic CBF in patients with T1DM and NAH and in healthy volunteers is in line with earlier reports,10,12,13,16 and probably reflects activation of brain regions associated with autonomic responses to hypoglycemia. This would explain the absence of an increase in regional CBF in T1DM patients with IAH, as observed in our study, and as mentioned before. 13 In contrast, Arbelaez et al. 16 reported enhanced rather than reduced thalamic CBF in healthy volunteers subjected to antecedent hypoglycemia, an accepted model for IAH. Obviously, these healthy volunteers differ greatly from T1DM patients with IAH with respect to the magnitude of prior hypoglycemic exposure, suggesting that adaptations in (regional) CBF occur late in the pathogenesis of IAH.
We posit that the increase in global CBF as observed in patients with T1DM and IAH is the result of an altered threshold, i.e., the increase in flow occurs at higher glucose values than normal, as an adaptation to recurrent hypoglycemia. The increase may serve as a neuroprotective response to prior hypoglycemia, as it enhances the supply of glucose and other energy nutrients to the brain. 7 In addition, the consequent maintenance of brain metabolism may impede or delay hypoglycemia sensing by the brain, and therefore suppresses activation of counterregulatory responses, including symptoms, as seen in patients with IAH. In subjects with T1DM and NAH, we saw a trend towards a small increase in global CBF in response to hypoglycemia. This does not refute the role of hypoglycemia, since these T1DM patients are not as hypoglycemia-naïve as people without diabetes, but it may indicate that changes in CBF are not the only factor required for the development of IAH.
In the subjects with T1DM and NAH, but not in healthy controls, we observed a clear redistribution of CBF with an increase in regional CBF to the frontal lobes during hypoglycemia. Since the frontal lobes are among the regions most vulnerable to the effect of hypoglycemia, 30 such an increase in CBF may be seen as an early adaptive response to protect that brain region from potential harmful effects of hypoglycemia.
A limitation of this explorative study is that acquisition of the perfusion images was limited to single time points at the end of both glycemic phases. Studies in healthy volunteers have suggested that hypoglycemia sequentially activates and deactivates different brain regions over time in a dynamic process. 31 We do not have such information about the temporal evolution of hypoglycemia-induced changes in CBF. The small sample size is another limitation, although the study population was quite homogenous in terms of gender, age, body mass index and disease duration. Strengths of our study are that we investigated global and regional changes in CBF in three groups of participants, which enabled us to differentiate between the impact of diabetes and IAH. Clamps were performed using arterial blood sampling, which ensures accuracy with respect to the glycemic conditions. Finally, an effective distortion correction strategy was applied to improve the accuracy of ASL imaging.
In conclusion, hypoglycemia increases global CBF in patients with T1DM and IAH, but not in patients with NAH and non-diabetic subjects. We posit this to be an adaptive response aimed at neuroprotection that enhances nutrient supply to the brain during hypoglycemia and therefore explains, at least in part, IAH. Analogously, the blunted hypoglycemia-induced redistribution of CBF without increased perfusion in the thalamus in subjects with T1DM and IAH reflects absence of activation of brain regions associated with the autonomic response to hypoglycemia. Together these results suggest that changes in CBF may contribute to the development of IAH.
Footnotes
Funding
The author(s) disclosed receipt of the following financial support for the research, authorship, and/or publication of this article: This work was supported by the Dutch Diabetes Research Foundation (grant number DFN 2012.00.1542) and the European Foundation for the Study of Diabetes.
Acknowledgments
We thank all the volunteers for their participation in this work. We are indebted to Karin Saini and Simone Hins-de Bree (research nurses, Radboud University Medical Center) for assistance during the glucose clamps, to Matthias Günther (Fraunhofer MEVIS, Institute for Medical Image Computing, Bremen) for providing the pCASL 3D-GRASE sequence and to Sjaak van Asten (Department of Radiology and Nuclear Medicine, Radboud University Medical Center) for his assistance in using the post-processing software.
Declaration of conflicting interests
The author(s) declared no potential conflicts of interest with respect to the research, authorship, and/or publication of this article.
Authors’ contributions
EW, HR, BdG and MvdG designed the study with input from CT and AH. EW and KB were responsible for collection and analysis of the MR data with input from FS and MvdG. FS optimized the pCASL sequence. HR recruited the patients and performed the glucose clamps. All authors discussed the results and implications and commented on the manuscript at all stages. All authors approved the final version of the manuscript. EW, KB, BdG and MvdG contributed equally to this work.