
Abstract
Measurements of drug occupancies using positron emission tomography (PET) can be biased if the radioligand concentration exceeds “tracer” levels. Negative bias would also arise in successive PET scans if clearance of the radioligand is slow, resulting in a carryover effect. We developed a method to (1) estimate the in vivo dissociation constant Kd of a radioligand from PET studies displaying a non-tracer carryover (NTCO) effect and (2) correct the NTCO bias in occupancy studies taking into account the plasma concentration of the radioligand and its in vivo Kd. This method was applied in a study of healthy human subjects with the histamine H3 receptor radioligand [11C]GSK189254 to measure the PK-occupancy relationship of the H3 antagonist PF-03654746. From three test/retest studies, [11C]GSK189254 Kd was estimated to be 9.5 ± 5.9 pM. Oral administration of 0.1 to 4 mg of PF-03654746 resulted in occupancy estimates of 71%–97% and 30%–93% at 3 and 24 h post-drug, respectively. NTCO correction adjusted the occupancy estimates by 0%–15%. Analysis of the relationship between corrected occupancies and PF-03654746 plasma levels indicated that PF-03654746 can fully occupy H3 binding sites (ROmax = 100%), and its IC50 was estimated to be 0.144 ± 0.010 ng/mL. The uncorrected IC50 was 26% higher.
Keywords
Introduction
Positron emission tomography (PET) studies are ideally performed using tracer doses of radioligand that occupy a negligible fraction of the targeted receptors, in order to obtain unbiased binding parameters and reduce the variability of the results. When the affinity of the radioligand for the target receptors is high or when the bioavailability of the radioligand is high, then only a very small mass of radioligand can be injected in order to achieve negligible occupancy. On the other hand, a sufficient amount of radioactivity should be injected in order to obtain low-noise images or time-activity curves (TACs) for analysis. These two constraints may not be compatible depending on the specific activity (SA) that can be achieved during the radiosynthesis, and a higher level of radioligand occupancy might be needed in these cases. Examples of radioligands which are or were routinely injected at non-tracer (NT) dose levels include the dopamine D2/D3 radioligands [11C]-(+)-PHNO1,2 and [11C]FLB 457. 3 These NT dose conditions lead to the underestimation of binding parameters such as the volume of distribution VT 4 or the binding potential BPND, 4 poorer test/retest reliability, increased inter-subject variability, or erroneous results derived of these parameters if the injected mass of radioligand is not consistent across studies or groups. Another phenomenon that can occur in the NT dose condition is the so called carryover (CO) effect, in which the results of a subsequent scan are influenced by the injected mass of a previous scan, if the two scans are performed close to each other in time, and the radioligand clearance from the plasma and/or organ of interest is slow, i.e., a non-negligible concentration of unlabeled radioligand from the first injection is still present by the time of the second injection. This leads to further underestimation and variability of the binding parameters in the second scan.
When PET studies are performed to study the in vivo properties of a drug in development, these combined non-tracer carryover (NTCO) effects on the PET parameters induce biases on the final estimated drug properties, such as errors in the plasma concentration needed to achieve 50% occupancy (IC50) or on the maximal amount of receptor occupancy (RO) that the drug can achieve (ROmax).
In this study, we present a method to correct for NTCO effects. This involves (1) estimation of the in vivo Kd of a radioligand from test–retest studies for radioligand exhibiting NTCO effects and (2) correction for the radioligand occupancy of the targeted receptor in drug occupancy studies. This method was applied to a human RO study with 6-[(3-cyclobutyl-2,3,4,5-tetrahydro-1H-3-benzazepin-7-yl)oxy]-N-[11C]methyl-3-pyridinecarboxamide hydrochloride ([11C]GSK189254), a histamine H3 receptor antagonist5,6 with high affinity in vivo in humans (11 pM) and slow clearance from the plasma in part due to slow metabolism. 7 These correction algorithms were used to determine the IC50 of the H3 antagonist study drug (1R,3R)-N-ethyl-3-fluoro-3-[3-fluoro-4-(pyrrolidin-1-ylmethyl)phenyl]cyclobutane-1-carboxamide (PF-03654746).8,9 Histamine H3 receptors are G-protein-coupled presynaptic auto-receptors that regulate cyclic AMP and inhibits the release of histamine, 10 thus antagonists such as PF-03654746 should increase synaptic histamine levels. Histamine H3 receptors are also presynaptic hetero-receptors that modulate the release of other neurotransmitters. 11 Histamine H3 antagonists have been investigated as promising targets to treat metabolic disorders and neurological or psychiatric disorders. 12
Material and methods
Correction of occupancy estimates
Theory
Usually, PET studies are performed with the radiopharmaceutical administered at “tracer” mass dose, which is typically defined as less than 5%–10% occupancy of the target by the radioligand.
4
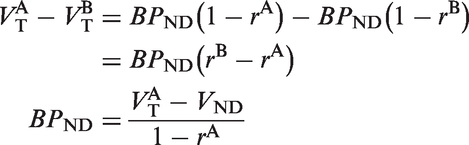
Target occupancy studies are performed with PET scans initiated after the administration of pharmacological doses of a competitive drug. Here, we consider cases where the PET studies are performed with significant mass dose, so that there is some RO by the radioligand. Suppose we make measurements of the binding potential BPND during several baseline or post-drug studies (A, B, C…), such that
Note that in the definition of

Suppose two studies, A and B, are performed with different drug (D) levels. Then

The apparent drug occupancy of study B with respect to study A (rA,B) is usually computed as follow

If study A is performed at tracer levels, i.e.,

Now, consider the case of study A with no drug, study B with drug, and ignore the effects of neurotransmitters, but not the effect of the radioligand mass dose. Then, the measured occupancy,

It is straightforward to see that equation (8) reduces to the form of equation (4) in the absence of a mass dose effect with the radioligand (


Solving for rB yields

Equation (11) is the formula for converting the apparent occupancy,
Occupancy plot
When binding potentials BPND cannot be estimated directly, due to the lack of a reference region, the occupancy plot
13
is often used, under the assumptions that the occupancy and non-displaceable volume of distribution VND are the same across all regions. For baseline and blocking studies (A and B), the occupancy plot is a plot of

And thus

And finally

Equation (13) shows that the occupancy plot under NT mass dose conditions can be used to estimate VND and
Please also note that equation (13) is a generalization of equation (6) in Cunningham et al.
13
: indeed, if the radioligand was injected at tracer mass dose, but drug was present during both scans A and B (with doses DA and DB, respectively) then
Implementation of the correction
In order to use equation (11) to estimate “true” drug occupancy, knowledge of

For studies B (second study) and C (third study), the ligand mass concentrations,


Determination of
from test–retest data
If no previous estimate of the in vivo


Thus, from the test–retest studies, calculate the ligand mass doses,
Study plan
The proposed method was used to quantify the occupancy at the histamine H3 receptor by PF-036547468,9 using the radioligand [11C]GSK189254. 6 Nine male subjects were included in this study (age = 35 ± 10 years, range = 21–48 years; body weight = 81 ± 6 kg, range = 73–90 kg). The study was conducted in compliance with the ethical principles originating in or derived from the Declaration of Helsinki and in compliance with all International Conference on Harmonization Good Clinical Practice guidelines. In addition, all local regulatory requirements were followed, in particular, those affording greater protection to the safety of trial participants. These studies were performed under protocols approved by the Yale School of Medicine Human Investigation Committee, the Yale-New Haven Hospital Radiation Safety Committee, and the Yale University Radiation Safety Committee. Subjects were recruited by public advertisement. Written informed consent was obtained from all participants after full explanation of study procedures.
A total of 24 scans were performed in this study. Three subjects participated in the test–retest study, and six subjects participated in the drug occupancy study. For the test–retest study, subjects were scanned twice with [11C]GSK189254 on the same day, 3.4 ± 0.1 h apart. For the occupancy study, subjects were scanned three times with [11C]GSK189254: two times on the same day, 5.4 ± 0.12 h apart, and one time on the next day, 25.9 ± 0.8 h after the first scan. The study drug PF-03654746 (0.1, 0.25, 0.5 (two subjects), 1.5, or 4 mg) was administered immediately after the baseline scan, and the second and third PET scans were performed at ∼3 h and ∼24 h post-dosing.
Radiochemistry
[11C]GSK189254 was radiolabeled with [11C]methyl iodide by slight modification of the original reported method, 6 thru N-alkylation of the precursor’s carbamoyl group, either in solution using the FXC synthesis module (GE Medical Systems) or via the Captive Solvent method 15 using the AutoLoop synthesis module. Briefly, [11C]methyl iodide was swept with helium through the FXC reactor vessel cooled to 0℃ which contained a solution of the precursor (1 mg) and potassium hydroxide (3 N KOH; 3 µL) in 150 µL dimethylformamide (DMF) until radioactivity peaked, and the resulting mixture was then heated for 5 min at 80℃. Alternatively, [11C]methyl iodide was swept with helium through the stainless steel loop preloaded with a solution of the precursor (0.5–0.6 mg) in 80 µL of DMF containing KOH (1 N; 1.6–2 µL), and the resulting mixture was allowed to stand for 5 min at ambient temperature.
The crude product resulting from both methods was purified by reverse-phase high-performance liquid chromatography (HPLC). The HPLC product fraction was further purified by solid-phase extraction, and then formulated in saline containing less than 10% ethanol. The PET drug product solution was finally passed through a 0.22 micron membrane filter for terminal sterilization and collected in a sterile vial, affording a sterile formulated I.V. solution ready for dispensing and administration. The average radiochemical and chemical purity (n = 24) was 99.8% ± 0.1% and 98.4% ± 5.6%, respectively. The SA at the end of synthesis was 245 ± 166 MBq/nmol.
PET and magnetic resonance imaging data acquisition
PET studies were performed on the HR+ scanner (Siemens/CTI, Knoxville, TN, USA). Dynamic data were acquired in 3D mode for 2 h following the injection of 281 ± 173 MBq of [11C]GSK189254 by a computer-controlled infusion pump (Harvard PHD 22/2000, Harvard Apparatus, Holliston, MA, USA). The radioligand SA at time of injection (TOI) was 110 ± 80 MBq/nmol. The injected mass was 13 ± 6 ng/kg (max 22 ng/kg). Dynamic data were binned into 33 frames (6 × 0.5 min, 3 × 1 min, 2 × 2 min, 22 × 5 min) and reconstructed with the Ordered Subset Expectation Maximization algorithm including corrections for attenuation, normalization, scatter, randoms, and deadtime. Image voxel size was 2.06 × 2.06 × 2.42 mm.
Each subject also underwent a brain MR scan on a 3T Trio (Siemens Medical Systems, Erlangen, Germany) with a circularly polarized head coil. MR acquisition was a Sag 3D magnetization-prepared rapid gradient-echo sequence with 3.34 ms echo time, 2500 ms repetition time, 1100 ms inversion time, 7° flip angle, and 180 Hz/pixel bandwidth. The image dimensions were 256 × 256 × 176, and pixel size was 0.98 × 0.98 × 1.0 mm.
Arterial input function measurements
Whole blood and plasma
Both continuous and sequential discrete arterial blood samples were taken as previously described. 16
Determination of ligand metabolism in plasma
The arterial plasma samples collected after injection at 3, 8, 15, 30, 60, and 90 min for the test–retest study, and at 8, 30, 60, 75, and 90 min for occupancy study, were analyzed using HPLC and the column-switching method 17 to measure the unchanged fraction of [11C]GSK189254. See supplemental data for details.
Plasma free fraction
The plasma free fraction fP of [11C]GSK189254 was measured by ultrafiltration as previously described. 16
Scaled arterial input function
In the drug occupancy study, for four out of the six studies performed 24 h post-drug administration, arterial blood data were not available. For these studies, the arterial input function obtained during the baseline scan was scaled, taking into account the difference in injected dose, and used to apply in the kinetic model.
Fit of the tail of the arterial input function
In order to compute the [11C]GSK189254 in vivo Kd value and the corrections in the occupancy study, the tail of the arterial input function (last five points) was fitted to a single exponential function, using non-linear-weighted least squares. The weights were computed to take into account the counting statistics in the plasma sample radioactivity measurements.
Kinetic modeling
Motion correction
The PET dynamic images were motion corrected after reconstruction: an early summed image (0–10 min post-injection) was created as reference, then each frame image was smoothed using a Gaussian filter with a full width at half maximum of 3 mm, then a rigid coregistration matrix was estimated between the reference image and the smoothed frame images, using a mutual information algorithm (FLIRT, FSL 3.2, Analysis Group, FMRIB, Oxford, UK), and finally the original (unsmoothed) frame images were resliced to match the reference image.
Computation of regional TACs
Regions-of-interest (ROIs) were taken from the Anatomical Automatic Labeling template. 18 Eleven gray matter ROIs were selected: cerebellum (84 cm3), amygdala (3.7 cm3), caudate (16 cm3), putamen (17 cm3), thalamus (17 cm3), hippocampus (15 cm3), insula (29 cm3), the anterior cingulate (22 cm3), frontal (256 cm3), occipital (81 cm3), and parietal (65 cm3) cortices. One extra white matter ROI (37 cm3) was manually drawn on the template magnetic resonance image (MRI) in the centrum semiovale. To apply these ROIs to the PET data, two coregistration matrices were computed, first between the template MRI and each subject’s MRI (using a 12-paramter affine transform), and then between each subject’s MRI and each PET early summed image (using a six-parameter rigid transform) using a mutual information algorithm (FLIRT, FSL 3.2, Analysis Group, FMRIB, Oxford, UK).
Kinetic analysis
Regional volumes of distribution (VT) for [11C]GSK189254 were computed using the two-tissue compartment (2TC) model (for review see Gunn et al.
19
) with the parameters k4 and K1/k2 shared across all regions (2TCshared), as in previous studies.
7
For test–retest studies, the test–retest variability (TRV) of VT estimates was computed as
PK of PF-03654746
A total of four venous blood samples per subject were drawn to measure PF-03654746 plasma concentration (PK) during the PET scans. Blood was drawn at the beginning and end of each post-dose PET scan, i.e. at approximately 3, 5, 24, and 26 h after drug administration. Samples were assayed using HPLC tandem mass spectrometric method (HPLC-MS/MS), with a lower limit of quantification of 0.025 ng/mL. To obtain a single PK value per scan, the geometric mean of the two PK measurements obtained at the beginning, and end of each scan was determined.
Results
Arterial input function data
The parent fraction of [11C]GSK189254 in arterial plasma was high during the entire PET scan, with 93% ± 3.9% (n = 16) of radioactivity in plasma attributed to unchanged [11C]GSK189254 at 60 min post-injection.
The plasma free fraction was 50% ±3.0% (n = 24). There was no significant difference between test (49% ± 1.6%, n = 3) and retest (47% ± 1.9%, n = 3) studies (Paired Student t-test, p = 0.51). In the occupancy study, plasma free fraction tended to be slightly lower in post-drug studies (49% ± 3.6% at 3 h, 51% ± 1.9% at 24 h, n = 6) than at baseline (53% ± 2.6%, n = 6), but the difference was not significant when correcting for multiple comparisons (Paired Student t-test, p = 0.07).
The tails of the metabolite-corrected plasma curve were fitted to perform the self-occupancy correction. These fits were performed assuming either a single exponential decay rate for all studies or differing decay rates for individual scans. A common exponential clearance rate α was sufficient to describe all available arterial input function curves (n = 20) according to the F-test (F19,60 = 0.71 and p = 0.80). Thus, for each subject, in equations (12) to (14), all α values could be assumed to be identical. α was estimated to be 0.14 ± 0.02 per h, i.e., a 5-h half-life. The plasma clearance (dose/AUC of plasma) was 0.59 ± 0.07 (L/kg/h) (n = 20).
For test studies, the average metabolite-corrected plasma concentration
[11C]GSK189254 kinetic analysis
The kinetics of [11C]GSK189254 can often be described well by the 1TC model, but not for all ROIs and subjects. Comparing the 2TC and 1TC model fits using the F-test, the 2TC model provided significantly better fits in only 91 out of 288 fits (F2,29 > 3.33, p < 0.05, uncorrected for multiple tests). No ROIs were always fitted better by the 2TC model. However, when the 2TC model was used, outlier VT estimates were observed 54 times out of 288 fits (i.e., values higher than the regional median plus five times the regional median absolute deviation from the nine test or baseline scans). Using a constrained version of the 2TC model (i.e., 2TCshared) removed the outliers. MA1 and 2TCshared VT estimates were very well correlated (the regression line equation was y = 0.976x + 0.546, r2 = 0.989, with the 2TCshared VT used as the independent variable). Thus, MA1 could be also used to quantify [11C]GSK189254 VT values. However, the 2TCshared results were used for the occupancy computations, since this was the model selected in previous studies. 7
TRV of [11C]GSK189254 VT estimates
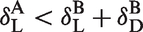
[11C]GSK189254 VT estimates from test scans and test retest variability (n = 3).
TRV: test–retest variability:
The retest VT values were generally lower than the test VT values in all regions: the TRV ranged from −11% ± 8.6% in the cerebellum (n = 3) to − 26% ± 15% in the caudate (n = 3).
[11C]GSK189254 in vivo Kd estimates
The self-occupancy plots for all three test–retest studies are shown in Figure 1. Based on these occupancy plots, the apparent self-occupancy values were 34%, 13%, and 24% for the three test–retest studies. The non-displaceable distribution volume (VND) was estimated to be 5.6 ± 2.2 mL/cm3 (mean ± SD, n = 3). Using equation (18), the in vivo Kd of [11C]GSK189254 was estimated to be 9.5 ± 5.9 pM (mean ± SEM, n = 3).
Occupancy plots for test/retest [11C]GSK189254 studies for subjects 1 to 3 (solid circles, solid triangles, and open circles, respectively).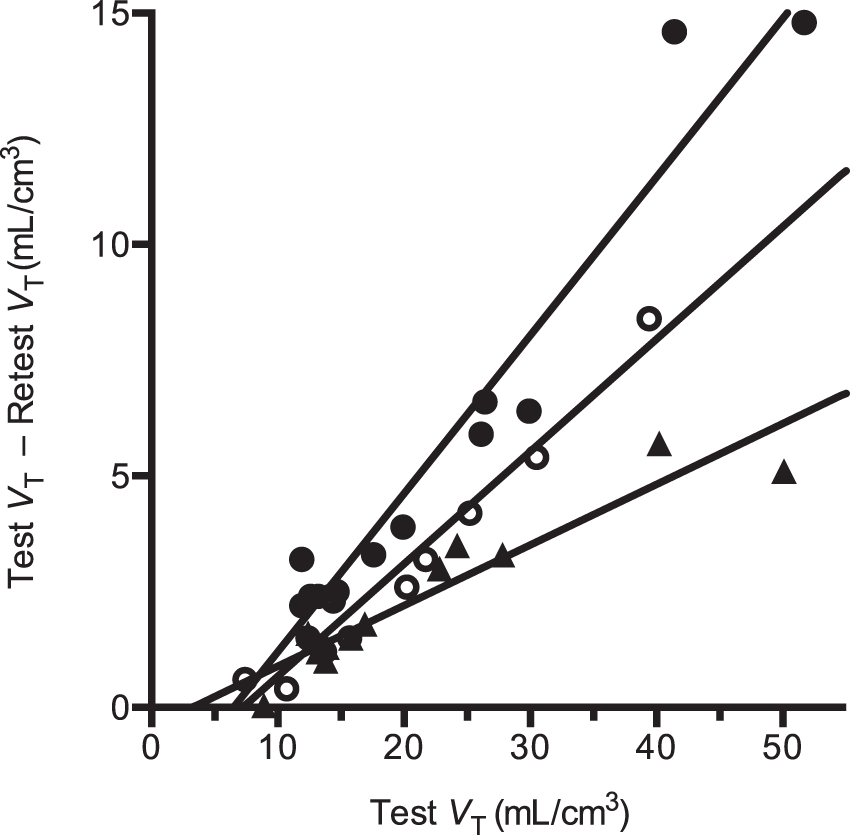
Occupancy study
There were no serious adverse events following the administration of PF-03654746. In one subject, following the administration of 0.5 mg of PF-03654746, the following adverse events were observed: anxiety, parasomnia, night sweats, nausea, headache, and hypoaesthesia.
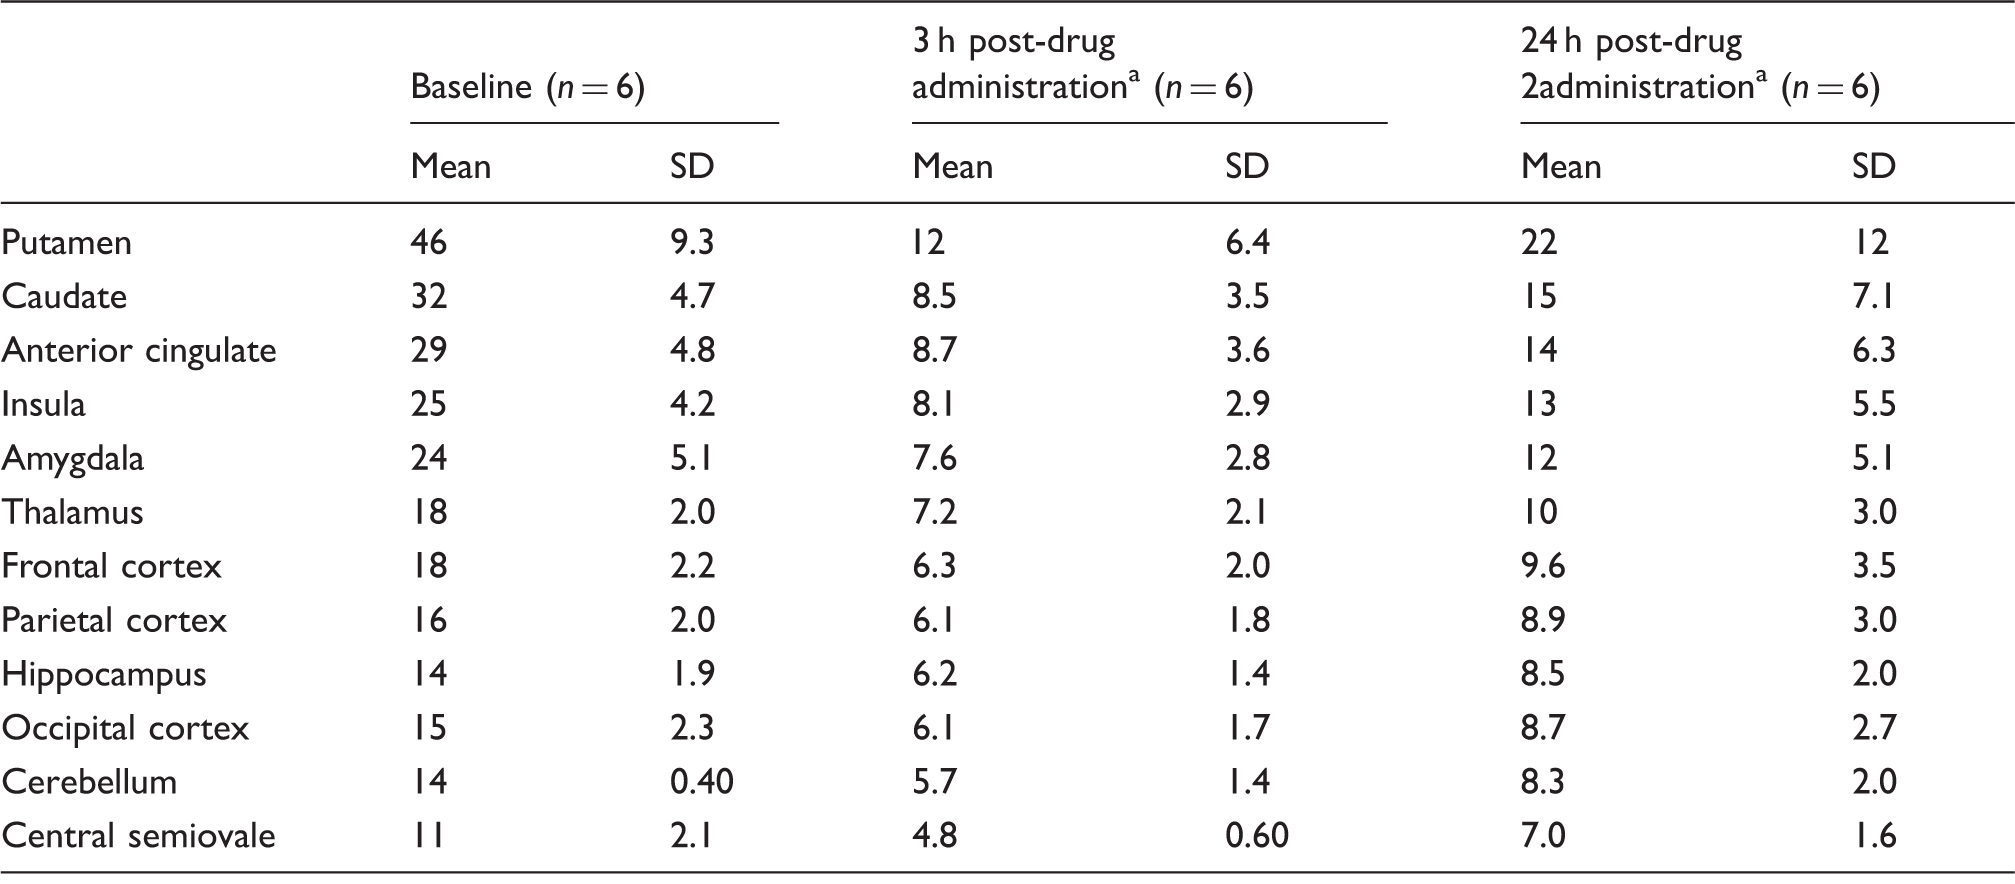
Figure 2 shows [11C]GSK189254 concentration images acquired from 60 to 90 min post-injection from the baseline and two post-drug scans for one subject in the occupancy study. Substantial reduction in specific binding was evident at 3 h post-dose, and partial recovery of H3 availability was observed at 24 h. The average regional [11C]GSK189254 VT estimates under baseline and post-drug conditions are listed in Table 2. In this second cohort, the baseline VT ranged from 11 ± 2.1 mL/cm3 in the centrum semiovale to 46 ± 9.3 mL/cm3 in the putamen (n = 6). At 3-h post-drug, VT values ranged from 4.8 ± 0.60 mL/cm3 in the centrum semiovale to 12 ± 6.4 mL/cm3 in the putamen. At 24-h post-drug, VT values ranged from 7.0 ± 1.6 mL/cm3 in the centrum semiovale to 22 ± 12 mL/cm3 in the putamen.
Sagittal (top), coronal (middle) and transverse (bottom) MR images (a) and brain images of [11C]GSK189254 standard uptake value at 60–90 min post-injection during the baseline scan (b), the 3-h post-drug scan (c) and the 24-h post-drug scan (d) for a representative subject who received a dose of 0.5 mg of PF-03654746. [11C]GSK189254 VT estimates from drug occupancy studies. Post-drug values are average across all doses of PF-03654746: 0.1, 0.25, 0.5 (two subjects), 1.5, or 4 mg.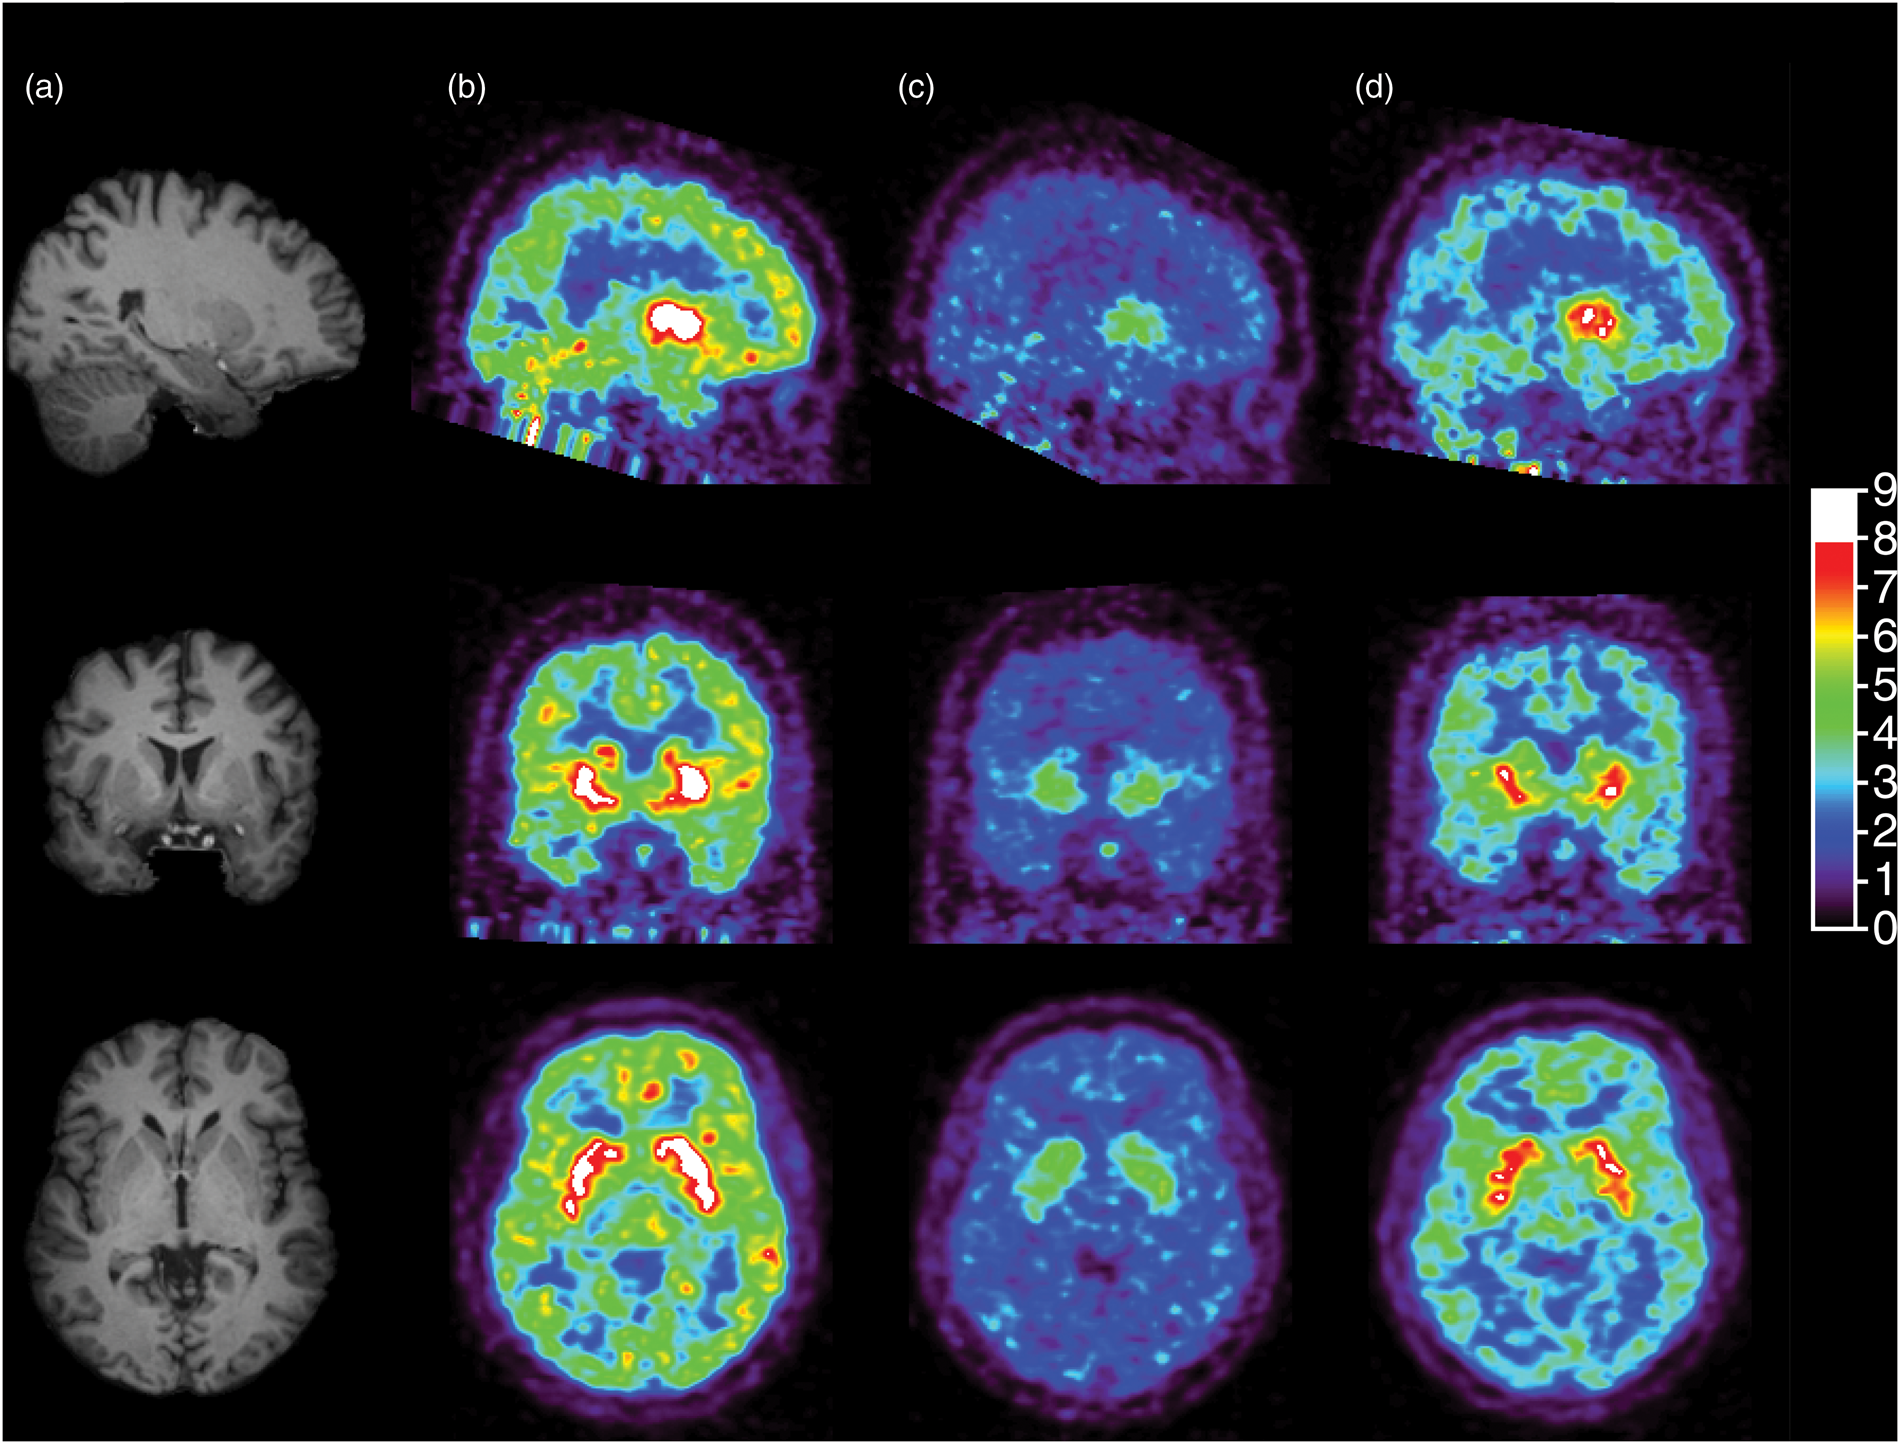
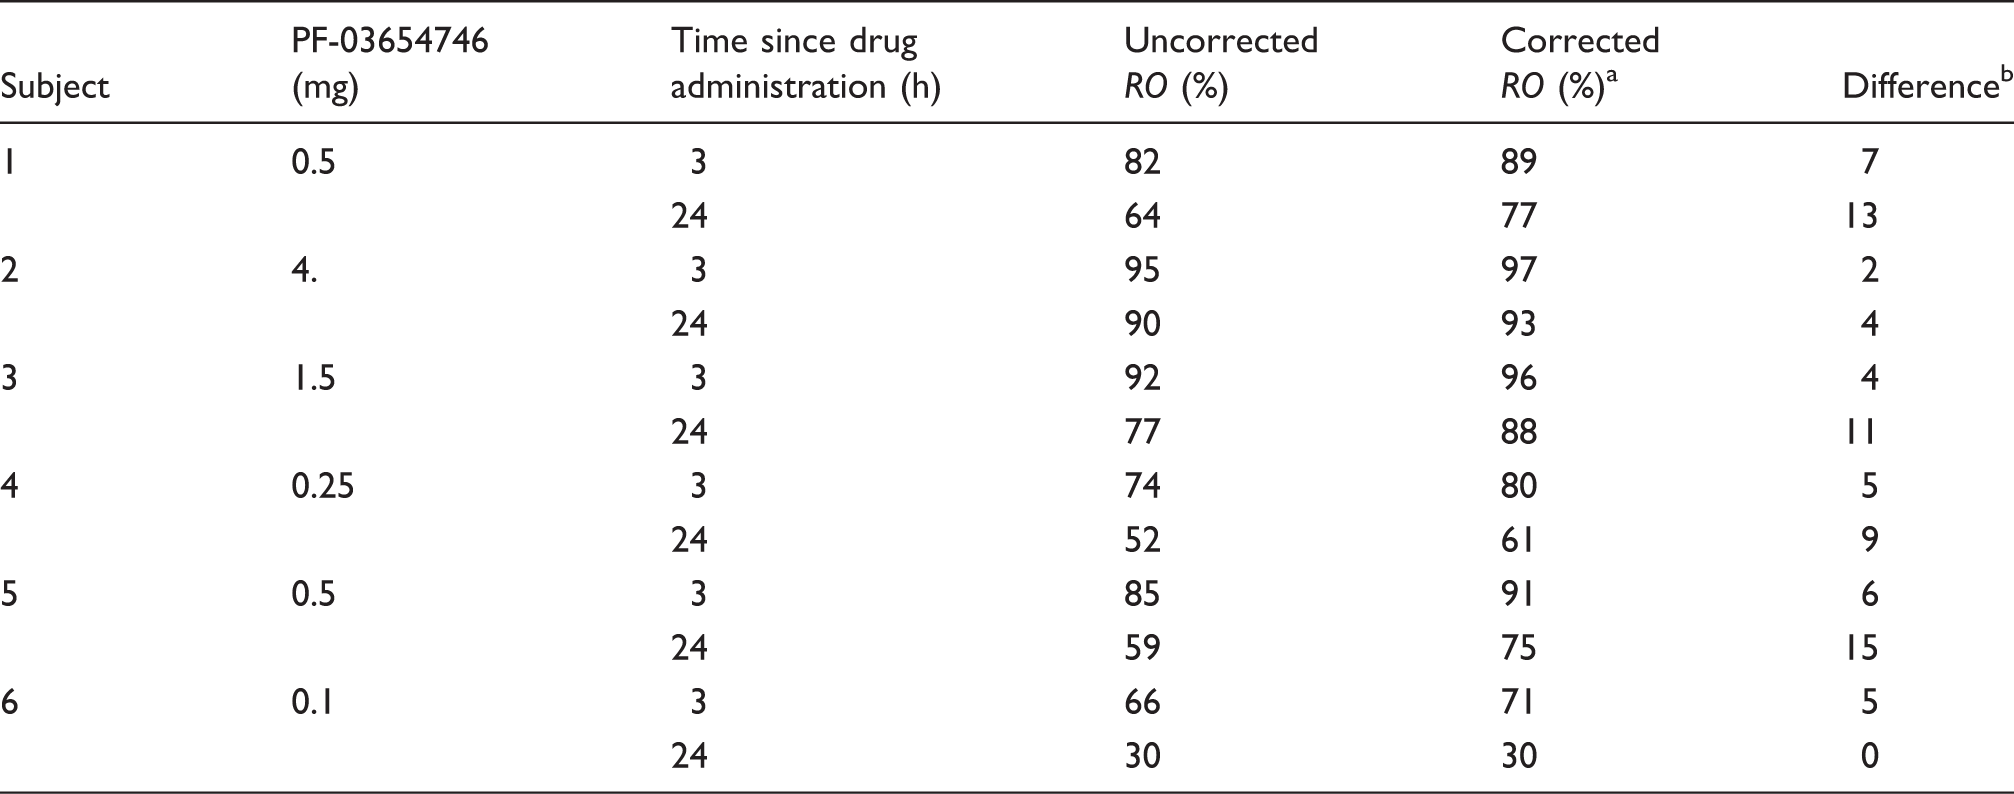
A sample occupancy plot from one subject in the occupancy study is shown in Figure 3. The apparent occupancies estimated from all occupancy plots are listed in Table 3. Apparent occupancies ranged from 30% to 95%. After correcting for self-occupancy from the CO mass (equation (11), Table 3), occupancies ranged from 30% to 97%, with CO mass effect correction ranging from 0% to +15%.
Sample occupancy plots from a PF-03654746 occupancy study (0.5 mg), at 3-h post-drug (solid circles) and at 24-h post-drug (open circles). The occupancies estimated from the slope of these regression lines were 82% ± 2% and 64% ± 2% at 3 h and 24 h after drug, respectively. The non-displaceable volumes of distribution estimated from the x-intercept of these regression lines were 3.8 ± 0.5 mL/cm3 and 4.6 ± 0.7 mL/cm3 at 3 h and 24 h after drug, respectively. [11C]GSK189254 apparent and corrected occupancies of PF-03654746. RO: receptor occupancy. Corrected RO based on equation (11). The difference between uncorrected and corrected RO values is expressed in percentage points.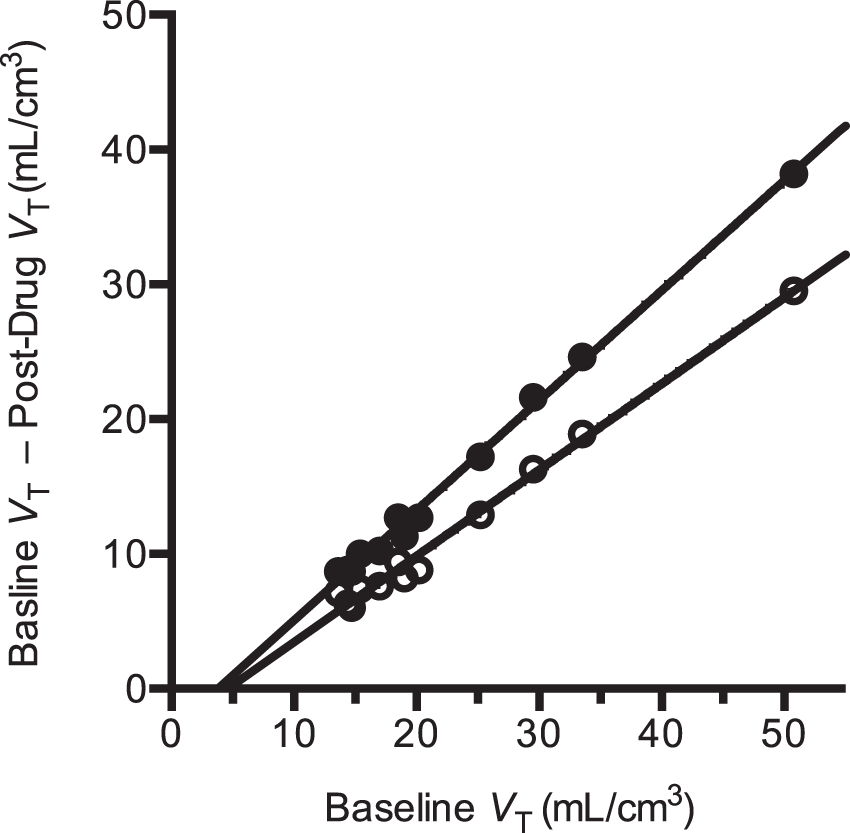
The relationship between PK of PF-03654746 and estimated RO is shown in Figure 4 with their fits to the simple occupancy model, either assuming 100% maximum occupancy, or allowing it to float as a second parameter (ROmax). With the self-occupancy correction, the ROmax was not significantly different from 100% (F1,10 = 0.16, p = 0.70; ROmax = 99% ± 2%), and the IC50 from the one-parameter fit was 0.144 ± 0.010 ng/mL (0.447 nM). Without self-occupancy correction, ROmax was significantly lower than 100% (F1,10 = 6.3, p < 0.05): ROmax was 95% ± 2% and IC50 was 0.182 ± 0.0184 ng/mL, which was 26% higher than the corrected value. When ROmax is fixed to 100% in fitting the PK versus uncorrected occupancy values relationship, the impact of the NTCO effect on the IC50 is larger: with ROmax set to 100%, the uncorrected IC50 was estimated to 0.22 ± 0.02 ng/mL, which is 53% higher than the corrected value.
PF-03654746 receptor occupancy vs. PK relationship using uncorrected occupancy estimates (in gray diamonds) and using corrected occupancy estimates (in black squares). Solid symbols represent 3-h post-drug data; open symbols represent 24-h post-drug data. The dashed gray line represents the best apparent RO-PK fit, using the two-parameter occupancy model (ROmax and IC50), and the solid black line represents the best corrected RO-PK fit, using the one-parameter occupancy model (IC50). Without correction for the radioligand occupancy, ROmax was estimated to be lower than 100%, but after correction, ROmax was no longer statistically different from 100%.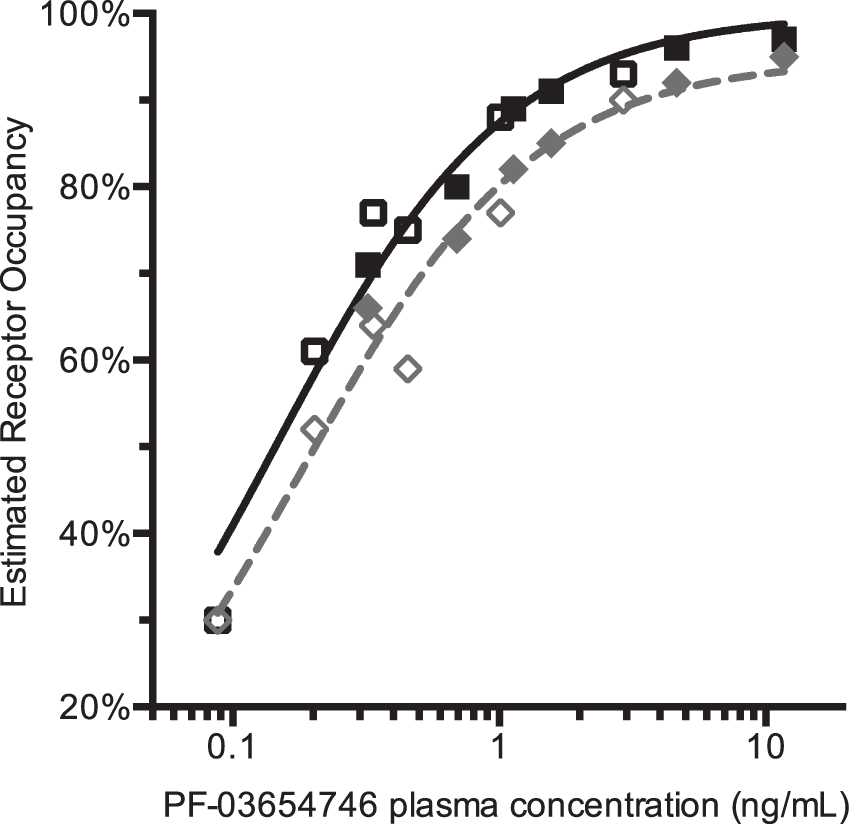
Discussion
We have developed and implemented a method for correction for NTCO effects in PET receptor studies. This method is applicable for radioligands with high affinity, high bioavailability, and slow plasma clearance, so that RO is non-negligible. The need for this approach can be found in test/retest data with reductions in binding measures in retest scans caused by CO effects. We have applied this technique to the H3 antagonist radioligand [11C]GSK189254 and used it to measure the occupancy and in vivo IC50 of PF-03654746.
The properties of the H3 radioligand [11C]GSK189254 in humans and its kinetic modeling were previously reported, 7 and our results had similarities and differences from these reports. The high unchanged fraction of [11C]GSK189254 measured in this study is consistent with previous literature reports. In this study, the unchanged fraction was 93% ± 3.9% at 60 min post-injection, while in a previous study, it was 86% ± 5% at 75 min post-injection. 7 The plasma free fraction measure in this study was somewhat higher that in the aforementioned previous study: 50% ± 3% instead of 36%. 7 Interestingly, there was more difference between the two studies concerning the order of magnitude of [11C]GSK189254 volumes of distribution in the brain, even though the same compartmental model was used for data analysis. In this study, baseline VT values ranged from 9.4 mL/cm3 in the central semiovale (12 mL/cm3 in cerebellum) to 47 mL/cm3 in the putamen. In the previous study, baseline VT values were about twofold higher, ranging from 22.5 mL/cm3 in the cerebellum to 119 mL/cm3 in the putamen. The value of [11C]GSK189254 in vivo Kd in humans found in this study, 9.5 pM, is close to the value found in a previous self-saturation study using unlabeled GSK189254: the EC50 in humans had been estimated to be 11 pM. 7
The in vivo Kd estimated here was determined from the reduction in VT between test and retest scans due to CO effects. Since the studies were not performed at equilibrium from the radioligand point of view (i.e., bolus injections were used), the plasma concentration of the radioligand was changing over time. Thus, the plasma concentrations used in all computations, and in particular in the computation of the radioligand in vivo Kd, are dependent on the choice of the time interval t1:t2 (equations (14) and (15)). However, this effect is likely to be small, since this NTCO correction is, by definition, suited for radioligands with plasma concentration that do not decrease rapidly. For [11C]GSK189254, the difference between plasma levels between 15 and 60 min and between 60 and 120 min was only 9% ± 6% (n = 20).
The choice of the time interval t1:t2 can have a stronger effect on the estimation of the rate of decrease α of the plasma concentration, and then the extrapolation of the radioligand plasma concentration used in the correction of the CO effect. This may have a potentially larger effect on the accuracy of the correction, and this extrapolation is challenging to validate since it is difficult to measure accurately the concentration of radioligand remaining in the plasma at the time of post-drug PET scans (at ∼5 h or ∼26 h after the baseline injection). In this study, using the 15–60 min time interval instead of 60–120 min changed the estimate of the parameter α from 0.14 ± 0.019 to 0.22 ± 0.038 per h; this, in turn changed the estimates of [11C]GSK189254 in vivo Kd from 9.5 ± 5.9 pM to 7.3 ± 4.9 pM, (see Supplementary Table 1). This effect had a minor impact on the PF-03654746 IC50, changing it from 0.144 ± 0.010 ng/mL to 0.128 ± 0.010 ng/mL. Assessing whether multi-exponential fits would be less sensitive to the selection of the time interval was not possible, since we could not reliably estimate two washout rates except for the 15–120 min time interval. With a bi-exponential fit over a 15–120-min time interval, the slowest washout rate was estimated to be 0.056 ± 0.016 per h, i.e., a slower washout than that estimated with any mono-exponential fit. This would lead to a larger Kd value (17 ± 14 pM, instead of 9.5 ± 5.9 pM) and to a slightly larger IC50 (0.176 ± 0.011 ng/mL, instead of 0.144 ± 0.010 ng/mL).
The plasma free fraction fP of [11C]GSK189254 was very stable between scans, and fP was in a range of values (∼50%) which provides highly reliable data. This is a very favorable property of [11C]GSK189254 when using the plasma concentration to correct for the NTCO effect. However, for other tracers with very low plasma free fraction, fP estimates tend not to be robust, and may not be useful in the plasma concentration computation. Ignoring fP would lead to a bias in the tracer Kd estimate, i.e., only Kd/fP can be estimated. However, if the plasma free fraction is biologically stable across scans, it should be possible to use the total (i.e., free + bound) plasma concentration when applying the NTCO correction. If the tracer plasma free fraction is both low and variable, VT estimates are expected to be variable; this may hide the NTCO effect in test and retest paradigms and lead to noisier occupancy estimates in drug occupancy studies.
This NTCO correction is suitable for radioligands that are both used at NT dose levels and have a CO effect. For radioligands that are used at NT dose levels, but with sufficiently fast plasma clearance so that no CO effect is detectable, equations (1) to (14) remain valid and can be used for correcting occupancy estimates; however, it would be necessary to perform a study where the mass of radioligand is varied7,14,21 in order to estimate the radioligand in vivo Kd value. In particular, as mentioned above, a controlled saturation study was previously performed to evaluate [11C]GSK189254 in vivo Kd value in humans, 7 and the Kd value of the present study (9.5 pM) is very similar to that of the saturation study (11 pM).
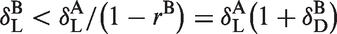
In this study, all apparent occupancies 
Thus, as expected, a sufficient condition for the apparent occupancy to be lower than the true occupancy is for the radioligand’s mass concentration during the post-drug scan to be less than that during the baseline scan. However, if the radioligand’s concentration after drug administration is greater than the radioligand’s concentration at baseline multiplied by the factor
Based on equation (8), depending on the normalized concentrations of radioligand and drug, the apparent occupancy will be positive if and only if

Thus, the apparent occupancy will be positive when the radioligand’s normalized concentration at baseline is lower than the sum of the radioligand and drug normalized concentrations during the post-drug scan. Thus, a low-specific activity/high-radioligand mass during the baseline scan, combined with little or no CO effect, is needed to observe negative apparent occupancies.
If all scans were performed with the same normalized radioligand concentration (i.e.,
If possible, it is desirable to perform all scans of an occupancy study using a constant injected mass of radioligand (in µg or in µg/kg of body weight), since the bias and the correction of the apparent occupancy values will be (more) consistent across subjects if the self-occupancy and CO effects are comparable. However, this may not always be achievable if the specific activity of the radioligand is variable, or if the radioligand plasma kinetics varies from scan to scan (i.e., even with a constant injected mass, the plasma concentration is variable). Applying a correction taking into account the variability of the ligand concentration across scans is therefore useful to make best use of all scan data.
This correction could be useful for other tracers with very high affinity for their target. For example, [11C]-(+)-PHNO has high affinity in vitro and in vivo for dopamine D3 receptors,1,23 and NTCO effects are possible in D3 rich regions such as the substantia nigra as indicated by test–retest studies. 24 More importantly using [11C]-(+)-PHNO, there is a particular interest to evaluate the selectivity of drugs for the dopamine D2 and D3 receptors, 25 and thus accurately measuring a drug’s IC50 for both receptors in vivo is particularly important. The present correction algorithm could be used for [11C]-(+)-PHNO in regions with ∼100% D3 binding, such as the substantia nigra; however, the algorithm must be extended in order to be applied to brain regions with a mixed D2 and D3 signal, such as the globus pallidus.
Conclusion
In this study, a method was introduced to correct drug occupancy studies for NTs dose of radioligand and CO effects from one scan to the next. The method was applied to a study of H3 occupancy, based on changes in baseline binding observed in test/retest studies. This correction method can be useful to improve RO measurements and to reduce biases and variability of the estimates of drug IC50 and maximal occupancy.
Footnotes
Funding
The author(s) disclosed receipt of the following financial support for the research, authorship, and/or publication of this article: Yale-Pfizer Bioimaging Alliance; CTSA Grant UL1 RR024139 from the National Center for Research Resources (NCRR) and the National Center for Advancing Translational Sciences (NCATS) components of the National Institutes of Health (NIH).
Acknowledgments
The authors appreciate the excellent technical assistance of the staff at the Yale University PET Center and the Pfizer New Haven CRU. The authors would also like to acknowledge Helene Faessel and Bob Williams for helpful discussions. This study was supported by the Yale-Pfizer Bioimaging Alliance. This publication was also made possible by CTSA Grant UL1 RR024139 jointly from the National Center for Research Resources (NCRR) and the National Center for Advancing Translational Sciences (NCATS) components of the National Institutes of Health (NIH). Its contents are solely the responsibility of the authors and do not necessarily represent the official view of NIH.
Declaration of conflicting interests
The author(s) declared the following potential conflicts of interest with respect to the research, authorship, and/or publication of this article: DP, XL, JL, CR, KC, ASB, TJM, and AWS were employees of Pfizer at the time of this research. YH declares significant financial interest in Pfizer, Inc. The remaining authors declare no conflict of interest.
Authors’ contributions
JDG and BP contributed to analysis and interpretation of data. NN, DL, and JR contributed to ligand radiosynthesis and acquisition of data. SFL contributed to metabolite analysis and acquisition of data. CR and KC contributed to medical coordination and study planning. ASB and AWS contributed to conception and design and translational pharmacology/biology. DP contributed to conception and design and interpretation of data. XL contributed to interpretation of data and statistical analysis. JL contributed to PK analysis and interpretation of data. TJM, YH, and REC contributed to study concept and design, study coordination, analysis, and interpretation of data. JDG, BP, SFL, NN, and REC drafted the manuscript. All co-authors revised the manuscript.
References
Supplementary Material
Please find the following supplemental material available below.
For Open Access articles published under a Creative Commons License, all supplemental material carries the same license as the article it is associated with.
For non-Open Access articles published, all supplemental material carries a non-exclusive license, and permission requests for re-use of supplemental material or any part of supplemental material shall be sent directly to the copyright owner as specified in the copyright notice associated with the article.