
Abstract
The quantification of dynamic positron emission tomography studies performed with arterial sampling usually requires correcting the input function for the presence of radiometabolites by using a model of the plasma parent fraction (PPf). Here, we show how to include the duration of radioligand injection in the PPf model formulations to achieve a more physiologic description of the plasma measurements. This formulation (here called convoluted model) was tested on simulated data and on three datasets with different parent kinetics: [11C]NOP-1A, [11C]MePPEP, and [11C](R)-rolipram. Results showed that convoluted PPf models better described the fraction of unchanged parent in the plasma compared with standard models for all three datasets (weighted residuals sum of squares up to 25% lower). When considering the effect on tissue quantification, the overall impact on the total volume of distribution (VT) was low. However, the impact was significant and radioligand-dependent on the binding potential (BP) and the microparameters (K1, k2, k3, and k4). Simulated data confirmed that quantification is sensitive to different degrees to PPf model misspecification. Including the injection duration allows obtaining a more accurate correction of the input function for the presence of radiometabolites and this yields a more reliable quantification of the tissue parameters.
Keywords
INTRODUCTION
Quantitative dynamic positron emission tomography (PET) usually requires sampling the subject's radial artery, either manually or automatically with a peristaltic pump, and measuring the plasma concentration of the unchanged radioligand on each sample. This information is fundamental to describe the delivery of the radioligand to target tissues and therefore to provide an absolute quantification of the physiologic tissue processes measured with the PET scan.
Measuring the authentic radioligand concentration in the plasma is not straightforward: when injected into the body, most of currently used radioligands are metabolized by the organism, producing radiometabolites still containing the radioactive isotope. Hence, only a fraction of the total activity measured in the plasma is because of the parent (plasma parent fraction (PPf)). This fraction is not constant over time and it should ideally be measured using high-performance liquid chromatography (HPLC) equipped with radiation detector on as many samples as possible. However, for practical and technical reasons, the number of samples is often more limited (typically four to seven samples in a 1- to 2-hour PET scan with 11 C or 18 F). Ad hoc analytical functions are then fitted to the discrete PPf measures to recover a continuous time course and to reduce the effect of measurement noise.
Toward this end, several PPf models—typically based on monotonic decreasing functions—were proposed in literature.1–6 Notably, the choice of the function may have an impact on the tissue kinetic modeling. 7
Although these models are defined by different formulas, they all are empirical functions chosen with the unique purpose of describing the PPf data. Thus, they are commonly applied without explicitly considering underlying physiologic processes of radioligand metabolism (e.g., the rate of metabolism) or experiment variables (e.g., radioligand injection time). Some attempts to account for the physiology of radioligand metabolism have been conducted with compartmental models.8,9 However, these methods require a priori knowledge of the biochemical pathways of the radioligand, which are radioligand specific and most of times not completely known.
In this study, we proposed a modeling approach, which could help improving the description of the PPf measures by taking into account the duration of the radioligand injection. Our method lies in between the full physiologic modeling of the metabolism kinetic and the experiment-unrelated analytical function. In fact, on the one hand, it allows including an experiment-specific variable into account while on the other hand it does not lose generality since it can be applied to any of the aforementioned analytical functions that are currently the mostly used PPf models.
This method was validated on three radioligands ([ 11 C](R)-rolipram, [ 11 C]NOP-1A, and [ 11 C]MePPEP), which exhibit different blood and radiometabolite kinetics and for which an unusually high number of PPf samples was available (on average 15 per subject). Subsequently, the same analysis was repeated on a downsampled version of the same dataset to reproduce a typical scenario. Finally, computer simulations were performed to quantify the bias and variability generated in both PPf description and tissue quantification when the PPf model does not take into account the injection length.
MATERIALS AND METHODS
Plasma Parent Fraction Models
In a PET study with blood sampling, the measurement of the radioligand concentration in arterial plasma—C
p
(t)—requires two steps: first, the blood must be centrifuged to separate the plasma to quantify the total plasma radioactivity (C
tot
(t)), which is then decay corrected back to the injection time. Second, the contribution of radiometabolites to total plasma activity must be removed. Each radiochromatogram data point is decay corrected till the injection time onto the chromatographic column to allow the relative distribution of radioactivity among the radiometabolites as well as in the parent compound. This is followed by multiplying this plasma parent fraction by the total plasma activity:
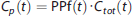
In mathematical terms the plasma radiometabolite correction is performed as:
As expressed by equation 2, the quality of C p (t) estimation depends directly on the ability of f x (t,m) to describe accurately the PPf measures.
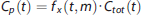
An extensive review of the literature revealed that the most frequently used PPf models (i.e., f x (·)) can be categorized into three main groups: power, Hill, and exponential (Table 1). The power model is based on an empirical sigmoidal function proposed by Watabe et al 6 and designed to equal 1 at time 0 with a zero first derivative (Supplementary Figure 1A). The Hill model 5 has a similar sigmoidal shape but it can also describe a final plateau different from zero (Supplementary Figure 1B). The exponential model 10 represents the simplest class of models based on a sum of a variable number (usually 1 to 3) of decaying exponential functions (Supplementary Figure 1C) but, in contrast to the Hill and power models, exponential functions may not adequately fit the smooth decrease of the parent fraction in the first minutes. All PPf models may include a time delay term (t0, i.e., the time of plasma radiometabolite appearance after radioligand injection) and an initial value of PPf (PPf0) that can differ from 1 (Table 1), to take into account the possible presence of coinjected radiochemical impurities and other compounds eventually formed in the blood because of the radioligand instability. 1
PPf standard models
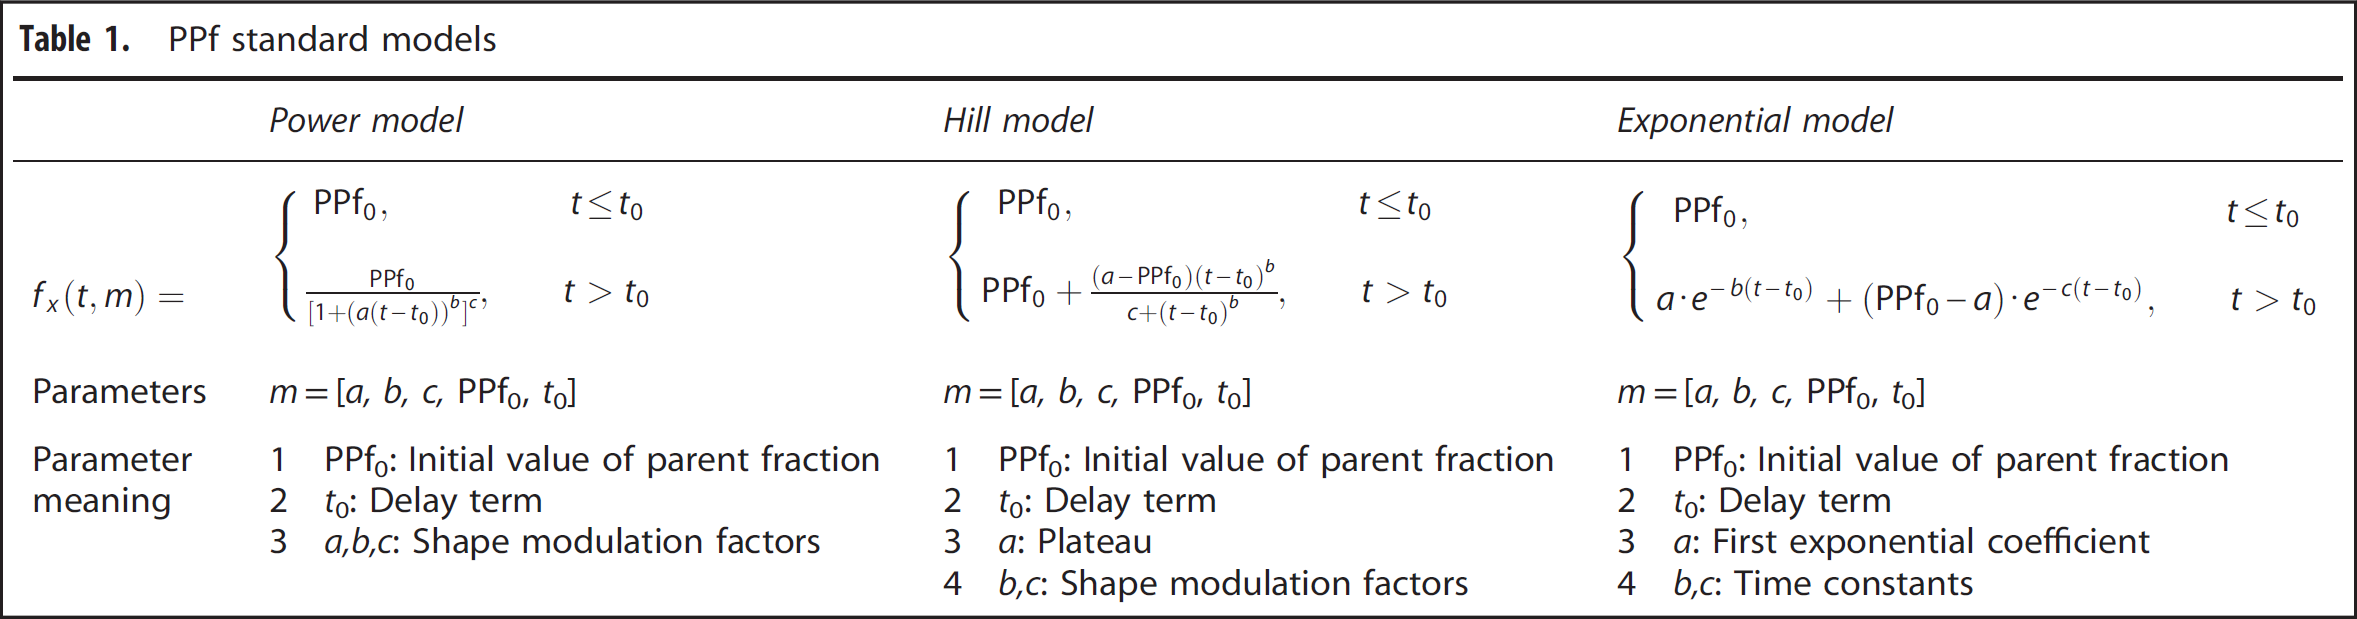
The effects of radioligand injection on plasma parent fraction modeling. The figure reports the weighted residual sum of square (WRSS) percentage difference, computed between convoluted plasma parent fraction (PPf) modeling (accounting for the radioligand injection time) and standard PPf modeling (applied without any information about radioligand injection time).
Incorporating Injection Duration in Plasma Parent Fraction Models: Convoluted Models
When the radioligand is administrated as a bolus, the injection duration is assumed to be instantaneous, even if in practice it can last from some tens of seconds up to few minutes. This may affect the initial phase of the PPf curve since the organism is already metabolizing a part of the radioligand while the rest has just been injected.
To account for this effect, we explicitly modeled the injection as a boxcar function u(t,T) = D[1(t) - 1(t−T)], where 1(t) represents the Heaviside step function and T the length of radioligand injection. The amplitude D is assumed constant (constant rate infusion), while its value is such that the area under the curve of u(t,T) equals the injected activity. u(t,T) is assumed to be the input of a dynamic system whose impulse response function—f
x
(t,m)—is a mathematical function such as the ones currently used to model the PPf. The final formulation, which we called the convoluted model, is given by:
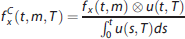
Please note that this new mathematical description does not introduce any new parameter to be estimated because the value of T is known from the experiment protocol.
Clinical Datasets
To test the validity of the convoluted PPf models compared with the standard ones, three different datasets acquired at the Molecular Imaging Branch of the National Institute of Mental Health (USA) were considered. The radioligands, characterized by different pharmacokinetic proprieties (i.e., faster or slower kinetics) were [ 11 C]NOP-1A, a nociceptin/orphanin FQ peptide receptor ligand (n = 22; 716 ± 83 MBq, scan duration = 120 - minutes); 11 [ 11 C]MePPEP, an inverse agonist for cannabinoid receptor type 1 receptors (n = 20, 657 ± 76 MBq, scan duration = 90 minutes); 12 and [ 11 C](R)-rolipram, a ligand for phosphodiesterase 4 (an enzyme that metabolizes cyclic adenosine monophosphatase) in the brain (n = 24, 420 ± 144 MBq, scan duration = 90 minutes). 13 Recruitment processes and eligibility criteria are described in the original publications. The protocol was approved by the Ethics Committee of the National Institutes of Health; all subjects gave written informed consent. All the studies were conducted according to the Declaration of Helsinki.
Radioligands were injected intravenously over 1 minute using an automated pump, and blood samples were manually drawn from the radial artery at 15-second intervals until 120 or 150 seconds, and then at increasingly longer intervals until the end of the scan. Each input function consisted of about 22 individual samples.
Blood sample processing. Plasma was first separated from blood cells by centrifugation. Activity in both the whole blood—C b (t)—and total plasma—C tot (t)—were measured. Sample counts were consistently monitored and variable volumes were aliquoted to keep the counting error in each sample <2.5% (~2,000 counts) at 1 s.d.
Radiometabolite separation from parent plasma concentration was performed by HPLC on almost every blood sample, as described in Zoghbi et al, 14 obtaining an unusually high number of PPf samples per subject (17 ± 2 for [ 11 C]NOP-1A; 13 ± 2 for [ 11 C]MePPEP, and 13 ± 1 for [ 11 C](R)-rolipram).
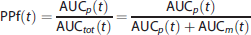
The fraction of parent plasma concentration at a given time, PPf(t), was calculated as the ratio between the AUC of the parent peak—AUC
p
(t)—with the total area in the radiochromatogram—AUC
tot
(t):
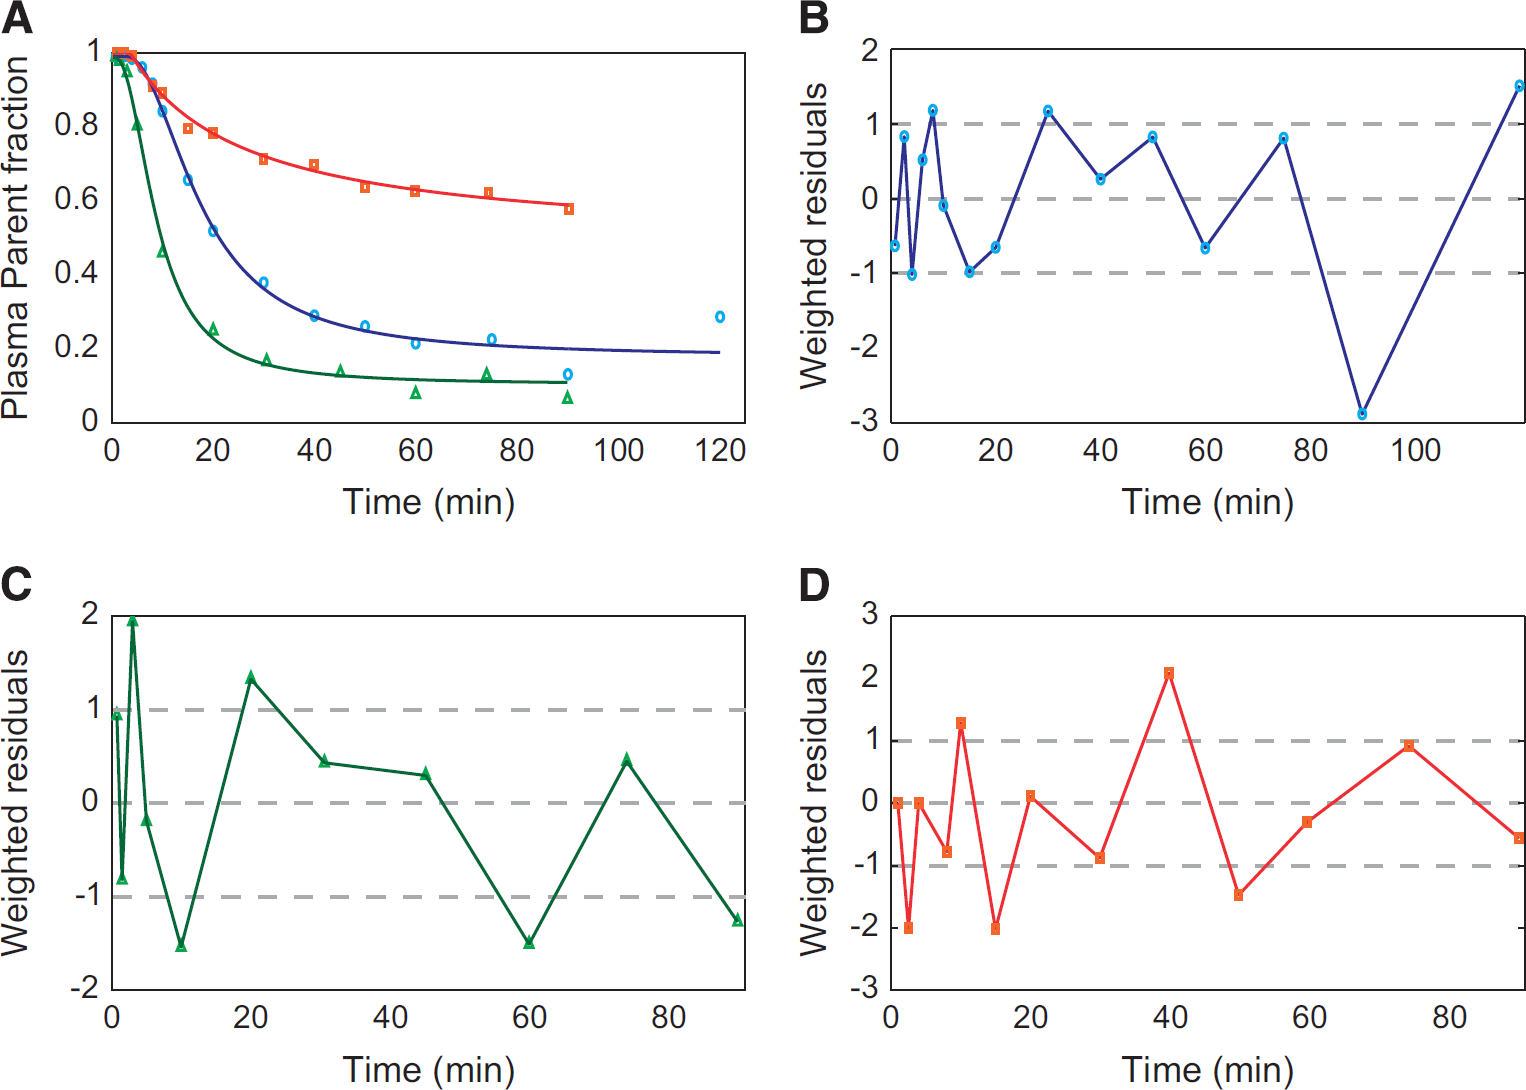
Optimal plasma parent fraction modeling in [
11
C]NOP-1A, [
11
C]MePPEP, and [
11
C](R)-rolipram positron emission tomography (PET) data. (
Radiometabolite Data Modeling and Statistical Analysis
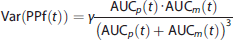
Model parameter quantification. All three previously described standard models (power, Hill, and exponential; Table 1) and their corresponding convoluted versions were fitted to the PPf measures of each subject. The parameter vectors for each model and each subject were estimated using a maximum-likelihood nonlinear estimator with a relative weighting scheme based on HPLC measurements. Measurement error was assumed to be additive and uncorrelated with zero mean and variance assumed to be known up to a proportionally constant γ; furthermore, measurement error was assumed to be derived from the extension of both AUC
p
and AUC
m
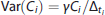
errors, each described by independent Poisson statistic. Thus, applying the principle of propagation of uncertainty, the variance associated to each PPf measure was derived as:
Weighted residual sum of squares (WRSS): the Akaike's Information Criterion, 16 which balances the WRSS with the number of model parameters, is generally used to compare different models. However, because all the models considered had the same number of parameters, WRSS was used to investigate model performance instead of Akaike's Information Criterion. In particular, we considered the percentage difference between the WRSS of convoluted and standard models, calculated as: %diff=(WRSSstandard - WRSSconvoluted)/WRSSstandard.
Coefficient of variation (CV) of the model parameter estimates: this index returns information about estimate precision. It was calculated for each model and each subject from the s.d. derived by the inverse of the Fisher information matrix, and expressed as a percentage of the estimated parameters. To note that, even if the PPf model parameters do not have any physiologic meaning about metabolite metabolism, the associated CVs are important since they return an indirect measure of the model robustness.
Percentage of outliers, defined as the fraction of subjects in which at least one estimated parameter had a CV>1,000%, excluding t0. Outliers are not considered in the calculation of the other performance indices as they would bias their estimates. Nevertheless, the percentage of outliers is indicative of the model robustness.
Residual zero-line crossing: this index represents an indirect measure of the polarization of the residuals. It is calculated as the number of times that the weighted residuals cross the zero line, normalized by n − 1, where n is the total number of samples. The expected value for the zero-line crossing is 0.5 (as from a Bernoulli distribution with P = 0.5 and n − 1 trials). The lower this number, the more polarized the residuals.
Impact on tissue kinetic quantification. The optimal PPf model selected in the previous step (both in its standard and convoluted version) was used to perform radiometabolite correction. Thus, two input functions were generated for each subject:


The rate constants K1 (mL/cm3/min), k2 (1/min), k3 (1/min), k4 (1/min), and V b (unitless) were estimated for each region with a maximum-likelihood nonlinear estimator. The parameters of interest were:
V T = K1/k2 (1 + k3/k4): the total volume of distribution (mL/cm3), which equals the ratio at equilibrium of the concentration of radioligand in the brain to that in the plasma; 18
BP P = k1k3/k2k4: the binding potential (mL/cm3), which refers to the ratio at equilibrium of specifically bound radioligand to that in the plasma; 18
BP ND = k3/k4: the nondisplaceable binding potential (unitless), which refers to the ratio at equilibrium of specifically bound radioligand to that of nondisplaceable radioligand in the tissue. 18
Positron emission tomography data measurement error was assumed to be additive and uncorrelated, with zero-mean and Gaussian distribution. We defined the diagonal elements of the error covariance matrix according to the formula originally proposed by Mazoyer et al:
19
All the data were corrected for the radioligand decay and blood arterial delay (defined as the time difference between the blood arrival from the radial artery and the brain). 20
The correlation between the V T values obtained with the two different inputs, i.e., C p standard(t) and C p convoluted(t), was calculated with Pearson's R 2 coefficient for all the regions for each subject. We also computed the mean relative difference (MRD), calculated as the average of the absolute value of the relative differences, i.e., RD = 2·(VTstandard - VTconvoluted)/(VTstandard + VTconvoluted). The same indices were considered also for BP P , BP ND , and the microparameters (i.e., K1, k2, k3, and k4) to evaluate which ones are the most influenced by the different radiometabolite correction.
Impact of reduced sample size. Since our dataset was particularly rich in the number of samples, we evaluated the performance of standard and convoluted models in a more typical situation when limited PPf measures are available. The original datasets were thus downsampled keeping only the seven measures taken closer to the times t = 2, 5, 10, 15, 20, 40, and 70 minutes. Sampling times were chosen based on the literature.1,4,21,22 Data fitting and model comparison were performed in the same way as done with the full dataset.
Simulated Datasets
Different simulations were performed to:
Evaluate the error introduced by using a standard PPf model in the presence of a nonimpulsive radioligand injection;
Assess the impact of applying a standard PPf model for radiometabolite correction on tissue quantification, when tissue kinetics are generated with a plasma input function corrected with a convoluted PPf model.
Impact of using a standard plasma parent fraction model in the presence of a nonimpulsive radioligand injection. To understand the error introduced by fitting a PPf time course with a standard model when the radioligand injection length is different from an actual bolus, 1,000 PPf curves were simulated using the convoluted Hill model and fitted with the standard Hill model. Each of the 1,000 PPf curves was generated with a different set of parameters (a, b, c, PPf0, and t0), assuming an injection time T = 1 minute. These were randomly sampled from a Gaussian distribution whose mean and s.d. were set as the mean and s.d. of the parameter estimates obtained from all the subjects of the [ 11 C]NOP-1A dataset (a = 0.14 ± 0.04, b = 2.28 ± 0.40, c = 220 ± 214, PPf0 = 0.98 ± 0.02, and t0 = 1.87 ± 1.39). The times of the samples were chosen taking the time grid used for a representative [ 11 C]NOP-1A subject. White noise (zero-mean and Gaussian distribution) was added to the curves with variance defined according equation 5. High-performance liquid chromatography information was derived from the same representative subject used for the time grid. Parameter estimation using the standard Hill model was obtained as explained in the previous section (clinical data). Results were assessed by calculating the relative difference between the estimated PPf curves and the simulated ones.
Within the same simulation, the impact of using a standard Hill model to fit PPf data generated with increasing radioligand injection times was evaluated. The range of injection lengths explored was from T = 0.5 to 3 minutes with a time step of 0.5 minute. Therefore, 1,000 curves were simulated for each value of T for a total of 6,000 PPf curves.
Impact on the tissue kinetic estimation. The simulation included the following steps:
The parameter estimates obtained with 2TCM on the whole brain 120-minute time-activity curves (TACs) of one [ 11 C]NOP1A subject became the baseline values. The parameters k2 and k3 were varied in the range 0.01:0.1 (10 variations each). The values were chosen on the basis of previous results and cover a wide range of physiologic kinetics. The other microparameters were left unchanged (K1 = 0.34 mL/cm3/minute and k4 = 0.03/minute).
A noise-free TAC was calculated using the 2TCM with each set of parameters determined in step 1 (20 TACs in total). The arterial input function used for generating the TACs was the one measured for the same [ 11 C]NOP1A subject used in step 1 (corrected for the presence of radiometabolites with the convoluted Hill model).
One hundred noisy TACs data were then obtained for each set of parameters by summing noise-free data and simulated white noise (zero-mean and Gaussian distribution). The simulated noise variance was defined using equation 8, with the proportionality constant γ estimated from the real data.
In summary, 2,000 kinetic TACs (100 curves × 20 cases) were generated. Simulated data were quantified with 2TCM (see previous section, Clinical Datasets), but using the input function corrected with the standard Hill model.
The impact of the use of a standard PPf model was assessed by comparing the 2TCM estimates obtained for each set of parameters versus the 2TCM true value, as:
RESULTS
Plasma Radiometabolites Modeling in Clinical Data
Convoluted versus standard models. The use of a convolution term to account for the duration of radioligand injection improved model fit performance for all radioligands and all PPf model classes (Figures 1A-1C). In particular, the WRSS obtained using convoluted PPf models was always lower than the one obtained using the standard versions. However, the magnitude of the relative WRSS difference depended on the PPf function; it was relatively small with the power model (1% ± 6% on average), but significantly greater with Hill and exponential (up to 21% and 25%, respectively). An example of the fits obtained with standard and convoluted Hill model for a representative [ 11 C]NOP-1A subject is presented in Supplementary Figure 3. Since convoluted models better described PPf data than standard models, the optimal model selection for each radioligand is presented using only the former (see Supplementary Table 1 for all the performance indices related to the standard models).
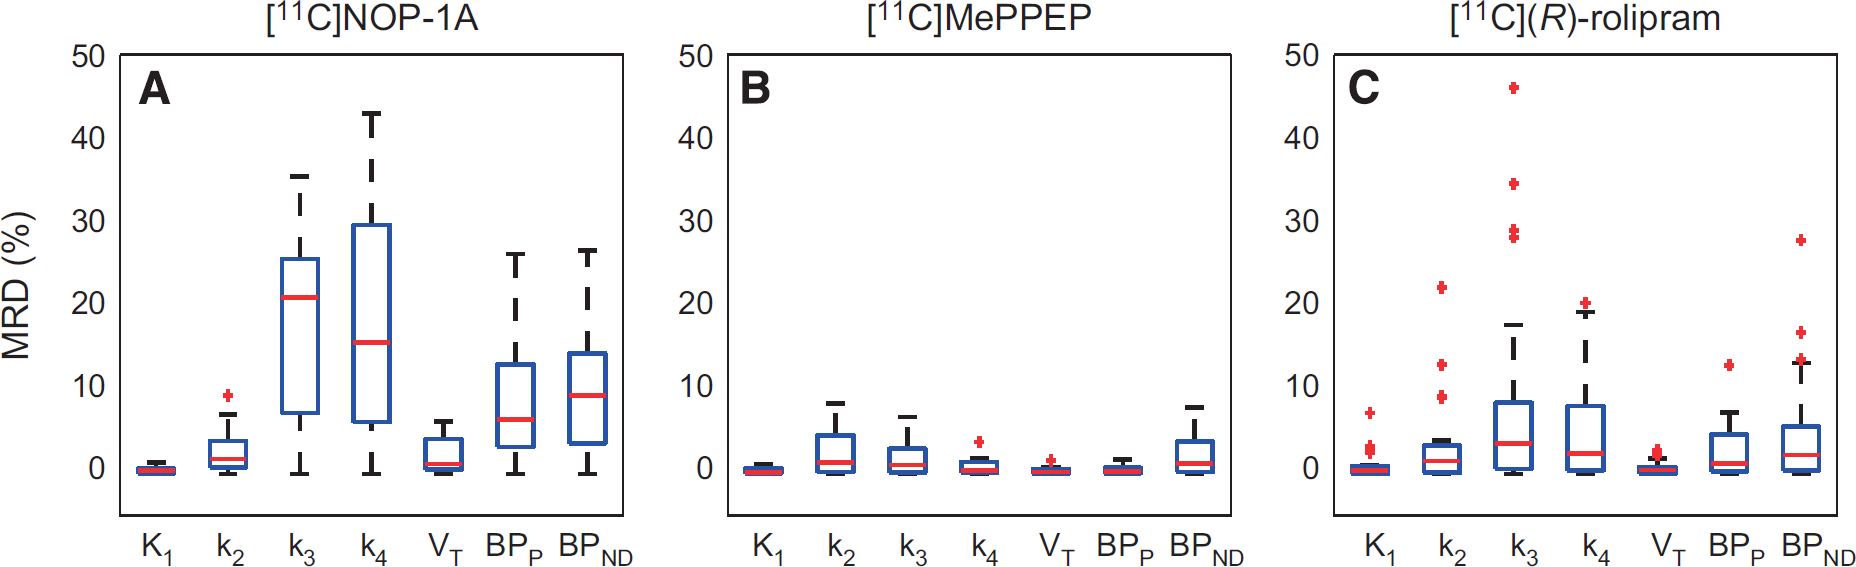
Distributions of mean relative differences (MRDs) for micro- and macroparameters estimated with C
p
standard
(t) and C
p
convoluted
(t). Figure shows the boxplots of the MRDs between K1, k2, k3, k4 and VT, BP
P
, BP
ND
estimated using the input function corrected with the standard plasma parent fraction (PPf) model and the input function corrected with the convoluted PPf model. The MRD was calculated between all the regions for each subject.
Selection of the optimal plasma parent fraction model. For all radioligands, Hill convoluted was the optimal model (Table 2). For [ 11 C]NOP-1A, the Hill model had the lowest mean WRSS (1.00E-04 ± 9.81E-05), the lowest CVs for all parameters (excluding t0), and the most random residuals (0.48 of zero-line crossing) among the three models (Table 2). In terms of outliers, parameter identification failed for only one subject. The good performances of the Hill model for [ 11 C]NOP-1A were visually corroborated by the good fit of the model to the PPf data (Figure 2A). The weighted residual time course was consistent with the assumption made for the error variance law (Figure 2B).
PPf model selection
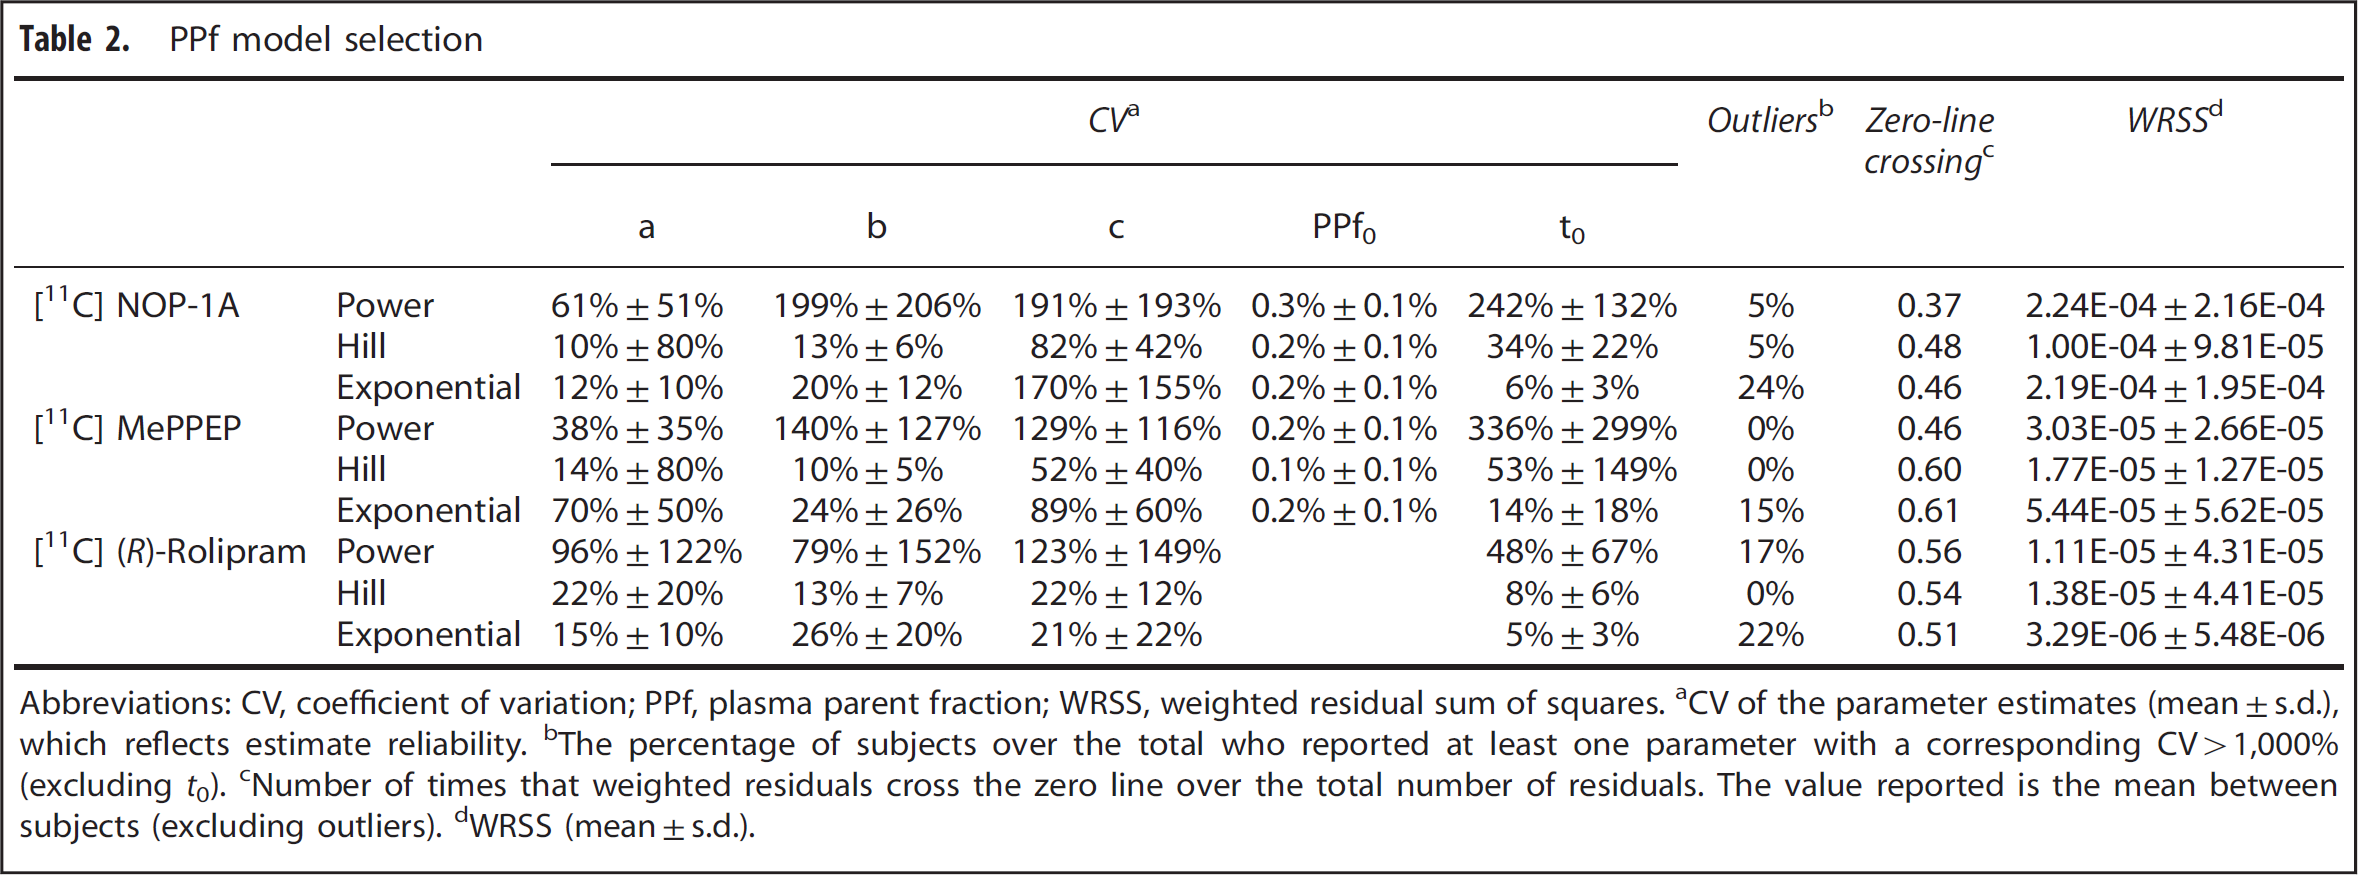
Abbreviations: CV, coefficient of variation; PPf, plasma parent fraction; WRSS, weighted residual sum of squares.
CV of the parameter estimates (mean±s.d.), which reflects estimate reliability.
The percentage of subjects over the total who reported at least one parameter with a corresponding CV>1,000% (excluding t0).
Number of times that weighted residuals cross the zero line over the total number of residuals. The value reported is the mean between subjects (excluding outliers).
WRSS (mean±s.d.).
For [ 11 C]MePPEP, Hill convoluted had the lowest WRSS (1.77E-05 ± 1.27E-05), the lowest parameter CVs (t0 excluded) and random residuals (0.61 of zero-line crossing; Table 2). Notably, the exponential model did not achieve reliable parameter estimates in 15% of subjects. Visually, the Hill model well fitted the measured data (Figure 2A), and the weighted residuals (Figure 2C) were random, with zero mean and variance equal to one (in agreement with the assumption made for the variance error law).
When applied to the [ 11 C](R)-rolipram dataset, the PPf models were simplified with PPf0 constrained to 1. In fact, [ 11 C](R)-rolipram was obtained in high radiochemical purity (99.9% ± 0.2%) and impurities were thus negligible. The exponential model showed the lowest WRSS (3.29E-06 ± 5.48E-06), but a substantial percentage of subjects (22%) had nonreliable parameter estimates (Table 2). In terms of parameter CV, both Hill and exponential models had similar precisions (ranging from 8% to 22% for Hill and from 5% to 26% for the exponential model), while the power model showed higher variability. Randomness of the residuals was comparable between the three models. However, Hill model did not yield any outliers, making it the preferred method to fit [ 11 C] (R)-rolipram data. Figures 2A and 2D, show an example of a Hill model description of [ 11 C](R)-rolipram PPf and the weighted residual time course.
Impact on tissue kinetic quantification. The estimates of the macroparameters were comparable with the ones reported in the literature11–13,23 ([ 11 C]NOP-1A: VT =8.90 ± 1.53 mL/cm3, BP P = 2.69 ± 0.94 mL/cm3, and BP ND = 0.49 ± 0.23; [ 11 C]MePPEP: VT = 15.26 ± 6.97 mL/cm3, BPP = 14.50 ± 6.99 mL/cm3, and BP ND = 24.86 ± 11.07; and [ 11 C](R)-rolipram: VT = 0.59 ± 0.12 mL/cm3, BPP = 0.30 ± 0.08 mL/cm3, and BP ND = 1.02 ± 0.23).
Among the three radioligands considered, [ 11 C]NOP-1A (Figure 3A) showed the greatest differences in the microparameters k3 and k4 (MRD = 18% ± 12% and 18% ± 14%, respectively) obtained with the two input functions, yet the differences on the VT estimates were limited (MRD = 2% ± 2%). Correlation coefficient on VT was R 2 = 0.98 ± 0.04, range [0.86; 1]. Both measures of the binding potential, BP P and BP ND , exhibited a greater difference (MRD = 8% ± 7% and MRD = 10% ± 8%, respectively) and a lower correlation (R 2 = 0.88 ± 0.12 and R 2 = 0.90 ± 0.12, respectively) than VT. Interestingly, k3 and k4 estimates were highly correlated (on average R 2 = 0.98 ± 0.03 and R 2 = 0.97 ± 0.07, respectively), but they showed a different range of correlation values (k3: [0.90; 1], k4: [0.69; 1]).
[ 11 C]MePPEP (Figure 3B) showed negligible differences in both macro- and microparameter estimates (on average MRD < 3% and R 2 > 0.99).
Also [ 11 C](R)-rolipram (Figure 3C) presented negligible differences on the macroparameter (MRD= 1% ± 1% and R 2 = 0.99 ± 0.02 for VT; MRD = 3% ± 2% and R 2 = 0.98 ± 0.06 for BP P ; and MRD = 5% ± 2% and R 2 = 0.97 ± 0.11 for BP ND ). Nevertheless, there was an important impact on the modeling of the PPf on the microparameters on 4 subjects out of 24. In particular, k3 and k4 showed the highest MRD and the smallest correlation (MRD up to 46% and R 2 down to 0.70 for k3).
Impact of reduced sample size. When comparing the WRSS obtained with the standard and the convoluted PPf models in the downsampled dataset, the latter had still better performance even if the difference between the two was quite limited (< 5% on average; see Supplementary Figure 4). With regard to the model selection, Hill convoluted was confirmed to be the optimal model for all three datasets, as the convoluted power model and the convoluted exponential model had higher parameter CVs and number of outliers (Supplementary Table 2).
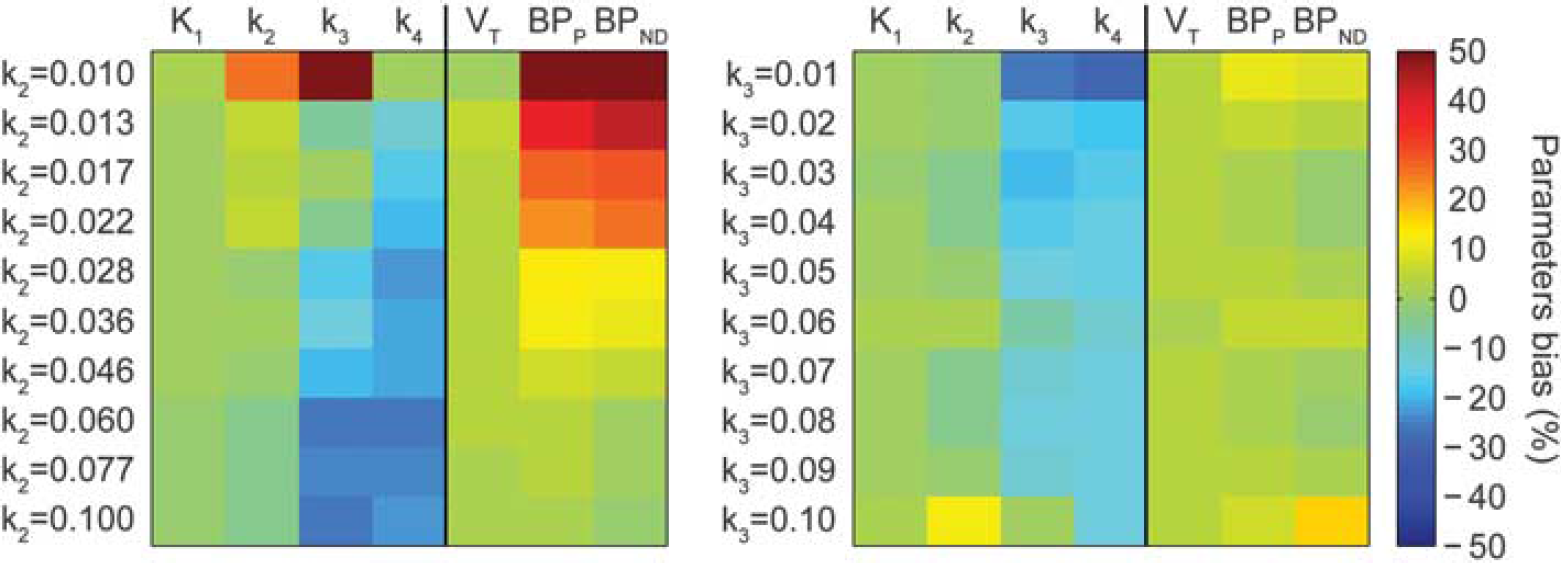
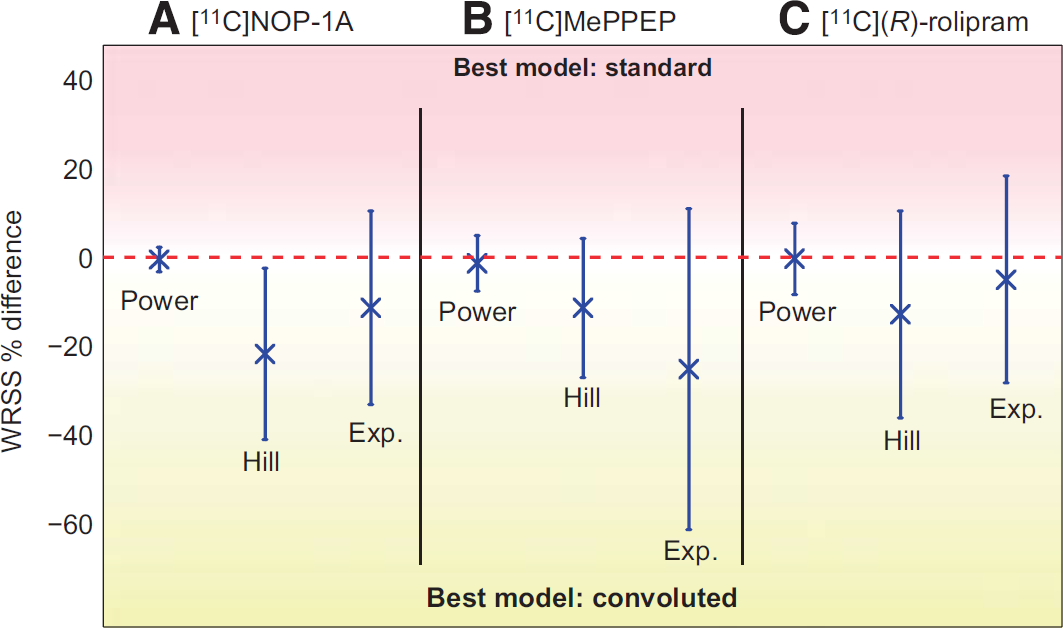
Parameters bias in tissue quantification in simulation studies. Tissue curves were simulated with a plasma input function corrected with a convoluted Hill model and varying k2 (left) and k3 (right) values. k2 and k3 varied between [0.01;0.1] (from top to bottom), with logarithmically and uniform spacing, respectively, to simulate physiologic set of kinetics. Parameter estimates were obtained by fitting the simulated curves using the plasma input function corrected with the standard Hill model. Figure shows how the bias changes depending on the tissue kinetics: green indicates negligible bias, yellow to red represents overestimation, and cyan to dark blue indicates negative bias.
Simulated Datasets
Impact of using a standard model in the presence of a nonimpulsive radioligand injection. The error generated in the PPf model description when the radioligand injection length is not taken into account depends on the duration of the injection. As expected, the longer the injection time, the greater the percentage difference (Supplementary Figure 5). Interestingly, even when the error was on average negligible, that is, when the simulated injection time was T = 0.5 minute with a mean error < 1%, it showed a constant variability > 5%.
Impact on the tissue kinetic estimation. Figure 4 reports the results of the use of the standard Hill model for radiometabolite correction on tissue quantification, when tissue kinetics are generated with a plasma input function corrected with a convoluted Hill model, in a variety of kinetic behaviors.
There was a different impact depending on the radioligand kinetics and on the parameters considered. Although K1 and VT were insensitive to both changes in k2 and k3 (with an average bias of 0.2% ± 1.0% and 3.0% ± 0.4%, respectively), both k3 and k4 were sensitive to changes in k2 and k3 (with an average bias of −14% ± 18% and − 18% ± 5%, respectively),
On the contrary, BP P and BP ND were most sensitive to changes in k2 with bias > 50%. These results showed how the use of a standard PPf model can heavily impact both micro- and macroparameters depending on the radioligand kinetics under study.
DISCUSSION
This study sought to improve the accuracy of the estimation of the input function through a better modeling of the plasma parent fraction for the radiometabolite correction. We reached our aim by introducing a modification of the existing PPf models, which improved the description of the PPf measures by taking into account the duration of the radioligand injection. Three different radioligands with different blood kinetics and with a rich sample size were used to validate our modeling approach. In addition, we performed simulation studies to quantify the error generated by not taking into account the radioligand injection length.
In this study, the standard PPf models available in the literature were subdivided into three main categories—power, Hill, and exponential—and used to obtain a better description of the PPf measured data by incorporating the duration of radioligand injection into their mathematical formula (thereby creating convoluted models). These convoluted models always performed better than standard models without increasing their complexity in terms of the number of parameters to be estimated. In particular, the convoluted versions of both the Hill and exponential models improved the PPf measure description up to 21% and 25% in terms of mean WRSS. All radioligands were injected over the course of 1 minute. Simulated studies explored the impact of not taking into account the radioligand injection lengths for T different from 1 minute. As expected, the longer the injection time, the higher the impact.
The Hill convoluted model was selected as the optimal model for the three datasets in this study ([ 11 C]NOP-1A, [ 11 C]MePPEP, and [ 11 C](R)-rolipram). This model provided accurate and precise parameter estimates, and was flexible enough to describe the final plateau in all the analyzed PPf data. As the present study confirmed, the Hill function works well across different radioligands. However, it may not be suitable for some radioligands that display very particular shapes of the input function. For instance, the plasma parent concentration of [ 11 C]DASB 4 actually increases over time, most likely because of an initial trapping of the parent in the lungs; this would not be amenable to modeling with Hill function. Interestingly, for all the radioligands, when a reduced number of samples was considered, the PPf model selection mirrored the results obtained in the full datasets. Hill convoluted was still the optimal model to describe PPf data, even if the differences between the standard and convoluted models were reduced.
In terms of impact on tissue estimates, the convoluted PPf models showed negligible influence on the macroparameter VT and varying impact on BP P , BP ND , and the microparameters, which can be more sensitive to the shape of the input function (e.g., ~ 18% of MRD of k3 and k4 in [ 11 C]NOP-1A). These results were confirmed by simulation studies: the use of a standard PPf model can heavily impact both micro- and macroparameters depending on the radioligand kinetics.
To note that when the tracer is injected relatively fast (<1 minute) and when the number of samples collected for radiometabolite measurements is small (as it is the standard practice in the majority of PET studies), standard and convoluted models produce similar fits.
Also, it must be taken into account that the true input function is not known in the clinical datasets but, as assumed in other previous works,7,24 a better description of the PPf should lead to a more correct quantification of the tissue parameters.
We found no clear relationship between total plasma or PPf kinetics and the impact of modeling on the final tissue estimates. Among the three datasets, [ 11 C]MePPEP had the fastest kinetics, while [ 11 C](R)-rolipram showed the slowest ones. Nevertheless, [ 11 C]NOP-1A had the highest sensitivity to PPf and plasma input modeling. No relationship was found between the MRD of the tissue estimates and the estimates themselves either.
This study used an unusually rich dataset acquired at the Molecular Imaging Branch, National Institute of Mental Health, USA. The high number of HPLC measurements (almost one per blood sample) provided optimal conditions for selecting the best PPf models and allowed us to avoid the use of complex modeling approaches, particularly nonlinear mixed effects ones. 24 We took advantage of this data-rich environment to not only derive the optimal model for describing radiometabolite time course, but also to define a consistent and theoretically justifiable error model for the definition of PPf modeling weights. The error law used in our study accounted for the fact that the PPf is the ratio of two measurements obtained from HPLC, and both of them are affected by a measurement error. These two independent errors contribute to the final PPf error according to the principle of propagation of uncertainty. This error model was validated a posteriori by analyzing the weighted residual randomness, its mean value (expected to be zero), and variance (expected to be 1). Other error laws (for instance, based on the unitary variance of the weighted residuals) failed to satisfy the hypothesis (data not shown). Notably, we checked the residual polarization using the zero-line crossing values and normality using the Anderson-Darling test. We tested three other error laws: the first assumed the variance of the error to be constant among the PPf data, the second assumed it proportional to the PPf data, and the third was the Poisson error law. The weighted residual analysis showed that all of them overestimated the variance of the first samples and underestimated the variance of the lasts.
CONCLUSION
Including the injection duration in the PPf model description allows convoluted models to better describe the data compared with standard models. For the radioligands studied, the Hill convoluted model provided better fits and more precise parameter estimates than exponential fitting and power models.
The final kinetic results were influenced by how the input function was generated, although the magnitude of this effect depended on the radioligand and on the parameters considered.
In particular, limited effect on VT was found for fast tracer injection (below 1 minute) as common in the majority of PET studies.
AUTHOR CONTRIBUTIONS
MT, MV, GR and AB contributed significantly to the overall project design. PZ-F, MF, TGL and SSZ provided the PET data that were then analyzed by MT. SSZ contributed to radiochemistry data interpretation. MT prepared the manuscript with input from MV, GR and AB.
DISCLOSURE/CONFLICT OF INTEREST
The authors declare no conflict of interest.
Footnotes
ACKNOWLEDGMENTS
We thank Dr Robert Innis at the Molecular Imaging Branch of the NIMH for providing the PET datasets. Ioline Henter (NIMH) provided invaluable editorial assistance.
APPENDIX 1
The value of the plasma parent fraction at time t (PPf(t)) was calculated as the ratio of the area under the curve (AUC) of the parent peak (AUC
p
(t)) and the total AUC (AUC
tot
(t)) in the radiochromatogram obtained by analyzing the plasma sample taken at time t with high-performance liquid chromatography. The total AUC is the sum of the parent peak AUC and AUCs of the radiometabolite peaks (AUC
m
(t)).
Assuming AUC
p
(t) and AUC
m
(t) to be independent, their covariance was zero. Thus, the formulation of the variance of PPf(t) was calculated as follows (for the sake of clarity, the dependency from the time t has been omitted in the following passages):
References
Supplementary Material
Please find the following supplemental material available below.
For Open Access articles published under a Creative Commons License, all supplemental material carries the same license as the article it is associated with.
For non-Open Access articles published, all supplemental material carries a non-exclusive license, and permission requests for re-use of supplemental material or any part of supplemental material shall be sent directly to the copyright owner as specified in the copyright notice associated with the article.