
Abstract
Cerebral microbleeds, a marker of small vessel disease, are thought to be of importance in cognitive impairment. We aimed to study topographical distribution of cerebral microbleeds, and their involvement in disease pathophysiology, reflected by cerebrospinal fluid biomarkers; 1039 patients undergoing memory investigation underwent lumbar puncture and a brain magnetic resonance imaging scan. Cerebrospinal fluid samples were analyzed for amyloid β(Aβ)42, total tau(T-tau), tau phosphorylated at threonine 18(P-tau) and cerebrospinal fluid/serum albumin ratios. Magnetic resonance imaging sequences were evaluated for small vessel disease markers, including cerebral microbleeds, white matter hyperintensities and lacunes. Low Aβ42 levels were associated with lobar cerebral microbleeds in the whole cohort and Alzheimer’s disease (P < 0.001). High cerebrospinal fluid/serum albumin ratios were seen with increased number of cerebral microbleeds in the brainstem (P < 0.001). There were tendencies for increased Aβ42 levels and decreased Tau levels with deep and infratentorial cerebral microbleeds (P < 0.05). Lobar cerebral microbleeds were associated with white matter hyperintensities and lacunes (P < 0.001). Probable cerebral amyloid angiopathy-related cerebral microbleeds were associated with low Aβ42 levels and lacunes, whereas probable cerebral amyloid angiopathy-unrelated cerebral microbleeds were associated with white matter hyperintensities (P < 0.001). Our findings show that cerebral microbleed distribution is associated with different patterns of cerebrospinal fluid biomarkers, supporting different pathogenesis of deep/infratentorial and lobar cerebral microbleeds.
Keywords
Introduction
Cerebral small vessels disease has emerged as an important contributor to cognitive impairment in the elderly. There is increasing interest on how small vessel disease co-exists and interacts with neurodegeneration (including Alzheimer’s disease) in patients with cognitive impairment and dementia. Cerebral microbleeds (CMBs) are a characteristic neuroimaging marker of small vessel disease in vivo, detected on blood-sensitive magnetic resonance imaging (MRI) sequences. CMBs are seen in much higher frequency in patients with dementia and stroke, compared to healthy controls, suggesting their involvement in the disease process. 1 In contrast to other small vessel disease markers, such as white matter hyperintensities (WMH), the anatomical distribution of CMBs can provide insights to the specific underlying small vessel process. 2 Circumferential evidence supports the hypothesis that deep and infratentorial CMBs are due to hypertensive arteriopathy, while lobar CMBs (especially multiple strictly lobar CMBs) are often due to cerebral amyloid angiopathy (CAA).2,3 Of note, both age-related microangiopathies are common in dementia and are the two most common causes of spontaneous intracerebral hemorrhage.
The amyloid hypothesis is the most widely accepted pathophysiological theory in Alzheimer’s disease. 4 Lately, the vascular hypothesis has emerged as an alternative explanation for Alzheimer’s disease. The vascular hypothesis suggests that vascular pathology, reflected, amongst others, by WMH and lacunes on MRI, plays an important role in the Alzheimer’s pathogenesis.5–7 However, neither of these theories may alone fully explain Alzheimer’s pathology, and CMBs have been suggested to be a missing link. 5 CMBs, and the accompanying small vessel fragility, caused by either CAA or hypertensive arteriopathy is thought to result in influx of plasma components, this in itself causing neuronal dysfunction/degeneration, leading to the final development of dementia. 5 Consequently, how the pattern of CMBs relates to the underlying disease process is critical to further understanding mechanisms of cognitive impairment.
Routine cerebrospinal fluid (CSF) biomarkers, including amyloid beta (Aβ) 42, total tau (T-tau), tau phosphorylated at threonine 181 (P-tau) and CSF/serum albumin ratios, provide a new opportunity to investigate the role of CMBs in cognitive impairment and their potential underlying path mechanisms in vivo. Only few studies have investigated CMBs in this context, while conducted studies have mainly focused on Alzheimer’s disease, with no CMB topographical analysis.8–10
In this study, we investigated a large sample of consecutive memory clinic patients using MRI and CSF analysis, across the continuum of cognitive impairment. Our aims were (a) to explore and determine the different association between CSF biomarkers and CMBs brain topographies and (b) to determine the extent to which other MRI markers of small vessel disease (e.g. WMH and lacunes) and CSF markers of amyloid burden and neurodegeneration contribute to the likelihood of having lobar versus deep or infratentorial CMBs. We hypothesized that CMBs in lobar regions would be associated with lower Aβ42 levels, and possibly also higher T-tau and P-tau levels in the continuum of cognitive impairment. We also hypothesized that lobar, and especially occipital CMBs, being one of the most frequent locations of CAA and CMBs in Alzheimer’s disease,11–14 would be mostly associated with dementia pathology, and thus reflected by altered CSF biomarkers.
Material and methods
Patients
This is a cross-sectional study, as part of the Karolinska Imaging Dementia Study. Consecutive patients undergoing memory investigation at the Karolinska University Hospital from 01 January 2006–01 January 2012 were recruited if they had an MRI brain scan with blood-sensitive sequences and a lumbar puncture (n = 1041). Exclusion criteria were insufficient MRI scan quality and history of traumatic brain injury, leading to the exclusion of two patients and a final cohort of 1039 patients. Diagnosis was according to the ICD-10 in multidisciplinary rounds. 15 Patients were divided in the categories, Alzheimer’s disease (F00.0, early onset (n = 123), F00.1, late onset (n = 79), F00.2 atypical disease with vascular components (n = 73), F00.9 unspecified Alzheimer’s disease (n = 5); n = 281), mild cognitive impairment (F06.7; n = 308) and subjective cognitive impairment (Z03.2A, Z03.3, R41.8A; n = 270). The rest of the cohort (n = 180) consisted of alcohol-related dementia (n = 11), asymptomatic hereditary dementia (n = 33), frontotemporal lobe dementia (n = 21), Parkinson’s dementia (n = 15), unspecified dementia (n = 44), vascular dementia (n = 25) and other disorders (n = 31). Presence of hypertension, hyperlipidemia and diabetes were systematically defined by assessing medical notes and patient interviews. Diagnoses and medications recorded in the medical records were used in the classification of presence/absence of hypertension, hyperlipidemia and diabetes. Informed consent was obtained from each patient, and ethical approval was obtained from the regional ethics board, Stockholm, Sweden. The Declaration of Helsinki was followed throughout the study.
MRI protocol
Three MRI scanners (Siemens Medical Systems, Erlangen, Germany), two 1.5T scanners and one 3.0T, at the Radiology Department, Karolinska University Hospital, Stockholm were used. Each patient had a full MRI protocol with conventional T1, T2, FLAIR and diffusion sequences, as well as axial SWI and/or T2* sequences added. MRI sequence and field strength were insignificantly distributed across diagnostic groups (P > 0.05). Supplementary Table 1 shows the MRI parameters for SWI, T2* and FLAIR across scanners. Supplementary Table 2 shows the distribution over diagnostic groups on the 3.0T scanner and SWI sequence which are most sensitive to CMBs. 16
Image analysis
All MRI images were analyzed according to standardized scales.17,18 CMBs were rated according to the microbleed anatomical rating scale (MARS), 18 and were, similar to the MARS, defined as round hypointense dots on T2*/SWI sequences. Microbleeds were only rated as present or absent. 11 Microbleeds were distinguished from cross-sectioned vessels by looking at the T2-weighted image in multiple planes. Mineralizations in the globus pallidus were not rated. Hemorrhage was avoided, and similarly hemorrhages within infarctions. Attention was paid to partial volume artifacts, as well as air-bone interfaces. 18
Multiple (i.e. ≥ 2) CMBs at locations where CAA is highly prevalent (strictly lobar or lobar with cerebellar locations) were termed CAA-related microbleeds, and microbleeds at other locations (deep gray matter, deep white matter and brainstem with or without lobar microbleeds; cerebellar with or without deep or brainstem microbleeds, etc.) were termed probable CAA-unrelated microbleeds.19,20 WMH were classified from 0 to 3 (none or single punctate; multiple punctate; early confluent; large confluent), according to the Fazekas scale. 21 Lacunes were defined as having CSF signal on FLAIR (hypointense), T2 (hyperintense) and T1 (hypointense), and being 3–15 mm in size.
CSF analysis
CSF samples were obtained by lumbar puncture at the time of memory investigation; analysis took part at the Department of Clinical Chemistry, Karolinska University Hospital, Huddinge and is detailed elsewhere. 15 Biomarkers analyzed were Aβ42, T-tau, P-tau and CSF/serum albumin ratios.
Statistics
Descriptive statistics for CSF biomarkers are given as median and interquartile range, and mean and standard deviation (±SD) for age and MMSE score. All CSF biomarkers were log transformed due to their non-parametric distribution. Multivariable linear regression analyses were used to determine the association of CSF biomarkers and differing CMB topographies. CSF biomarkers were set as dependent variables, and CMBs (dichotomized into present/not present) for different brain topographies were inserted into the models as independent variables. Multivariable logistic regression models were used to explore imaging markers (WMH and lacunes) and CSF markers of neurodegeneration as predictors of key CMBs locations (lobar, deep, CAA-related and CAA-unrelated CMBs, as the dependent variables). All models were adjusted for hypertension, age, diagnostic group, MRI field strength and CMB sequences (SWI/T2*).
SPSS 22.0 and STATA 13 were used for statistical analysis. To reduce the chances of missing important associations in our analyses (due to the smaller sample size when stratifying CMBs based on brain region and diagnostic group), we report values under P < 0.05, as well as with post-hoc Bonferroni correction applied with a factor of 196, 0.05/196 = 0.0003 (post-hoc Bonferroni significance level). If results were P < 0.05 but not below the new Bonferroni corrected significance level, they are reported as “before Bonferroni correction” values.
Results
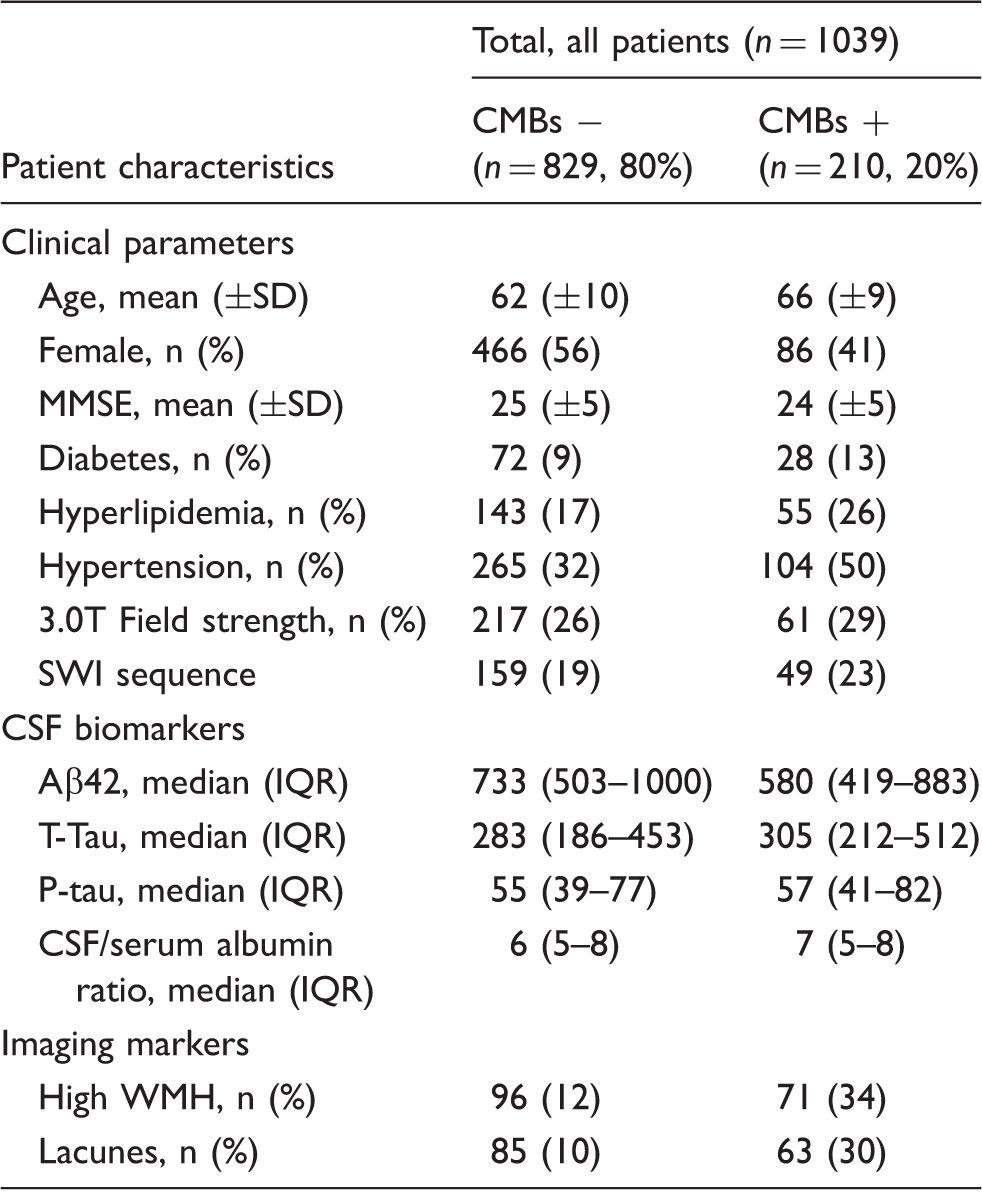
Baseline data for the whole cohort are given in Table 1. There was no significant difference in patients with and without CMBs across the different field strengths and CMB sequences. Subdividing CMB distribution into infratentorial, deep and lobar topographies showed differential CSF associations (Figure 1). In the whole cohort, lower Aβ42 levels were associated with lobar CMBs presence (significant before and after Bonferroni correction, P < 0.001). A tendency with low P-tau levels (significant before Bonferroni correction, P = 0.05) with deep and infratentorial CMBs respectively was noted. In Alzheimer’s disease, Aβ42 levels were low with lobar CMBs (significant before and after Bonferroni correction, P < 0.001), and P-tau levels were low with infratentorial CMBs (significant before Bonferroni correction, P = 0.02). In mild cognitive impairment, Aβ42 was low with lobar CMBs (significant before Bonferroni correction P = 0.01).
CMBs in different topographies and associations with CSF biomarkers. A multivariate linear regression model with CSF biomarkers as dependent variables and CMB topographies as independent variables was constructed. The model was adjusted for WMH, lacunes, MRI field strength, CMB sequence and age. The regression coefficient, standardized beta, is given for all topographies. AlbR = CSF/serum albumin ratios. Significant before and after Bonferroni correction: aP < 0.001. Significant before Bonferroni Correction: bP < 0.01; cP < 0.05. Baseline data for the whole cohort. Units for CSF biomarkers are ng/L. IQR: interquartile range; CMBs: cerebral microbleeds; CSF: cerebrospinal fluid; WMH: white matter hyperintensities; MMSE: Mini-mental State examination; SWI: Susceptibility Weighted Imaging. High WMH is classified as a Fazekas score equaling 2 or above.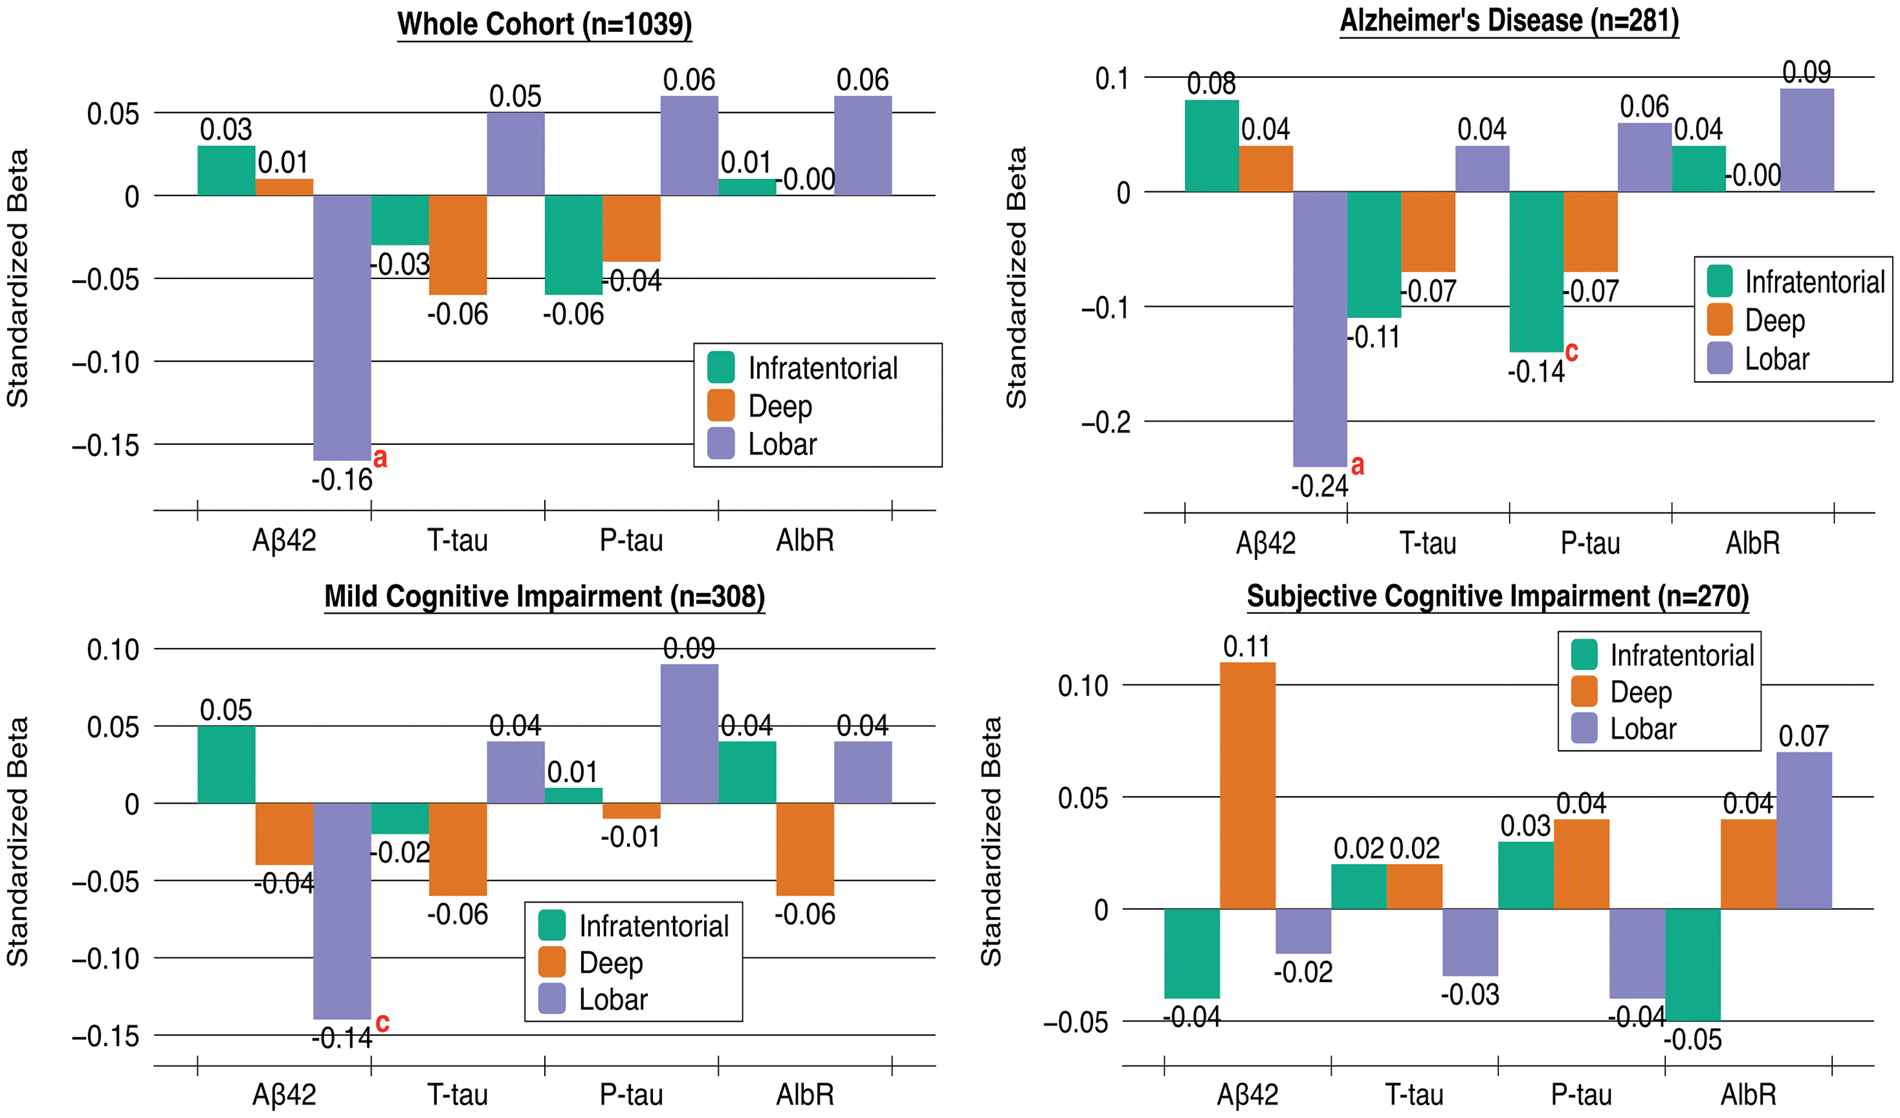
CMBs topography and their association with CSF Biomarkers.
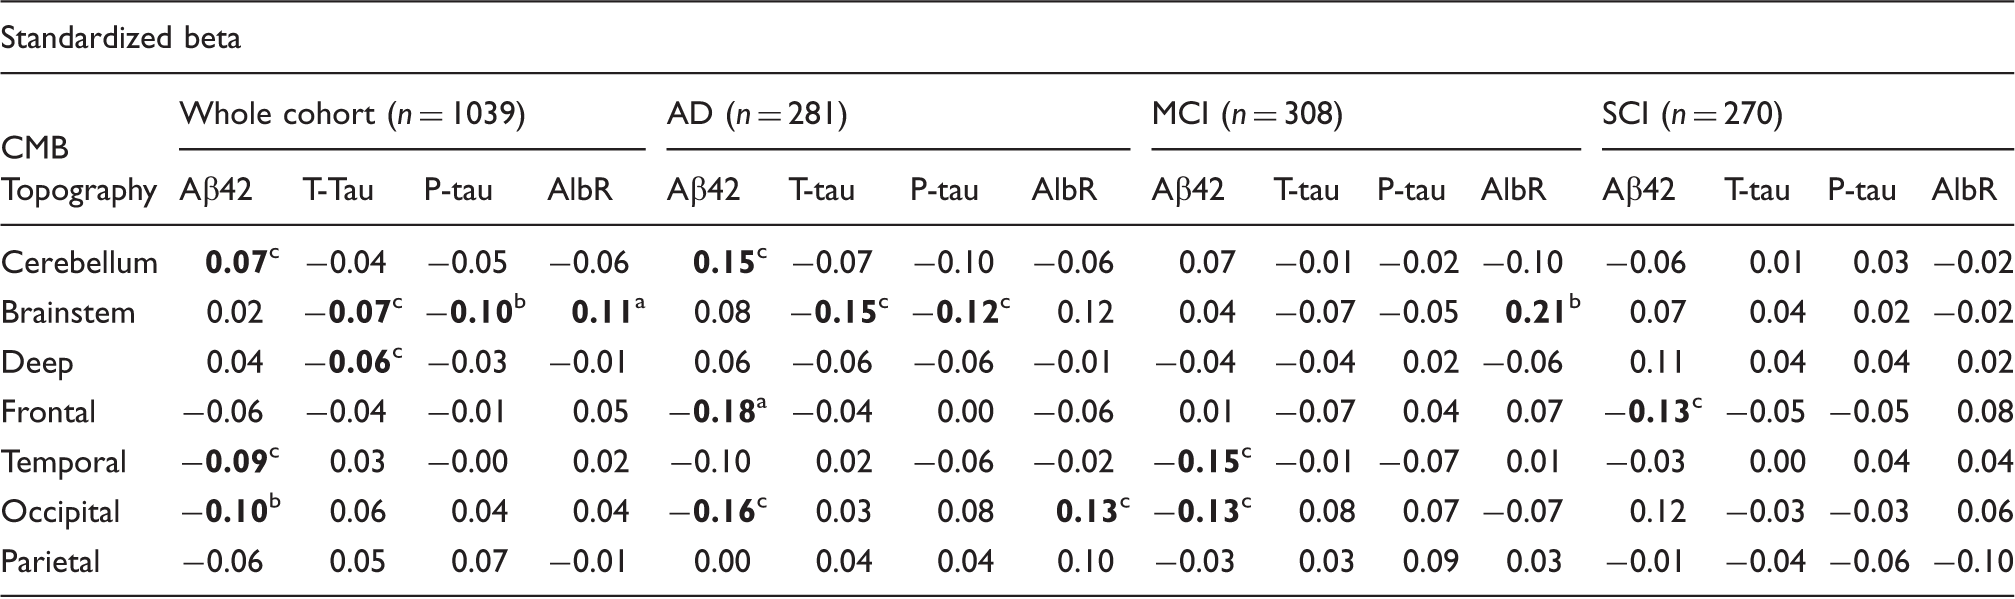
Multivariate linear regression analysis was performed to assess the association between CMB location and CSF biomarkers. Biomarkers were used as dependent variables, with first the crude topographies as independent variables in one model. In another model, biomarkers were analyzed as dependent variables with all the detailed topographies entered in one model. All topographies were dichotomous variables, and all analyses were adjusted for age, gender, hypertension, hyperlipidemia, diabetes, MRI field strength and CMB sequence (SWI/T2*). Values are presented as standardized betas. AlbR = CSF/serum albumin ratio. CMBs: cerebral microbleeds; AD: Alzheimer's Disease; MCI: Mild Cognitive Impairment; SCI: Subjective Cognitive Impairment.
Significant before and after Bonferroni correction: aP < 0.001.
Significant before Bonferroni correction: bP < 0.01; cP < 0.05.
In Alzheimer’s disease, Aβ42 levels were low with CMBs in frontal and occipital brain regions (significant before Bonferroni correction, P < 0.05) and were high with CMBs in the cerebellum (significant before Bonferroni correction, P = 0.02). T-tau and P-tau levels were low with CMBs in the brainstem (significant before Bonferroni correction, P < 0.05). CSF/serum albumin ratios were high with CMBs in the occipital lobe (significant before Bonferroni correction, P = 0.02).
In mild cognitive impairment, Aβ42 levels were likewise low with CMBs in the temporal and occipital lobe (significant before Bonferroni correction, P < 0.05). CSF/serum albumin ratios were high with CMBs in the brainstem (significant before Bonferroni correction, P = 0.002). In subjective cognitive impairment, Aβ42 levels were low with CMBs in the frontal lobe (significant before Bonferroni correction, P = 0.03).
Since lobar CMBs were significantly associated with lower Aβ42 levels in Alzheimer’s disease only, a separate linear regression analysis (controlled for MRI field strength and sequence) was performed on number of lobar CMBs and Aβ42 levels showing a strong association before and after Bonferroni correction (B = −0.004, P < 0.001) (Figure 2).
Aβ42 levels with number of lobar cerebral microbleeds. CMBs: cerebral microbleeds; CSF: cerebrospinal fluid.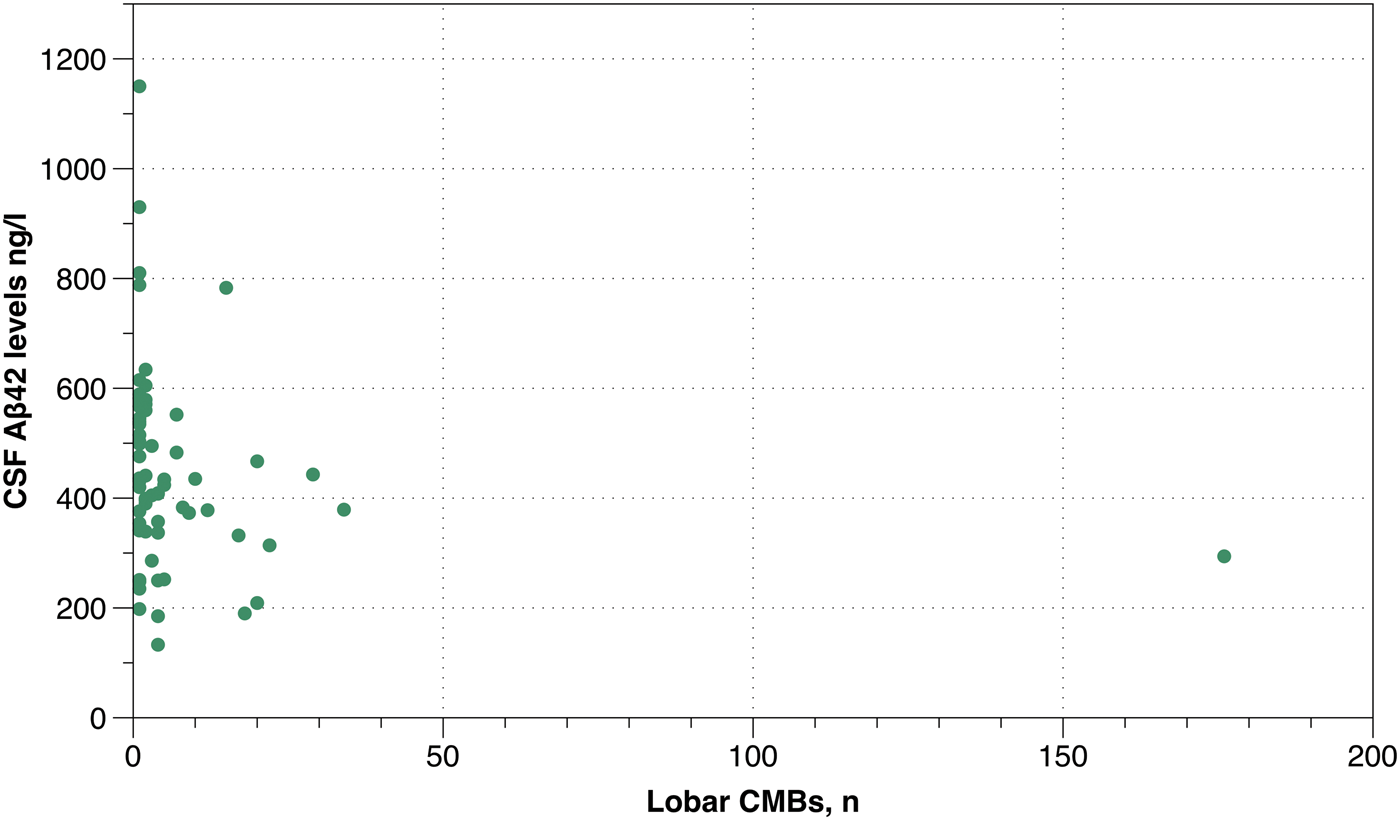
Multivariable logistic regression of the relationship between having lobar versus deep CMBs or CAA-related vs. non-CAA-related microbleeds and subcortical imaging markers of small vessel disease and CSF markers in the whole cohort.
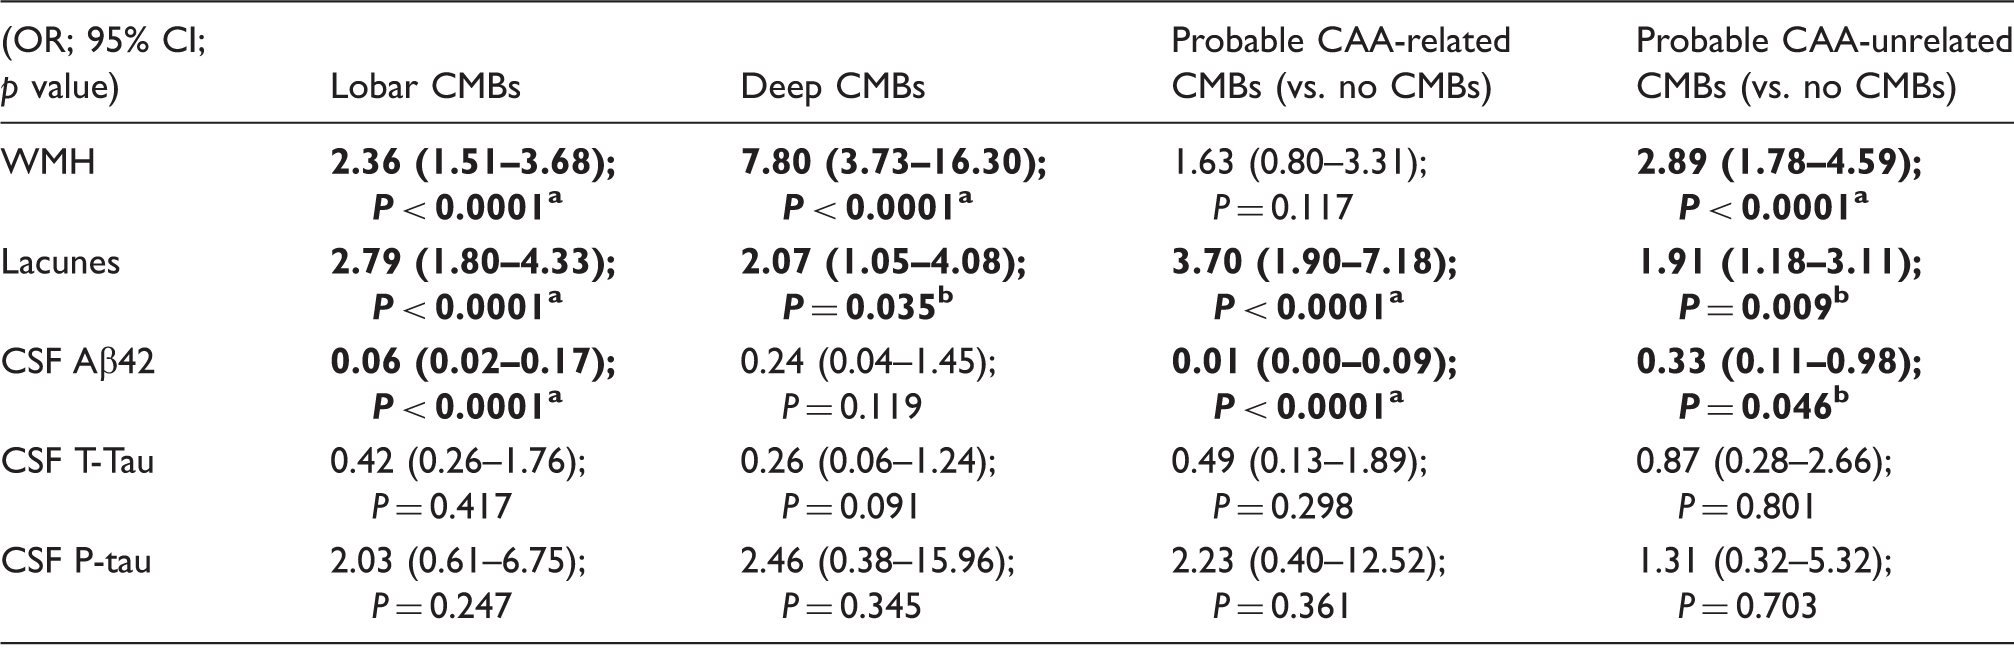
The models are adjusted for age, hypertension, diagnostic group, MRI field strength and CMB sequence. CMBs: cerebral microbleeds; CAA: cerebral amyloid angiopathy; WMH: white matter hyperintensities; CSF: cerebrospinal fluid.
Significant before and after Bonferroni correction.
Significant before Bonferroni correction.
Discussion
We show that lobar CMBs are most strongly associated with low Aβ42 levels and high CSF serum albumin ratios. Deep and infratentorial CMBs show the opposite tendency of being associated with higher Aβ42 levels and lower tau. Our findings provide further evidence of the differing pathogenesis of deep/infratentorial and lobar CMBs and suggest that lobar CMBs may be more of importance in the pathophysiology of cognitive impairment and dementia. CMBs show strongest associations in Alzheimer’s disease supporting the notion that CAA is common in, and perhaps may contribute to, the disease process.
Topographical distribution of CMBs on MRI and their relations with CSF biomarkers in cognitive impairment has only scarcely been studied. Prior studies have shown lower levels of Aβ42 with CMBs in memory clinic populations, Alzheimer’s disease, mild cognitive impairment and vascular dementia.8–10,15,22 Studies comparing patients with CAA and Alzheimer’s disease have shown lower Aβ4023 and Aβ42 levels 24 in CAA. Associations with T-tau and P-tau are ambiguous, however. Two studies so far have shown associated neurodegeneration with CMBs reflected by an increase in both T-tau and P-tau with multiple CMBs 9 and an increase in P-tau with lobar CMBs. 22 A decrease in T-tau and P-tau with multiple CMBs has also been seen, especially pronounced in patients with vascular dementia and Alzheimer’s disease with hypertension. 15 Other studies have shown no association between CMBs and CSF T-tau and P-tau levels.8,10,25
Prior studies have shown relations of deep and infratentorial CMBs with hypertensive arteriopathy11,26–28 and lipofibrohyalinosis-associated histopathological findings. 29 Similarly, PET-studies with the Pittsburgh compound B (PiB), have shown increased retention of PiB with CAA-caused CMBs.3,30,31 In cognitively normal controls, PiB retention has been shown to correlate with CMBs in lobar regions but not in deep regions. 28 This is in line with our findings, and our results suggest that CSF profiles vary depending on CMB etiology. We show associations between low Aβ42 levels and probable CAA-related CMBs, and no association with probable CAA-unrelated CMBs. The association in Alzheimer’s disease with lobar CMBs was especially strong, reasonably due to the overlap of CAA and Alzheimer’s pathology, and suggests that Aβ42 deposition, and perhaps also clearance, may be worse in patients that clearly manifest both diseases. We further demonstrate that other markers of small vessel disease, lacunes and WMH, most probably are signs of both hypertensive arteriopathy and CAA. 32 CAA has further been shown to favor posterior brain structures and especially the temporal and occipital lobe, with aggressive CAA most frequently favoring the occipital lobe.11–14,33 This was something we demonstrated, showing a tendency for low Aβ42 levels, and high CSF/serum albumin ratios, reflecting a disrupted blood–brain barrier, with CMBs in the occipital lobe. Most notably, occipital CMBs affected the blood–brain barrier in Alzheimer’s disease only, suggesting the important role of CAA in Alzheimer’s disease, and that these processes may inter-relate. Since lobar CMBs were associated with low Aβ42 levels throughout a continuum of cognitive impairment, this further suggests that CAA increases with increasing cognitive impairment, finally even leading to a damaged blood–brain barrier in Alzheimer’s disease.
Deep and infratentorial CMBs showed tendencies to be associated with low T-tau and P-tau levels, and high Aβ42 levels, this further supports the view of differing pathology for these lesions. Deep and infratentorial CMBs may, due to their underlying etiology, presumably not be accompanied by as much neuronal degeneration and amyloid load in the brain. This finding further emphasizes the importance of CMB topography in the dementia disease pathology and suggests that deep and infratentorial CMBs may be more of a benign lesion not in itself affecting Aβ42 levels, and thus dementia disease progression (although they may still be of clinical relevance due to the risk of ICH). Thus, our results suggest that studies with CMBs as a disease biomarker in cognitive impairment should focus on lobar CMBs.
The main importance of our study is in confirming the differing CSF profiles for CMBs of different distribution. By doing so, one of our main aims was to decrease the gap between neuroradiological interpretation, including topography-based classification of CMBs, and associations with clinical parameters. Our study benefits from a large cohort with a continuum of cognitive impairment. Limitations include the use of different MRI scanners and CMB sequences, which, however, was controlled for in our regression analyses. Additionally, Aβ40 was not included in our routine CSF biomarker protocol and would have been of interest to analyze.
We confirm that CMB distribution is associated with different patterns of CSF biomarkers, supporting the differing pathogenesis of deep/infratentorial and lobar CMBs.
Footnotes
Funding
The author(s) disclosed receipt of the following financial support for the research, authorship, and/or publication of this article: Stockholm County Council, Karolinska Institutet and the Swedish Dementia Association.
Declaration of conflicting interests
The author(s) declared no potential conflicts of interest with respect to the research, authorship, and/or publication of this article.
Authors’ contributions
SS established the database, planned the study, analyzed all MR images, did the statistical data analysis and drafted the manuscript. TG planned the study, did a pilot study to determine final cohort size, analyzed the data and established the database. JM analyzed the MR images and planned the study. AC planned the study and did statistical data analysis. XL planned the study. MS established the database and did statistical data analysis. SMF did statistical data analysis. LC planned the study. PA planned the study and had main responsibility. MKW planned the study and had main responsibility for MRI scanner logistics in patient recruitment. LOW planned the study and had the main responsibility in patient recruitment. All authors contributed to the interpretation of data and revised the manuscript. SS is guarantor.
References
Supplementary Material
Please find the following supplemental material available below.
For Open Access articles published under a Creative Commons License, all supplemental material carries the same license as the article it is associated with.
For non-Open Access articles published, all supplemental material carries a non-exclusive license, and permission requests for re-use of supplemental material or any part of supplemental material shall be sent directly to the copyright owner as specified in the copyright notice associated with the article.