
Abstract
Multimodal neuromonitoring in neurocritical care increasingly includes electrocorticography to measure epileptic events and spreading depolarizations. Spreading depolarization causes spreading depression of activity (=isoelectricity) in electrically active tissue. If the depression is long-lasting, further spreading depolarizations occur in still isoelectric tissue where no activity can be suppressed. Such spreading depolarizations are termed isoelectric and are assumed to indicate energy compromise. However, experimental and clinical recordings suggest that long-lasting spreading depolarization-induced depression and isoelectric spreading depolarizations are often recorded outside of the actual ischemic zones, allowing the remote diagnosis of delayed cerebral ischemia after aneurysmal subarachnoid hemorrhage. Here, we analyzed simultaneous electrocorticography and tissue partial pressure of oxygen recording in 33 aneurysmal subarachnoid hemorrhage patients. Multiple regression showed that both peak total depression duration per recording day and mean baseline tissue partial pressure of oxygen were independent predictors of outcome. Moreover, tissue partial pressure of oxygen preceding spreading depolarization was similar and differences in tissue partial pressure of oxygen responses to spreading depolarization were only subtle between isoelectric spreading depolarizations and spreading depressions. This further supports that, similar to clustering of spreading depolarizations, long spreading depolarization-induced periods of isoelectricity are useful to detect energy compromise remotely, which is valuable because the exact location of future developing pathology is unknown at the time when the neurosurgeon implants recording devices.
Keywords
Introduction
Multimodal monitoring is routinely applied in neurocritical care, but it is not clear which of the continuously collected measures are the most clinically relevant, how and when they should be recorded in order to target individualized care, what are the appropriate interventions to restore physiology, and whether this impacts outcome. 1 The most widely used measures are currently intracranial pressure (ICP), brain perfusion, brain oxygen availability (measured as tissue partial pressure of oxygen [ptiO2]) and scalp electroencephalography (EEG) or, respectively, invasive electrocorticography (ECoG).
An application of multimodal monitoring with particular importance is the detection of delayed cerebral ischemia (DCI) after aneurysmal subarachnoid hemorrhage (aSAH). DCI occurs with a peak incidence around the seventh day after the initial hemorrhage, while the patient is already on the neurointensive care unit. The clinical signs of DCI are global and focal neurological deficits, which lead to significant deterioration in functional outcome. 2 However, neurological assessment is largely limited because many patients are ventilated and analgosedated at the time when DCI occurs. Thereby, diagnosis and treatment of DCI are often delayed. Development of meaningful real-time neuromonitoring tools is hence of paramount importance to detect DCI earlier.
In the present study, in patients with aSAH, ICP, mean arterial pressure (MAP), and ptiO2 were recorded according to usual standards, and cerebral perfusion pressure (CPP) was calculated. In addition, ECoG was performed using a subdural recording strip as reported previously.3,4 The subdural strip allowed the measurement of both ictal epileptic events (IEE) and spreading depolarizations (SDs) (Figure 1). We then investigated whether there are associations between patient outcome and the different multimodal monitoring parameters.
SD-induced spreading depression, isoelectric SD and IEE. (a) SD was observed in the near-DC-ECoG (bandpass: 0.01–0.05 Hz) as the consecutive onset of a polyphasic SPC in neighboring ECoG channels (upper three traces of left and middle column). In contrast to DC and near-DC changes that define the phenomenon of SD, spontaneous and evoked electrical activity of the brain is observed in the AC range of the ECoG above ∼0.5 Hz (lower two traces). Note that the upper three traces and lower two traces of each column were recorded simultaneously with the same electrodes. In electrically active tissue, SD typically causes spreading depression of spontaneous activity (lower two traces, left column). This is observed in neighboring ECoG channels as a rapidly developing reduction in amplitude of the AC-ECoG activity (bandpass: 0.5–45 Hz).
4
On this basis, SDs in electrically active tissue received the epithet “spreading depression.” By contrast, SDs measured in a zone of electrically inactive tissue were denoted with the adjective “isoelectric” (upper and lower traces of the middle column).
5
IEEs were defined as any spikes, sharp-waves, or sharp-and-slow wave complexes lasting for 10 s or more at either a frequency of at least 3/s or a frequency of at least 1/s with clear evolution in frequency, morphology, or location (upper and lower traces of the right column). (b) SD-induced spreading depression durations were scored beginning at the initial decrease in the integral of the AC-ECoG power (60 s decay time constant) and ending at the start of the recovery phase (cf. broken line).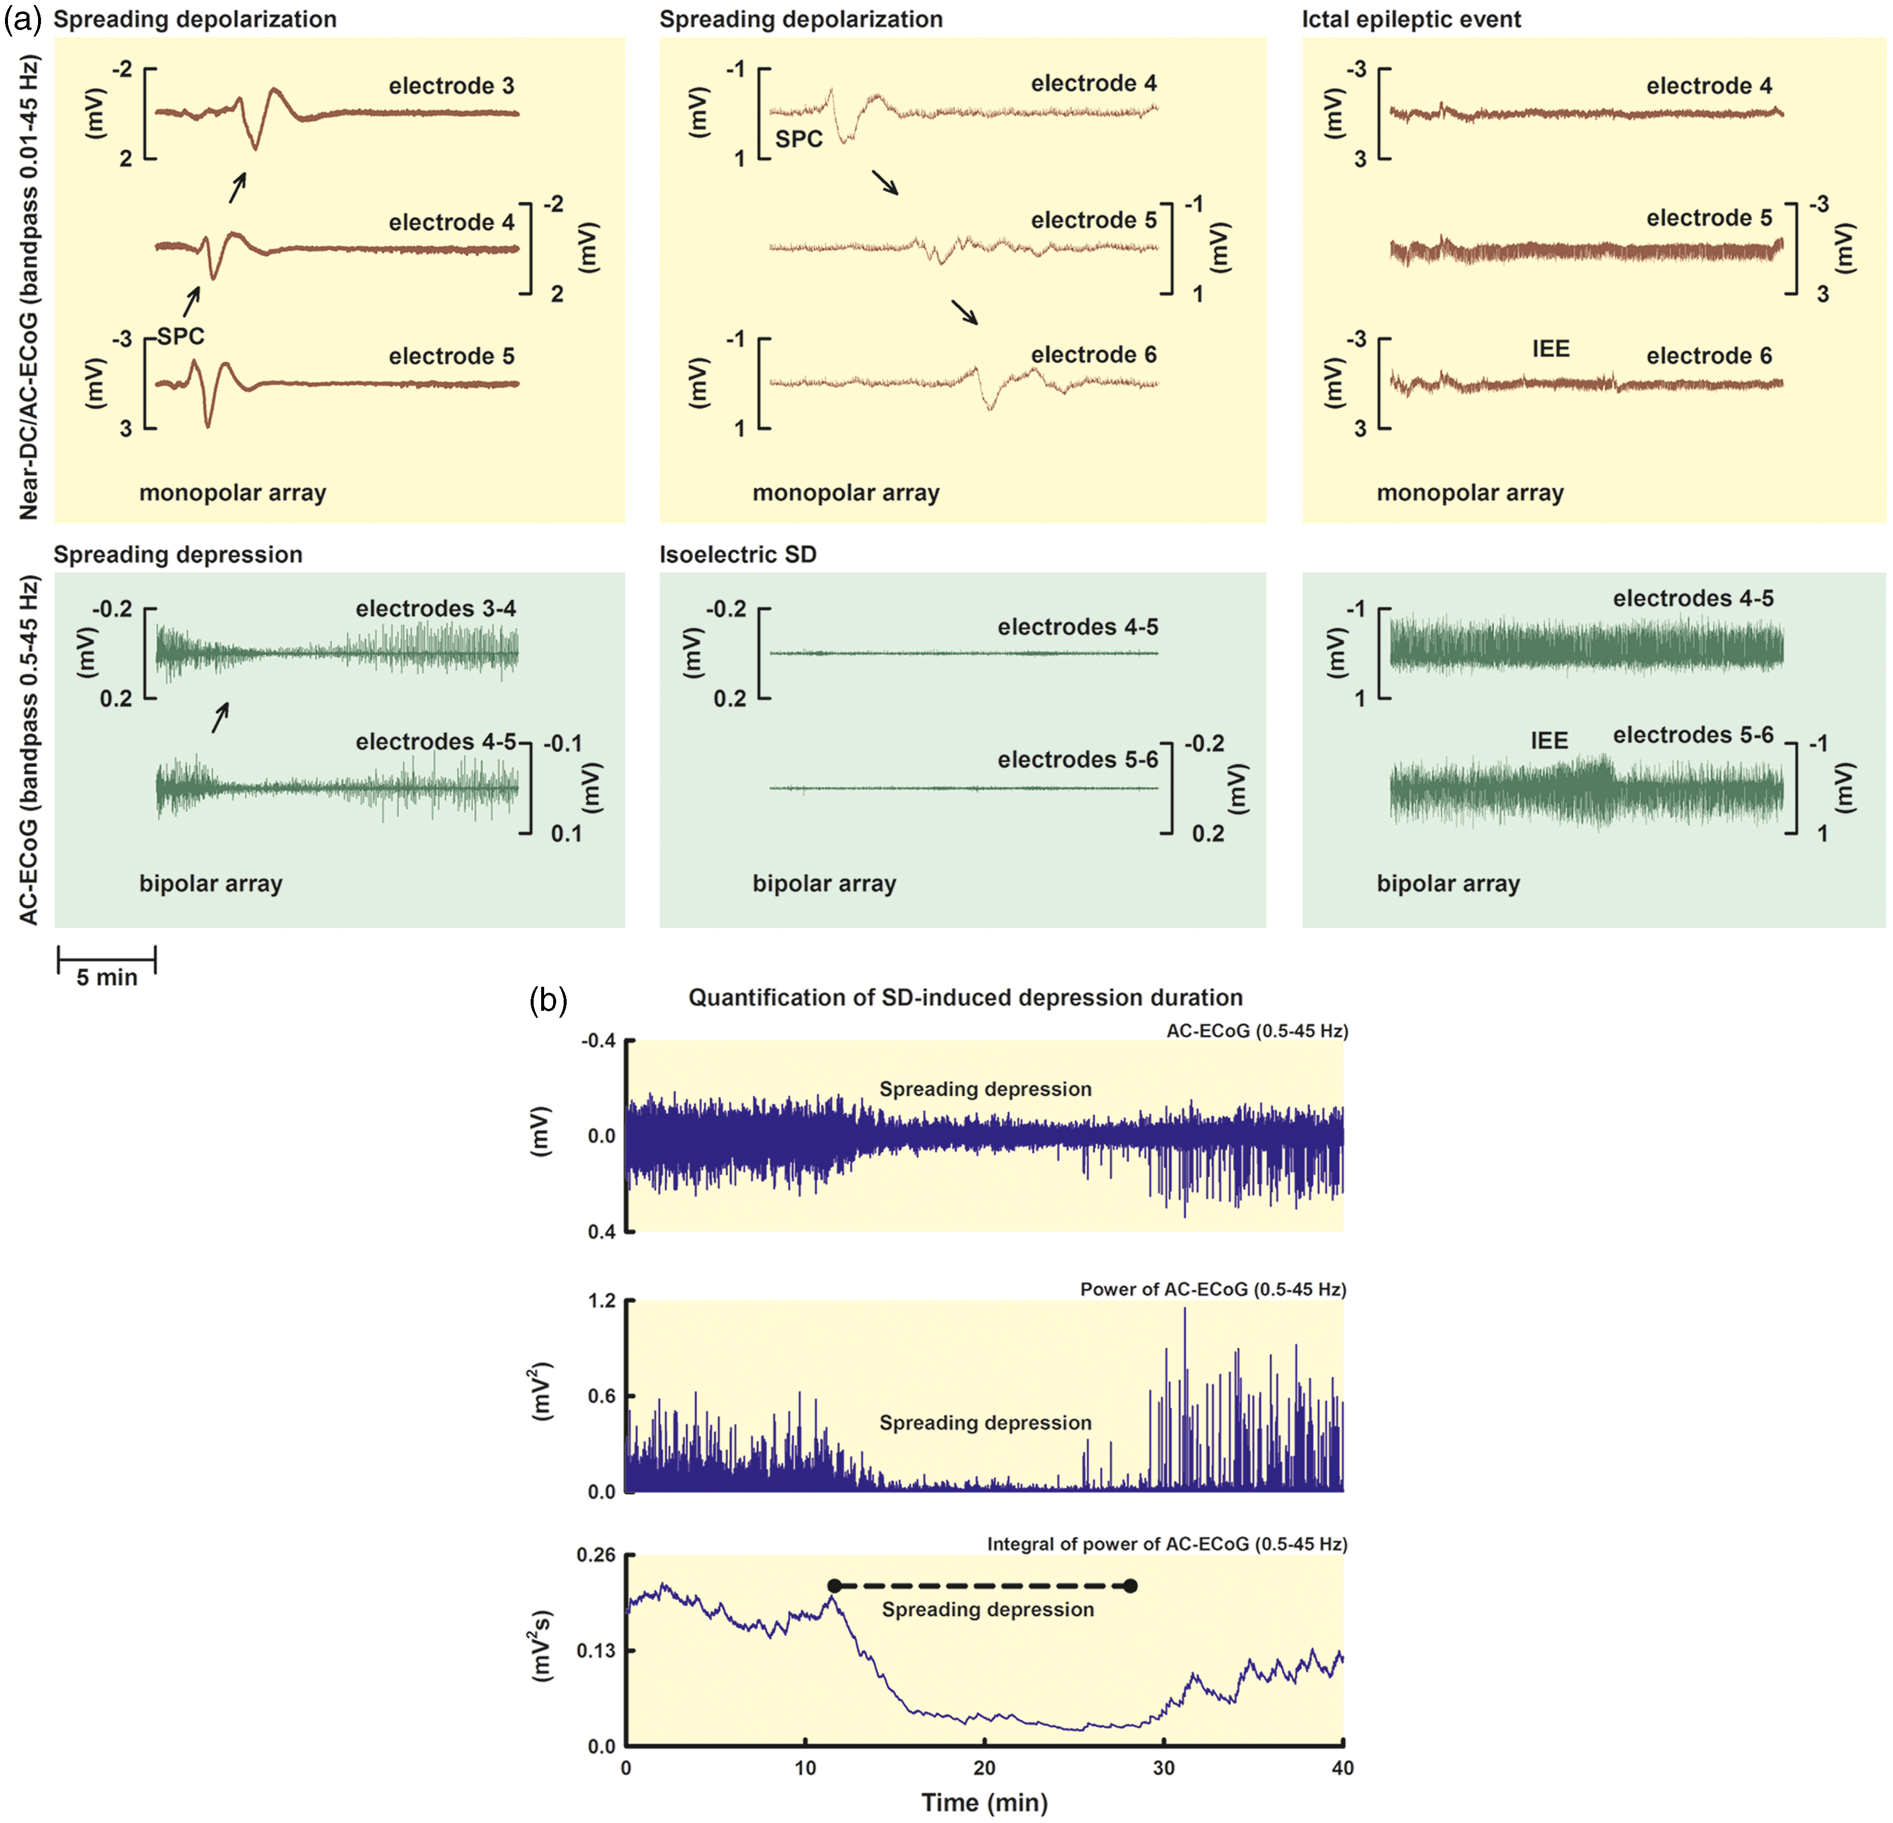
Among the SD-related parameters analyzed was in particular the SD-induced total depression duration per recording day (TDDD). 3 As explained in more detail in the methods, this variable is a cumulative measure of the SD-induced spreading depression durations per recording day (cf. left column in Figure 1(a) for SD-induced spreading depression). Moreover, the number of SDs per recording day was counted. SDs in electrically active tissue received the epithet “spreading depression,” whereas SDs measured in a zone of electrically inactive tissue were denoted with the adjective “isoelectric” (cf. middle column in Figure 1(a)). 5 ptiO2 responses to SD were compared between spreading depressions and isoelectric SDs.
The study focused on the relationship between SD and ptiO2 because: (i) it was recently shown that SDs occur abundantly in a number of relevant conditions of neurocritical care including traumatic brain injury (TBI),6,7 intracerebral spontaneous hematoma, 8 aSAH, 4 and malignant hemispheric stroke9,10; (ii) decreased ptiO2 is assumed as a risk factor for poor outcome in patients with aSAH and TBI11–13; (iii) decreased ptiO2 may importantly contribute to the ignition of SD; 14 (iv) SDs can in turn lead to pronounced drops of ptiO2 in animals and patients;15–19 (v) the latter might explain at least a fraction of the CPP-independent ptiO2 drops in patients with aSAH and TBI.15,20,21
Methods
General
Thirty-three patients were prospectively enrolled between September 2009 and August 2013 at two participating centers of the Co-Operative Studies on Brain Injury Depolarizations (COSBID): 9 of 118 screened patients with subarachnoid hemorrhage at Campus Benjamin Franklin and 24 of 210 screened patients with subarachnoid hemorrhage at Campus Virchow Klinikum (Charité University Medicine Berlin, Berlin, Germany). Four of the 33 cases were previously reported in a pilot study on correlates of SD in scalp EEG recordings. 22 Inclusion criteria were: (i) age (≥18 years); (ii) World Federation of Neurosurgical Societies (WFNS) grade I–V; (iii) ruptured saccular aneurysm proven by computed tomography (CT)-angiography or digital subtraction angiography; (iv) symptom onset within the preceding 72 h; and (v) either surgical treatment of the aneurysm via craniotomy or, in coiled patients, burr hole trepanation for placement of a ventricular drain or oxygen sensor, which allows the simultaneous placement of a subdural electrode strip,15,23,24 and (vi) the decision of the neurosurgeon to implant a Clark-type intraparenchymal sensor that measures ptiO2 and brain temperature (Licox CC1P1, Integra Lifesciences Corporation, Plainsboro, NJ, USA). Exclusion criteria were subarachnoid hemorrhage due to other causes (e.g. trauma, fusiform or mycotic aneurysm), admission in a clinical state with unfavorable prognosis (e.g., wide, nonreactive pupils for more than 1 h), bleeding diathesis or pregnancy, unavailability of the monitoring equipment, and refusal of the patient or legal representative to participate in the study. All 33 consecutively recruited patients were analyzed. The research protocol was approved by the local ethics committee of the Charité University Medicine Berlin. Either informed consent or surrogate informed consent was obtained for all patients. Research was conducted in accordance with the Declaration of Helsinki.
Aneurysmal SAH was diagnosed through interdisciplinary assessment of CT scans by a neuroradiologist and a neurosurgeon. Hemorrhage was graded according to the original Fisher scale, 25 and clinical presentation on admission according to the WFNS scale. A study neurologist or neurosurgeon performed a neurological and general medical evaluation on admission. Baseline demographic data and clinical signs and symptoms of the initial hemorrhage were recorded. The aneurysm was assessed using four-vessel digital subtraction angiography, or a more restricted study when indicated.
After treatment of the aneurysm by either clip ligation or endovascular coil embolization, all patients were transferred to the intensive care unit where the continuous neuromonitoring data were acquired for up to 15 days. Glasgow Coma Score, blood gases, glucose, and electrolytes were documented at least every 6 h. A thorough neurological examination was performed at least daily. Oral nimodipine was given prophylactically. Transcranial Doppler sonography was performed daily as described previously. 3 Whenever necessary, serial CT scans were performed at times of clinical deterioration. At the conclusion of the monitoring period, the electrode strip was removed at the bedside by gentle traction. Clinical outcome was assessed at six months according to the extended Glasgow Outcome Scale (eGOS, 1–8) by either a neurologist, a neurosurgeon, or a trained study nurse. The large majority of survivors was seen and interviewed in person.
Recording of neuromonitoring data
For the continuous ECoG recordings, a linear, six-contact platinum electrode strip (Wyler, 5-mm diameter; Ad-Tech Medical, Racine, Wisconsin, USA) was placed on cerebral cortex accessible either through craniotomy during aneurysm surgery or via a burr hole as described previously.3,4,15 The near-direct current (DC)/alternate current (AC)-ECoG was recorded in five active channels from the six-contact linear electrode array (inter-electrode distance 1 cm) with electrodes connected in sequential bipolar fashion to a GT205 amplifier (0.01–45 Hz) (ADInstruments, New South Wales, Australia). Moreover, a subdermal platinum needle electrode was placed over the hemisphere ipsilateral to the recording strip. Each electrode of the recording strip was then referenced to the subdermal platinum electrode, allowing recordings in monopolar fashion in addition to the bipolar recordings (Figure 1). Data were sampled at 200 Hz and recorded and analyzed with a Powerlab 16/SP analog/digital converter and Chart-7 software (ADInstruments, New South Wales, Australia). The oxygen sensor has an outer diameter of 0.65 mm at the probe tip. Whenever possible, it was aimed at inserting the probe directly under the brain surface within less than 9 mm of the central electrodes of the recording strip.15,16 The sensor samples ptiO2 in cortical and subcortical tissues within a radius between 7 and 15 mm2. 26 ICP was monitored via ventricular drainage catheter or ICP transducer (Codman or Camino systems). The systemic arterial pressure was continuously recorded via a catheter in the radial artery.
Analysis of neuromonitoring data
In accordance with the analytical framework and characteristics described previously by the COSBID group,4,8 SD was observed in the near-DC-ECoG (bandpass: 0.01–0.05 Hz) as the consecutive onset of a polyphasic slow potential change (SPC) in neighboring ECoG channels. ECoG and ptiO2 analyses were performed by MW, blinded to the clinical courses and neuroimaging findings and were discussed with JD.
In contrast to DC and near-DC changes that define the phenomenon of SD, spontaneous and evoked electrical activity of the brain is observed in the AC range of the ECoG above ∼0.5 Hz. In electrically active tissue, SD typically causes spreading depression of spontaneous activity. This is observed in neighboring ECoG channels as a rapidly developing reduction in amplitude, power, and integral of the power of the AC-ECoG activity (bandpass: 0.5–45 Hz).
4
Depression durations of SD were scored beginning at the initial decrease in the integral of the AC-ECoG power (60 s decay time constant) and ending at the start of the recovery phase as described previously and shown in Figure 1(b).
4
Depression periods were scored in each of the five bipolar ECoG channels (electrode 1–2, 2–3, 3–4, 4–5, and 5–6) to determine the longest recorded depression duration of all channels for each SD in minutes. Only depressions observed to be induced by SD were included. The total depression duration of each 24-h period following the initial hemorrhage was then calculated as the sum of the longest depression durations of all individual SDs during that 24-h period. If there was temporal overlap between depression durations of successive SDs on different electrodes, the overlapping period was only counted once. The first 24-h period was denoted as “day 0,” the second 24-h period as “day 1,” and so on.
3
Subsequently, the total depression duration of each day (TDDD) was defined as the value after normalization to the total time of valid recordings during that 24-h period. For instance, if 240 min (4 h) of total depression duration were recorded in 22 h of a 24-h period, the normalized TDDD was 262 min ((4/22) × 24 × 60). The peak total depression duration per recording day (PTDDD) was then defined as the longest TDDD among all recording days in a given patient. An example case with TDDDs and PTDDD is shown in Figure 2(a).
Example time course of TDDD in a patient; three different types of ptiO2 responses to SD. (a) shows an example time course of the TDDD in a patient who was admitted in a relatively good status (WFNS 2), developed a severe cluster of 35 SDs starting on day 5 and died on day 10. The PTDDD was observed on day 6. Neuroimaging on day 7 revealed large delayed infarcts in the left middle cerebral artery and posterior cerebral artery territories. (b) Near-DC/AC-ECoG in the upper two blue traces and ptiO2 in the lower red trace were simultaneously recorded over periods of 20 min in the three panels. In the left panel, the SD (identified by the large SPC) propagates from electrode 3 to 4. The black arrow indicates the direction of propagation. The intraparenchymal oxygen sensor was located approximately between electrodes 3 and 4 in the left panel. ptiO2 displays an initially hypoxic response to SD. The middle panel shows an initially hyperoxic response to SD, whereas no clear ptiO2 response to SD was observed in the example traces on the right.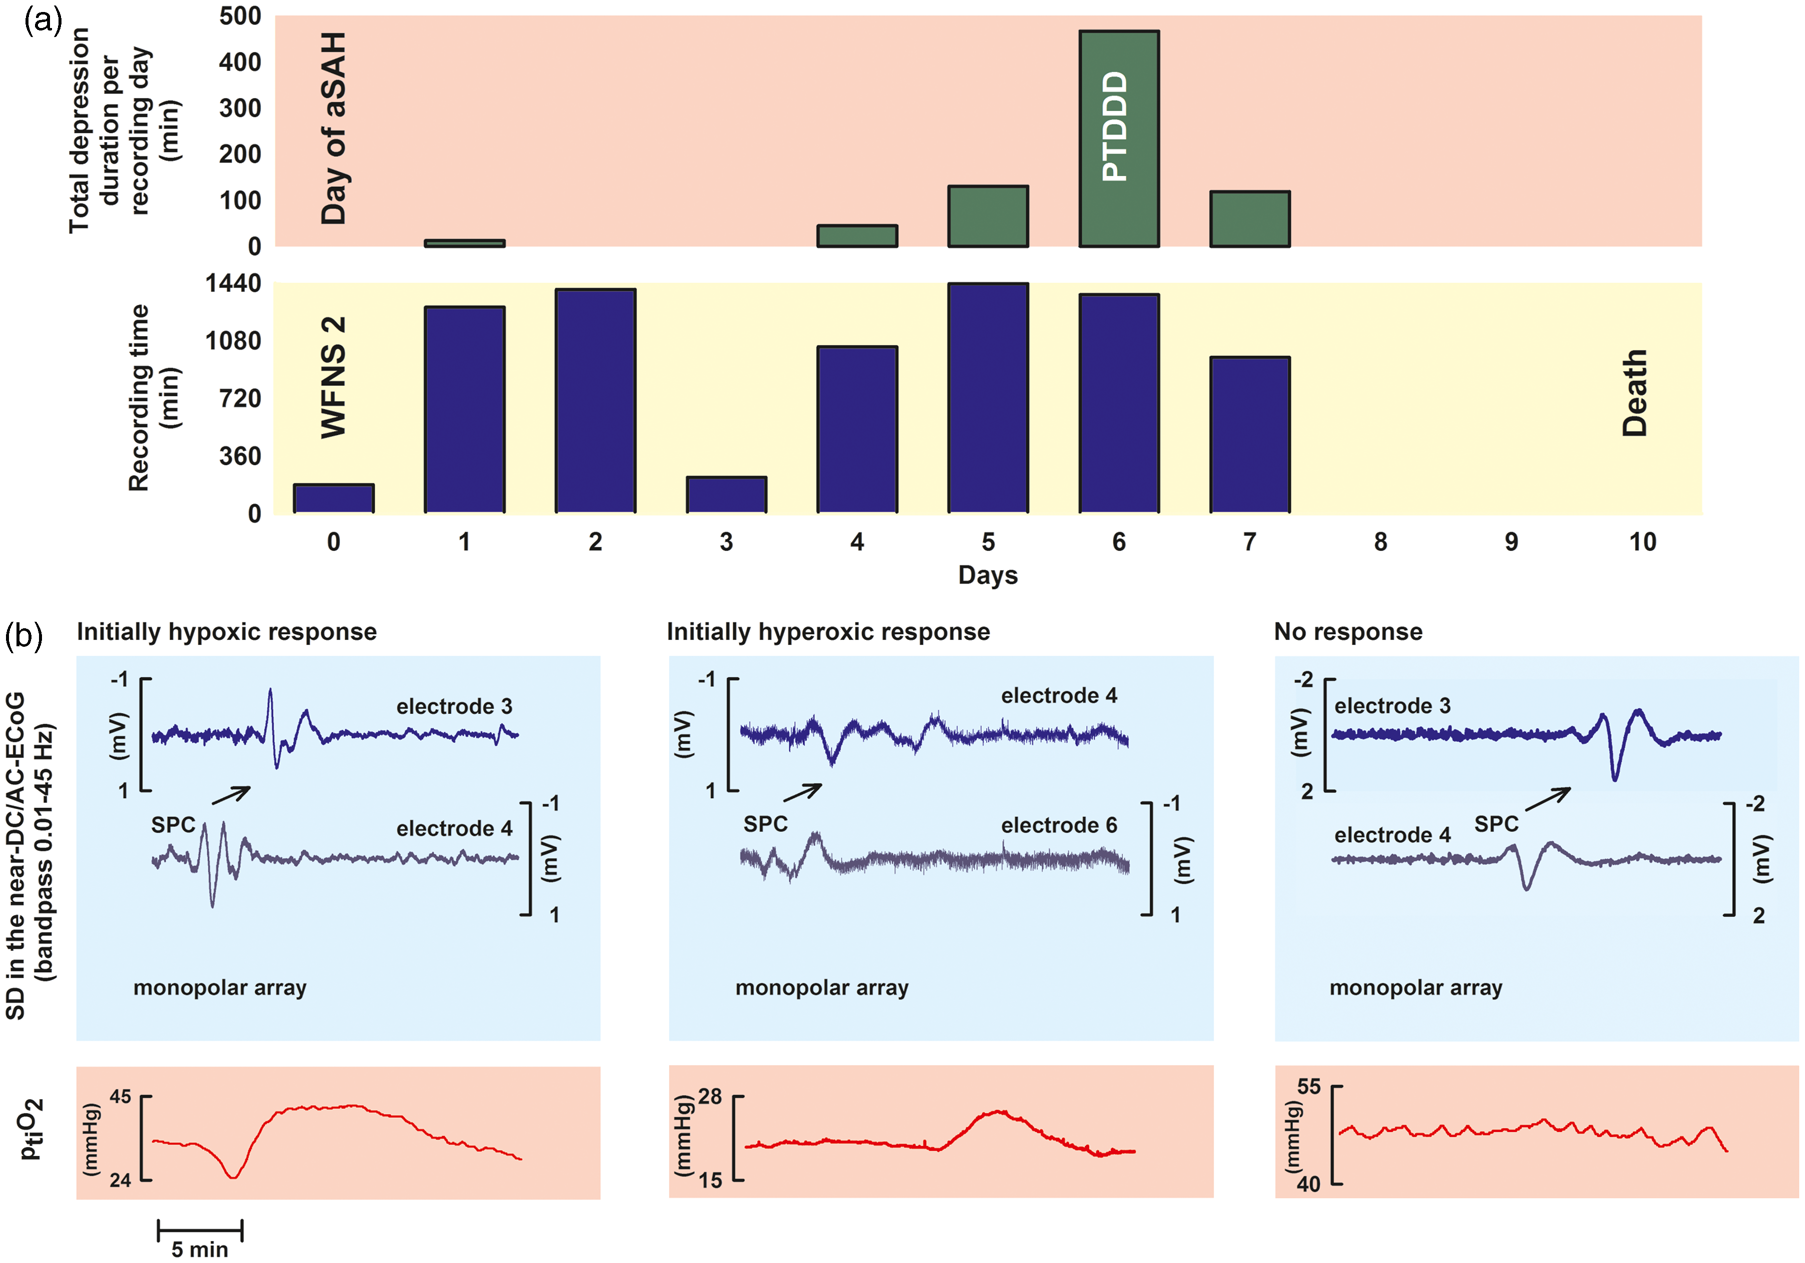
We analyzed the ptiO2 level immediately preceding SD and the initial change of ptiO2 in response to SD, which could either show a decrease, no change, or an increase (Figure 2(b)). The ptiO2 level immediately preceding SD was defined as the mean ptiO2 level in the 5-min period prior to each SD as described previously. 14 ptiO2 responses to SD were accepted as coregistrations in a small range of ≤6 min around time points of SD appearance as described previously. 16
In addition, mean baseline values of ptiO2, CPP, MAP, ICP, brain temperature, and heart rate were determined at regular intervals of four hours during the whole monitoring period. They were measured as mean values over a 10-min period unless an SD or IEE occurred within 1 h around this period.
IEEs were defined as any spikes, sharp-waves, or sharp-and-slow wave complexes lasting for 10 s or more at either a frequency of at least 3/s or a frequency of at least 1/s with clear evolution in frequency, morphology, or location as visualized by an increase in the AC-ECoG power and integral of the power.3,27,28 It may be added, though, that the incidence of IEEs was even lower than in our previous studies. Only one patient displayed one IEE although, as in the previous studies, no antiepileptic prophylaxis was performed.3,29
Statistics
Data are given as median (1st, 3rd quartile). In the figures, the whiskers (error bars) above and below the box indicate the 90th and 10th percentiles. P ≤ 0.05 was accepted as statistically significant. Normal distribution was assessed by inspection of skewness and kurtosis (both between −1 and 1 lead to acceptance of normal distribution). Further details of the statistical analysis are given in the results section.
Results
The combination of a low PTDDD and a high mean baseline ptiO2 level is associated with a good patient outcome
Twenty-six of the aSAH patients of our study population were female and seven were male. The median age was 56 [48, 62] [1st quartile, 3rd quartile] years. Patients mostly suffered from severe aSAH (median WFNS grade: 4 [2, 5], n = 33). Outcome (eGOS) at six months was available in 28 patients. The median outcome was poor (3 [1, 6]), and 13 of the 28 patients died. Figure 3 shows the time courses of the TDDDs, mean baseline ptiO2, mean baseline CPP, mean baseline MAP, mean baseline ICP, and mean baseline brain temperature over the first 11 days after the initial hemorrhage.
Time courses of TDDDs, mean baseline ptiO2, mean baseline CPP, mean baseline MAP, mean baseline ICP and mean baseline brain temperature per recording day over the first 11 days after aSAH. Mean baseline values of continuously recorded ptiO2, CPP, MAP, ICP, and brain temperature were determined at regular intervals of 4 h during the whole monitoring period. They were measured as mean values over a 10-min period unless SD or IEE occurred within 1 h around this period. In each patient, the medians of each recording day were calculated for each variable from the mean baseline values during that day. The boxplots show how these medians per recording day were distributed in our patient population over time (n = 33 patients). The whiskers (error bars) above and below the box indicate the 90th and 10th percentiles. Note that the TDDD displayed an early peak during the first 48 h and a second peak between 96 and 168 h after the initial hemorrhage. However, this did not reach statistical significance. Mean baseline CPP and MAP significantly increased during the clinical course, which was iatrogenic (P < 0.05, Kruskal–Wallis One Way Analysis of Variance on Ranks with post-hoc Dunn’s test, details in figure). The other variables demonstrated only minor changes over time.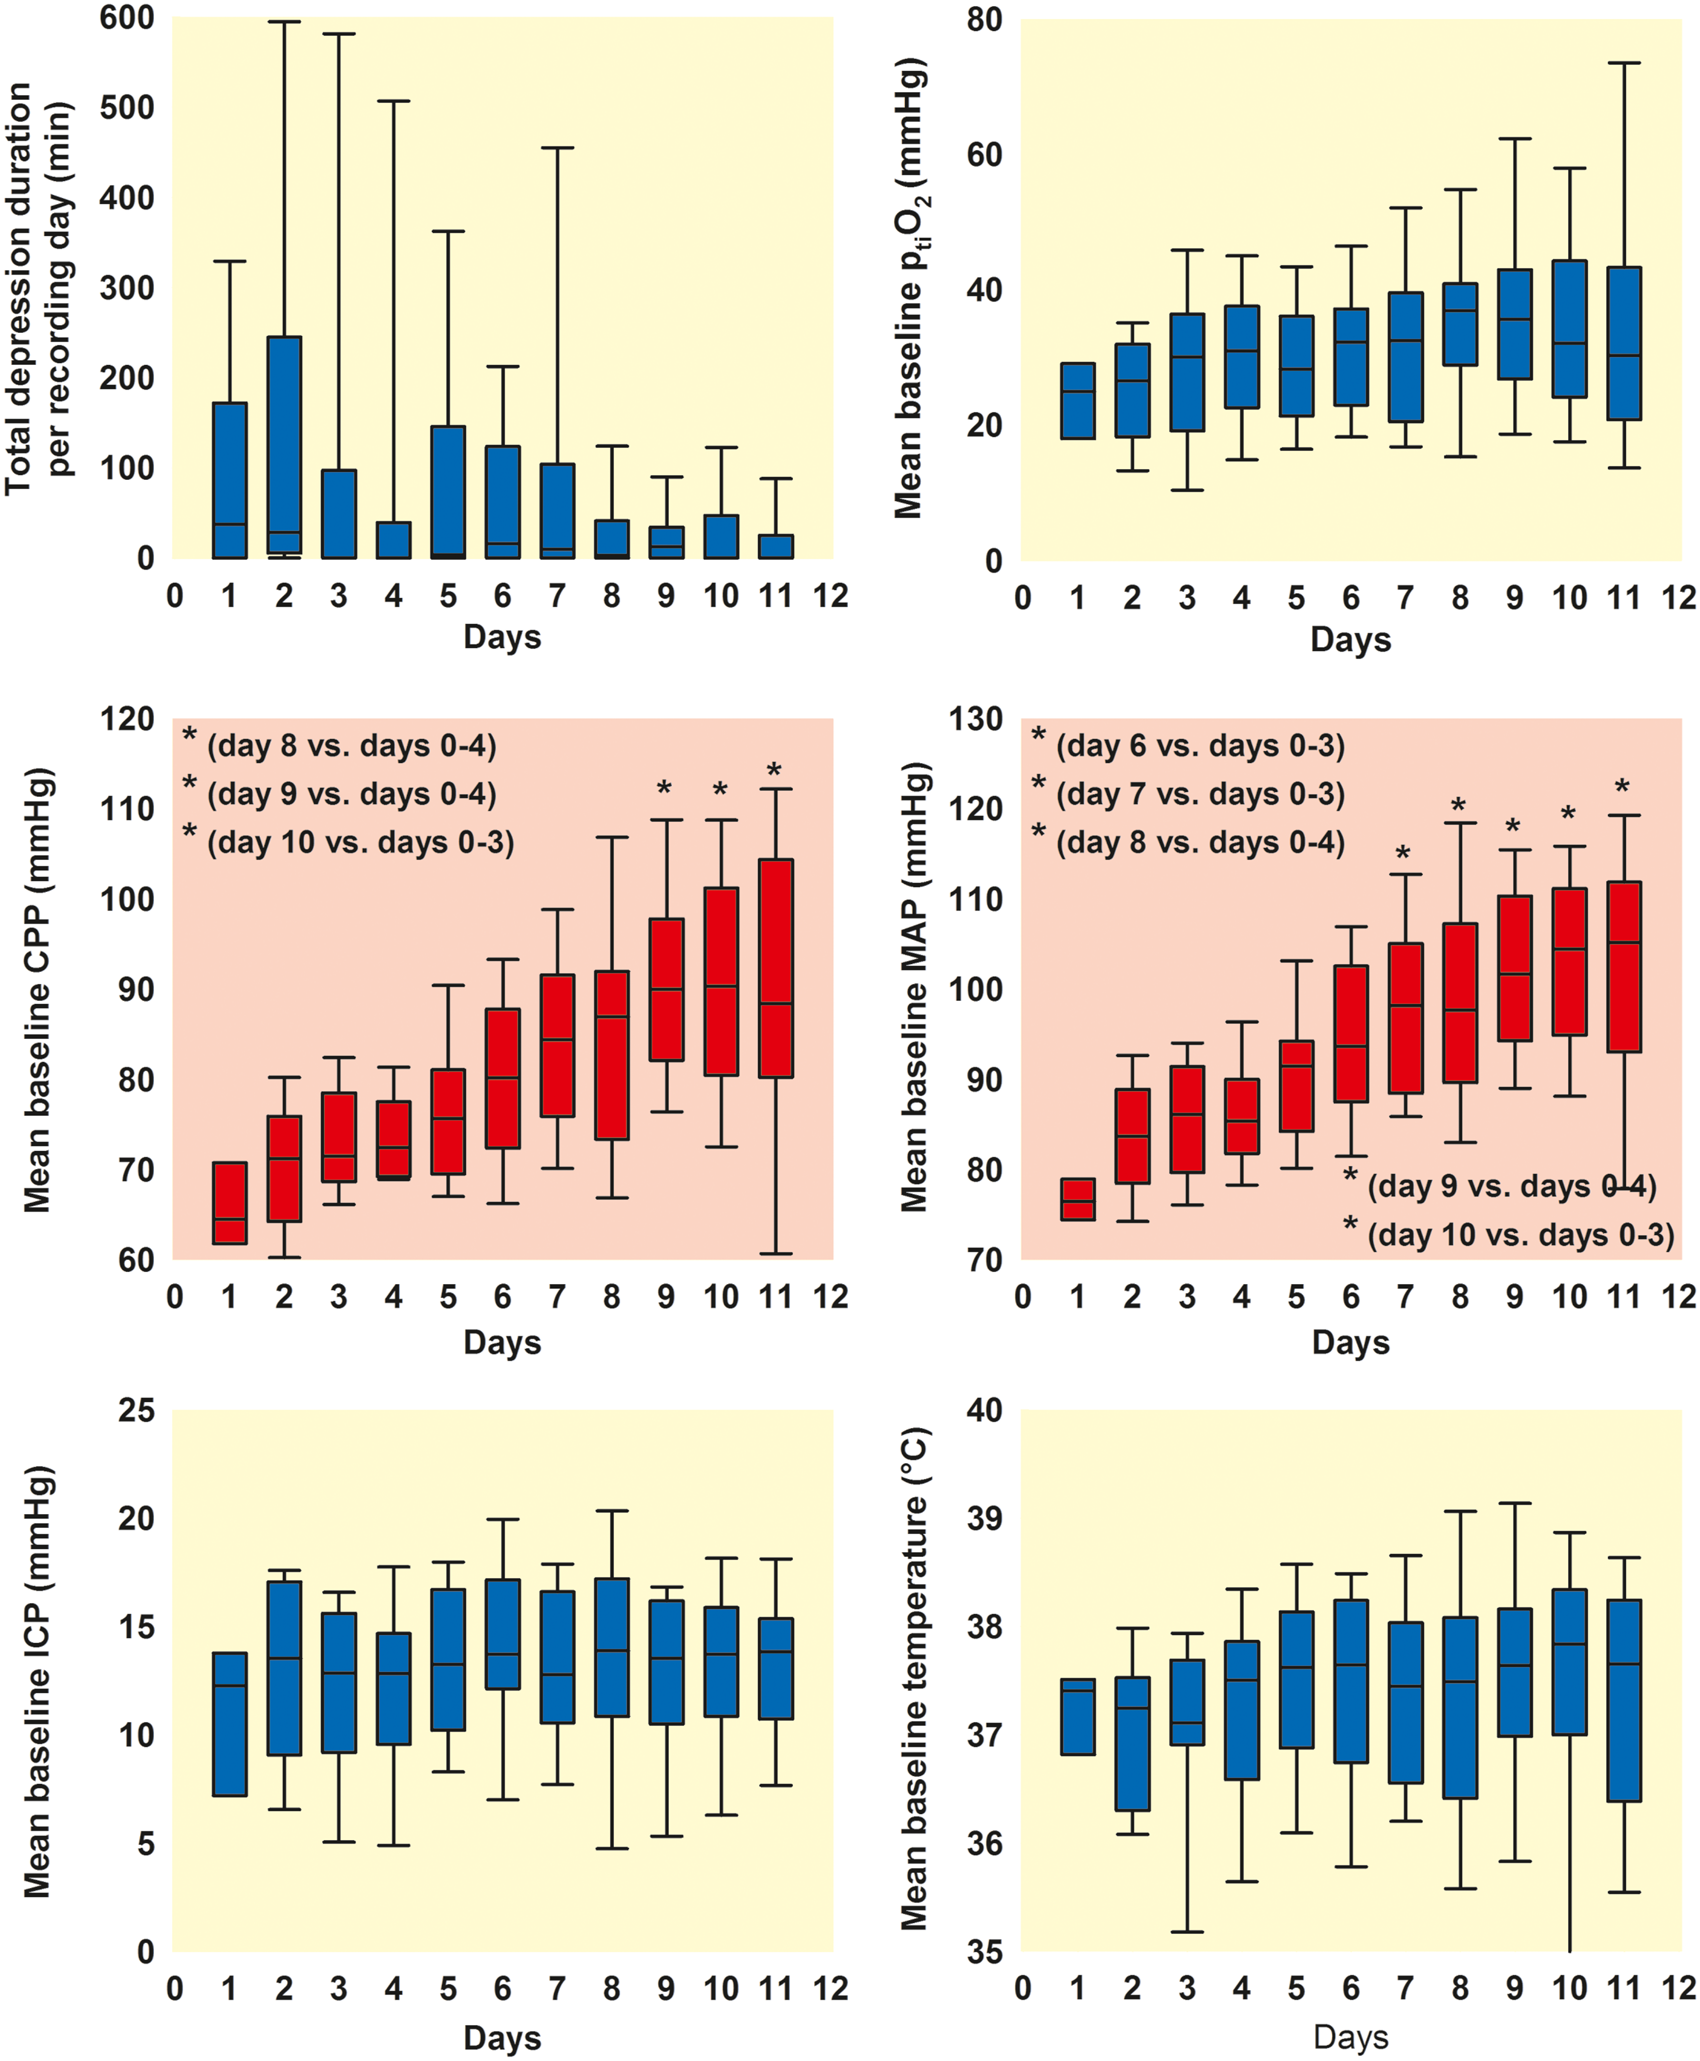
Electrophysiological and vital parameters of the human study population with aSAH during the recording period.
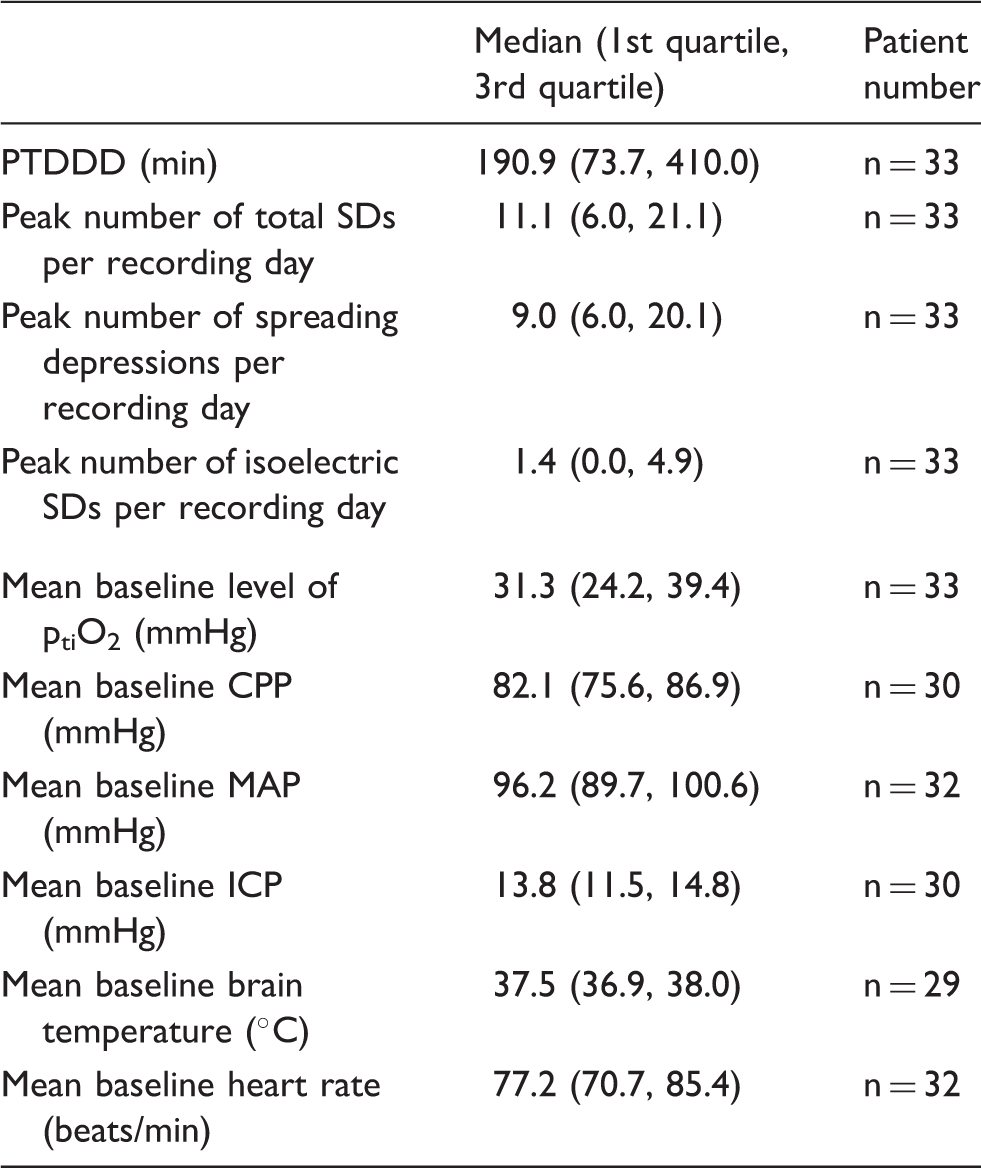
MAP: mean arterial pressure; ICP: intracranial pressure; CPP: cerebral perfusion pressure; ptiO2: tissue partial pressure of oxygen.
The PTDDD was significantly greater in patients with poor outcome (eGOS 1–5) than in patients with good outcome (eGOS 6–8) (eGOS 1–5: 270.8 [97.6, 492.6] min [n = 20] vs. eGOS 6–8: 89.1 [47.7, 179.2] min [n = 8], P = 0.037, Mann–Whitney Rank Sum Test) (Figure 4). In patients who died, the PTDDD was observed on day 2 (1, 5), whereas the patients died only on day 15 (10, 70) (n = 13) (Figure 2(a)). The time interval between the day of PTDDD and death was thus 13 (7, 65) days. The distribution of the day of PTDDD in the patient population is shown in Figure 5(Ab) and (Bb). The PTDDD in patients with poor outcome was not only significantly greater but also occurred highly significantly earlier than in patients with good outcome (eGOS 1–5: day 2.0 [1.0, 5.5] [n = 19] vs. eGOS 6–8: day 9.0 [6.0, 10.5] [n = 7], P = 0.002, Mann–Whitney Rank Sum Test).
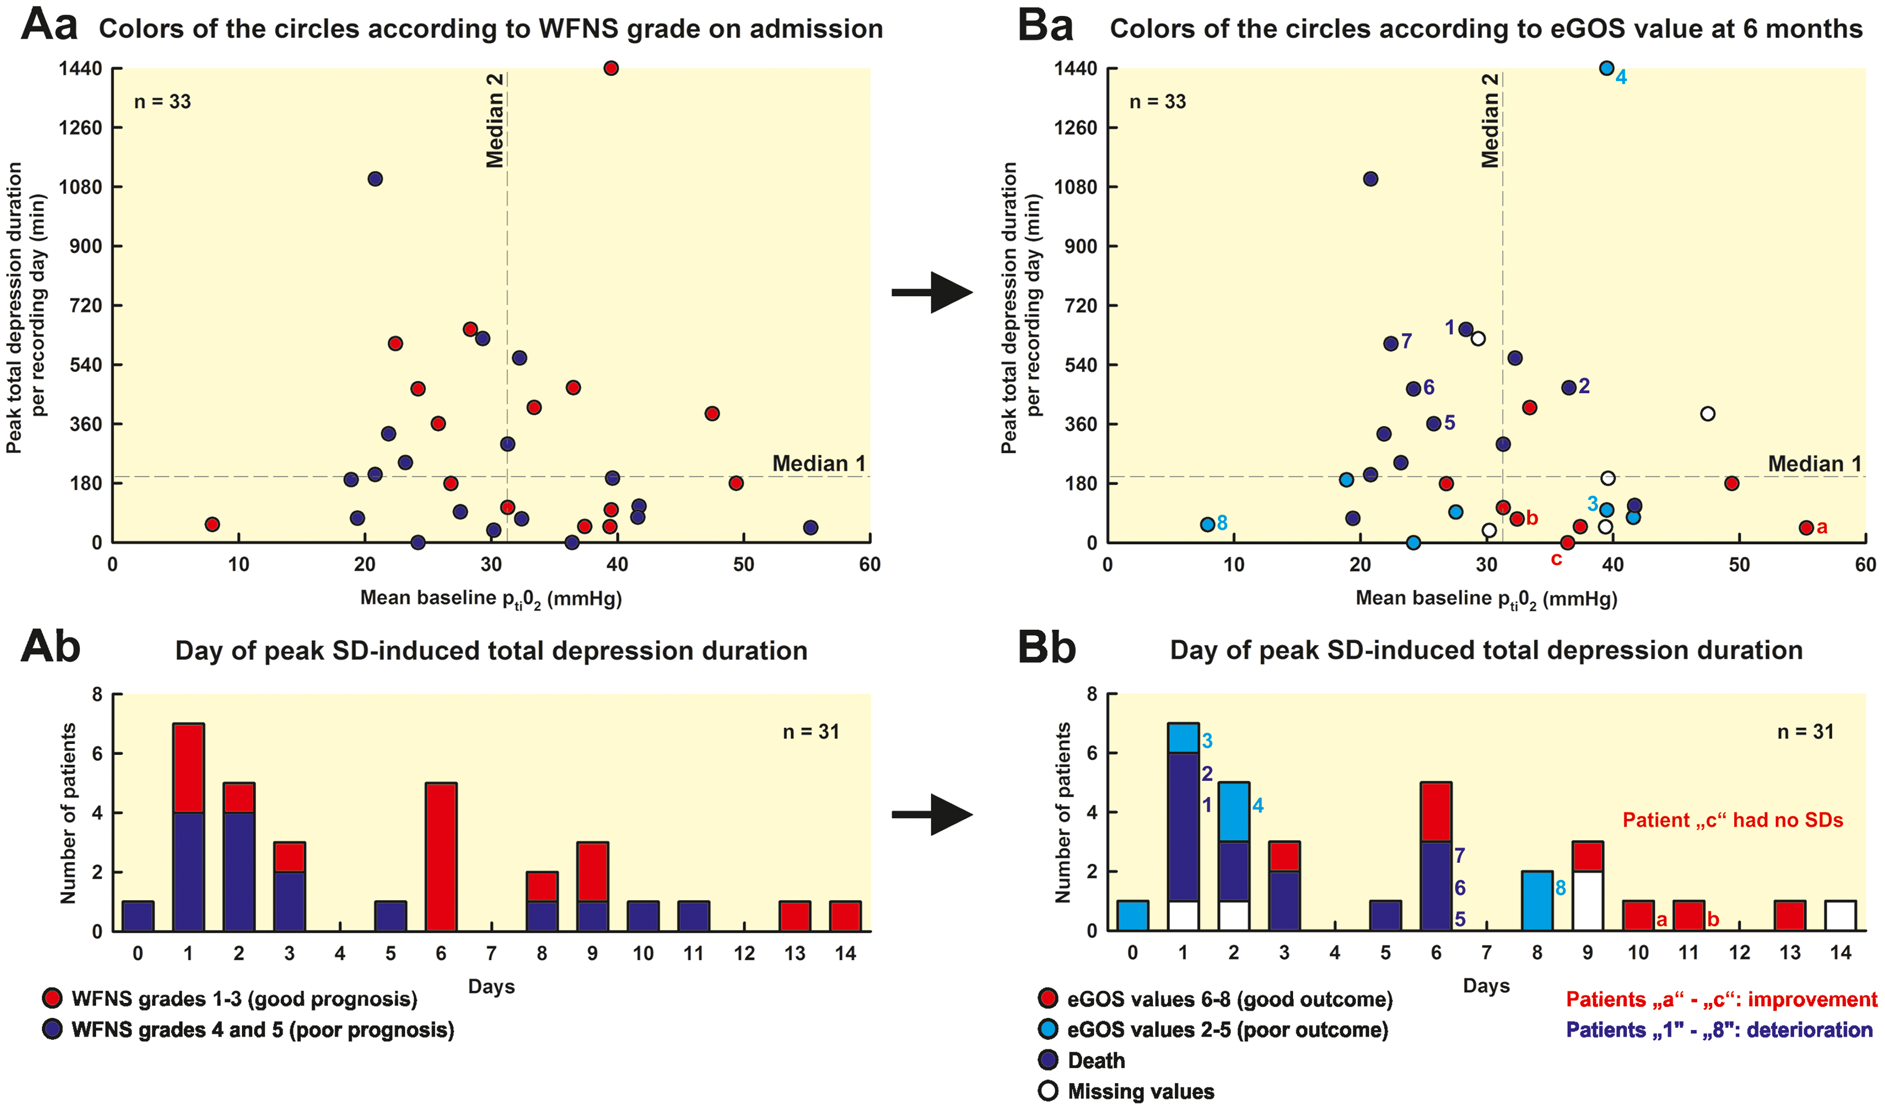
Comparison of patients with poor outcome (eGOS 1-5) versus patients with good outcome (eGOS 6–8) six months after aSAH. The PTDDD was significantly longer in patients with poor outcome compared to patients with good outcome (P = 0.037, Mann–Whitney Rank Sum Test). Moreover, the mean baseline level of ptiO2 was significantly lower in patients with poor outcome (P = 0.024, Mann–Whitney Rank Sum Test). All other parameters, number of SDs (spreading depressions and isoelectric SDs), mean baseline CPP, mean baseline MAP, mean baseline ICP, mean baseline brain temperature, and mean baseline heart rate showed no significant difference between patients with poor and good outcome. No correlation between PTDDD and mean baseline ptiO2 (Spearman Rank Order Correlation). The PTDDD and the mean baseline level of ptiO2 showed no correlation in the 33 patients (Aa and Ba), indicating in relationship with the other data, in particular the multiple regression analysis, that there is an added value when both parameters are recorded simultaneously. In Aa, the colors of the circles give the WFNS grade on admission whereas, in Ba, they give the eGOS value at six months. The figure informs the reader who of the patients showed a transition from good (WFNS grade 1–3 on admission) to poor status (eGOS value 1–5 at six months), from poor to good status or no change dependent on the PTDDD and the mean baseline level of ptiO2. Note that four patients in the left upper quadrant had a good WFNS grade on admission but died until the outcome assessment at 6 months (patients “1” and “5”–”7”) while no patient improved (Aa). In a similar fashion, three patients deteriorated in the right upper quadrant (patients “2” and “4”) and left lower quadrant (patient “8”) while no patient improved. By contrast, in the right lower quadrant, only one patient showed transition from good to poor status (patient “3”) but three patients improved (patients “a”, “b” and “c”). Ab and Bb: Out of the three patients who changed from poor WFNS grade on admission to good eGOS value at six months (patients “a,” “b,” and “c” in Ba and Bb), one showed the PTDDD on day 10, the other one on day 11, and one had no SDs. Out of the eight patients who changed from a good WFNS grade on admission to a poor eGOS value at six months (patients “1” to “8” in Ba and Bb), three showed the PTDDD on day 1, one on day 2, three on day 6 and one on day 8. Further details of the four quadrants are given in Supplemental Table 1.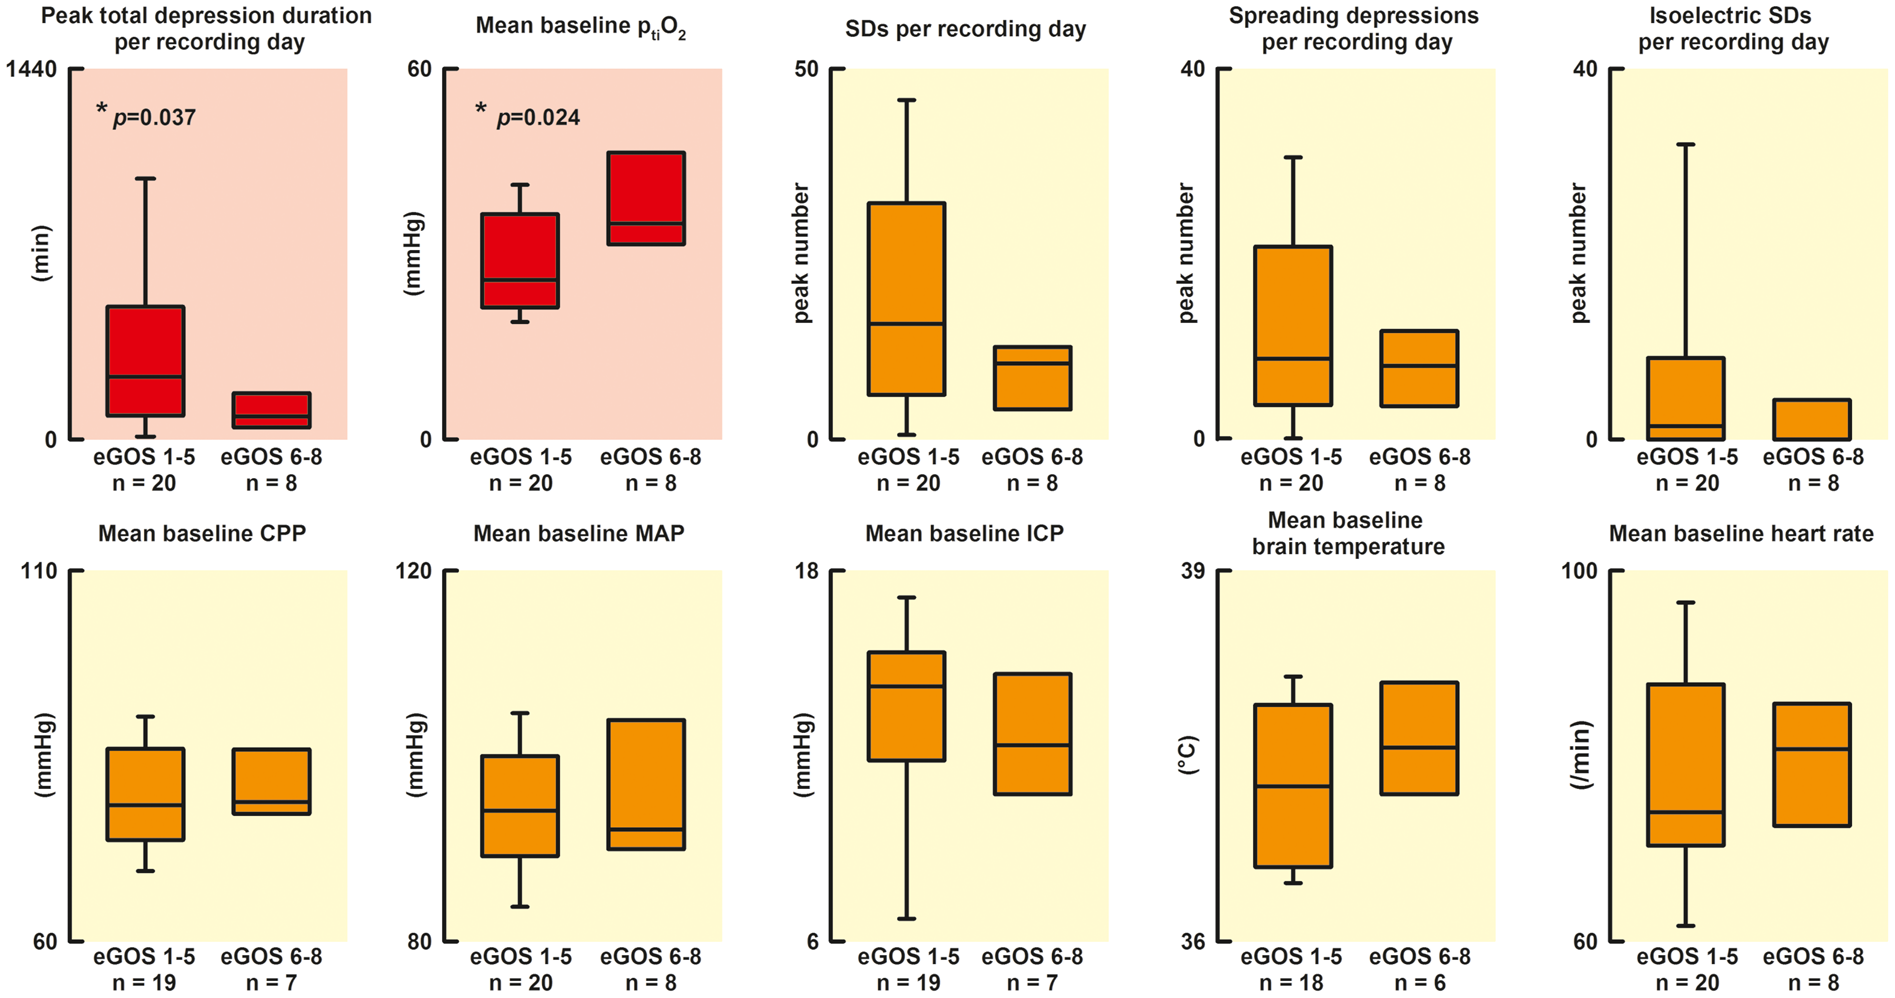
The mean baseline level of ptiO2 was significantly lower in patients with poor outcome than in patients with good outcome (25.0 [21.6, 33.3] mmHg [n = 20] vs. 34.9 [32.1, 40.4] mmHg [n = 8], P = 0.024, Mann–Whitney Rank Sum Test). By contrast, no significant differences were found between patients with poor and good outcome with respect to the peak number of SDs per recording day, the peak number of spreading depressions per recording day, the peak number of isoelectric SDs per recording day, mean baseline CPP, mean baseline MAP, mean baseline ICP, mean baseline brain temperature, and mean baseline heart rate. Twelve out of 15 patients with poor WFNS grade (4, 5) (80.0%) and 8 out of 13 patients with good WFNS grade (1–3) (61.5%) showed a poor outcome. This difference was not statistically significant either (Fisher’s Exact Test). The PTDDD in patients with poor WFNS grade did not occur significantly earlier than in patients with good WFNS grade (WFNS 4, 5: day 2.0 [1.0, 5.8] [n = 16] vs. WFNS 1–3: day 6.0 [2.5, 8.5] [n = 15], Mann–Whitney Rank Sum Test) (Figure 5(Ab)).
No correlation was found between PTDDD and mean baseline level of ptiO2 (n = 33, Spearman Rank Order Correlation, Figure 5(Aa) and (Ba)). To investigate whether PTDDD and mean baseline ptiO2 are independent predictors of eGOS, a multiple regression analysis with both predictors was calculated. The PTDDD (skewness: 3.1, kurtosis: 12.2) had to be log transformed to obtain an approximate normal distribution (skewness of transformed values: −0.48, kurtosis: 0.51). In the regression model, both variables were significant (log PTDDD beta=(−0.37), P = 0.035; mean baseline ptiO2 beta = 0.39, P = 0.029) with an adjusted r-square of 0.26 (P = 0.008). As this r-square might be overoptimistic, a cross classification (leaving one out) was calculated which revealed an unbiased r-square of 0.23 (P = 0.01).
Data exploration revealed that none of the patients survived until the outcome assessment at six months who showed the combination of a mean baseline ptiO2 value below the median and a PTDDD above the median of the total study population (left upper quadrant in Figure 5, n = 8). The eGOS value of patients in the left upper quadrant was significantly worse than the eGOS value of patients in the right lower quadrant who showed the opposite, a mean baseline ptiO2 value at or above median and a PTDDD at or below median of the total study population (P < 0.05, Kruskal–Wallis One Way Analysis of Variance on Ranks with post-hoc Dunn’s test) (eGOS left upper quadrant: 1.0 [1.0, 1.0] [n = 8] vs. right lower quadrant: 6.0 [3.0, 6.0] [n = 9] vs. the two remaining quadrants: 3.0 [1.0, 3.5] [n = 11]). This observation is particularly interesting because the initial WFNS grade was not significantly different between the three groups of patients (WFNS left upper quadrant: 3.5 [1.8, 4.3] [n = 8] vs. right lower quadrant: 5.0 [2.0, 5.0] vs. the two remaining quadrants: 4.0 [2.0, 5.0] [n = 11] [n = 9], Kruskal–Wallis One Way Analysis of Variance on Ranks). Figure 5 informs the reader who of the individual patients showed a transition from good (WFNS grade 1–3 on admission) to poor status (eGOS value 1–5 at six months), from poor to good status, or no change dependent on the PTDDD and the mean baseline level of ptiO2.
The ptiO2 level immediately preceding SD is not significantly lower than the mean baseline ptiO2 level
In 1140 SDs, simultaneous ECoG and ptiO2 data were available. Notably, we did not find a significant difference between the level of ptiO2 immediately preceding SD compared to the mean baseline ptiO2 (29.8 [21.3, 36.6] vs. 31.3 [23.7, 39.5] mmHg, n = 31, Wilcoxon Signed Rank Test), but CPP and MAP immediately preceding SD were significantly lower than mean baseline CPP and mean baseline MAP, respectively (CPP: 78.1 [67.4, 80.3] mmHg vs. 84.4 [75.6, 86.9], P = 0.006, n = 26, Wilcoxon Signed Rank Test; MAP: 91.5 [81.1, 96.7] mmHg vs. 97.3 [90.4, 101.2], P < 0.001, n = 29, Wilcoxon Signed Rank Test). ICP (13.4 [12.5, 15.4] vs. 13.8 [11.5, 15.1] mmHg, n = 26), brain temperature (37.7 [37.2, 38.1] vs. 37.5 [37.1, 38.0]℃, n = 27) and heart rate (73 [70, 87] vs. 77 [71, 86] beats/min, n = 30) immediately preceding SDs did not differ significantly from the respective mean baseline values. No significant correlation was found between the level of ptiO2 and CPP immediately preceding SD or, respectively, ptiO2 and MAP immediately preceding SD (Spearman Rank Order Correlations).
The level of ptiO2 immediately preceding SDs is not significantly different between spreading depressions and isoelectric SDs
Patients displaying isoelectric SDs did not show a significantly worse outcome. However, the P-value was close to 0.05 (eGOS in patients with isoelectric SDs: 1.0 [1.0, 3.3] [n = 14] vs. eGOS in patients without isoelectric SDs: 3.5 [3.0, 6.0] [n = 14], P = 0.061, Mann–Whitney Rank Sum Test). In the 14 patients displaying both spreading depressions and isoelectric SDs during simultaneous recordings of ECoG and ptiO2, the delay from the previous SD was significantly longer for spreading depressions than for isoelectric SDs (172.0 [99.0, 467.0] vs. 26.0 [19.7, 38.0] min, n = 14, P = 0.021, Wilcoxon Signed Rank Test). The level of ptiO2 immediately preceding SDs was not significantly different between spreading depressions and isoelectric SDs (28.9 [23.0, 34.6] mmHg vs. 28.9 [19.4, 36.0] mmHg, n = 14, Wilcoxon Signed Rank Test). Nor was there a difference between spreading depressions and isoelectric SDs in CPP, MAP, ICP, brain temperature, or heart rate values immediately preceding the SDs. No significant change of CPP, MAP, ICP, brain temperature, and heart rate occurred during SDs.
The ptiO2 responses to SD are similar between spreading depressions and isolectric SDs
We observed 874 SDs in 26 patients leading to an initial ptiO2 decrease (76.7%), 13 SDs in 5 patients leading to an initial increase (1.1%) and 253 SDs in 26 patients with no change of ptiO2 (22.2%) (Figure 2(b)). The median ptiO2 immediately preceding SD was not significantly different between the three types of ptiO2 responses in the five patients who displayed all three response types (21.1 [16.8, 26.8] vs. 21.3 [16.3, 30.8] vs. 19.5 [18.3, 20.0], Friedman Repeated Measures Analysis of Variance on Ranks). Moreover, the median ptiO2 preceding SD was not significantly different between the 2 types of ptiO2 responses in the 21 patients who displayed both SDs associated with an initial decrease of ptiO2 and SDs associated with no change of ptiO2 (28.3 [19.8, 41.0] vs. 30.8 [21.1, 35.5] mmHg, Wilcoxon Signed Rank Test).
We also analyzed whether the ptiO2 responses to SDs with initial decrease of ptiO2 would differ between spreading depressions and isoelectric SDs in the eight patients who showed this response to both spreading depressions and isoelectric SDs. There were no statistically significant differences between spreading depressions and isoelectric SDs in terms of ptiO2 immediately preceding SD (29.7 [26.7, 32.6] vs. 33.4 [24.6, 34.7] mmHg), the minimal level of ptiO2 during SD (19.5 [17.4, 24.4] vs. 15.9 [13.6, 29.0] mmHg) and the duration of the ptiO2 decrease during SD (6.3 [5.6, 6.9] vs. 6.6 [6.1, 7.8] min) (Wilcoxon Signed Rank Tests).
Moreover, we compared the level of ptiO2 immediately preceding SD when there was no ptiO2 change during SD in the 10 patients who showed this response type to both spreading depressions and isoelectric SDs. No statistically significant difference was found between spreading depressions and isoelectric SDs in terms of this parameter (28.1 [22.3, 34.7] vs. 24.6 [17.9, 37.4] mmHg, Wilcoxon Signed Rank Test).
Initial ptiO2 decreases are slightly longer and more pronounced during isoelectric SDs than during spreading depressions when all SDs are analyzed as if they were statistically independent
When all SDs with initial decrease of ptiO2 were analyzed, large ranges were found for the level of ptiO2 immediately preceding SD (4.7–66.7 mmHg), the minimal level of ptiO2 (2.8–66.0 mmHg) and the duration of the ptiO2 decrease during SD (48 s–72.6 min). Even when it was disregarded that different SDs from one patient are statistically dependent, no significant difference was found between spreading depressions and isoelectric SDs in terms of the median ptiO2 immediately preceding SD (Mann–Whitney Rank Sum Test), but the distribution of ptiO2 immediately preceding SD was significantly wider for isoelectric SDs than spreading depressions (Chi-Square Test, P = 0.009, Figure 6). By contrast, the medians of the minimal level of ptiO2 during SD (spreading depressions: 20.3 [15.0, 26.3] [n = 633] vs. isoelectric SDs: 17.1 [12.3, 25.5] [n = 223], P < 0.001, Mann–Whitney Rank Sum Test) and the medians of the duration of the decrease in ptiO2 during SD (spreading depressions: 5.3 [3.5, 6.9] min [n = 631] vs. isoelectric SDs: 6.4 [5.1, 8.7] min [n = 222], P = 0.001, Mann–Whitney Rank Sum Test) differed significantly between spreading depressions and isoelectric SDs. Accordingly, the distribution of the minimal levels of ptiO2 during SD was significantly shifted toward lower levels for isoelectric SDs compared to spreading depressions (P < 0.001. Chi-Square Test, Figure 6). The distribution of the durations of the ptiO2 decrease during SD was significantly shifted toward longer durations to isoelectric SDs compared to spreading depressions (P < 0.001, Chi-Square Test, Figure 6). The amplitude and duration of the decrease in ptiO2 in response to SD were significantly correlated (correlation coefficient: 0.405, P < 0.001, n = 846, Spearman Rank Order Correlation), as were the level of ptiO2 immediately preceding SD and the minimal level of ptiO2 during SD (correlation coefficient: 0.711, P < 0.001, n = 853, Spearman Rank Order Correlation), but no correlation was found between the level of ptiO2 immediately preceding SD and the duration of the ptiO2 decrease during SD.
Comparison between initially hypoxic responses to isoelectric SDs and initially hypoxic responses to spreading depressions. In the pooled analysis of all SDs with initially hypoxic responses to SD the median ptiO2 immediately preceding an SD event showed no significant difference between isoelectric SDs and spreading depressions (green bar plots). However, the median duration of SD-induced hypoxic episodes was significantly longer for isoelectric SDs compared to spreading depressions (P < 0.001, Mann–Whitney Rank Sum Test) (red bar plots) and the median of the minimal ptiO2 level during hypoxic responses to SD was significantly lower for isoelectric SDs compared to spreading depressions (P < 0.001, Mann–Whitney Rank Sum Test). Also, note the differences in data distributions between isoelectric SDs and spreading depressions as explained further in the body text.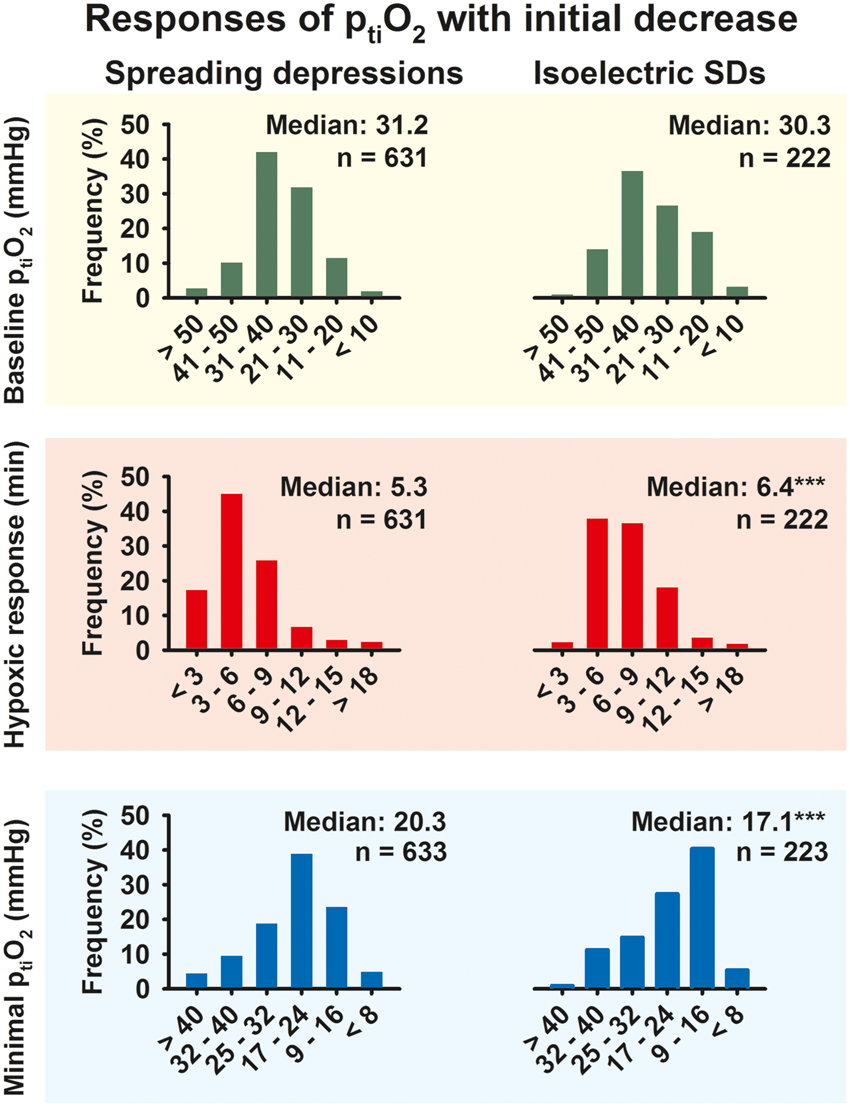
When all SDs were compared as if they were statistically independent, multiple significant correlations were found among ptiO2, CPP, MAP, ICP, brain temperature, and heart rate immediately preceding SD, but the correlation coefficients were mostly relatively small (Supplemental Table 2).
Discussion
Associations between mean baseline ptiO2 and PTDDD with patient outcome
In the present study, mean baseline ptiO2 was significantly lower in patients with poor outcome than in patients with good outcome. Mean baseline ptiO2 was ∼25 mmHg in patients with poor outcome and ∼35 mmHg in patients with good outcome. These values are in agreement with previous studies in patients with aSAH and TBI using similar technology.12,13,30,31 According to these observations, the mean baseline ptiO2 level measured somewhere in the brain of patients with aSAH not only allows for a local but a more general assessment of the brain’s metabolic condition.
Moreover, the PTDDD was significantly higher in patients with poor outcome than in patients with good outcome, as in a previous study (note that eGOS 0–7 in the previous study corresponds to eGOS 1–8 in the present study). 3 Importantly, there was no correlation between the mean baseline ptiO2 value and the PTDDD, which suggests that there is an added value when the two parameters are monitored simultaneously. Accordingly, in a multiple regression analysis, both measurements were significant independent predictors for the eGOS at six months. To avoid overoptimism, a cross classification method was applied (leaving one out) which did not change the r-square of the model substantially. However, it has to be admitted that the preselection of the two variables was in part driven by the data even though these variables have been proven to be predictive in earlier publications.3,12
The explanation for the lack of correlation between mean baseline ptiO2 value and the PTDDD might be that clusters of SDs can be measured in very large areas of the brain but they are generated only at locally restricted areas of severe metabolic disturbance. A ptiO2 sensor placed somewhere in the brain will not usually reflect the very localized conditions that cause the cluster of SDs because the probability is very high that the sensor is not placed where the cluster is generated. This only changes when the neurosurgeon is informed about the region of metabolic compromise such as, for example, after malignant hemispheric stroke where it is possible to place the ptiO2 sensor directly into the penumbra. 14 However, in patients with aSAH, the location of the ptiO2 sensor in relation to future developing pathology is variable, and unknown at the time of placement.
No patient survived who showed the combination of a mean baseline ptiO2 value below the median and a PTDDD above the median of the total study population although four out of the eight patients in this group had displayed a good WFNS grade on admission. The PTDDD merely occurred on day 6 in three out of the four patients undergoing secondary deterioration. Furthermore, the cluster of SDs that caused the high PTDDD was typically recorded more than 10 days before patients died. Speculatively, these findings could reflect a condition in the patient where clusters of SDs in a brain generally undersupplied with oxygen lead to widespread cellular death and devastating outcome based on the ample experimental evidence that SDs facilitate neuronal death in energy-deprived tissue.32–34 If confirmed in further studies, the following two questions would arise: (i) whether therapeutic interventions targeting SDs or modifying the hemodynamic response to SD can favorably influence this specific condition in the time window when SD clusters occur and (ii) whether therapeutic interventions to increase ptiO2 should already start at a higher level than 15 mmHg.
Following current guidelines, 35 treatment targeting low ptiO2 values was initiated at a relatively low ptiO2 level of 15 mmHg. However, in other studies, higher cut-off values of up to 20–25 mmHg were used.1,11–13,36,37 Our results seem to support the use of a cut-off level higher than 15 mmHg in aSAH patients. However, increase of the fraction of inspired oxygen (FiO2) by way of normobaric oxygen therapy is one of the most frequently employed interventions to treat compromised ptiO2. Whether increasing FiO2 has a beneficial or detrimental effect on the injured brain is largely controversial.38–40 Recently, clinical studies found that high levels of oxygen were associated with worse prognosis after severe TBI41–43 and hypoxic-ischemic encephalopathy. 44 Moreover, after adjusting for brain and systemic covariates, high FiO2 was associated with a progressive increase in microdialysis-measured glutamate in patients with severe TBI suggesting increased cerebral excitotoxicity. 45 These observations call for caution when using high FiO2 levels and question the value of supranormal oxygen tension in patients with acute cerebral injury. They rather support a cautious, bidirectional modulation aiming at a ptiO2 level within a relatively narrow desired range.
Remote detection of new ischemic zones
In contrast to other neuromonitoring modalities such as oxygen sensors or microdialysis, ECoG measurements do not necessarily require a sensor at tissue that actually becomes ischemic and gives origin to SDs, but a sensor located at remote tissue that is invaded by clustered SDs from the ischemic zone should be sufficient for the detection of a new ischemic event.4,22,46 This is particularly interesting for the detection of DCI after aSAH, for example. Both subdural electrode strips and microdialysis catheters are typically implanted at the aneurysm-bearing vascular territory several days before DCI develops. This region is often covered with large amounts of blood and, thus, a predilection site for DCI.47,48 It is nevertheless impossible for the neurosurgeon to foresee at the time of implantation where exactly the delayed ischemic zones will develop a week later. If it is sufficient to place a recording device somewhere in the closer or wider vicinity, the sensitivity of the monitoring to detect DCI should increase substantially.
The ability to remotely diagnose focal cerebral ischemia further improves when SD-induced persistent depression of spontaneous activity is included into the ECoG analysis which can be measured by the depression durations as in the present study. In contrast to DC and near-DC shifts that define SD, spontaneous and evoked electrical activity of the brain is observed in the AC range of the ECoG above ∼0.5 Hz. SD causes spreading depression of spontaneous activity in electrically active tissue 49 because the sustained depolarization exceeds the inactivation threshold for the action potential generating channels. 50 The depression nevertheless outlasts SD, suggesting that it is maintained by other mechanisms such as, for example, intracellular zinc, calcium, and/or adenosine accumulation.51,52
Spreading depression becomes a crucial element in the pathophysiology of ischemia once the first SD originates in the center and concentrically invades penumbra and surrounding, well-perfused tissue. This first SD cannot initiate spreading depression in the center of the perfusion deficit and inner penumbra because these zones have already been subject to nonspreading depression of activity and activity cannot be further depressed as reviewed recently. 33 However, this changes when the SD wave invades tissue further away, where nonspreading depression is less and less complete. The further away from the ischemic center, the more the first SD hence entails spreading depression of activity. 33 In other words, spreading depression causes the zone of electrically inactive tissue to expand far beyond the inner ischemic penumbra into the surrounding, adequately perfused tissue. 53 Further SDs are then generated at the rim of the permanently depolarized core, invade the surrounding tissue, and keep a large belt of adequately perfused tissue around the ischemic zone in a state of electrical inactivity. SDs within this belt are isoelectric although there is no evidence of local energy deprivation at the recording site.
This concept has been based on an experimental model in which (i) ischemia was locally induced by topical application of the potent vasoconstrictor endothelin-1 (ET-1) to the brain, and (ii) simultaneous regional cerebral blood flow (rCBF) and DC/AC-ECoG recordings were performed both in the cranial window, where ET-1 was applied and in a cranial window remote from the ischemic zone. 53 It is also supported by the middle cerebral artery occlusion model in rats as seen, for example, in Figure 2 in the paper by Dijkhuizen et al. 54 or Figures 1(c) and 4 in the paper by Hartings et al. 55
There is moreover preliminary evidence for this concept from clinical studies because the large majority of isoelectric SDs displayed DC shifts of similar duration as spreading depressions both in patients with aSAH53 and in patients with TBI. 5 Further, there are clinical reports that the N-methyl-D-aspartate receptor (NMDAR) antagonist ketamine was sufficient to block clusters of isoelectric SDs whereby the spontaneous activity returned. 56 If the nature of the depression had been energy compromise-induced nonspreading depression of activity rather than SD-induced persistent spreading depression of activity, the activity should not have returned after blockade of the cluster. Moreover, in more severely energy-deprived tissue, the NMDAR antagonist would not have been sufficient to block the cluster based on experimental observations57–60 and a previous case report. 15
In the present study, the hypothesis that isoelectric SDs often run through adequately perfused tissue was further strongly supported by the observation that the ptiO2 level preceding SDs was not significantly different between isoelectric SDs and spreading depressions. Also the ptiO2 responses to SD were not significantly different between isoelectric SDs and spreading depressions when only mean values from different patients were compared. By contrast, when it was disregarded that different SDs from one patient are statistically dependent, the distribution of the durations of SD-induced hypoxic episodes was significantly shifted toward longer durations to isoelectric SDs compared to spreading depressions, and the distribution of the minimal levels of ptiO2 during SD was significantly shifted toward lower levels for isoelectric SDs compared to spreading depressions. This, in turn, seems to correspond well with previous observations that the fraction of SDs with prolonged negative DC shifts, though relatively small, is significantly larger among isoelectric SDs than spreading depressions.5,53
In conclusion, although the above concept implies on the one hand that isoelectric SDs do not necessarily indicate shortage of energy at the recording site, it implies on the other hand that they indicate shortage of energy somewhere (either at the recording site or in the closer or wider vicinity).4,5,8 In other words, isoelectric SDs, in addition to the clustering of SDs, have a value for the remote diagnosis of new ischemic events. This value was previously supported by the observation that isoelectric SDs in contrast to SDs in electrically active tissue were associated with a highly significant eight-fold increase in the risk of unfavorable outcome at six months in a prospective, observational multicenter study of 109 patients with TBI. 7 In the present study in 33 patients with aSAH, patients displaying isoelectric SDs did not show a significantly worse outcome. However, the P-value was close to 0.05. This certainly deserves further study in a larger population. Nevertheless, when compared with the PTDDD, the prognostic value of isoelectric SDs seems to be smaller. The higher sensitivity of the PTDDD might be due to the fact that it is abnormal in an even wider belt of tissue around the actual ischemic zone, where spontaneous activity, though it recovers between recurrent SDs, does so in a delayed fashion. The question why the restoration of activity is disturbed in such a wide zone around the actual pathology calls for further experimental studies of the underlying network anomalies.51,52
Limitations of the study design
Treatment of compromised ptiO2 followed the usual multi-step interventional strategy, including a vigorous search for underlying etiologies, increased sedation, control of concomitantly elevated ICP, CPP augmentation, red blood cell transfusion, and optimization of mechanical ventilation, e.g. by increasing the fraction of inspired oxygen (FiO2). 11 Following current recommendations, 35 compromised ptiO2 was defined as a level of <15 mmHg. This was significantly below the mean baseline ptiO2 value in the large majority of patients so that the influence of ptiO2-directed therapeutic interventions on the mean baseline ptiO2 was presumably rather small. It was therefore quite possible to study the question whether an association exists between patient outcome and mean baseline ptiO2.
The influence of therapeutic interventions might have been more significant on mean baseline ICP and CPP in the present study because these parameters were actively maintained by the treating nurses and physicians within the relatively narrow ranges recommended by the current guidelines of the Deutsche Gesellschaft für Neurologie (DGN; http://www.dgn.org/leitlinien/11-leitlinien-der-dgn/2426-ll-86-2012-intrakranieller-druck-icp; ICP: <20 mmHg; CPP: 60–90 mmHg in patients without suspicion/manifestation of DCI or CPP: 80–120 mmHg in patients with suspicion/manifestation of DCI).
Another limitation of our study was the relatively small size with 33 patients. Moreover, the placement of the oxygen sensor depended on the discretion of the neurosurgeon. Usually, the treating neurosurgeon implanted the oxygen sensor when patients had reasons to develop a poor outcome such as a significant focal brain lesion in the initial CT scan or a high risk of developing future lesions based on a large amount of subarachnoid blood. Accordingly, the median WFNS grade was higher than in usual aSAH studies. 61
Conclusion
Our study supports the hypothesis that ECoG provides an added clinical value in concert with the other more established monitoring modalities in neurocritical care. Further, it suggests that the integration of multimodal monitoring into clinical routine and clinical trials is an interesting option because it can alert the treating physician of a newly developed clinical problem and can inform about pathophysiological reasons why a treatment is effective or not in the individual patient. Beyond the purely clinical matters, multimodal monitoring moreover builds a bridge between the clinical and basic sciences. It might thus guide future targeted research on improved diagnosis and treatment on multiple levels both in the clinic and the lab.
Funding
The author(s) declared the following potential conflicts of interest with respect to the research, authorship, and/or publication of this article: Supported by the Bundesministerium für Bildung und Forschung (Center for Stroke Research Berlin, 01 EO 0801; BCCN 01GQ1001C B2) and Era-Net Neuron 01EW1212 to Dr. Dreier and Deutsche Forschungsgemeinschaft (DFG DR 323/5-1) to Drs. Dreier, Martus, Woitzik and Vajkoczy.
Declaration of conflicting interests
The author(s) declared no potential conflicts of interest with respect to the research, authorship, and/or publication of this article.
Authors’ contribution
Maren K.L. Winkler: designed the study and was involved in the acquisition of neuromonitoring and clinical data, analyzed raw data, performed statistics, drafted and finalized the manuscript and approved the manuscript before submission.
Nora Dengler: was involved in neurosurgical interventions and the acquisition and discussion of neuromonitoring and clinical data, contributed to the manuscript and approved the manuscript before submission.
Nils Hecht: was involved in neurosurgical interventions and the acquisition and discussion of neuromonitoring and clinical data, contributed to the manuscript and approved the manuscript before submission.
Jed A. Hartings: contributed to the manuscript and approved the manuscript before submission.
Eun-Jeung Kang: was involved in the acquisition and discussion of neuromonitoring and clinical data, contributed to the manuscript and approved the manuscript before submission.
Sebastian Major: was involved in the acquisition and discussion of neuromonitoring and clinical data, supervised the technical quality of neuromonitoring data and the data base, contributed to the manuscript and approved the manuscript before submission.
Peter Martus: performed the multiple regression analysis, calculated the cross classification (leaving one out) and wrote the respective parts of the manuscript in the methods, results and discussion sections. Moreover, he approved the manuscript before submission.
Peter Vajkoczy: performed neurosurgical interventions, contributed to the manuscript and approved the manuscript before submission.
Johannes Woitzik: performed neurosurgical interventions, contributed to the manuscript and approved the manuscript before submission.
Jens P. Dreier: designed the study, performed statistics, drafted and finalized the manuscript and approved the manuscript before submission.
References
Supplementary Material
Please find the following supplemental material available below.
For Open Access articles published under a Creative Commons License, all supplemental material carries the same license as the article it is associated with.
For non-Open Access articles published, all supplemental material carries a non-exclusive license, and permission requests for re-use of supplemental material or any part of supplemental material shall be sent directly to the copyright owner as specified in the copyright notice associated with the article.