
Abstract
White matter hyperintensities accumulate with age and occur in patients with stroke, but their pathogenesis is poorly understood. We measured multiple magnetic resonance imaging biomarkers of tissue integrity in normal-appearing white matter and white matter hyperintensities in patients with mild stroke, to improve understanding of white matter hyperintensities origins. We classified white matter into white matter hyperintensities and normal-appearing white matter and measured fractional anisotropy, mean diffusivity, water content (T1-relaxation time) and blood–brain barrier leakage (signal enhancement slope from dynamic contrast-enhanced magnetic resonance imaging). We studied the effects of age, white matter hyperintensities burden (Fazekas score) and vascular risk factors on each biomarker, in normal-appearing white matter and white matter hyperintensities, and performed receiver-operator characteristic curve analysis. Amongst 204 patients (34.3–90.9 years), all biomarkers differed between normal-appearing white matter and white matter hyperintensities (P < 0.001). In normal-appearing white matter and white matter hyperintensities, mean diffusivity and T1 increased with age (P < 0.001), all biomarkers varied with white matter hyperintensities burden (P < 0.001; P = 0.02 signal enhancement slope), but only signal enhancement slope increased with hypertension (P = 0.028). Fractional anisotropy showed complex age-white matter hyperintensities-tissue interactions; enhancement slope showed white matter hyperintensities-tissue interactions. Mean diffusivity distinguished white matter hyperintensities from normal-appearing white matter best at all ages. Blood–brain barrier leakage increases with hypertension and white matter hyperintensities burden at all ages in normal-appearing white matter and white matter hyperintensities, whereas water mobility and content increase as tissue damage accrues, suggesting that blood–brain barrier leakage mediates small vessel disease-related brain damage.
Keywords
Introduction
White matter hyperintensities (WMH) of presumed vascular origin are commonly seen on computed tomography or magnetic resonance imaging (MRI) brain images of patients presenting with stroke, even at young age. They predict increased risk of stroke and dementia. 1 They are also commonly found in otherwise healthy older people, 2 although are more severe in correspondingly aged patients with stroke, 3 are associated with cognitive decline, 4 gait and balance problems. 5
While increasing age is an important risk factor for WMH, 1 they are also related to vascular risk factors, particularly hypertension, 6 although common vascular risk factors together only explain a small proportion of variance in WMH. 7 WMH have been linked to cerebral hypoperfusion, 8 or compromised blood–brain barrier (BBB) integrity,9–11 but their underlying aetiology remains unclear. 12 More information on the sequence of tissue alterations leading to WMH is crucial for understanding WMH pathogenesis and for targeting therapeutic interventions.
MRI parameters such as diffusion fractional anisotropy (FA) and mean diffusivity (MD), 13 or longitudinal relaxation time (T1), 14 can demonstrate in vivo alterations in axonal microstructure or interstitial fluid in WMH and in the surrounding normal-appearing white matter (NAWM).8,15–18 In a previous study of healthy older individuals all aged about 73, the level of deterioration of NAWM was strongly associated with WMH severity, with MD and T1 increasing and FA and the magnetisation transfer ratio (MRI marker of myelination) decreasing in NAWM as WMH burden increased. 18 Thus, the white matter damage spreads beyond the area of visible WMH suggesting that the same pathogenic steps are responsible for both the lesions and the subtle ‘pre-visible’ alterations in the surrounding NAWM.
The neuropathology of WMH has focused on neuronal loss, demyelination, axonal loss and gliosis,19,20 but pathological studies mainly (and inevitably) describe late-stage disease. Some imaging studies focus on alterations in FA consistent with axonal loss, 21 but this contrasts with our finding of altered water mobility (MD) in NAWM in vivo, even in subjects with few WMH, without alterations in other parameters15,18 and independent of age, suggesting that MD was more sensitive to WMH-related tissue microstructure pathology than other biomarkers 22 and that increased interstitial fluid may be an early feature of white matter vascular pathology. BBB leakage could in part explain the increase in MD, with the changes in other parameters occurring as perivascular oedema-related damage accrues, 23 consistent with the hypothesis that chronically and subtly compromised BBB, as occurs with advancing age, 9 could initiate the alterations observed in the imaging biomarkers. 12 However, more imaging studies of WMH at different stages and severities of disease are required to resolve discrepancies about whether FA or MD are sensitive disease markers.
In the current study, we assessed alterations in vivo in MRI biomarkers of integrity in WMH and NAWM in relation to WMH burden, age, and vascular risk factors to differentiate the effects of WMH disease from those related to ageing and improve understanding of the processes behind the genesis of WMH. Since WMH are more commonly seen in patients with stroke, we studied patients with recent mild (i.e., likely to be non-disabling) stroke, to include a wide age range of participants with overt cerebrovascular disease. We used a combination of MRI quantitative parameters and, particularly, we used dynamic contrast-enhanced (DCE-) MRI, where a series of T1-weighted (T1W) images are acquired dynamically after injection of a gadolinium contrast agent, enabling measurement of potential markers of BBB integrity.24–26 The aim of the current study is to expand previous research on the causation of WMH, by assessing together simultaneously the effects of age, WMH burden and vascular risk factors on NAWM in vivo with multiple MRI biomarkers, including a marker of BBB leakage. We hypothesise that BBB leakage could be a major contributor to brain tissue damage underlying WMH formation, while demyelination and axonal loss are likely to occur later and secondary to damage from interstitial fluid shifts following subtle, presumably chronic, BBB disruption. Therefore, demyelination and axonal loss will be more apparent in severe than early disease while increased BBB leak and interstitial fluid will be apparent in early disease.
Materials and methods
Participants
We prospectively recruited consecutive patients with first clinically evident mild (i.e., likely to be non-disabling) lacunar or cortical ischaemic stroke, including those with diabetes, hypertension and other vascular risk factors. We excluded patients with unstable hypertension or diabetes requiring urgent medical management, other neurological disorders and major medical conditions. We excluded patients unable to give consent, with contraindications to MRI or intravenous gadolinium contrast agents, who had haemorrhagic stroke or those whose symptoms resolved within 24 h (i.e., transient ischaemic attack). The study was approved by the Lothian Ethics of Medical Research Committee (REC 09/81101/54) which operates under the UK Health Research Authority rules according to the Declaration of Helsinki 1975 and update in 1983, and NHS Lothian R+D Office (2009/W/NEU/14). All patients gave written informed consent. The study was conducted according to the Strengthening the Reporting of Observational Studies in Epidemiology reporting guidelines.
Clinical measurements
On presentation, an experienced stroke physician obtained the clinical details of the patient and neurological deficit, assigned the clinical stroke syndrome, 27 and recorded age, demographic details, medical history of hypertension, previous stroke, previous transient ischaemic attack, ischaemic heart disease, peripheral vascular disease, diabetes mellitus, atrial fibrillation, hypercholesterolaemia, heart failure, smoking and alcohol use, and measured systolic and diastolic blood pressure (SBP and DBP, respectively) from the brachial artery. We defined hypertension as blood pressure of 140/90 mmHg or greater, consistently, on presentation, or a previous diagnosis; smokers were defined as currently smoking or having given up within the previous 12 months and non-smokers as having never smoked or having given up more than 12 months previously; pulse pressure was calculated as SBP–DBP.
Magnetic resonance imaging
MRI was performed at presentation with a 1.5 Tesla MRI scanner (Signa HDxt, General Electric, Milwaukee, WI) using an 8-channel phased-array head coil. Diagnostic MRI at presentation included axial T2-weighted (T2W; repetition time (TR)/echo time (TE) = 6000/90 ms, 24 × 24 cm field of view (FoV), 384 × 384 propeller acquisition, 1.5 averages, 28 × 5 mm slices, 1 mm slice gap), axial fluid-attenuated inversion recovery (FLAIR; TR/TE/inversion time (TI) = 9000/153/2200, 24 × 24 cm FoV, 384 (anterior–posterior) × 224 acquisition matrix, 28 × 5 mm slices, 1 mm slice gap), gradient echo (GRE; TR/TE = 800/15 ms, 20° flip angle, 24 (anterior–posterior) × 18 cm FoV, 384 × 168 acquisition matrix, 2 averages, 28 × 5 mm slices, 1 mm slice gap), sagittal 3D T1W (inversion recovery-prepared fast spoiled gradient echo (FSPGR) TR/TE/TI = 7.3/2.9/500 ms, 8° flip angle, 330 (superior–inferior) × 214.5 cm FoV, 256 × 146 acquisition matrix, 100 × 1.8 mm slices) and diffusion tensor (DT-) MRI (single-shot echo-planar imaging with 30 diffusion directions (b = 1000 s/mm2) and two b = 0 acquisitions, TR/TE = 7700/82 ms, 24 × 24 cm FoV, 128 × 128 acquisition matrix, 28 × 5 mm slices, 1 mm slice gap).
DCE-MRI was performed between one and up to three months after stroke, the delay being to avoid acute effects of the index stroke on local BBB leakage. It consisted of 20 consecutive 3D T1W FSPGR acquisitions (TR/TE = 8.2/3.1 ms, 12° flip angle, 24 × 24 cm FoV, 256 (anterior–posterior) × 192 acquisition matrix, 42 × 4 mm slices, 73 s acquisition time) with a total acquisition time of approximately 24 min, initiated simultaneously with an intravenous bolus injection of 0.1 mmol/kg gadoterate meglumine (Gd-DOTA, Dotarem, Guerbet, France). Two additional FSPGR acquisitions were obtained prior to contrast administration with flip angles of 2° and 12°, respectively, to calculate the pre-contrast longitudinal relaxation time T1.
Image processing
Magnetic resonance (MR) images were converted from DICOM to Analyze 7.5 format. Structural and DCE-MR images were aligned to the pre-contrast T1W image using rigid-body registration (FSL FLIRT; fsl.fmrib.ox.ac.uk/fsl/fslwiki/FLIRT/). 28
DT-MR images were processed using in-house software, which removed bulk motion and eddy current induced distortions using FSL FLIRT and generated a directionally averaged diffusion weighted image, MD and FA parametric images using standard methods based on multivariate linear regression. For each dataset, non-linear registration tools from the TractoR software package (www.tractor-mri.org.uk/diffusion-processing)29,30 were used to obtain the transformation between the brain extracted structural T2W image and the b0 diffusion volume.
T1 parametric maps were calculated using the signal intensities in the two pre-contrast images with flip angles 2° and 12° as previously described. 31
Signal enhancement maps (E t ) were calculated voxel-by-voxel at each time point t from the co-registered DCE-MRI data using the formula E t = (S t − S0)/S0, where S0 represents the FSPGR 12° signal. 25 A marker of BBB leakage was obtained by calculating the slope of the signal enhancement uptake curve using linear regression on all data points between time points 4 and 20 inclusive. The first three points were omitted as they represent mainly blood pool, not slow tissue leak. 32
Tissue segmentation and parameter measurements
FLAIR and GRE images were processed using in-house software (‘MCMxxxVI’)
33
to generate binary masks of the WMH; index and any prior stroke lesions were identified by a neuroradiologist and excluded from the tissue masks manually by a trained image analyst, blind to all other information, using Analyze 11.0 (AnalyzeDirect, KS). Similarly, NAWM and cerebrospinal fluid (CSF) masks were generated with MCMxxxVI using T1W and T2W images as previously described.
33
An example of MR images and segmentation masks is shown in Figure 1.
Example of images from a patient. (a) FLAIR images showing white matter hyperintensities, (b) binary masks of normal-appearing white matter in blue and white matter hyperintensities in red, MRI parametric maps: (c) fractional anisotropy, (d) mean diffusivity, (e) longitudinal relaxation time (T1) and (f) signal enhancement slope.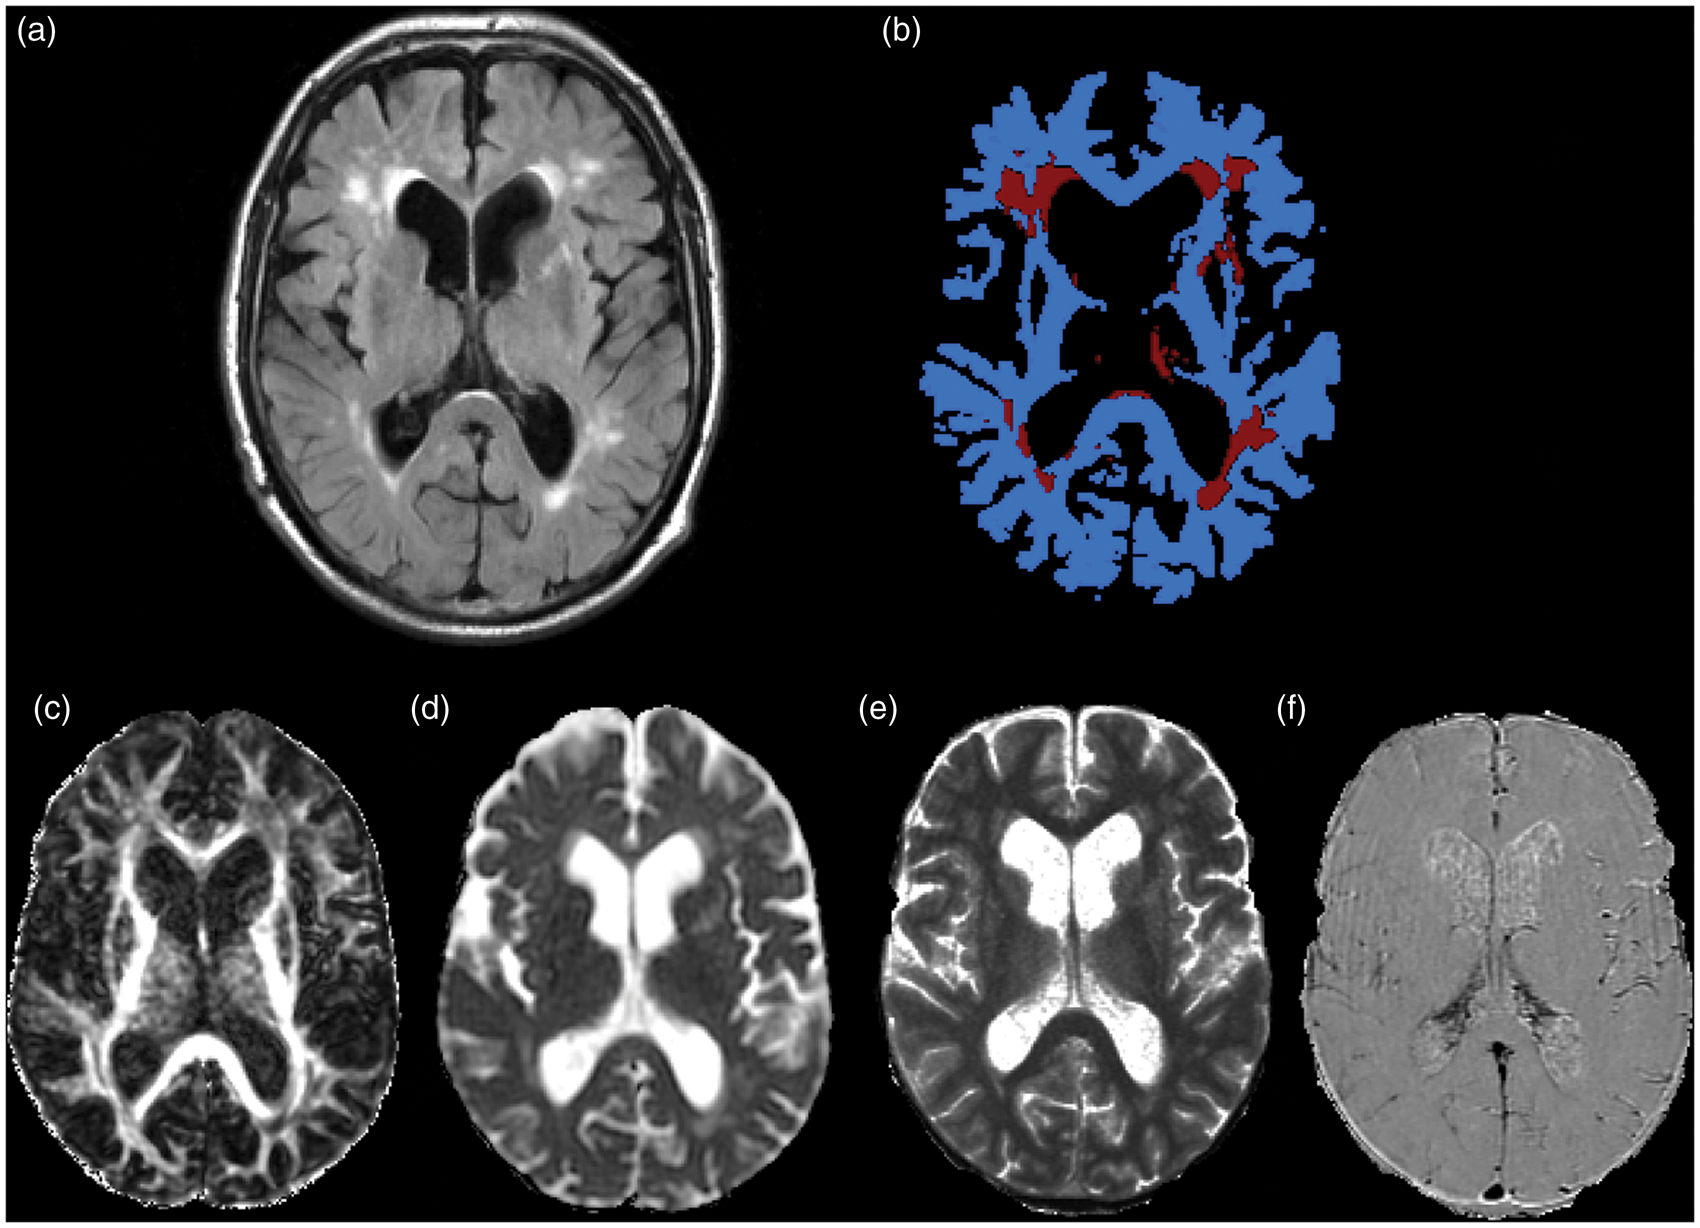
The binary tissue masks were used to extract the median T1 and signal enhancement slope in each tissue for each patient. The masks were then aligned to the FA and MD parametric maps using the non-linear transformation between the T2W and b0 volumes. To avoid partial volume averaging with CSF due to registration inaccuracies, the CSF mask was dilated by one voxel in each direction and then subtracted from the NAWM and WMH masks in the diffusion space. Masks were then thresholded, binarised and multiplied by the parametric diffusion maps to extract median MD and FA for NAWM and WMH in each patient.
Visual scoring of WMH
A qualitative assessment of WMH load was performed by an expert neuroradiologist, who scored hyperintensities in the FLAIR and T2W volumes using the Fazekas scale, blind to all other information. 34 A total score ranging from 0 to 6 was obtained by summing the periventricular and deep WMH Fazekas scores. WMH were rated with the Fazekas scale as it is one of the most widely used visual rating scales and has been in use for over two decades. Fazekas scores are also closely correlated with quantitative measures of WMH volumes. 35
Statistical analysis
We used paired t-tests and Cohen's d to assess the overall differences between the parameters measured in WMH and NAWM for the whole group of patients and their effect size.
The patient population was then divided in groups by total Fazekas scores as follows: ‘Low’, including patients with a total Fazekas score of 0, 1 and 2; ‘Medium’, patients with a total Fazekas of 3 and 4 and ‘High’, patients with a total Fazekas of 5 and 6.
Similarly, to enable visualisation of trends on Fazekas scores in relation to age, we divided the groups by approximate age quartiles as follows (age in years): ‘Group 1’: 30 < age ≤ 55; ‘Group 2’: 55 < age ≤ 65; ‘Group 3’: 65 < age ≤ 75 and ‘Group 4’: 75 < age ≤ 100.
As each patient contributed to the analysis with measures from each of two tissue types (NAWM and WMH), we assessed changes in MD, FA, T1 and signal enhancement slope using linear mixed models. A model was used for each MRI parameter (outcome value), with tissue type as a fixed effect and patient as a random effect. All estimates were adjusted for age (as a continuous variable), Fazekas group and vascular risk factors (hypertension, smoking status and pulse pressure). Age and pulse pressure were standardised to avoid computational problems that can occur when the scale of the predictor variables is of different orders of magnitude. We assumed non-constant variance for a better fit of the models. This analysis was performed in SAS 9.3 (www.sas.com).
To assess which parameter independently discriminated best between WMH and surrounding NAWM, and the strength of its prediction value, in each age group, we performed receiver-operator characteristic (ROC) curve analysis, using the manually corrected masks obtained with the semi-automatic method as ground truth. We assume that better discrimination between tissue types of a particular MRI parameter indicates a predominance of the associated microscopic process underlying WMH pathology. This analysis was performed using the R software environment for statistical computing (v. 3.1.0, R Development Core Team, 2014, 36 along with the ‘pROC’ package.
Plots were created using R with the ‘ggplot2’ and ‘epicalc’ packages. In all box plots, the boxes represent the lower and upper quartiles and the median measurement (thick line) for each group. Whiskers indicate the sample minimum and maximum, whereas the represented outliers (dots) differ from the lower and upper quartiles by more than 1.5 times the interquartile range.
Results
Patients and demographics
Two-hundred and sixty four patients were recruited from 10 May 2010 to 24 December 2012, of which 206 returned for permeability imaging. The total number of patients with either DT-MRI or DCE-MRI data suitable for the current analysis was N = 204; 81 Female, 123 Male; Mean Age (SD) = 66.0 (11.5), range (34.3–90.9) years, of whom 197 had both useable DCE-MRI and DT-MRI; two had unusable DT-MRI due to excess patient movement, and five had unusable DCE-MRI due to various factors including excess patient movement, incomplete injection of contrast due to failure of the cannula, or patient stopping the scan before completion.
Number of patients in each age and Fazekas groups and incidence of vascular risk factors.
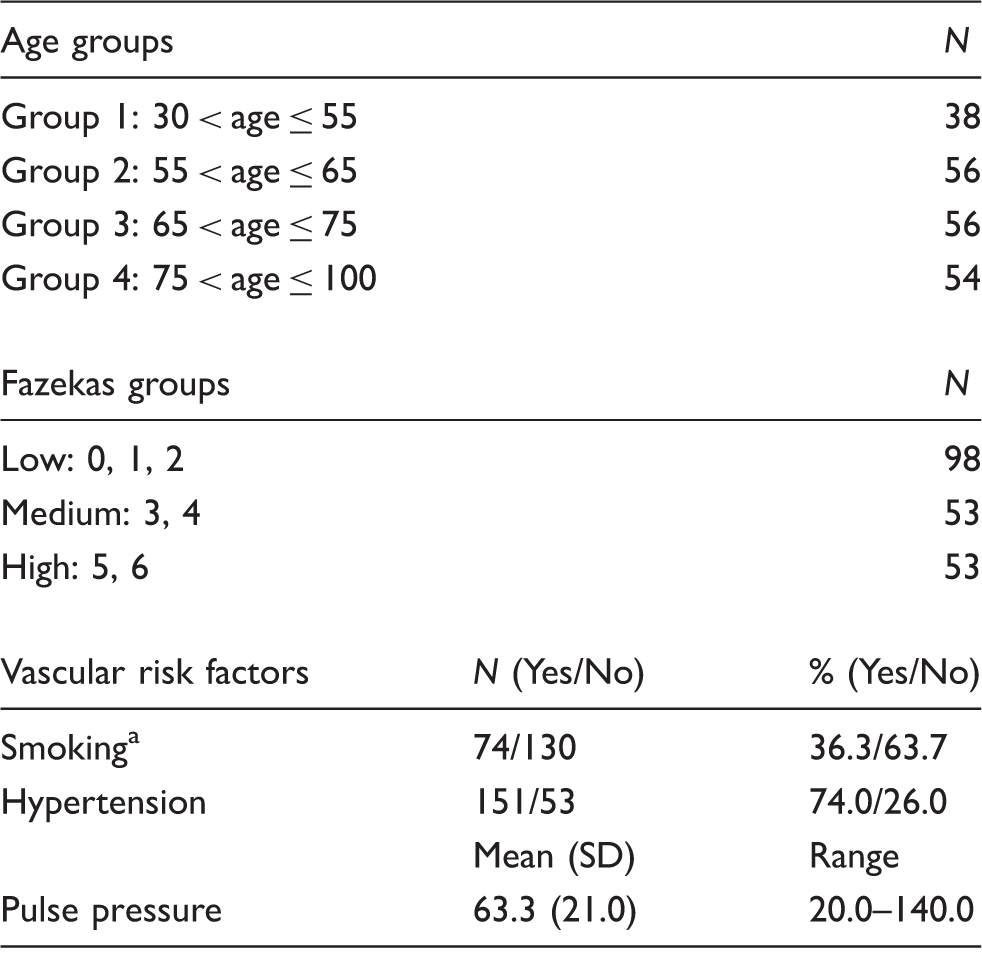
Current and recent ex-smoker = Yes; never and long-term ex-smoker = No.
Overall differences between NAWM and WMH
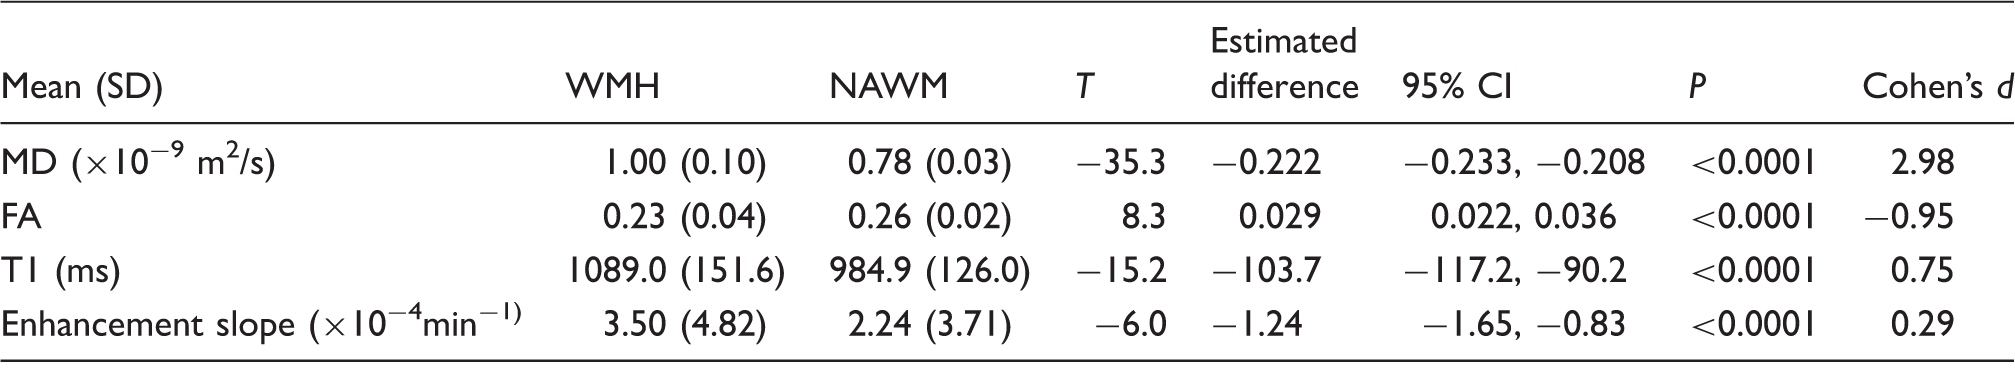
Across the whole group of patients, MD, FA, T1 and the signal enhancement slope differed significantly between WMH and NAWM, before adjusting for any other variables (Table 2). The effect sizes were largest for MD, as confirmed in Figure 2, where we observe a larger separation between the values measured for the two tissues. Although there was overlap between the signal enhancement slope values obtained in WMH and NAWM (Figure 2), the difference was still statistically significant (P < 0.0001).
Box plots of the imaging markers in white matter hyperintensities (WMH) and normal-appearing white matter (NAWM) for all 204 patients, before adjusting for any other confounds. Results from paired t-test comparing unadjusted measurements of imaging markers in WMH and NAWM in all 204 patients. MD: mean diffusivity; FA: fractional anisotropy; T1: longitudinal relaxation time; WMH: white matter hyperintensities; NAWM: normal-appearing white matter.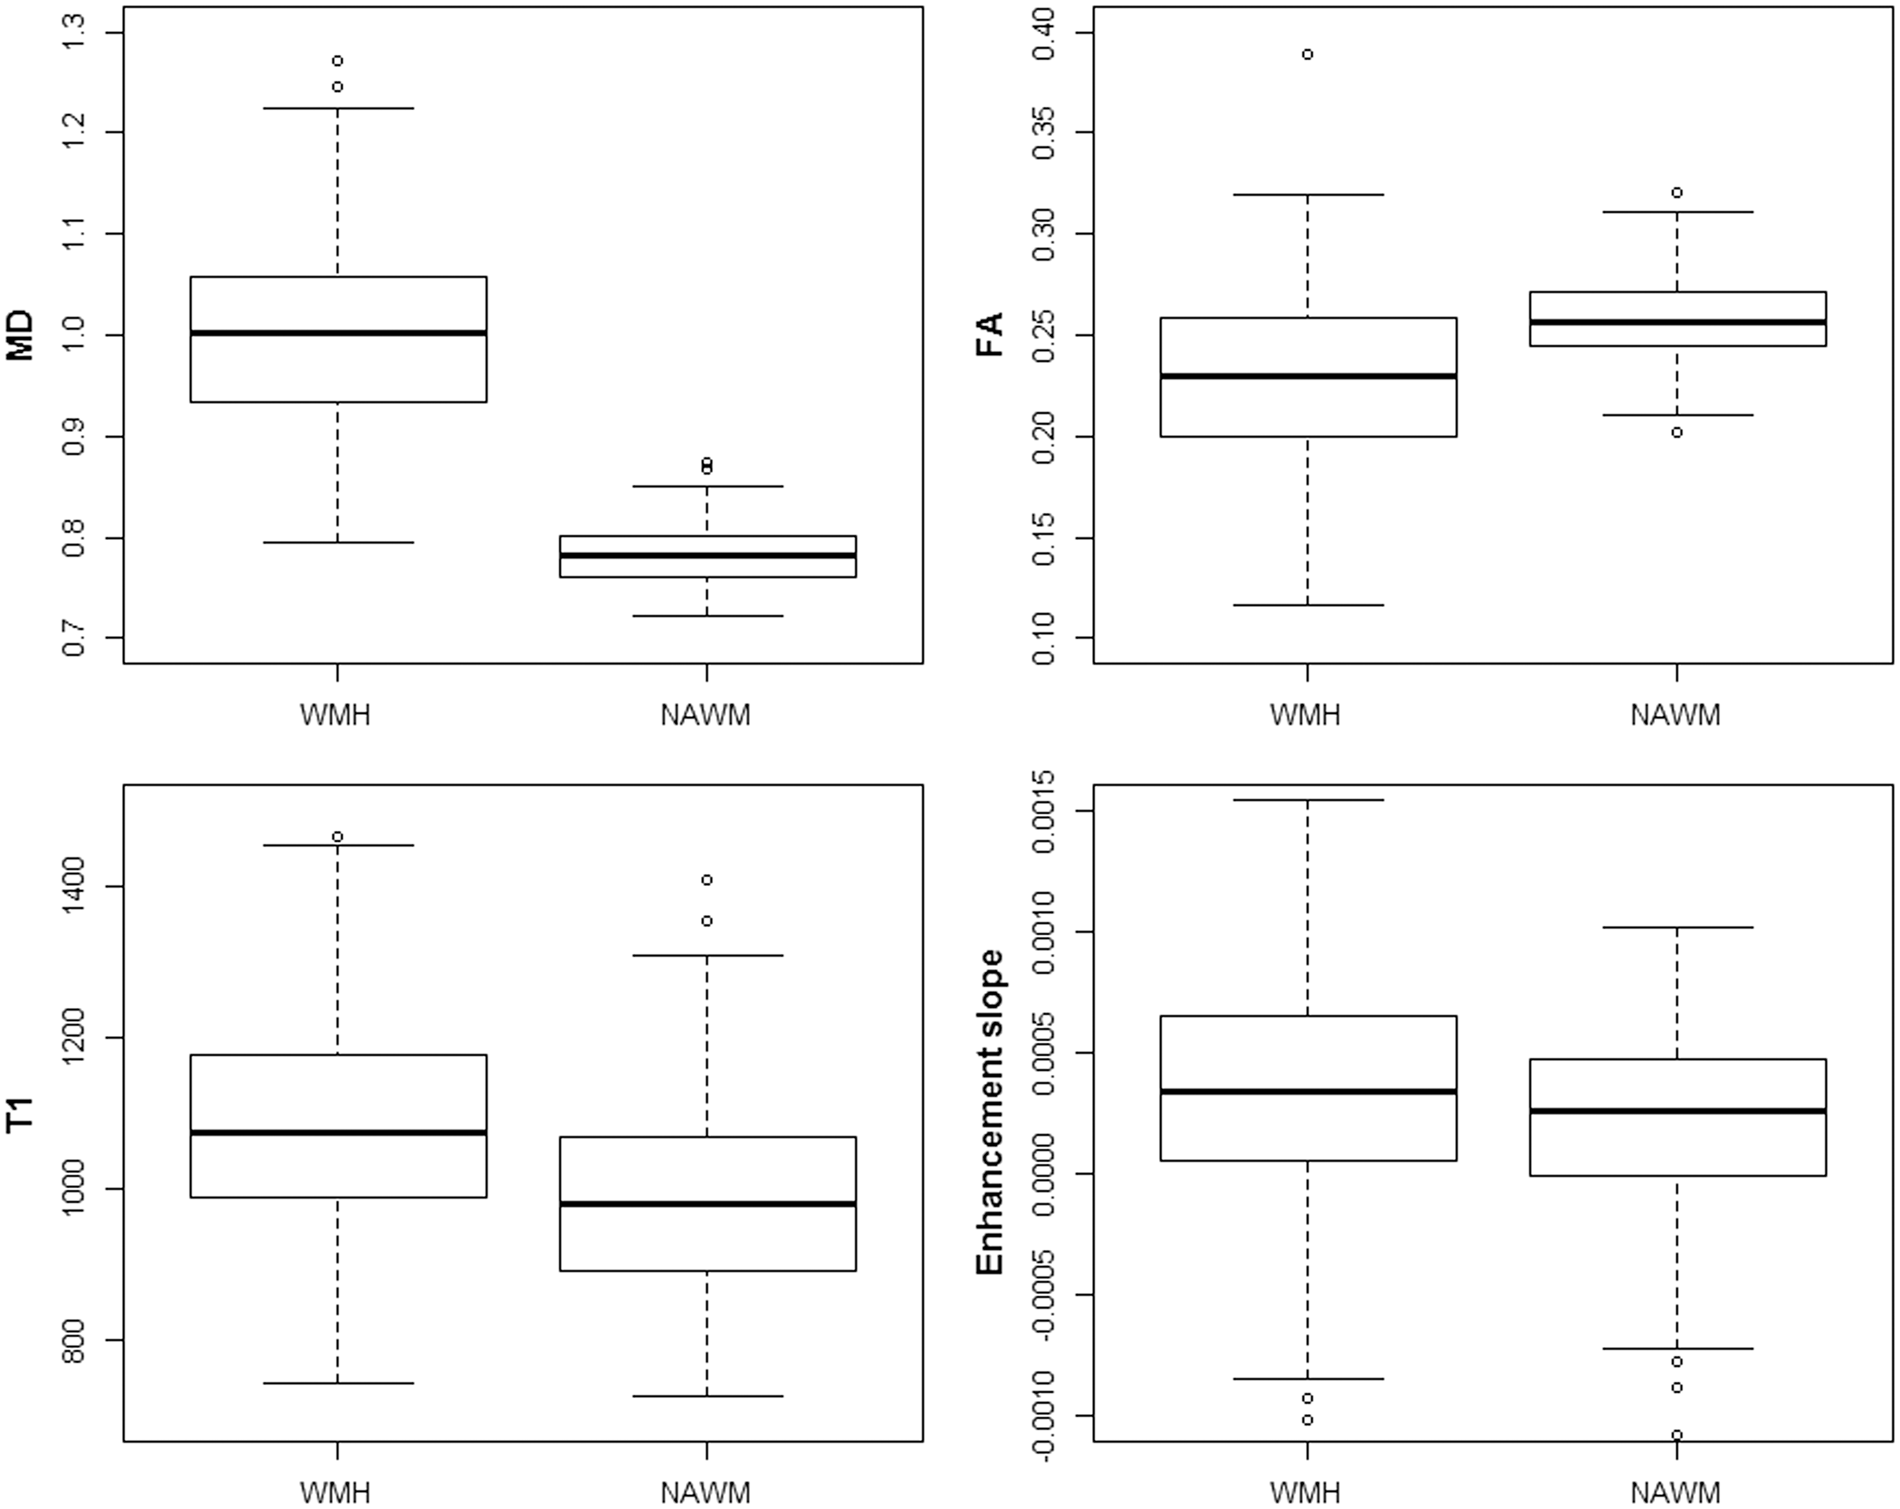
Tissue type, age and Fazekas effects on MD, FA, T1 and signal enhancement slope
To visualise the effects of age and WMH burden on MRI parameters in NAWM and WMH further, we divided the population into three WMH burden Fazekas score groups (0–2, 3–4 and 5–6 for ‘low’, ‘medium’ and ‘high’ WMH burden, respectively) and the four age quartiles (30–55, 56–65, 66–75 and 76–100), Figure 3. For each parameter, each panel represents one age group with differently shaded box plots for each Fazekas group.
Box plots of (a) mean diffusivity (MD), (b) fractional anisotropy (FA), (c) T1-relaxation time and (d) signal enhancement slope in white matter hyperintensities (WMH) and normal-appearing white matter (NAWM). Age groups are represented in panels: group 1: 30–55 years; group 2: 56–65 years; group 3: 66–75 years and group 4: 76–100 years. Fazekas groups are represented with different shaded box plots, with light colours for low Fazekas and dark colours for high Fazekas.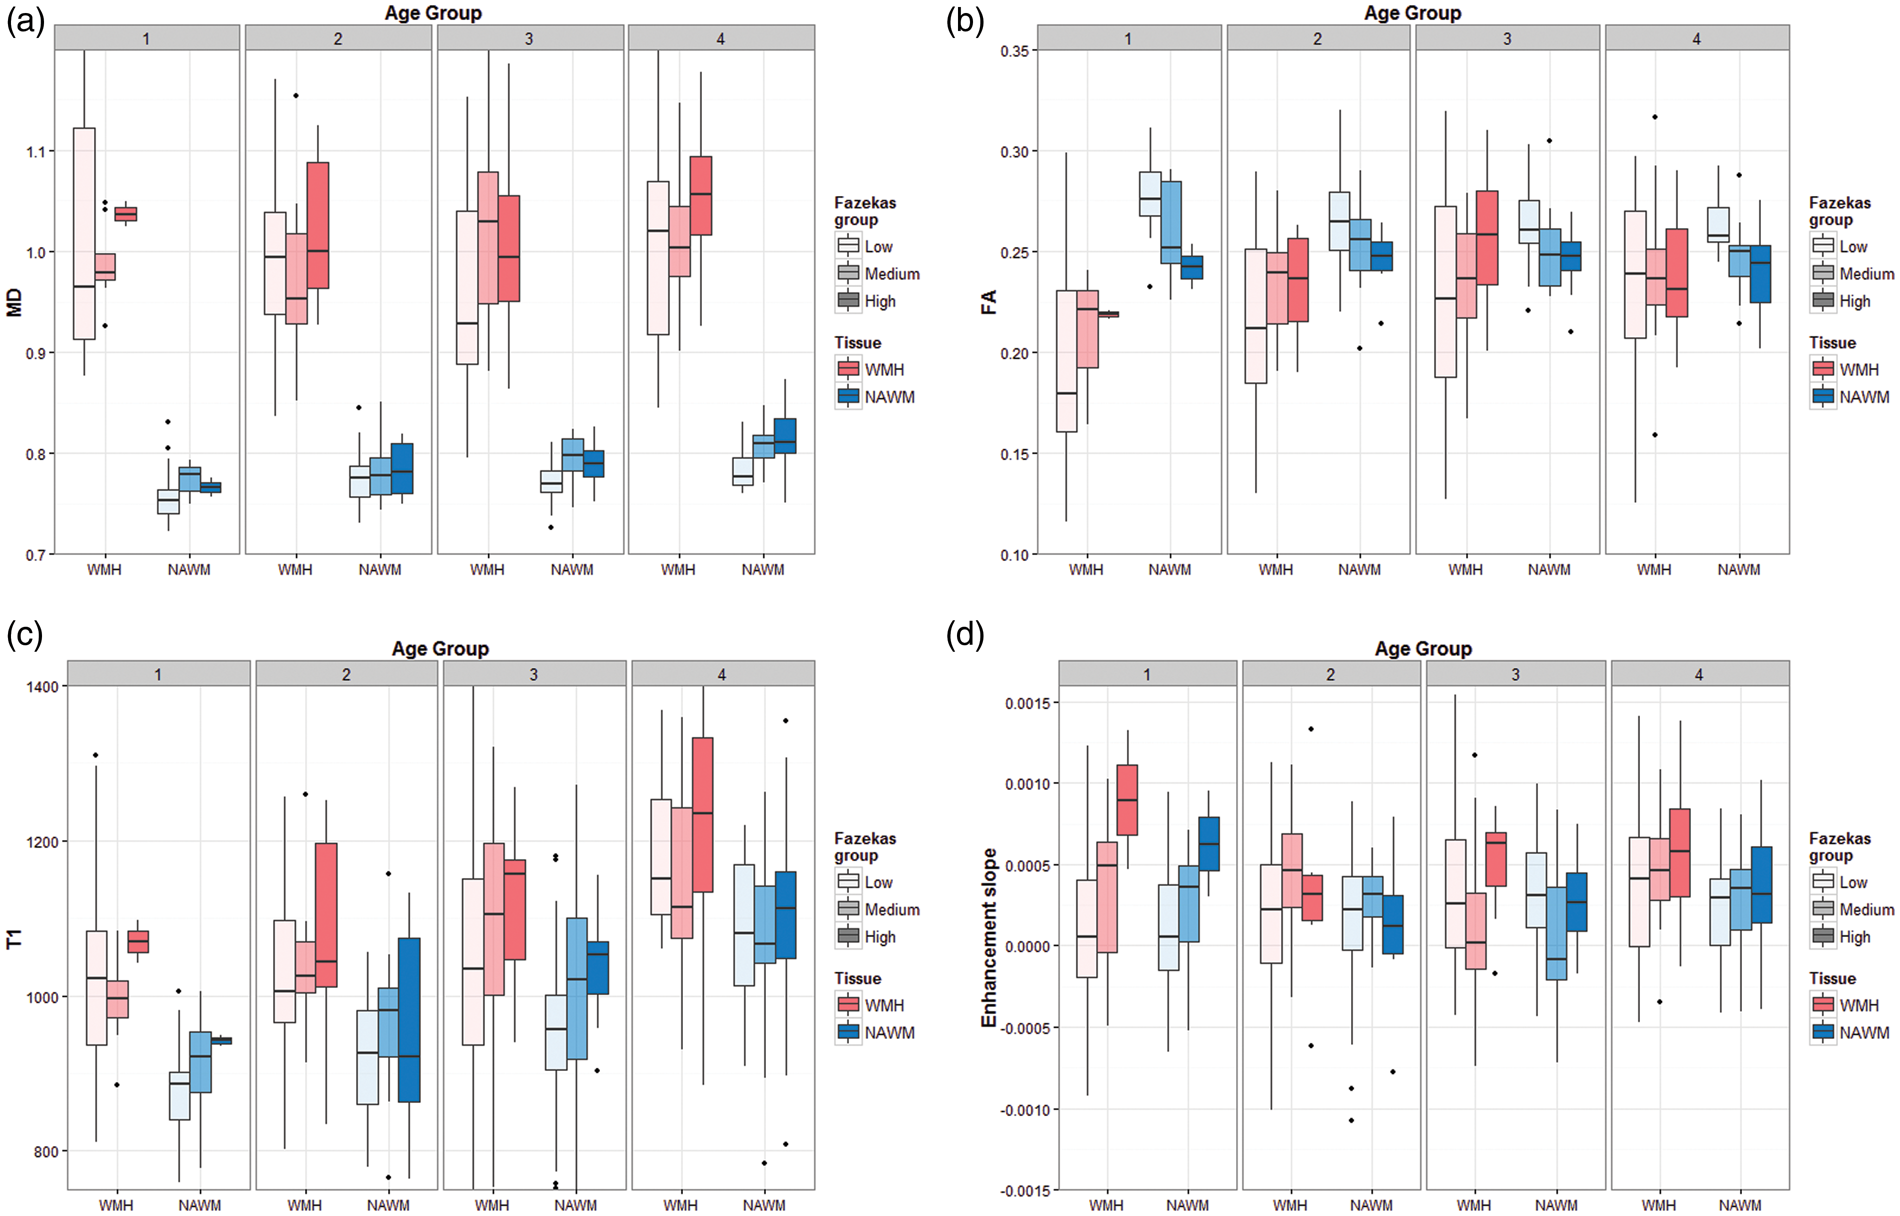
MD and T1 increased in NAWM and in WMH with increasing WMH burden and age. However, the tissue-MR parameter associations were more complex for FA and enhancement slope, indicating interactions between age, WMH and tissue type. Figure 3(b) shows that FA in NAWM is generally higher in patients with lower Fazekas score and lower for those with higher Fazekas scores, at all ages, indicating loss of NAWM integrity with increasing WMH burden, with the differences between low and high Fazekas groups appearing to be larger at younger ages. However, the opposite effect is evident in WMH, where the FA is overall higher for higher Fazekas and lower for lower Fazekas scores – although the FA range is very wide particularly in the low Fazekas score groups – indicating an interaction between Fazekas group and tissue type for FA. Also worth noting is that the overall difference in FA observed between WMH and NAWM is driven by the younger groups and lower Fazekas scores.
Results from the linear mixed models with MD, FA, T1 and signal enhancement slope as outcome.
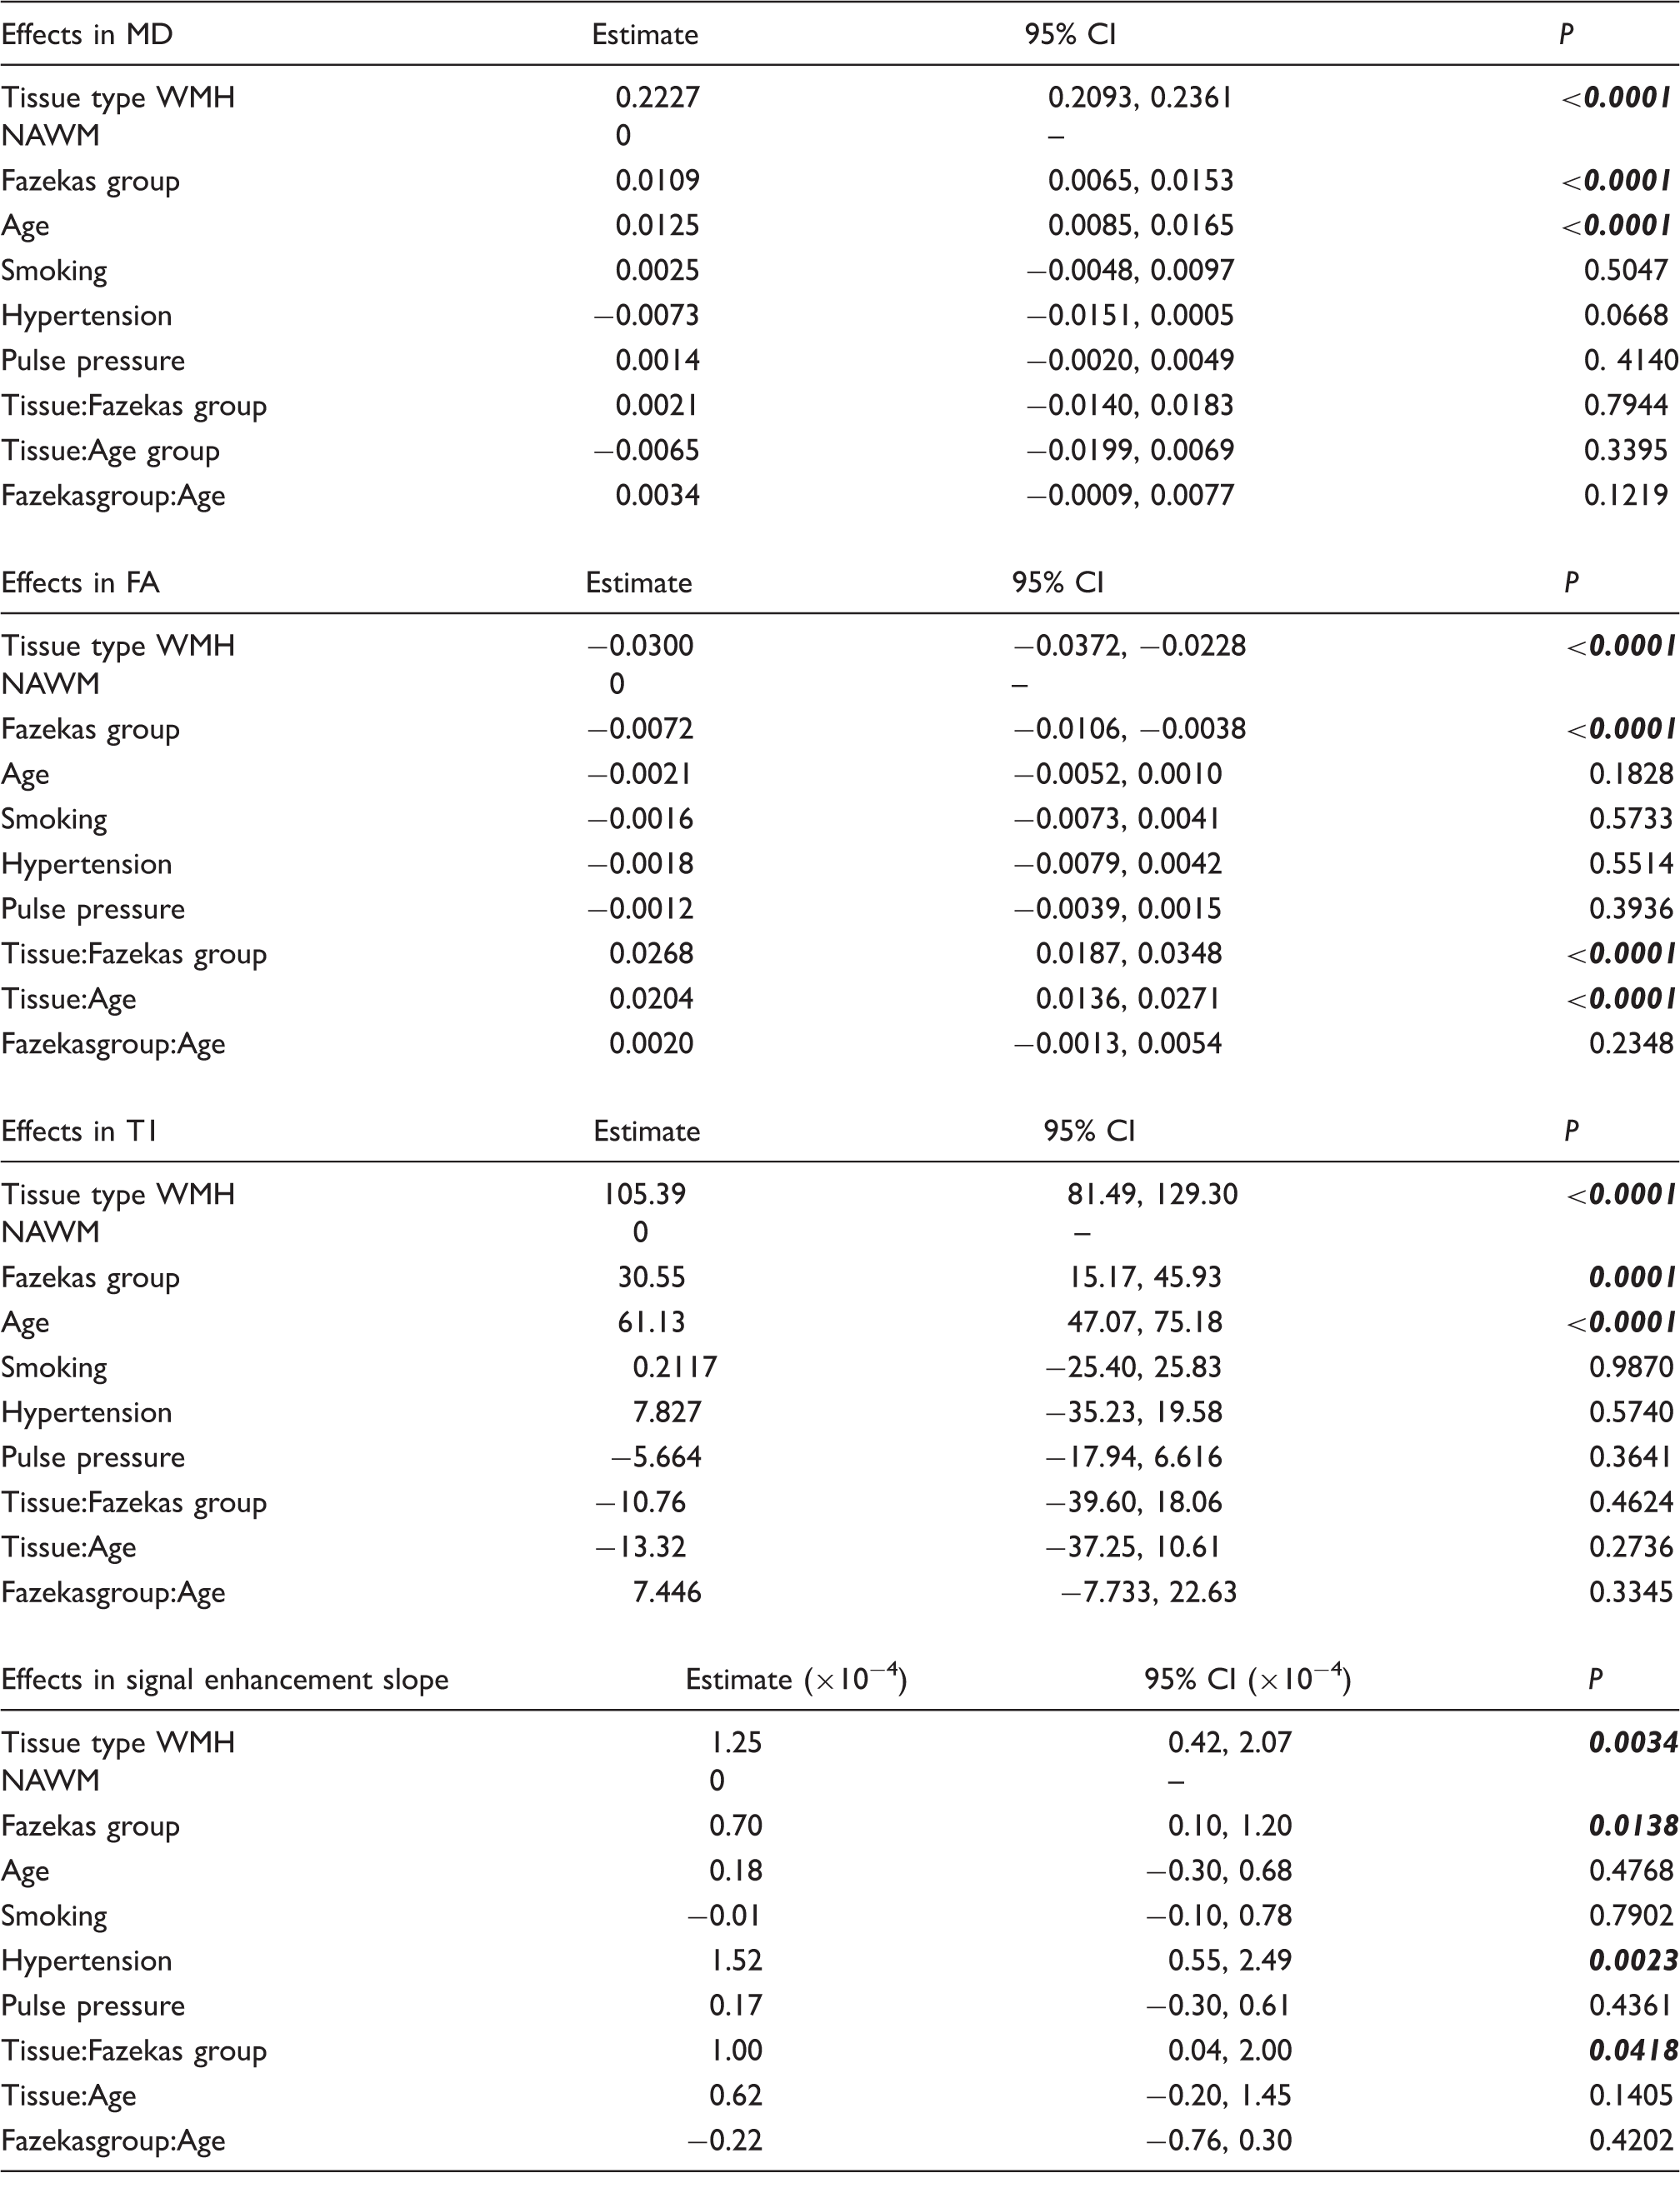
All estimates were adjusted for tissue type, age, Fazekas WMH group and vascular risk factors. For each sub-table, the first six rows present the results of the model with the main effects only (tissue type, Fazekas group, age and vascular risk factors), and the last three rows correspond to the models including one interaction term. Significant effects (P < 0.05) are in bold italic. MD: mean diffusivity; FA: fractional anisotropy; T1: longitudinal relaxation time; WMH: white matter hyperintensities; NAWM: normal-appearing white matter.
The interaction terms are most relevant for FA, where the interactions of tissue type with Fazekas scores and age were significant (P < 0.0001), supporting the patterns in Figure 3(b). There was also a significant interaction of tissue type with Fazekas group on the signal enhancement slope (P = 0.042), suggesting that differences in BBB leakage between WMH and NAWM are influenced by the overall WMH burden in the patient's brain, i.e., the more the WMH the greater the difference between NAWM and WMH. Indeed, Figure 3(d) shows that, for low-WMH burdens, there is a trend to increasing signal enhancement slope with age. As the WMH burden increases, that trend remains in patients aged over 55, but there is a striking increase in signal enhancement slope for younger patients with high-WMH burdens resulting in a ‘U-shaped’ relationship between age, WMH burden and signal enhancement slope. This ‘U-shaped’ pattern was not seen with the other MR parameters.
Effect of vascular risk factors
Of the vascular risk factors, only hypertension was associated with any of the MR parameters, and only with the slope of the post-contrast enhancement curve, which was steeper in hypertensive patients, suggesting more BBB leakage in patients with hypertension (P = 0.023).
Tissue discrimination of WMH from NAWM
Figure 4 shows the ROC curves obtained for each age group, with the area under the curve as indicative of the discrimination value of each parameter for distinguishing WMH from NAWM. MD was the best discriminator at all ages with near-perfect ROC curves, while the discrimination value of FA varied between age groups, confirming again the observations in Figure 3(b), and the significant tissue-age interaction effect. Also, the discriminating ability of FA and T1 decreased at older ages, but the signal enhancement slope increased with advancing age, suggesting a larger differential in BBB leakage between WMH and NAWM at older ages, perhaps reflecting a general increase in magnitude of signal enhancement slope in all tissues at older ages.
Receiver operating characteristic curves of the imaging parameters. Data were divided by age group with tissue type as outcome (WMH or NAWM).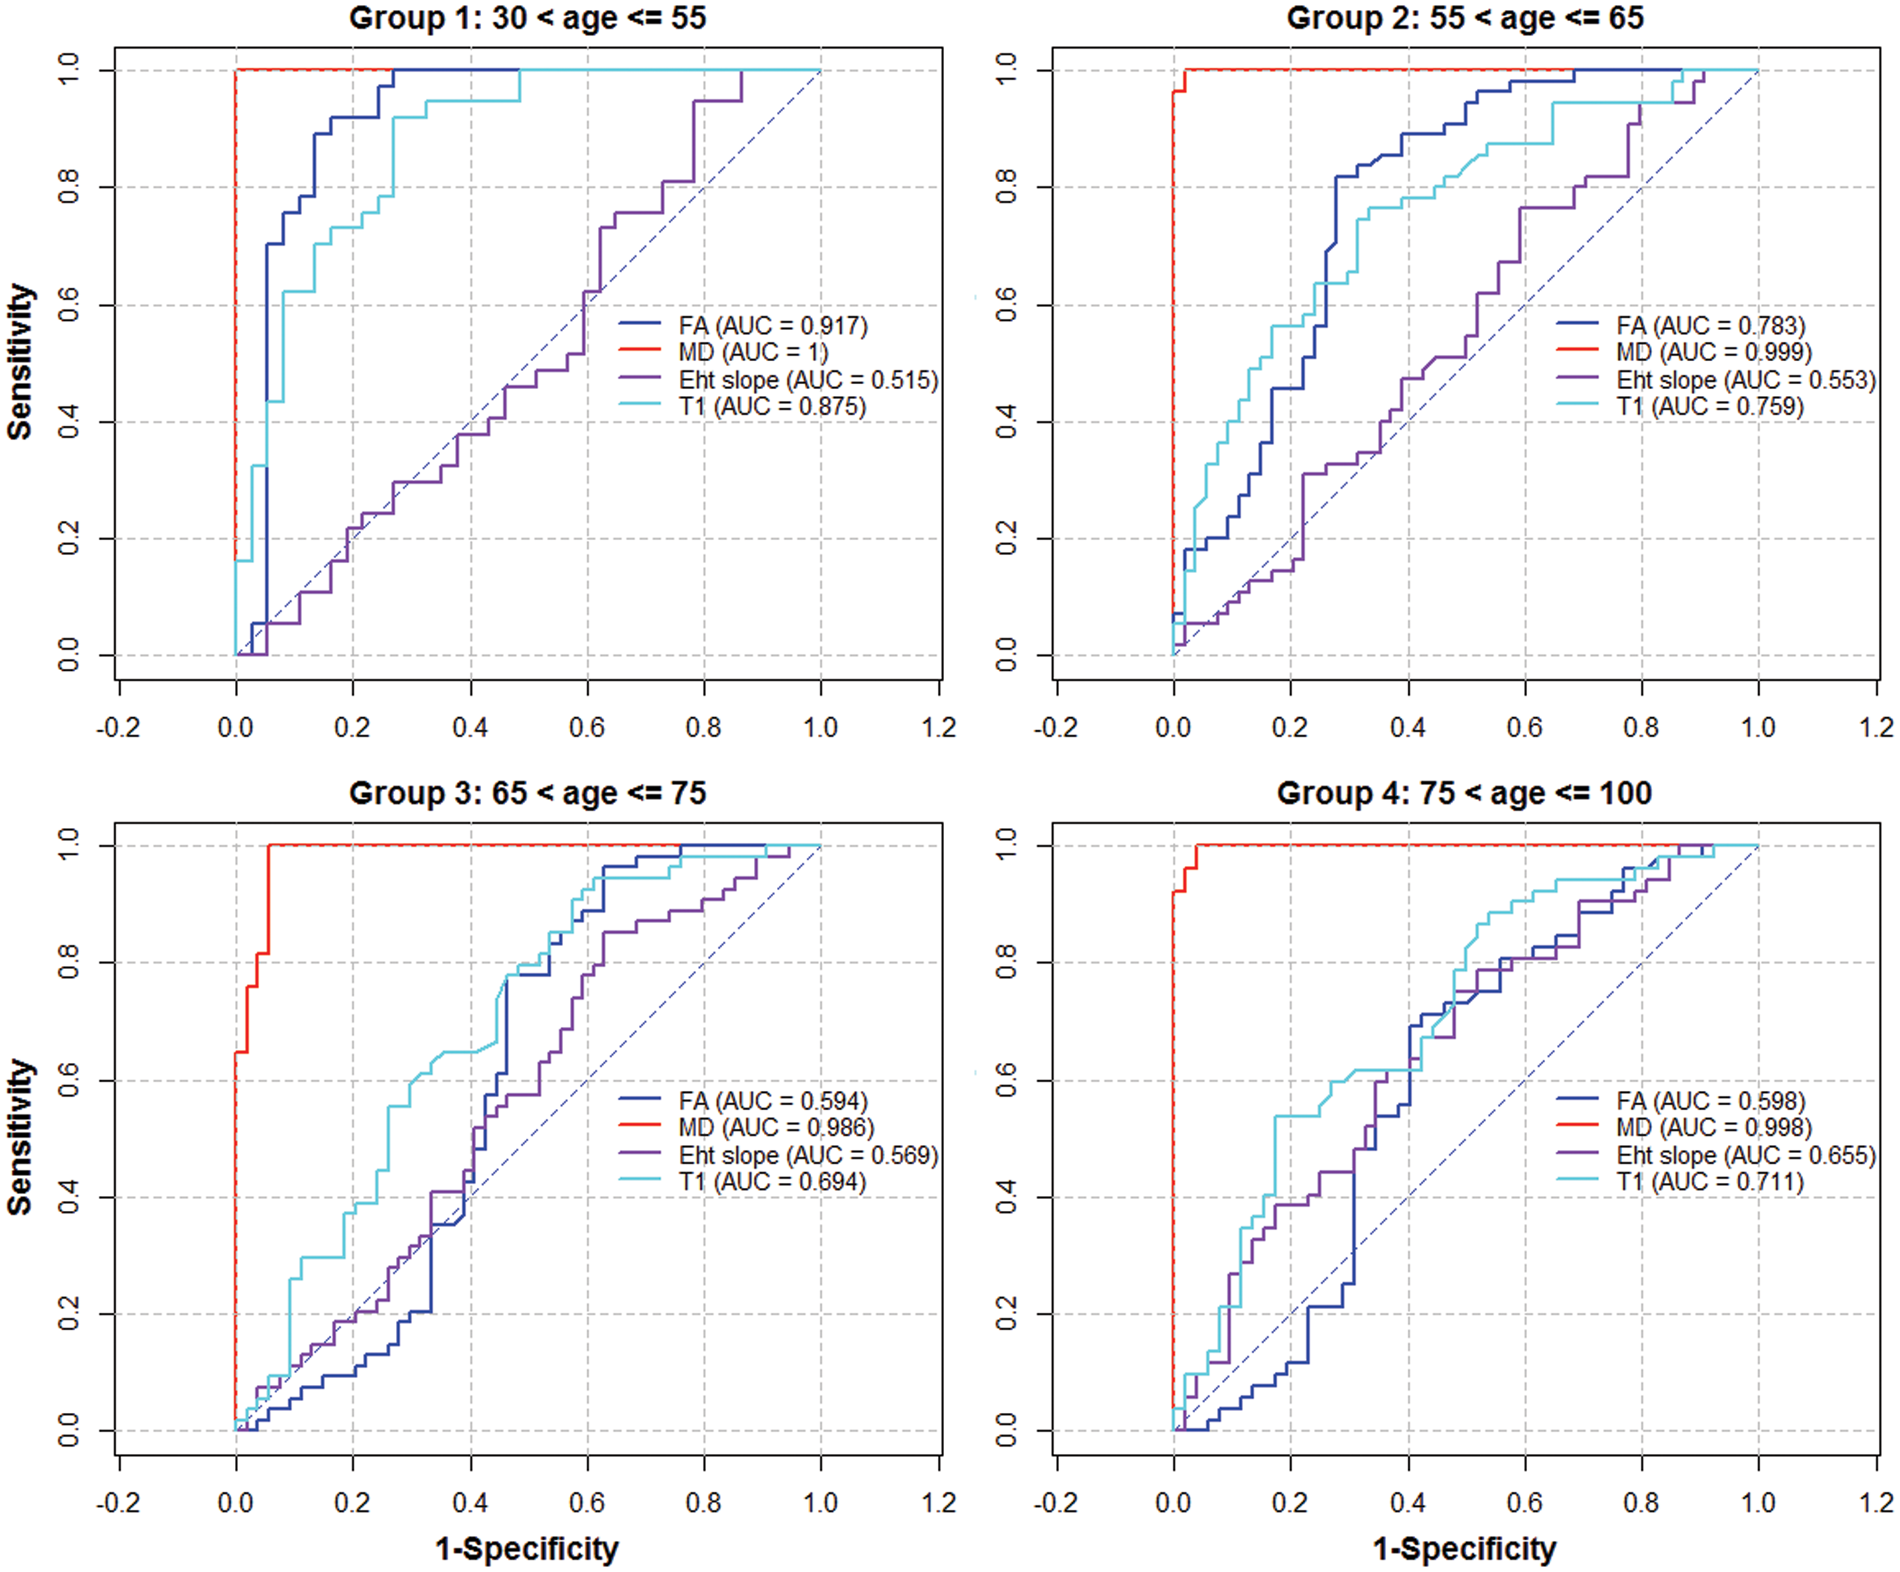
Discussion
The present study aimed to expand knowledge about the alterations taking place in the brain's white matter integrity that associate with WMH, with the aim of understanding whether BBB disruption could precipitate WMH formation. Better understanding of white matter damage is crucial to future efforts to preserve normal brain structure and function. We used parametric MRI to study these alterations in vivo in a wide age and WMH burden range patient cohort. We show significant effects of tissue type, and WMH burden in all four parameters, and effects of age in MD and T1 (Table 3). These results demonstrate that WMH have reduced integrity compared with NAWM, and that NAWM deteriorates with increasing WMH and age, confirming that NAWM in the presence of even a few WMH is not ‘normal’. 18 Furthermore, a high-WMH burden in younger people indicates advancing damage in NAWM and should sound alarm bells to identify remediable causes.
We recruited stroke patients with a wide range of ages to permit the cross-sectional analysis of alterations in imaging parameters in the presence of WMH across ages. We demonstrate that MD is by far the best discriminator between WMH and NAWM at all ages (Figure 4), whereas the discriminating ability of FA declines with age to give unreliable ROC curve performance values in patients aged over 65. Other studies suggested that FA was more sensitive to age-related white matter degeneration, 37 and that it was a good marker to differentiate WMH from NAWM, but the results were derived mainly from younger patients.16,17,38,39 However, we demonstrate that FA is affected by both age and WMH burden, with its discrimination value varying largely with age (Figure 3; Table 3). We show that the relationship between FA and WMH in younger people, or in those with few WMH, is different to the relationship between FA and WMH in older people, or with more WMH. Thus, while FA might help discriminate between NAWM and WMH in young people or with few WMH, it is less effective in older people or where WMH burden is high.
In contrast to previous studies, we included DCE-MRI-derived signal enhancement slope data to estimate alterations in BBB leakage. Absence of information on capillary density and hence permeability surface area was the main reason for using this semi-quantitative approach (see Heye et al. 32 , where these points are discussed in detail including the detrimental effect that assumptions used in permeability modelling about capillary density can have on apparent permeability values). This parameter complements the other in vivo MRI measurements of white matter integrity, and provides a more comprehensive account of the alterations occurring in brain during ageing and vascular disease. The signal enhancement slope increased in WMH compared with NAWM at all ages, and with WMH burden in both tissue types. This corroborates previous reports of elevated BBB permeability in various tissues in patients with small-vessel disease;10,40 however, the significant interaction between tissue type and Fazekas score has not been reported before. Our results indicate that differences in BBB leakage between WMH and NAWM depend on the overall WMH burden. This can be observed in Figure 3(d), where the differences between NAWM and WMH signal enhancement slope are generally larger in the ‘high’ Fazekas group and are particularly high for the youngest age group.
Our findings are consistent with reports of BBB leakage increasing with WMH burden using biochemical techniques, e.g., CSF/serum albumin ratios, see Farrall and Wardlaw 9 for a review; however, biochemical techniques do not detect regional brain differences in leakage, and hence determine spatially whether the BBB leakage is secondary to tissue damage in WMH or a precipitating factor. It is still unknown whether BBB leakage precedes white matter damage, 41 although our demonstration of increasing BBB leakage in NAWM with increasing WMH burden (Figure 3(d)), and hypertension suggests an influential role.
The histopathology of WMH has been attributed to altered cerebral blood flow (CBF) autoregulation and ischaemia; 42 however, prior tissue damage could likewise result in less need for blood and therefore reduced CBF, leaving unclear the sequence of events in WMH development. 43 Indeed, there was no association between low CBF and WMH progression in a recent longitudinal study, 44 where higher baseline WMH burden predicted decreasing CBF long-term, but lower baseline CBF did not predict worsening WMH. Thus, a process other than falling CBF/ischaemia may cause the WMH, with subsequent accumulating tissue damage in turn reducing the CBF requirement. Our findings, and emerging pathological evidence of increased interstitial fluid in WMH45,46 and perivascular oedema-related lesions, 23 suggest that BBB leakage is primary, while falling CBF and axonal damage occur later in sporadic WMH.
Biochemical studies also showed an association between increasing age and increasing BBB permeability, 9 and a recent MRI study of regional BBB permeability in the brain observed significant BBB breakdown in the hippocampus and a linear increase with age, 47 but only detected a non-significant trend of BBB permeability increase in other brain regions, including white matter. This is consistent with our data; Figure 3(d) shows a trend of steeper signal enhancement slope with older age for the low-Fazekas scores, although we observed a ‘U-shaped’ pattern for medium and high-Fazekas scores. These results suggest that BBB change in white matter with age is subtle, perhaps reflecting multiple, as yet poorly understood, modifying factors.
Another novel result of this study is the significant positive effect of hypertension on the signal enhancement slope. To our knowledge, this has not been reported previously. Hypertension is the strongest vascular risk factors for WMH, 7 so the association of hypertension with signal enhancement slope seen here provides further support for the role of increasing BBB leakage in WMH formation. Hypertension did not have a significant effect in previous studies of BBB dysfunction in cerebral small-vessel disease,10,40 but was associated with altered MD in healthy older 22 and younger subjects 38 suggesting increased interstitial water. The fact that hypertension is associated with increased BBB leakage, makes this an obvious target for intervention to prevent accumulating white matter damage and suggests a mechanism by which even moderate blood pressure increases could exert some of their effects.
While in NAWM we observed the expected changes in the imaging markers – MD, T1 and signal enhancement slope increasing and FA decreasing with both age and WMH load consistent with previous reports,9,10,17,18,40,48–50 – both age and Fazekas score had the opposite effect on the FA measured in WMH, with FA increasing with increasing age and Fazekas, Figure 3(b). This apparent altered direction of effect is partly driven by the wide range of WMH FA values when there are few WMH; as WMH burden increases, the FA is sampled from larger areas of tissue in more central deep white matter regions and that probably have more tissue destruction, yielding more uniform FA values. The increase of FA in WMH with Fazekas score could also be partly explained by the location of the WMH which generally appear in, or close to, areas of the brain with long association and commissural white matter tracts which have high FA values. As WMH extend, they could be recruiting these areas with higher initial FA, appearing in our measurements as higher median FA in the WMH of those with high Fazekas. The effect is also more obvious in the younger group (Figure 3(b)), where the FA heterogeneity is also larger. Alternatively, one study suggested that overt lesions do not fully account for the association of increasing age with decreasing tissue integrity, 16 corroborated in the current report where we find significant main effects of age on MD and T1, even when the effect of WMH burden was taken into account. This indicates that some of the NAWM changes related to normal ageing occur independently of WMH and that some mechanisms underlying age-related changes in NAWM may be independent from those triggering the development of WMH. This could be reflected as the different pattern of FA changes with age we observe between NAWM and WMH.
Therefore, we should be cautious in interpreting the increase in FA with age and lesion severity in the WMH. Since FA is generally considered a marker for axonal integrity, 51 these changes could be erroneously translated as an increase in integrity of the white matter in those areas. However, this is counter-intuitive and is not supported by neuropathologic examination19,20 or by the changes we detected in the other MRI parameters, therefore is much more likely to reflect brain location. The increase of FA in WMH with age and Fazekas was accompanied by increases in MD, T1 and signal enhancement slope. Both MD and FA are derived from measurements of axial and radial diffusivity, 13 and while MD reflects overall changes in water mobility, FA depends in the relative changes between the two components. The separate measurement of the axial and radial components of diffusion could provide more specific information about the magnitude and directionality of the water diffusion changes in WMH and potentially relate to alterations in myelination, axonal microstructure or interstitial fluid in future work.
The strengths of this study include the use of imaging and analysis methods which conform to STRIVE standards, 52 recruitment from a single centre which removes multicentre effects, careful blinded image analysis using validated methods and the use of non-linear registration between structural and diffusion spaces to minimize misclassification of tissue voxels in diffusion space. We assessed the changes in MRI parameters using mixed models including tissue as a predictor for the outcome variables (rather than studying each tissue independently) which allowed for the analysis of interactions of tissue with age or WMH burden. A weakness is the sample size, which although large for a MRI study of these characteristics (and the largest yet multi-parametric study of white matter integrity with MD, FA, T1 and DCE-MRI changes with age and WMH), was unable to detect some of the subtle changes in BBB permeability with age apparent in the graphs; also the skewness of the sample towards older ages, only 35 patients were < 55 years old reflecting the stroke population, and low WMH burden, with nearly half of the sample falling within the ‘low’ Fazekas category. Finally, it should be acknowledged that while signal enhancement slope is an assumption-free semi-quantitative measurement of BBB leakage, it may be influenced by variations in cerebral blood volume and other factors and provides relative, not absolute differences.
In conclusion, we present evidence of overall changes of white matter integrity associated with age and WMH burden. The largest effects were observed in MD, and this was the best discriminator between WMH and NAWM independent of age, suggesting that increased interstitial water is the predominant process underlying WMH pathology. Increases in MD were accompanied by increases in T1 and the signal enhancement slope from DCE-MRI suggesting that increased water mobility and content may be explained by subtle BBB leakage. These results support the hypothesis that BBB leakage, and not ischemia, precedes the development of WMH, and opens the possibility of developing therapeutic interventions at early disease stages, where interstitial fluid shifts may be reversible, and before demyelination and permanent damage occur. Caution should be taken when relying on FA as a sole measure of tissue state in WMH and NAWM, as it changes both with age and WMH burden, and its discrimination value varies largely with age. A combination of multiple parameters, including potential MRI markers of BBB leakage, provides more comprehensive information about the microstructural changes underlying white matter ageing and the pathogenesis of WMH. Large longitudinal quantitative imaging studies of WMH, including markers of permeability in a less skewed population, are encouraged to confirm the current results.
Footnotes
Funding
The author(s) disclosed receipt of the following financial support for the research, authorship and/or publication of this article: This work was funded by Wellcome Trust (SDM and MRI scanning costs; grant 088134/Z/09/A), Row Fogo Charitable Trust (MCVH, AKH), Age UK (SMM), NHS Lothian Research and Development Office (MJT), Scottish Funding Council and the Chief Scientist Office of Scotland for funding the Scottish Imaging Network: A Platform for Scientific Excellence (‘SINAPSE’; JMW, radiography staff).
Declaration of conflicting interests
The author(s) declared no potential conflicts of interest with respect to the research, authorship and/or publication of this article.
Authors' contributions
SMM contributed to DT-MRI analysis, statistical analysis and manuscript preparation. FMC contributed to manuscript preparation and statistical analysis. MCVH contributed to processing and analysis of structural MRI and DT-MRI. PAA contributed to design of imaging protocol, DCE-MRI and DT-MRI processing. SDM contributed to patient recruitment and assessment, collection of demographic data. AKH contributed to DCE-MRI analysis. MJT contributed to manuscript preparation. ES contributed to structural MRI analysis. KS managed the data. MSD contributed to oversight of patient clinical assessment and stroke subtyping. JMW contributed to study conception, funding and supervision, diagnostic MRI assessment and manuscript preparation.