
Abstract
Acidosis in the brain plays a critical role in neuronal injury in neurological diseases, including brain ischemia. One key mediator of acidosis-induced neuronal injury is the acid-sensing ion channels (ASICs). Current literature has focused on ASIC1a when studying acid signaling. The importance of ASIC2, which is also widely expressed in the brain, has not been appreciated. We found here a region-specific effect of ASIC2 on acid-mediated responses. Deleting ASIC2 reduced acid-activated current in cortical and striatal neurons, but had no significant effect in cerebellar granule neurons. In addition, we demonstrated that ASIC2 was important for ASIC1a expression, and that ASIC2a but not 2b facilitated ASIC1a surface trafficking in the brain. Further, we showed that ASIC2 deletion attenuated acidosis/ischemia-induced neuronal injury in organotypic hippocampal slices but had no effect in organotypic cerebellar slices. Consistent with an injurious role of ASIC2, we showed that ASIC2 deletion significantly protected the mouse brain from ischemic damage in vivo. These data suggest a critical region-specific contribution of ASIC2 to neuronal injury and reveal an important functional difference between ASIC2a and 2b in the brain.
Introduction
In neurological diseases such as ischemia, brain acidosis is a major cause of neuronal injury.1–3 The main neuronal proton receptor is the acid-sensing ion channel (ASIC).4–6 In the brain, both in situ hybridization and immunostaining data show that ASIC1a, 2a and 2b subunits are predominantly expressed in neurons.5,7–10 Although several other ASICs are also present in the brain, their expression is limited to specific regions or cell types.11–16 Thus, ASIC1a, 2a and 2b are the main ASICs determining acid-activated responses in the majority of brain neurons.
The current literature has shown that ASIC1a mediates neuronal injury induced by ischemia, multiple sclerosis, and traumatic brain injury.17–21 In contrast, few studies have directly assessed whether ASIC2, though widely expressed in most brain neurons, contributes to neuronal injury. We previously found that, following global ischemia, the surviving neurons had increased levels of ASIC2a. 22 This result suggests that an increased ASIC2a level might be protective in ischemia. On the other hand, in hippocampal neurons, ASIC2 deletion reduces acid-activated current and calcium rise.23,24 Although the effect of ASIC2 deletion in other neurons is unclear, the result in hippocampal neurons suggests that deleting or reducing ASIC2 has a protective effect against acidosis-related neuronal injury. Determining the exact role of ASIC2 in neuronal injury and revealing the underlying molecular mechanism is crucial for us to better interpret the role of acid signaling and ASICs in brain injury. In addition, given the differential vulnerability of various brain regions to ischemic injury, it will be important to determine a potential region specific effect of ASIC function.
Here, we assessed the effect of ASIC2 deletion on acid-activated current in various brain regions. Further, we explored the underlying mechanism and uncovered a differential contribution of ASIC2 to ASIC1a biogenesis, surface trafficking, and acidosis/ischemia-induced neuronal injury.
Materials and methods
Mice
ASIC2−/− mice on a congenic C57BL/6 background were kindly provided by Dr. Michael Welsh. Wild-type and knockout mice were maintained as described earlier. 24 Postnatal day 5–9 (P5–9) pups or young adult adults (either sex unless specified) were used. Animal care met National Institutes of Health standards. All procedures are in accordance with the Guide for the Care and Use of Laboratory Animals set by Association for Assessment and Accreditation of Laboratory Animal Care International and approved by the Animal Care and Use Committee at University of South Alabama and Morehouse School of Medicine. The report of animal experiments is in compliance with the ARRIVE guidelines.
Antibodies
Three ASIC1 antibodies were used in this study: a goat anti-ASIC1 (Santa Cruz, SC-13905), a rabbit anti-ASIC1 (MTY, from Dr. John Wemmie), and a rabbit ASIC1 antibody raised against synthetic peptide DKGVALSLDDVKRHNPC (DKG), which corresponds to amino acids 479–495 of mouse ASIC1a. The specific of these antibodies have been verified using ASIC1a−/− brain25,26 and Figure 2(a). Other primary antibodies used: mouse anti-tubulin (University of Iowa Developmental Hybridoma Bank and Sigma). Secondary antibodies used: Alexa 649-, 680-, 800-, and Dylight 680-, and 800-conjugated secondary antibodies (Invitrogen, Li-cor, and Pierce).
Constructs and reagents
Constructs encoding mouse ASIC1a, ASIC2a, and ASIC2b have been described earlier.24,27–29 All constructs used the same vector backbone of eGFP-c1, replacing eGFP with ASIC. All constructs contained the same Kozak sequence GCCACCATG, and were verified by sequencing. Other reagents used: NHS-sulfo-LC-biotin and NeutrAvidin beads (Pierce); N-ethylmaleimide (NEM, from Sigma); Endo H and PNGase F (New England Biolabs); proteinase inhibitor cocktail (Roche); culture media and serum (HyClone and Invitrogen). Other chemicals were from Sigma, Thermo Scientific, or Calbiochem.
Cell culture and transfection
NIH 3T3 cells were purchase from ATCC. 3T3 cells were cultured in DMEM hi-Glucose, supplemented with 10% fetal calf serum. Lipofectamine 2000 mediated transfection was performed in a manner similar to that described earlier. 25
Surface biotinylation and NeutrAvidin pull-down
Surface biotinylation in cells was performed as described earlier.25,30 For surface biotinylation of endogenous proteins in the brain, various brain regions were isolated in cold HBSS + 6 mg/ml glucose. In the initial experiments, we sliced the tissue to 200-µm thickness with a tissue chopper. In later repeats, we manually chopped the tissue into small pieces, and generated similar surface labeling result as slicing. The data obtained from slicing and manual chopping were pooled and analyzed together. All the following procedures were carried at 4℃ or on ice: the slices/tissue were transferred to a 2 ml tube containing 1 ml of ice-cold PBS with calcium and magnesium (PBS+/+), centrifuged for 15–30 s at 500 rpm and the supernatant discarded. Next, 1.5 ml of Sulfo-NHS-LC-Biotin (0.5–1 mg/ml in PBS) was added to the tissue and the tubes were rotated for 40–45 min at 4℃. The tissue was spun down, and rotated at 4℃ for 5–10 min in PBS with 100 mM glycine (to quench unreacted biotin). Biotinylated slices were lysed in lysis buffer (PBS 1% triton X-100 0.5% SDS) with freshly added proteinase inhibitors (1.2×) and 1 mg/ml NEM. NeutrAvidin pulldown were performed as described earlier.25,30 To ensure same loading into the surface fraction, we started with equal amount (typically 1 or 1.5 mg) of proteins for all samples in the same set of experiment for surface pulldown with NeutrAvidin beads. The surface samples were eluted in same volume, typically 60 µl, in the same experiment, and equal volume was loaded onto the gel.
De-glycosylation
De-glycosylation with Endo H or PNGase F was performed similar to that described earlier.25,31 Briefly, the samples were denatured in 1× denaturing buffer at 95℃ for 5–10 min. Reaction buffers were added to 1×, following manufacturer’s instructions. For PNGase F digestion, NP-40 was also added to a final concentration of 1%. To 300 µg proteins, we added at least 0.08 IUB milliunit (mIUB) PNGase F or 1 mIUB Endo H for 3T3 lysate, or 0.6 mIUB PNGase F or 4 mIUB Endo H for brain lysate. The reaction mixture was incubated overnight at 37℃.
Brain lysate and Western blotting
Whole brain or biotinylated brain slices were homogenized in lysis buffer: PBS with 1% Triton X-100, 0.5% SDS, and freshly added protease inhibitors and 1 mg/ml N-ethylmaleimide (NEM). Lysates were sonicated briefly and cleared by centrifugation. Protein concentration was quantified using a Bio-Rad RC-DC kit. Equal amounts (typically 20 µg) of brain lysate were loaded per lane for Western blot.
The samples were separated by 8% or 10% SDS-PAGE and transferred to nitrocellulose membranes. Blotting was performed according to instructions of the Odyssey Imaging System (Li-cor). Antibody dilutions were: goat anti-ASIC1 1:1000; rabbit anti-ASIC1 (MTY) 26 1:5K–30K; rabbit anti-ASIC1 (DKG) 1:2K; monoclonal anti-tubulin 1:30–60K; secondary antibodies were used at 1:10–16K. Blots were imaged using an Odyssey Infrared Imaging System according to manufacturer’s instructions. Densitometry of imaged bands was performed in NIH ImageJ as described earlier.27,29
Slice culture, acidosis, oxygen-glucose deprivation (OGD), and live/dead staining
Organotypic mouse hippocampal slices were cultured as described earlier.25,27 For organotypic cerebellar slice cultures, whole cerebellum of P8–9 mouse pup was removed and parasagittal slices (350-µm thick) were cut with a tissue chopper. The slices were then transferred onto Falcon polyethylene terephthalate-etched membrane culture inserts with 1 µm pores (Fisher) in 6 well plates. Each well contains 1.2 ml FCM (25% HBSS, 25% horse serum and 50% MEM with 2 mM glutamax, 1.5 mg/ml glucose, 5U/ml pen/strep, and supplemented with extra 4.5 mM NaHCO3). Slice cultures were kept in a humidified CO2 incubator maintained at 37℃ 5.5% CO2 for 10–14 DIV. Slices were fed every 2–3 days.
For studying acidosis-induced injury, we used the following medium: 74% MEM, 25% HBSS, 1% horse serum, with 1.5 mg/ml glucose. To buffer pH, we used 20 mM HEPES for pH 7.4 and 20 mM MES for pH 5.8. On the day of treatment, the medium was warmed to 37℃, and the pH re-adjusted 2 times with 1- to 2-h intervals. After this procedure, the pH of the medium can be clamped to the set value for the duration of the acidosis experiments. We initially performed a dose response of different pHs and found that pH 5.8 gave consistent injurious outcomes (not shown). Therefore, in this study, we used pH 5.8 to study acidosis-induced neuronal injury.
For OGD, slices grown on culture inserts were rinsed twice with XCSF (xylose substituted artificial cerebral spinal fluid) (in mM): 128 NaCl, 3.5 KCl, 24 NaHCO3, 1.2 NaH2PO4, 10 Xylose, 1.8 CaCl2, 1.2 MgCl2, or MgSO4, osmolarity adjusted with additional Xylose to 315–320 mOsm), with 1 ml XCSF added to the top of the inserts, and transferred to 100 mm dishes containing XCSF. Dishes were transferred to a cell culture chamber and fluxed for 5 min at 1.6–1.8 psi with 95% N2O 5% CO2, which was humidified through a 37℃ water reservoir. To ensure efficient gas exchange, the lids of the dishes were lifted during OGD. The 5 min protocol was determined based on our measurement of pO2 in the medium, which was reduced to 4.2% after 5 min of flux. The chamber was maintained airtight for the specific duration as described in the corresponding experiments. Total time (including the 5 min flux time) is reported as the OGD duration (45 min) in this study. For controls, slices were changed into standard ACSF (same as XCSF above, except that the initial 10 mM xylose was substituted with glucose). At the end of OGD, control and treated slices were transferred into their original 6 well plates, and regular FCM was added back to the inserts.
We performed live/dead staining 22–24 h after acidosis or OGD. This assay for delayed neuronal injury has been adopted from multiple previous studies regarding acidosis- and ischemia-induced injury.18,21,32–34 Two microliters of Syto-13 and 9 µl of propidium iodide (3 mg/ml) were diluted with 2.6 ml FCM, and 0.4 ml of this medium was mixed with the culture medium (1.2 ml) in the culture plate, and 0.8 ml of the resultant staining medium was added on top of the insert. Plates were returned back to the incubator for 1 h, and 0.8 ml of the staining medium was transferred again to the top of the insert, and incubated for another hour. Staining medium was removed, and 1 ml of ice-cold HBSS with calcium and magnesium (HBSS+/+) containing 6 mg/ml glucose was added to the top of the insert. The inserts were kept for 20–30 min on ice or at 4℃ to allow most HBSS buffer to pass through the insert. Slices were then fixed for 10–15 min with 4% paraformaldehyde in HBSS+/+, 6 mg/ml glucose, 20 mM HEPES, pH 7.4.
Confocal microscopy and analysis
Confocal images were captured using a laser scanning microscope (Nikon A1), similar to that described earlier.25,29 Briefly, illumination was provided by an argon (Ar, 458, 488, 514 nm lines) and a 561 diode laser. Green and red channels were imaged sequentially to eliminate bleed-through, using 488 nm excitation and a 525/50 emission filter and 561 nm excitation and a 595/50 emission filter, respectively. Images were captured with a 4× lens. Maximal projection images were exported and fluorescence intensity for each channel were quantified with NIH ImageJ. For hippocampal slices, we quantified the CA1 region. For cerebellar slices, we quantified the whole slice. The obtained fluorescence intensity was exported from ImageJ and further analyzed and plotted in Microsoft Excel.
Focal ischemia
The induction of transient focal ischemia was performed as described earlier. 18 Briefly, 9-week-old WT and ASIC2−/− male mice (on congenic C57BL/6 background) were used for this study. WT mice were randomly assigned to the sham-operated control group (5 mice) or the MCAO group (8 mice). Mice were anesthetized and maintained with 1.5% isoflurane, 70% N2O, and 28.5% O2 with intubation and ventilation. Rectal and temporalis muscle temperatures were kept at 37℃ ± 0.5℃ with a thermostatically controlled heating pad and lamp. A probe for measuring cerebral blood flow is attached to the skull with cyanoacrylate adhesive. Under an operating microscope, the bifurcation of the common carotid artery (CCA) was exposed and the external carotid artery ligated. The internal carotid artery (ICA) was isolated, the extracranial branch of the ICA was ligated, and then a 7-0 silicon coated monofilament nylon surgical suture (Doccol) was introduced into the ICA lumen and advanced 7–8 mm past the CCA bifurcation. Suture occlusion of the middle cerebral artery (MCAO) was performed for 60 min. Cerebral blood flow was monitored by transcranial LASER Doppler (Perimed PF 5010 LDPM). Among all mice subjected to MCAO (8 WT and 7 ASIC2−/−), one WT mouse had blood flow not reduced below 20% and was excluded. None of the mice died during and/or following MCAO. Twenty-four hours after MCAO, mice were sacrificed and brains were sectioned coronally at 1 mm intervals and stained by vital dye immersion: (2%) 2,3,5-triphenyltetrazolium hydrochloride (TTC). Infarction area was calculated by subtracting the normal area stained with TTC in the ischemic hemisphere from the area of the non-ischemic hemisphere. Infarct volume was calculated by summing infarction areas of all sections and multiplying by slice thickness. All manipulations and analyses were performed by individuals blinded to treatment groups.
Electrophysiological studies of acutely dissociated cerebellar granule neuron and cortical pyramidal neuron
Acute dissociation mature neurons has been well documented. 35 These neurons, though losing fine processes, have the advantage of been fully mature and electronically compact. 35 Acute isolation of cerebellar granule neurons and cortical neurons was performed similar to what was described previously.35,36 Briefly, adult mice (10–12 weeks) were anesthetized with isoflurane followed by cervical dislocation and decapitation. The brain tissues were dissected, sliced at 1-mm thickness, and incubated in oxygenated extracellular solution containing 3.5 mg/ml papain for 30 or 60 min for cortical or cerebellar granule neurons, respectively. Tissues were then washed three times and incubated in enzyme-free extracellular fluid (ECF) for 30 min before mechanical dissociation. ECF contained (mM): 140 NaCl, 5.4 KCl, 20 HEPES, 10 Glucose, 2 CaCl2, 1 MgCl2, pH 7.4, adjusted with NaOH and HCl, 320–330 mOsm. The cells were isolated in 35 mm dishes containing 1 ml ECF by mechanical dissociation using two fine forceps. Patch-clamp recording started 15 min after the mechanical dissociation. ASIC currents were recorded with the whole-cell patch-clamp and fast perfusion techniques. For fast-perfusion, a multi-barrel perfusion system (SF-77B, Warner Instruments, Hamden, CT) was used. Patch pipettes were pulled from borosilicate glass. Intracellular solution contained (mM): 140 CsF, 1 CaCl2, 10 HEPES, 11 EGTA, 2 TEA, 2 MgCl2, 4 MgATP, pH 7.3, adjusted with CsOH, 290–300 mOsm. When filled with the intracellular solution, pipettes had a resistance of 3–4 MΩ or 5–6 MΩ for cortical or cerebellar granule neuron recordings, respectively. Whole-cell currents were recorded using Axopatch 200B amplifiers (Axon Instruments, Foster City, CA). All data were filtered at 2 kHz and digitized at 5 Hz using Digidata 1320 DAC units (Axon Instruments). Data acquisition was done using pCLAMP software (version 9.2, Axon Instruments). The recordings with an access resistance of less than 10 MΩ and a leak current less than 100 pA at −60 mV were included for data analysis.
Culture of striatal neurons and electrophysiological recordings
Culture of WT and ASIC2−/− striatal neurons was performed as described earlier. 37 Neurons were maintained at 37℃ in a humidified CO2 incubator. Cultures were fed twice per week and used for electrophysiological recordings after 11–14 days in culture. Acid-activated current was recorded as described previously. 37 Briefly, whole-cell currents or membrane potentials were recorded using Axopatch 200 B amplifiers (Axon CNS, Molecular Devices). Data were filtered at 2 kHz and digitized at 5 Hz using Digidata 1320 or 1440 DAC units (Axon CNS, Molecular Devices). The on-line acquisition was done using pCLAMP 10 software. During each experiment, a voltage step of −10 mV from the holding potential was applied periodically to monitor the cell capacitance and the access resistance. Recordings in which either the access resistance or the capacitances changed by more than 10% during the experiment were excluded from data analysis.
Statistical analysis
For comparisons between two groups, we used student’s t-test. For multiple comparisons, we used ANOVA with a Bonferroni or Turkey’s HSD test. Data were reported as mean ± s.e.m. for the number of samples indicated.
Results
ASIC2 deletion reduced acid-activated current in cortical and striatal but not cerebellar neurons
A recent study shows that deleting ASIC2 reduced pH 5-activated current in hippocampal neurons by ∼50%.
23
To answer whether the effect of ASIC2 deletion is region-specific, we studied acid-activated currents in WT and ASIC2−/− neurons isolated from cerebellum, cortex, and striatum. We focused on these regions because previous studies have shown that they are relatively vulnerable to neuronal injury.38–40 WT and ASIC2−/− cerebellar granule neurons did not show differences in acid-activated current density (Figure 1(a)). In contrast, deleting ASIC2 reduced acid-activated currents in both cortical and striatal neurons (Figure 1(b) and (c)). These data suggest that ASIC2 plays a critical role in acid-mediated responses, at least in hippocampal, cortical, and striatal neurons.
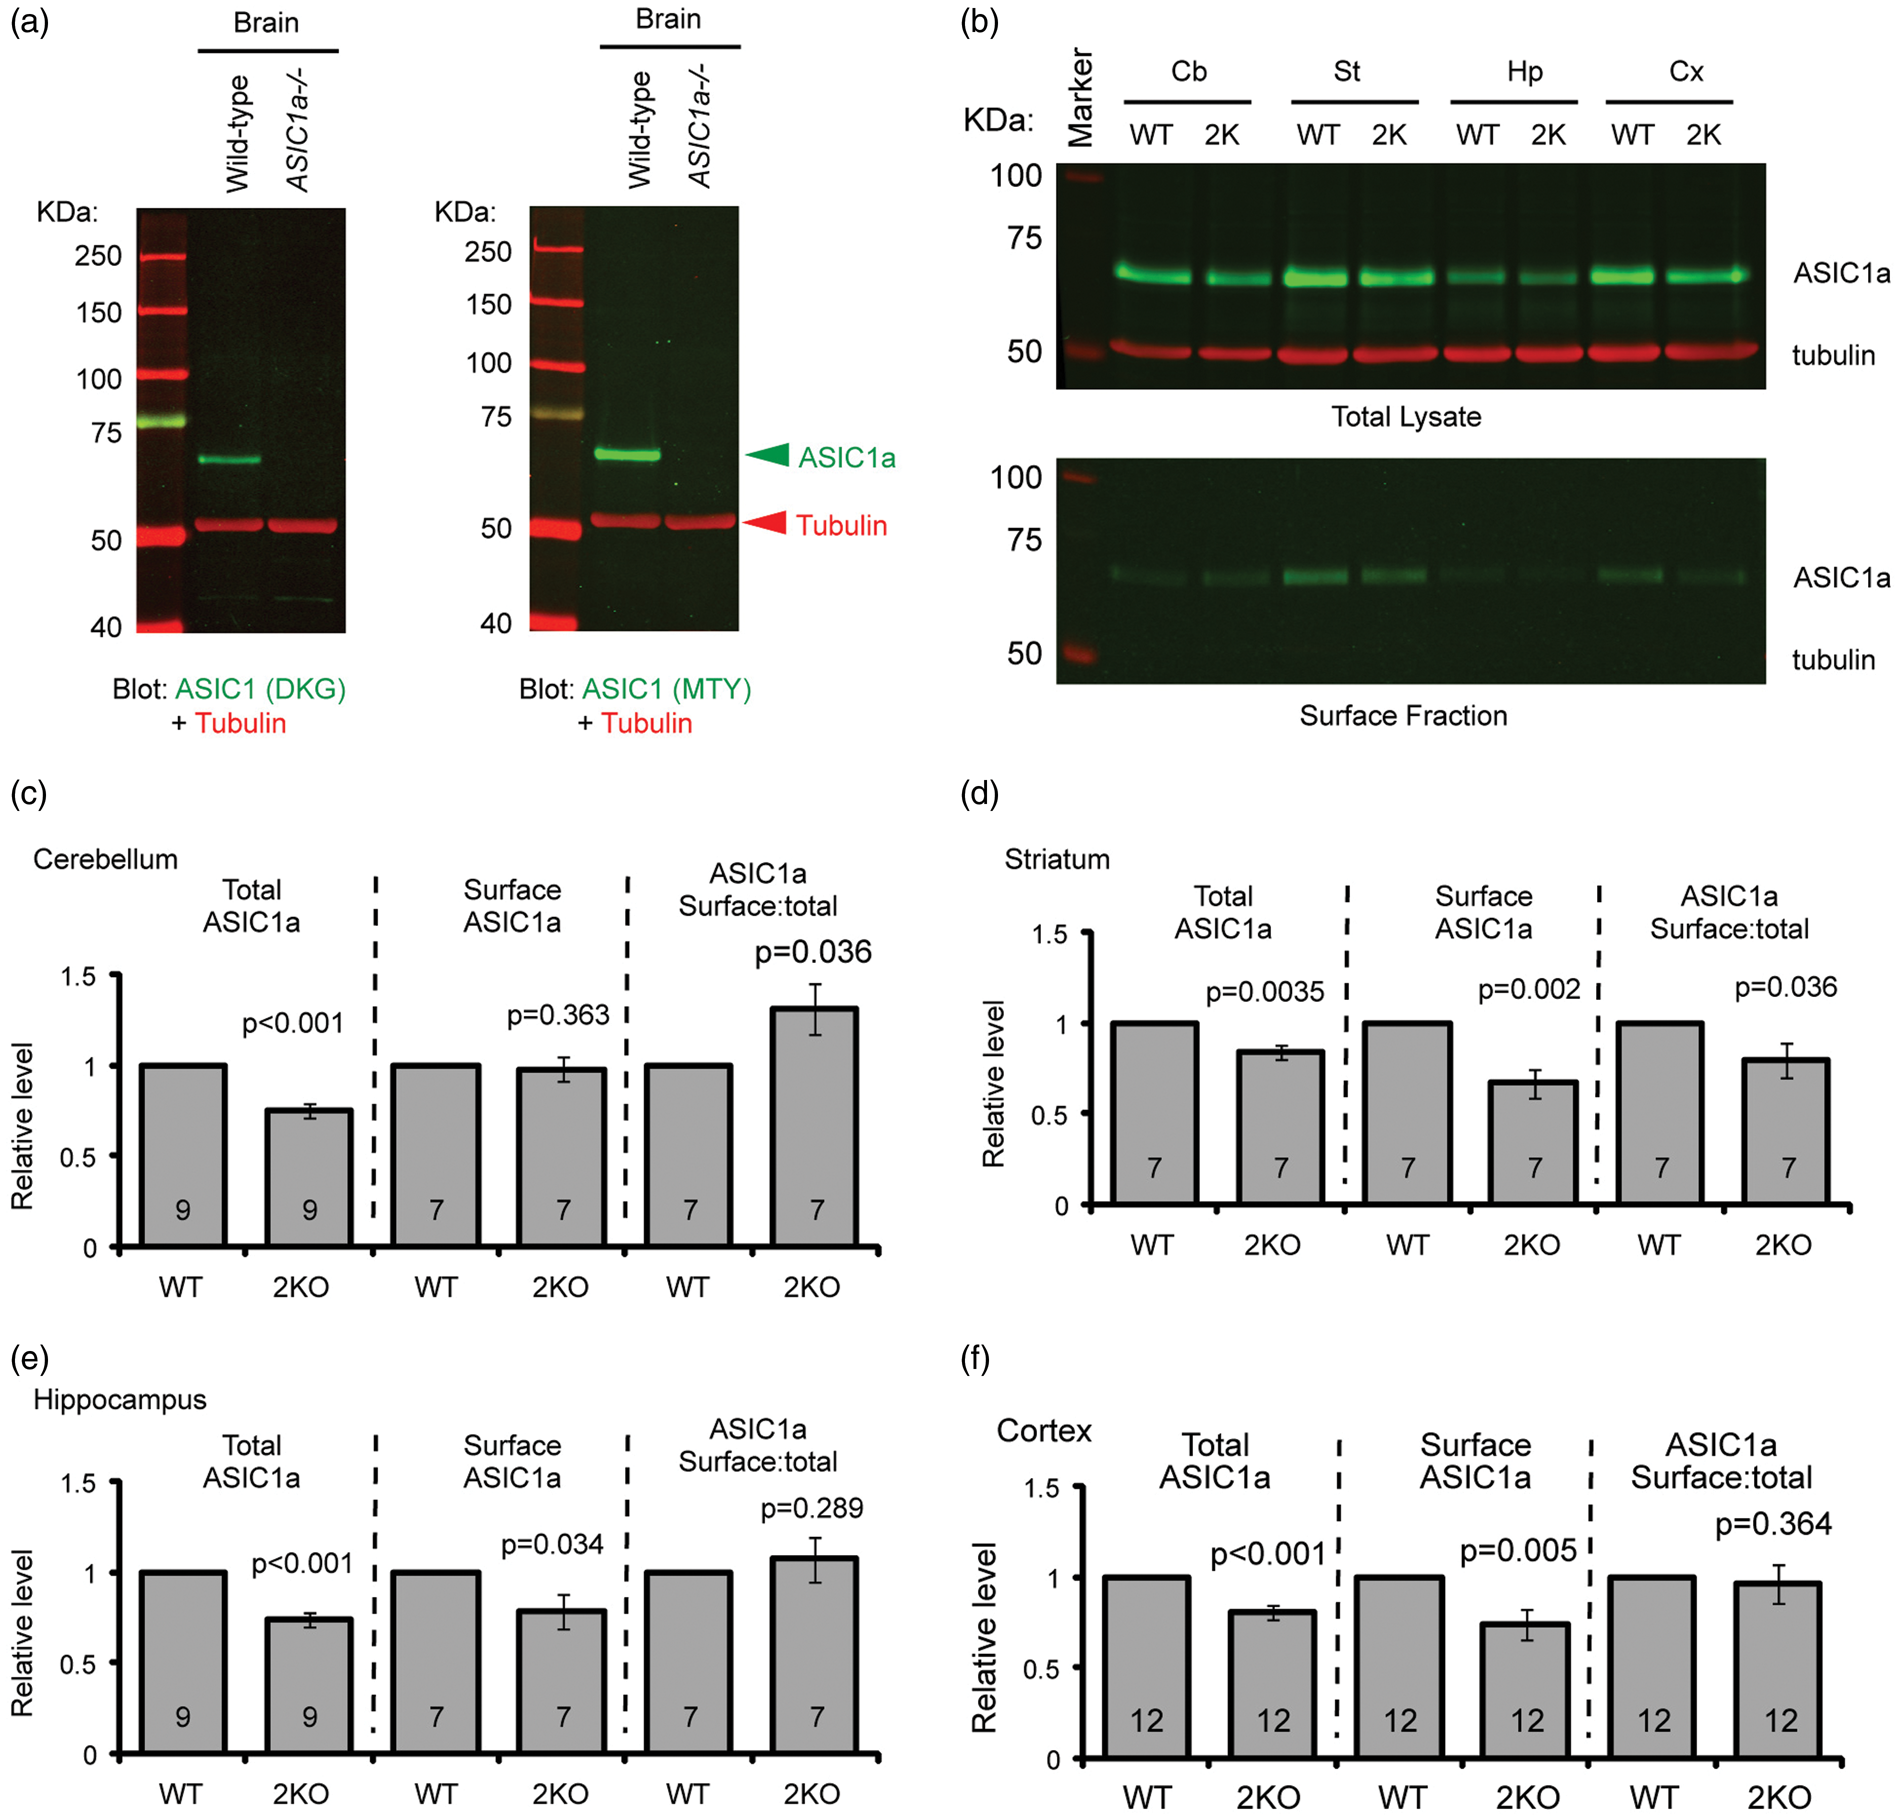
ASIC2 deletion reduces acid-activated current in cortical and striatal neurons but has no effect in cerebellar granule cells. Representative traces and quantification of pH 6-activated current in acutely dissociated cerebellar granule neurons (a) or cortical neurons (b), or cultured striatal medium spiny neurons (c). N on the bars indicates total number of neurons. Differential surface trafficking of ASIC subunits in the brain. (a) Specificity of two ASIC1 antibodies. Brains from WT or ASIC1a−/− mice were blotted with a rabbit “DKG” IgG (left image) or a rabbit “MTY” antibody (right image). In these images, ASIC was detected in the green channel while tubulin was in red. (b–f) Representative Western blots (b) and quantification (c–f) showing surface expression of ASIC1a in WT and ASIC2 null (2KO) mice. Cerebellum (Cb), striatum (Str), hippocampus (Hp), and cortex (Cx) from 3- to 9-week-old mice were isolated. Biotinylation of acute brain tissue was performed as described in “Methods.” Surface and total proteins were blotted for ASIC1a (green) and tubulin (red). Note that ASIC2 null mice had reduced ASIC1a protein levels in all four brain regions, and that the surface ASIC1a level was not changed in cerebellum. In each experiment, the WT and knockout tissues were processed in parallel.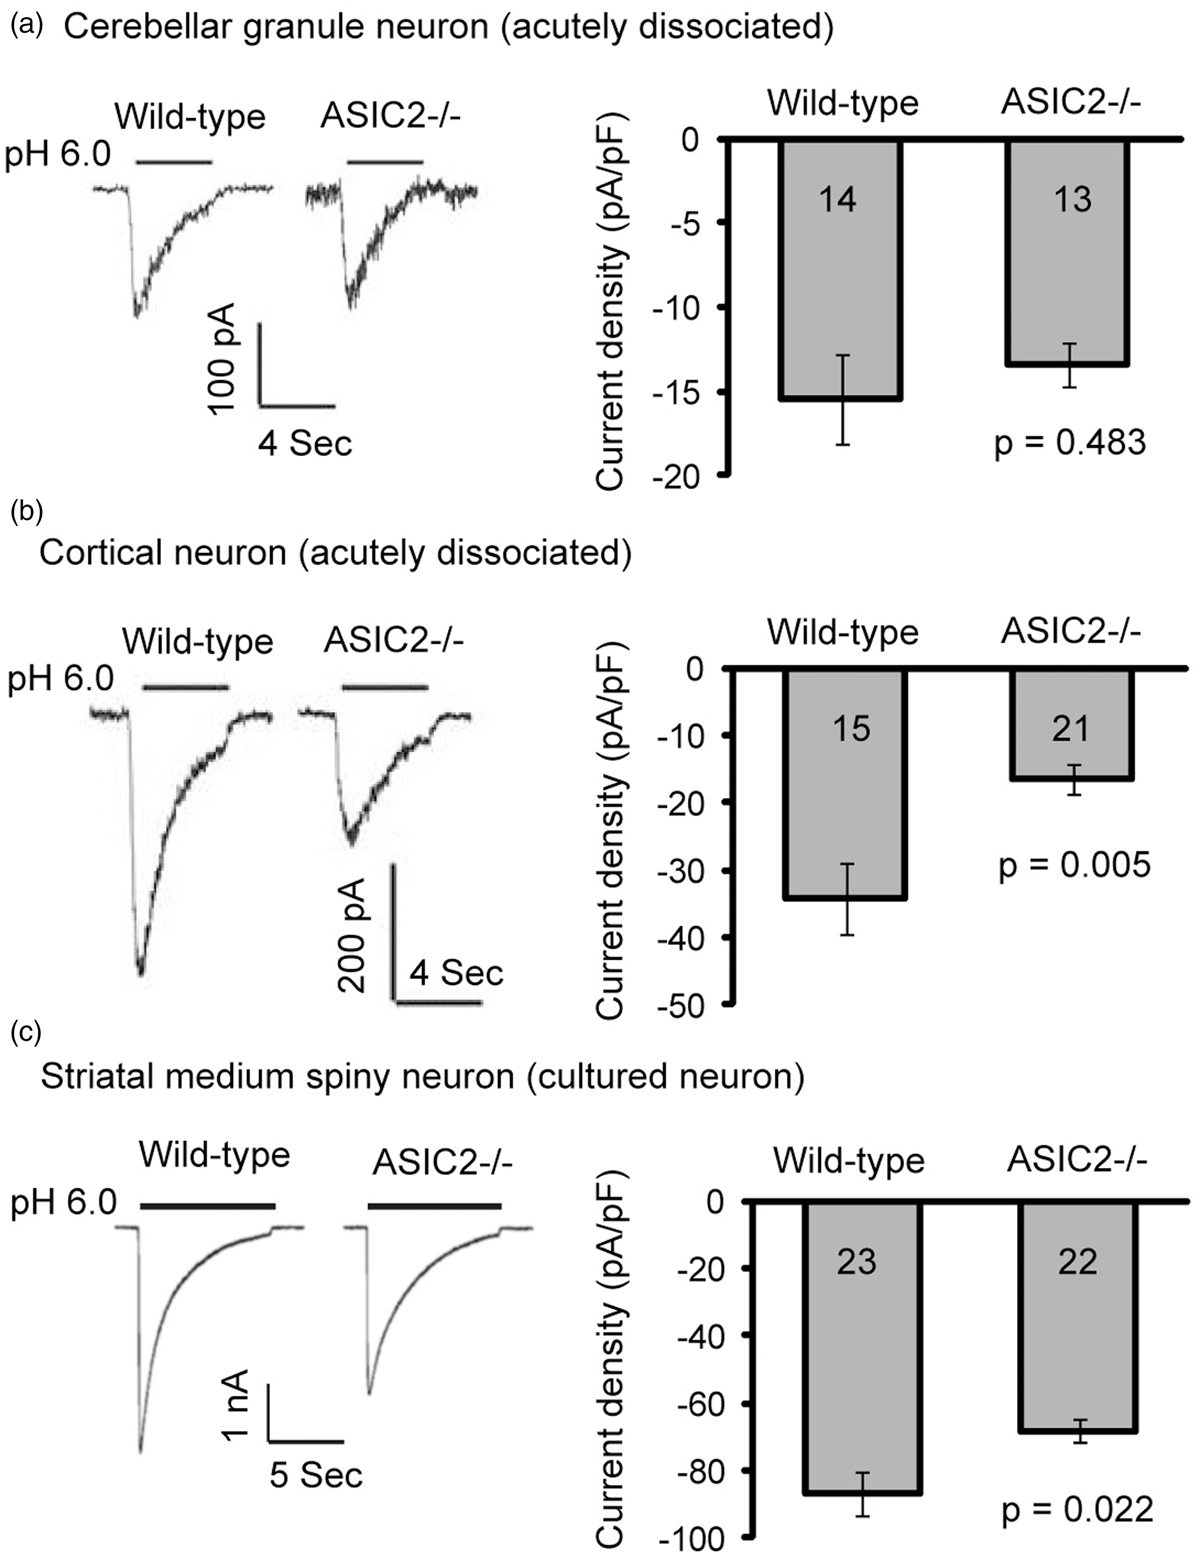
ASIC2 deletion has region-specific effect on surface ASIC1a level
The ASIC2 gene encodes two splice variants, ASIC2a and ASIC2b. ASIC2a is much less pH sensitive than ASIC1a while ASIC2b does not conduct acid-activated current by itself. The main effect of ASIC2 on acid-activated current is likely due to modulating ASIC1a. The region-specific change in ASIC current in the ASIC2−/− suggests that ASIC2 deletion has a differential effect on ASIC1a expression and/or surface trafficking. Therefore, we performed surface biotinylation of acutely isolated brain tissues, and blotted total and surface fraction for ASIC1a and tubulin, which serves as a loading control. Figure 2(a) shows the specificity of two ASIC1a antibodies. The relative ASIC1a level (normalized to tubulin) in ASIC2−/− brain tissue was 75% ± 4% in cerebellum, 84% ± 4% in striatum, 74% ± 4% in hippocampus, and 81% ± 4% in cortex; all were significantly (p < 0.01) reduced as compared with the WT (Figure 2(b) to (f)).
Next, we quantified the changes in surface ASIC1a. Despite the reduced total ASIC1a expression, surface ASIC1a levels in cerebellum from the ASIC2−/− mice remained unchanged, which correlated with an increased surface:total ratio of ASIC1a in the ASIC2−/− cerebellum (Figure 2(c)). In contrast, in striatum, deleting the ASIC2 gene reduced surface ASIC1a level as well as surface:total ratio of ASIC1a (Figure 2(d)). In hippocampus and cortex, deleting ASIC2 also reduced surface ASIC1a level but had no effect on surface:total ratio of ASIC1a (Figure 2(e) and (f)).
Co-expressing ASIC2a and 2b facilitates N-glycosylation and expression of ASIC1a
In a recent study, we examined the expression of ASIC2 and found that cerebellum and striatum express predominantly ASIC2b and ASIC2a, respectively, while hippocampus and cortex express a more balanced ASIC2a and 2b.
41
These data suggest that differential expression of ASIC2a and 2b leads to the region-specific effect of ASIC2 deletion on surface trafficking. As a first step to test this hypothesis, we transfected 3T3 cells with ASIC1a and either eGFP (as a control), or ASIC2a, or ASIC2b, did surface biotinylation, and blotted total and surface proteins for ASIC1a. Co-expressing with ASIC2a led to a small (16%) increase in ASIC1a protein level, and a 39% increase in surface:total ratio (Figure 3(a)). In contrast, ASIC2b co-expression led to a 59% increase in ASIC1a expression but did not facilitate surface trafficking of ASIC1a (Figure 3(b)). This result is consistent with a reduced ASIC1a protein in the ASIC2−/− brain, and further indicate that at least part of the reduced surface levels in the ASIC2−/− brain tissues is due to the loss of ASIC2a.
ASIC2 increases ASIC1a protein level and facilitates N-glycosylation of ASIC1a. (a,b) Representative blots and quantification showing the effect of ASIC2a (a) or 2b (b) on ASIC1a protein levels and surface expression. 3T3 cells were transfected with ASIC1a together with GFP or ASIC2a or 2b. We used GFP as a filler so the total amount of cDNA transfected is the same between the conditions. Surface proteins were biotinylated and pulled down with NeutrAvidin as described in Methods. (c,d) Effect of ASIC2a (c) or 2b (d) coexpression on N-glycosylation of ASIC1a in 3T3 cells. 3T3 cell lysate was untreated (U), treated with PNGase F (P) or Endo H (e), and blotted for ASIC1a. Arrows in panel (c) indicate the two populations of ASIC1a which are resistant to Endo H (top band) and sensitive to Endo H (bottom band). Bar graph shows the ratio of Endo H resistant:sensitive populations. Increased ratio indicates an increased “maturation” of N-linked glycans on ASIC1a. Numbers on the bars indicate the total number of experiments.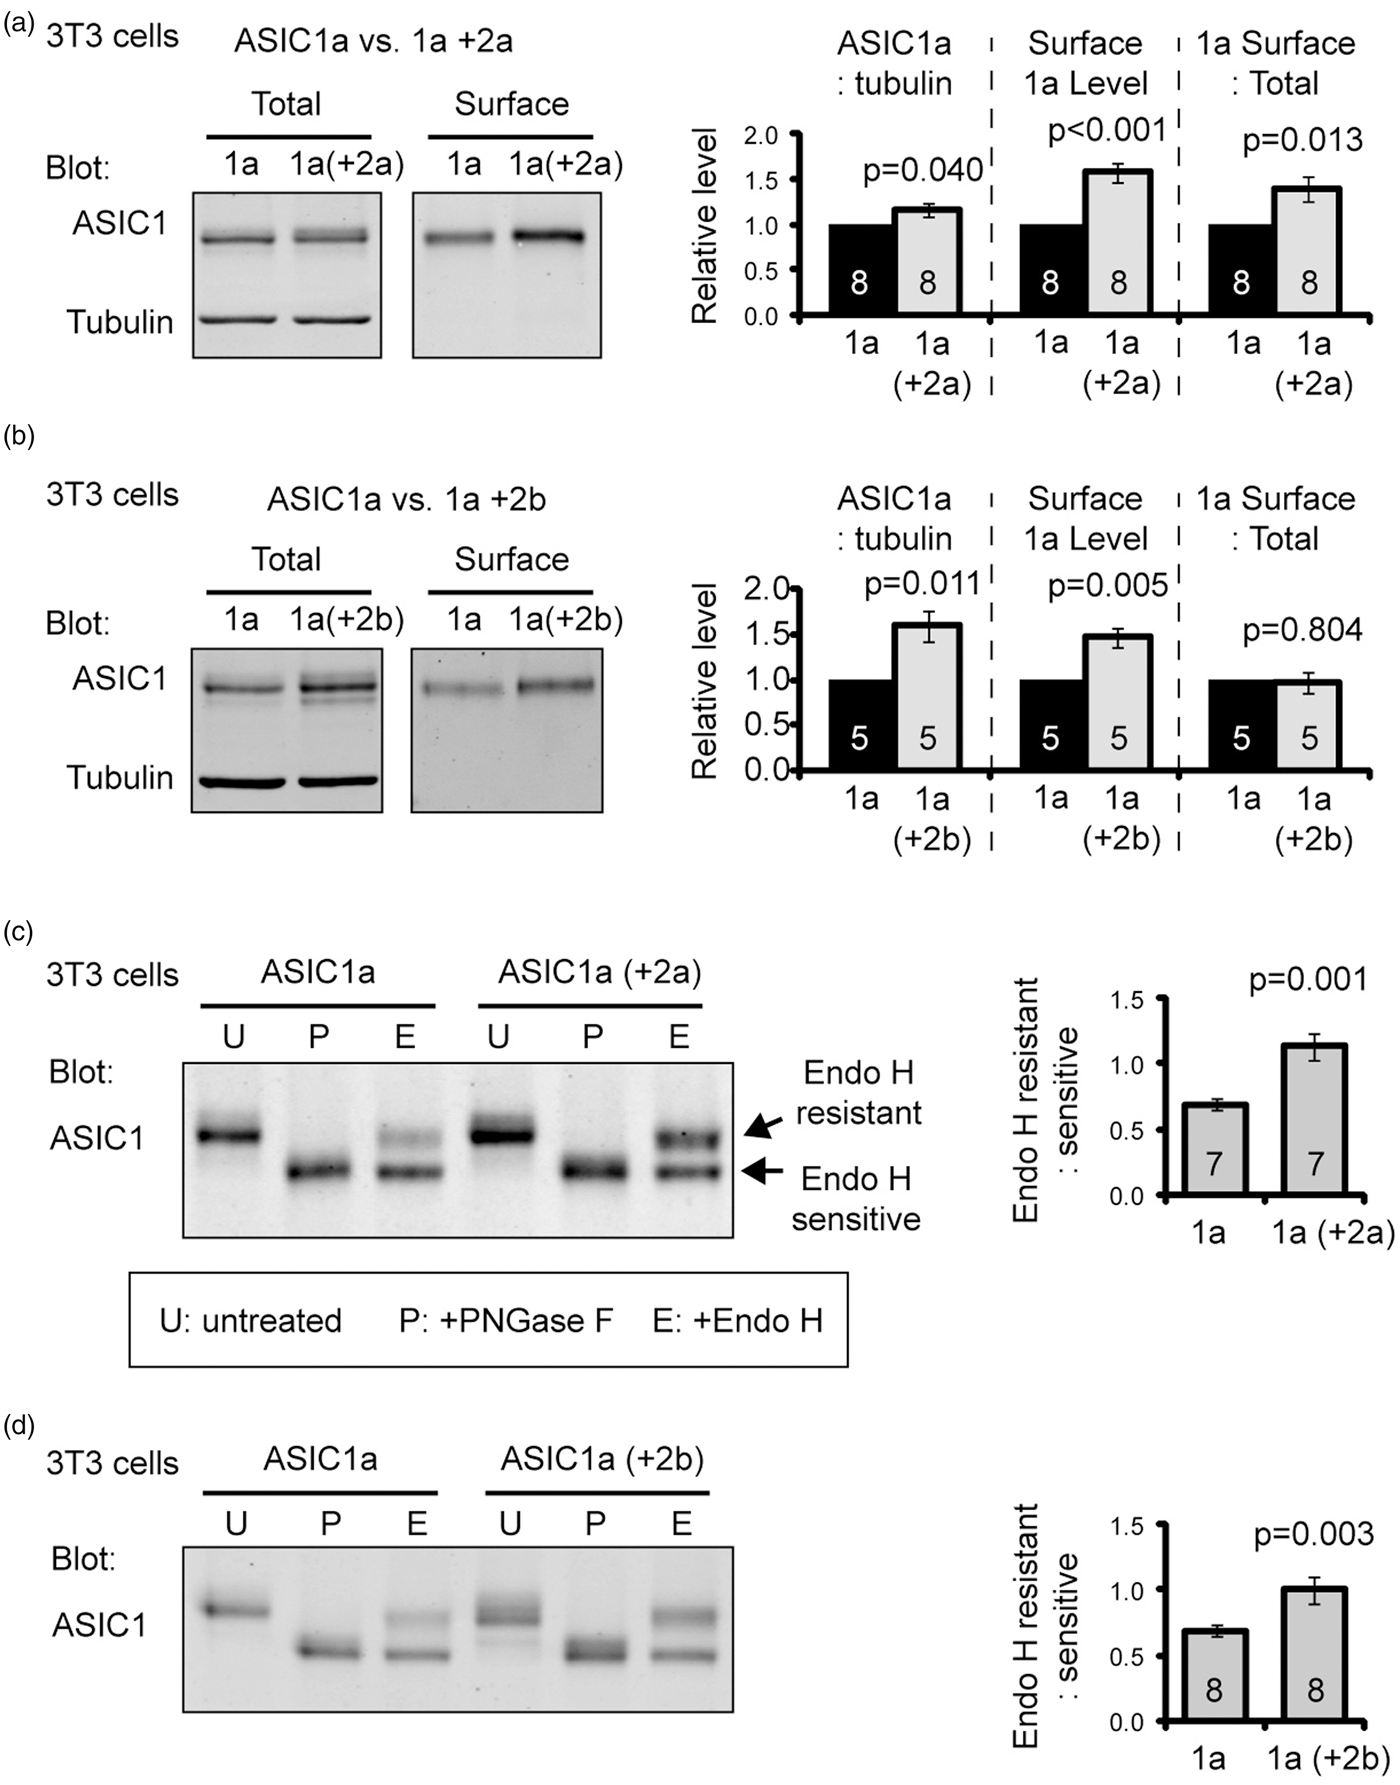
We further asked what is the possible mechanism for ASIC2a and 2b to facilitate ASIC1a expression. In previous studies, heteromerization affects channel biogenesis.42–44 One important process in protein biogensis is the addition and processing of N-linked glycans. Core N-linked glycans are added to many membrane proteins in endoplasmic reticulum (ER), and these glycans can be further modified through mid- to late-Golgi. An increase in this glycosylation process is typically associated with increased protein stability and/or trafficking.25,45,46 Since ASIC2a and 2b increased ASIC1a protein level, we hypothesized that co-expressing ASIC2a or 2b increases N-glycosylation of ASIC1a. The core-glycans (or “immature” glycans) are sensitive to the treatment of endoglycosidase H (Endo H). The modified (or “mature”) glycans are resistant to Endo H treatment. In contrast, PNGase F cleaves all N-linked glycans. Using these two glycosidases allows us to distinguish the core-glycans vs. the modified N-linked glycans. We transfected 3T3 cells with ASIC1a alone (or with eGFP) or together with 2a or 2b. The cell lysates were untreated, treated with Endo H, which removes only the core glycans, or treated with PNGase F, which removes all N-linked glycans, and analyzed ASIC1a on Western blot. The removal of glycans typically results in a faster moving species on the gel (e.g., compare untreated and PNGase F treated samples In Figure 3(c)). Co-expressing 2a or 2b with 1a increased the ratio of Endo H resistant:sensitive ASIC1a by 64% and 45%, respectively (Figure 3(c) and (d)).
Next, we asked whether ASIC2 regulates N-glycosylation of ASIC1a in vivo. Deleting ASIC2 reduced Endo H resistant populations in ASIC1a in all four brain regions (cerebellum, striatum, cortex, hippocampus) examined (Figure 4). Together, our data suggest that heteromerization with ASIC2 facilitates the “maturation” of N-linked glycans of ASIC1a, and consequently increases ASIC1a protein level and acid-activated current.
Deleting ASIC2 reduces N-glycosylation of ASIC1a in the brain. Representative blots and quantification showing the effect of ASIC2 deletion on ASIC1a N-glycosylation in the brain. WT and ASIC2−/− lysates from different brain regions were untreated (U), treated with PNGase F (P), or Endo H (E), and blotted for ASIC1a. Bar graph at the bottom shows the ratio of Endo H resistant:sensitive ASIC1a. Numbers on the bars indicate the total number of animals analyzed.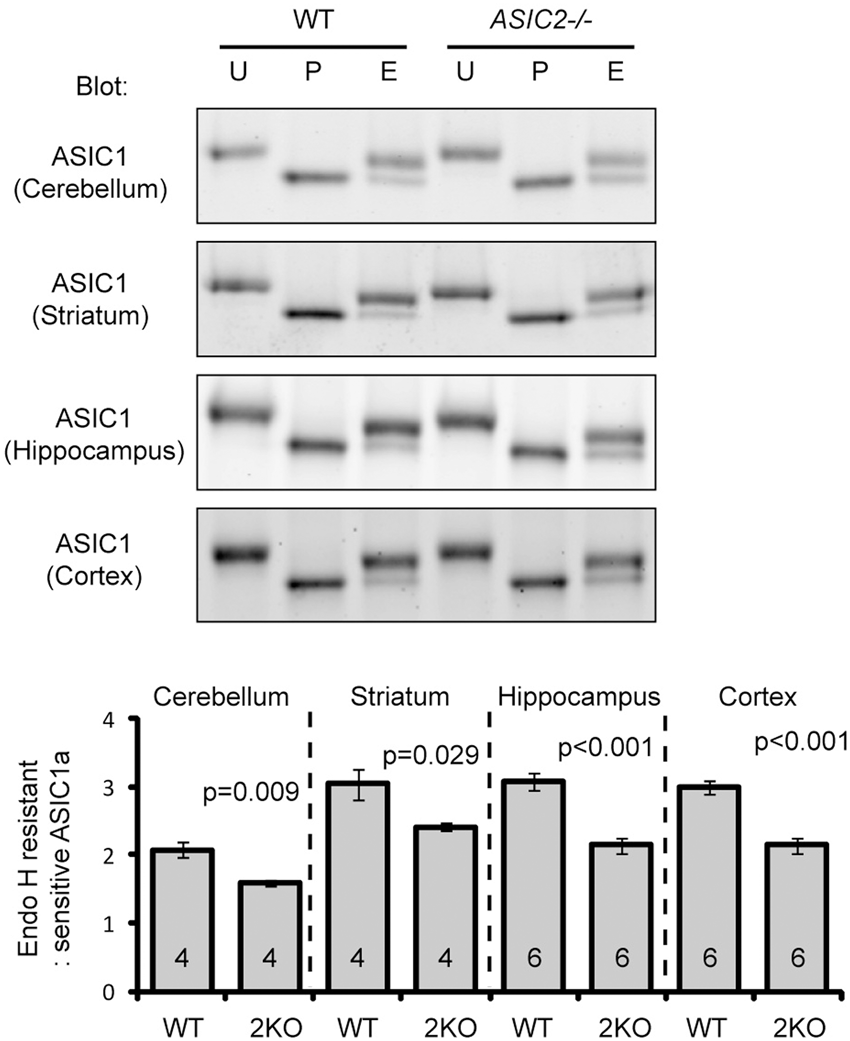
Region specific contribution of ASIC2 to acidosis- and ischemia-induced neuronal injury
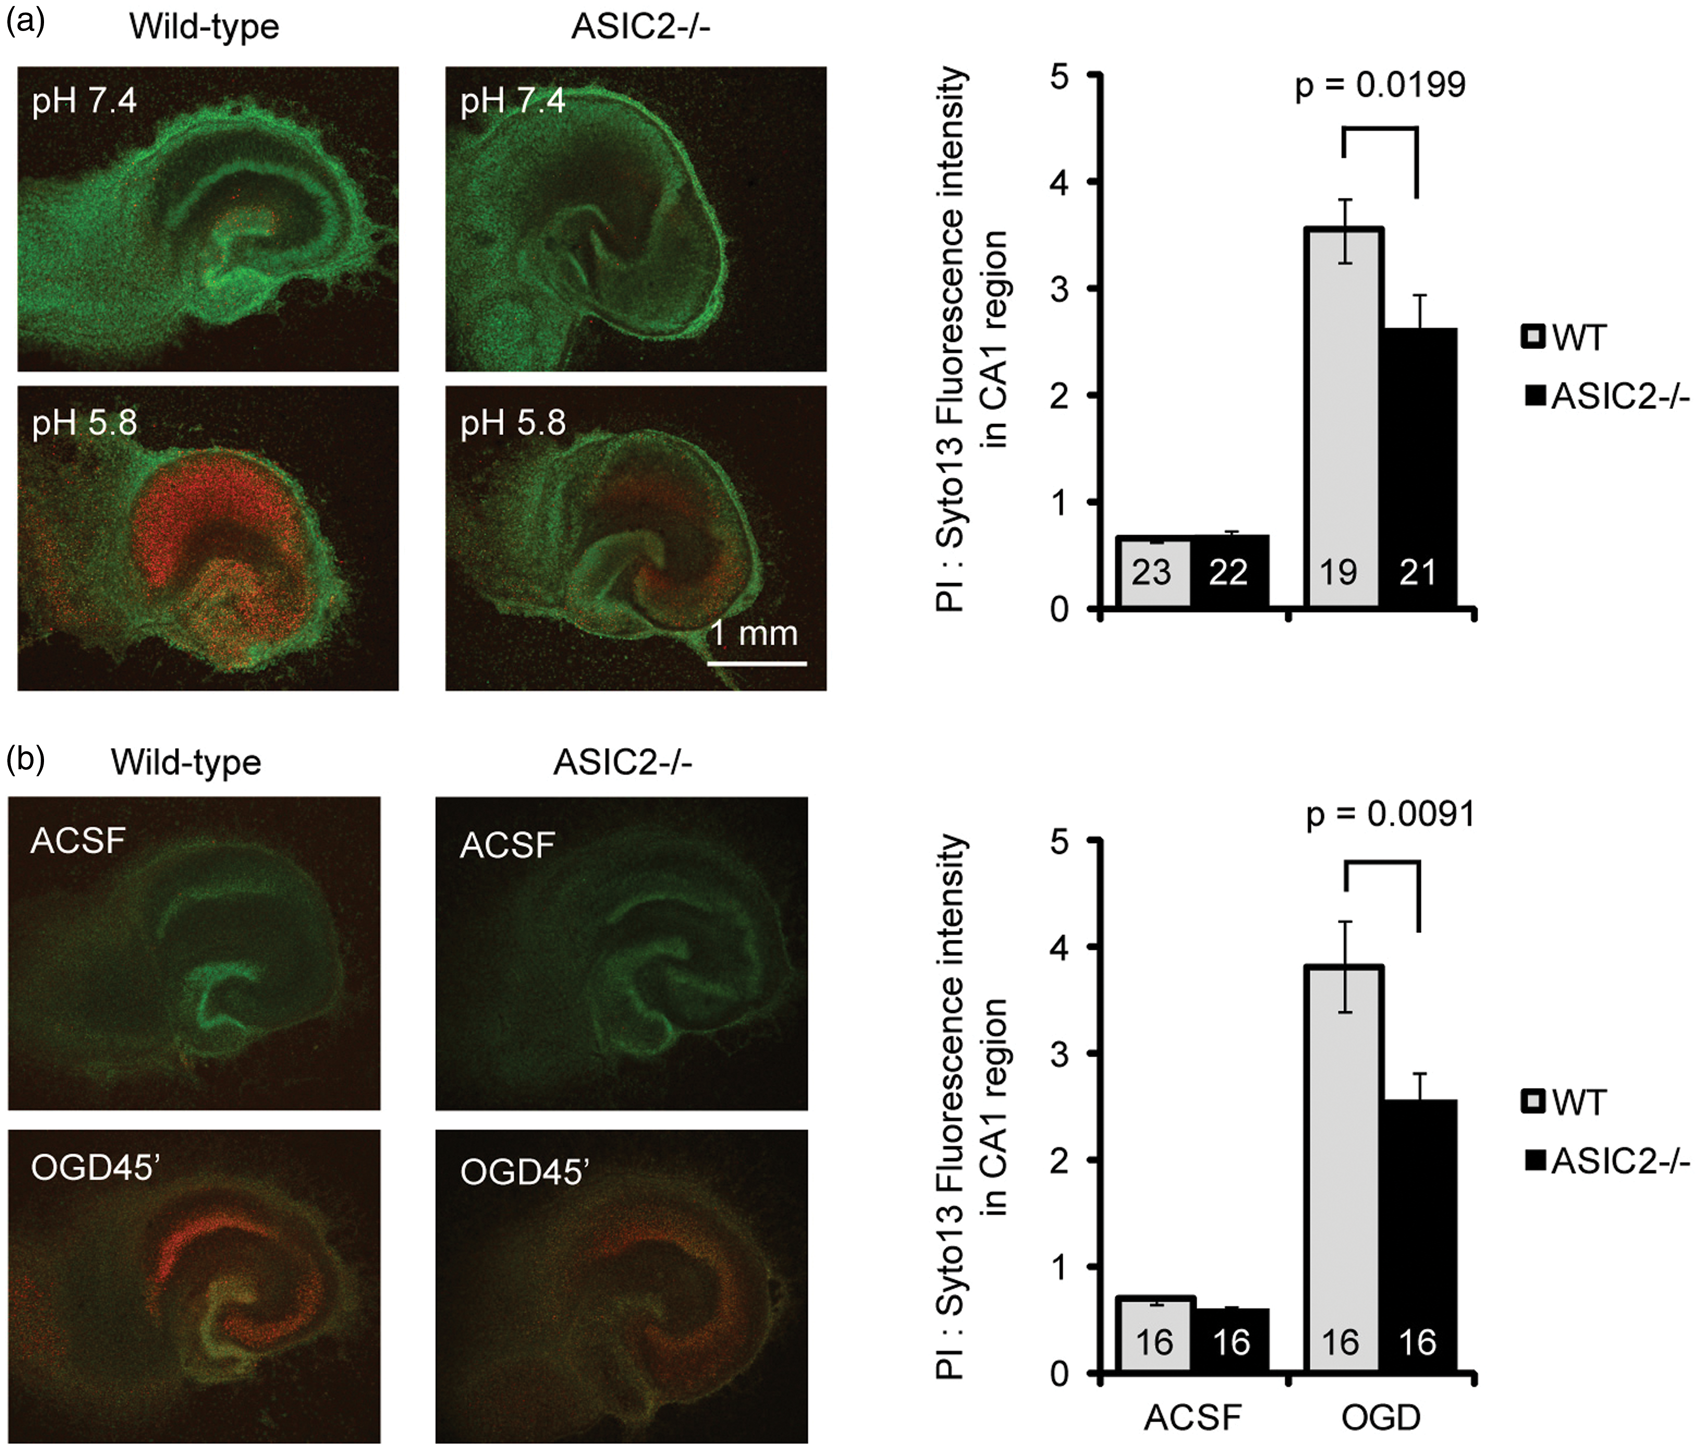
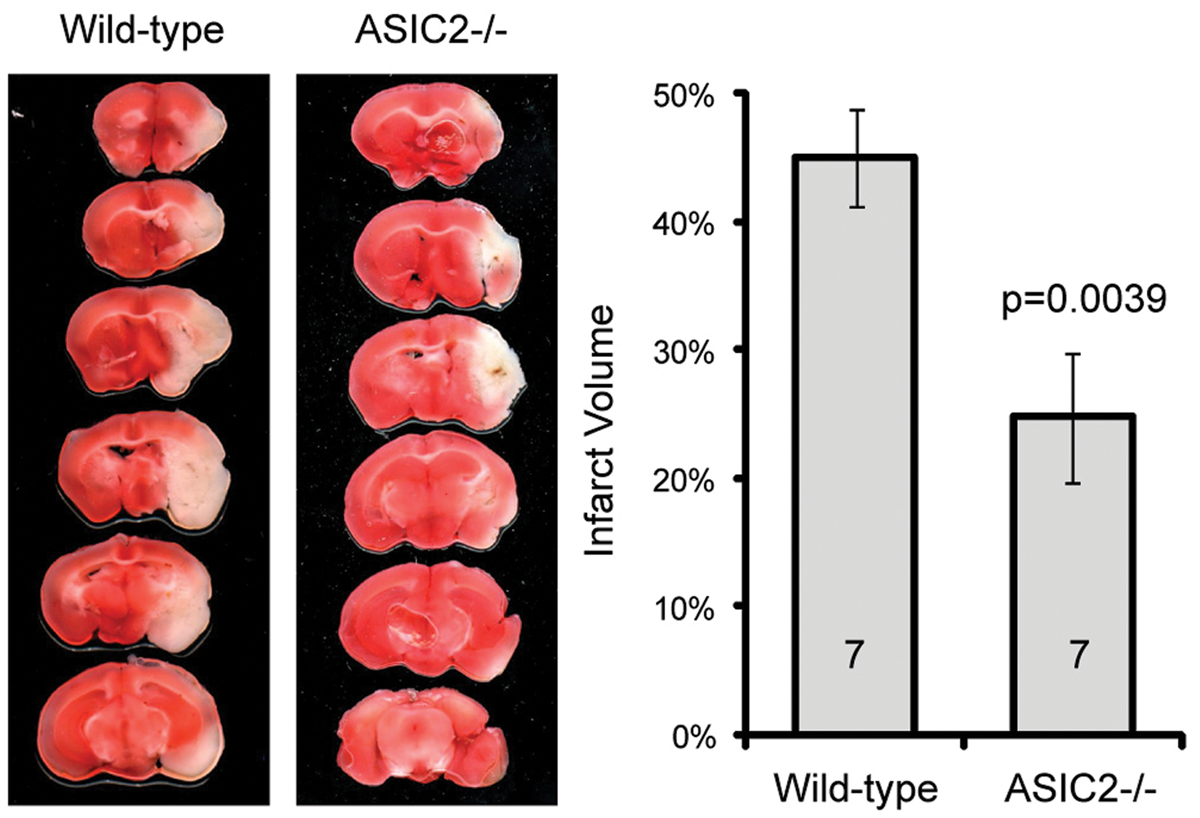
Our data on acid-activated current suggest that ASIC2 deletion has no effect on acidosis-mediated neuronal injury in cerebellum but has a protective effect in other brain regions studied. To test this hypothesis, we cultured organotypic cerebellar slices and induced neuronal injury with pH 5.8 or OGD. Consistent with our biochemical and electrophysiological results, ASIC2 deletion had little effect on acidosis- or OGD-induced neuronal injury in cerebellar slices (Figure 5). In contrast, in organotypic hippocampal slices, we found that ASIC2−/− slices showed significantly (p < 0.05) reduced acidosis- and OGD-induced neuronal injury (Figure 6). Next, we examined the effect of ischemia in vivo using the middle cerebral artery occlusion (MCAO) model, which mainly leads to neuronal injury in striatum and cortex. We applied 60 min MCAO to WT and ASIC2−/− mice and analyzed brain infarction by TTC staining 24 h later. The infarct volume in ASIC2−/− mice was significantly reduced as compared with that in WT mice (24.8 ± 5% vs. 45 ± 4%, p = 0.00398) (Figure 7).
ASIC2 deletion has no effect on acidosis-induced neuronal injury in cerebellar slices. Representative images and quantification showing the effect of pH 5.8 (a) or OGD (b) on neuronal injury in cerebellar slices. Organotypic cerebellar slices were cultured from postnatal day 8- to 9-day-old mice, and maintained in culture for 9–11 days before the acidosis or OGD challenge. Neuronal injury was analyzed 22–24 h later by staining with propidium iodide (for dying cells) and syto 13 (for all cells). Increased red fluorescence indicates increased neuronal injury. Numbers on bars indicate total number of slices quantified from three separate experiments. ASIC2 deletion attenuates acidosis- and ischemia-induced neuronal injury in hippocampal slices. Representative images and quantification showing the effect of pH 5.8 (a) or OGD (b) on neuronal injury in hippocampal slices. Similar to Figure 5, neuronal injury was analyzed 22–24 h later by staining with propidium iodide (for dying cells) and syto 13 (for all cells). Increased red fluorescence indicates increased neuronal injury. Numbers on bars indicate total number of slices quantified from three separate experiments. ASIC2 deletion protects mice from ischemia-induced brain injury. WT and ASIC2 null mice were subjected to MCAO for 60 min followed by reperfusion. Left panel shows TTC staining images in WT and ASIC2 knockouts. Right panel shows quantification of brain infarct volume. Numbers on bars indicate total number of animals.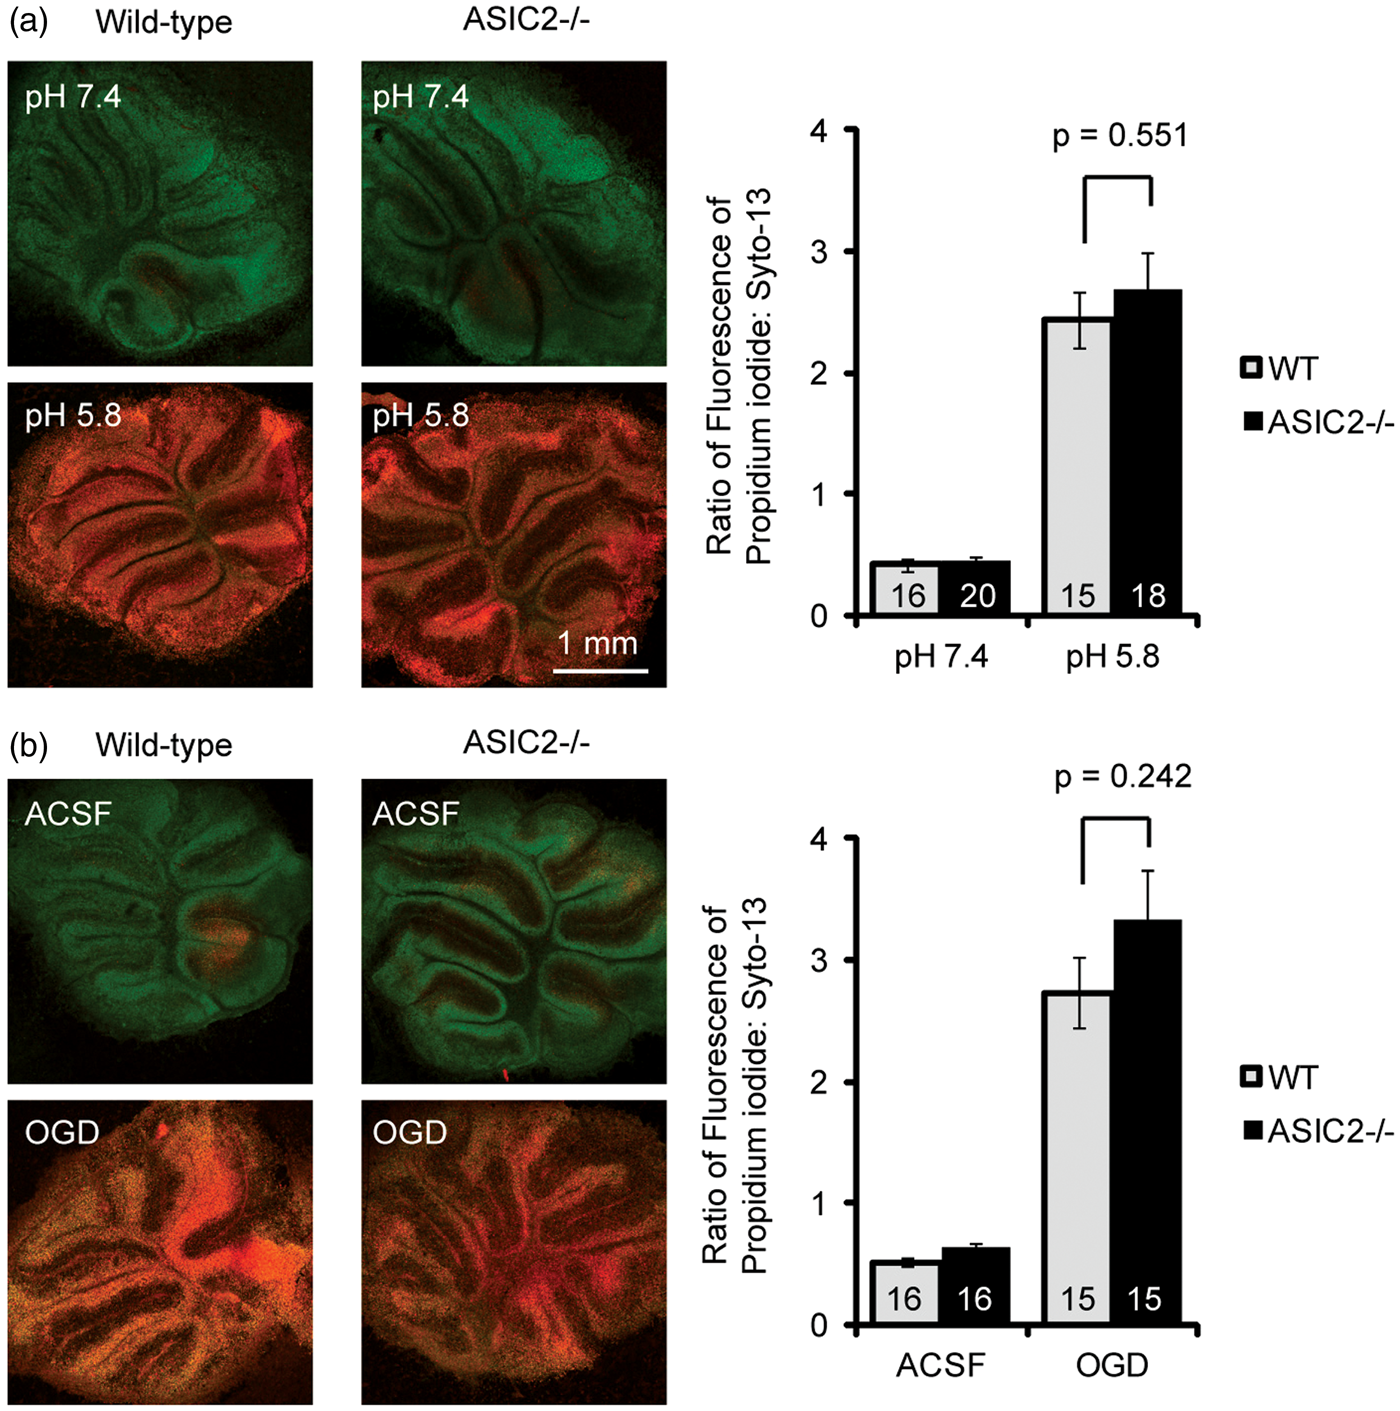
Discussion
Our findings here reveal an important contribution of ASIC2 to acidosis- and ischemia-induced neuronal injury. By determining the functional difference between ASIC2a and 2b, our data further provide a molecular explanation for the observed phenotype. Because of region-specific expression of ASIC2a and 2b, which have differential effects on ASIC1a surface trafficking. ASIC2 deletion leads to a region-specific reduction in acid-activated current and consequently neural protection. In hippocampal, cortical, and striatal neurons, ASIC2 deletion reduced surface ASIC1a level, acid-activated current density, and acidosis/ischemia-induced neuronal injury. In contrast, in cerebellar neurons, ASIC2 deletion, though reduced ASIC1a protein level, had no effect on surface ASIC1a level (due to increased surface:total ratio of ASIC1a), acid-activated current density, or acidosis/ischemia-induced neuronal injury. These results have important implications in interpreting how ASICs mediate acid signaling in vivo as well as for future targeting of ASICs in disease.
Our data uncover novel regulatory roles of ASIC2a and 2b in the brain. ASIC2a enhanced ASIC1a expression, and consistent with previous studies,23,24 ASIC2a facilitated ASIC1a surface trafficking. In contrast, ASIC2b apparently plays a major role in modulating ASIC1a expression. In 3T3 cells, co-expressing ASIC2b with ASIC1a increased ASIC1a protein levels. In cerebellum-where little ASIC2a is present 41 —deleting the ASIC2 gene reduced ASIC1a protein levels by ∼25%. However, deleting ASIC2 in cerebellum did not change surface ASIC1a level, and resulted in an increase in surface:total ratio of ASIC1a. Together with our previous study, 24 our data indicate that ASIC2a is critical for efficient surface and synaptic trafficking of ASIC1a while the primary function of ASIC2b is to modulate ASIC1a expression and serve as an intracellular retainer for subunits associated with it. The biochemical results are consistent with the published electrophysiological recordings and calcium imaging in hippocampal neurons and slices23,24 and our electrophysiological data in cerebellar, cortical, and striatal neurons.
The outcome of deleting the ASIC2 gene is two-fold. First, ASIC2 deletion eliminated all heteromeric 1a/2a channels. Second, it reduces the protein level of ASIC1a, and this effect was due to, at least in part, the fact that both ASIC2a and 2b promote the N-glycosylation and stability/expression of promoted ASIC1a. These changes led to a significant reduction of acid-activated currents in hippocampal, 23 cortical, and striatal neurons (this study). How would calcium impermeable channels like ASIC1a/2a heteromers contribute to neuronal injury? It turns out that the major effect of ASIC activation on calcium increase is through secondary mechanisms. Even for ASIC1a homomers, which conduct both sodium and calcium, their calcium permeability is low. Previous studies have examined the relative permeability of ASIC1a homomers to Na+ (pNa+) and Ca2+ (pCa2+); pNa+/pCa2+ value was 2.5, 18.5 and 25, respectively, in three reports.5,47,48 Consistent with these data, calcium imaging studies show that direct calcium entry through ASIC1a homomers only contributes to a small fraction of the total calcium rise, and acid-induced increase in intracellular calcium is primarily due to the activation of voltage-gated calcium channels and store release.27,49,50 Therefore, it is the number of functional ASICs, which include both 1a homomers and 1a/2 heteromers, that determine the magnitude of acid-induced responses. Together, these data provide an explanation for the observed protection against acidosis- and ischemia-induced injury in the ASIC2−/−.
Previous studies have shown that ASIC1a is important for neuronal injury.17–19,51,52 We and others have shown that Psalmotoxin (PcTx1), an ASIC1a inhibitor isolated from tarantula spider, 53 has a protective effect, suggesting that ASIC1a homomers mediate a significant portion of acidosis/ischemia-induced injury. Our data here extend previous findings and reveal an important contribution from ASIC2, especially ASIC2a, in neuronal injury. Besides the effect on acidosis/ischemia-induced injury, previous studies have shown that ASIC2 also contributes to retina function and fear-related behavior.54,55 Together, these results argue that both ASIC1a homomers and ASIC1a/2a heteromers are important contributors to acid signaling in the brain, and targeting both types will offer the maximal benefit to alleviate neuronal injury in acidotic and ischemic conditions.
Footnotes
Funding
The author(s) disclosed receipt of the following financial support for the research, authorship, and/or publication of this article: The Nikon A1 confocal microscope was funded by an NIH/ARRA equipment grant #S10RR027535. This work was partially supported by NIH R01NS066027, U54NS083932, NIMHD S21MD000101 (ZGX), NIH R21NS093522 and American Heart Association 13SDG13970009 (XMZ).
Acknowledgments
We thank Drs. Michael Welsh and John Wemmie for the ASIC2 null mice and the MTY (ASIC1) antibody.
Declaration of conflicting interests
The author(s) declared no potential conflicts of interest with respect to the research, authorship, and/or publication of this article.
Authors’ contributions
NJ performed survival experiment in organotypic slices. JW performed surface expression analysis in 3T3 cells, some of the surface analysis in brain, and N-glycosylation studies. TL studied acid-activated current in cortical and cerebellar neurons. TY performed MCAO experiment and analyzed the data. YZ contributed to surface expression analysis in brain tissue. QJ cultured striatal neurons. BW performed statistical analysis. YH and YHJ contributed to discussion and manuscript writing. RPS contributed to discussion, design of MCAO experiment, and manuscript writing. XPC performed electrophysiological recording in striatal neuron. ZGX designed electrophysiology and MCAO experiments, analyzed data, and wrote the manuscript. XMZ designed the experiment, performed part of surface trafficking study in brain tissue, analyzed data, and wrote the manuscript.