
Abstract
Cerebral autoregulation is the intrinsic ability of the brain to maintain adequate cerebral perfusion in the presence of blood pressure changes. A large number of methods to assess the quality of cerebral autoregulation have been proposed over the last 30 years. However, no single method has been universally accepted as a gold standard. Therefore, the choice of which method to employ to quantify cerebral autoregulation remains a matter of personal choice. Nevertheless, given the concept that cerebral autoregulation represents the dynamic relationship between blood pressure (stimulus or input) and cerebral blood flow (response or output), transfer function analysis became the most popular approach adopted in studies based on spontaneous fluctuations of blood pressure. Despite its sound theoretical background, the literature shows considerable variation in implementation of transfer function analysis in practice, which has limited comparisons between studies and hindered progress towards clinical application. Therefore, the purpose of the present white paper is to improve standardisation of parameters and settings adopted for application of transfer function analysis in studies of dynamic cerebral autoregulation. The development of these recommendations was initiated by (but not confined to) the Cerebral Autoregulation Research Network (CARNet – www.car-net.org).
Keywords
Introduction
Cerebral autoregulation
Perfusion of the human brain is controlled by multiple systems. These systems include chemoregulation, autoregulation (e.g. myogenic responses to pressure changes), neurovascular coupling to meet local cerebral metabolic demand and probably a direct autonomic neurovascular influence.1,2 Cerebral autoregulation (CA) is defined as the intrinsic ability of the brain to maintain an adequate cerebral perfusion in the presence of blood pressure (BP) changes. 3 The dynamic relationship between BP and cerebral blood flow (CBF) has the characteristics of a high-pass filter. The assumption is that adaptation of cerebral arterioles in response to pressure changes is not fast enough to counteract higher frequency oscillations (>0.20 Hz) in perfusion pressure. As a consequence, these are passed along unimpeded into oscillations in CBF. In contrast, slower frequency oscillations (<0.20 Hz, but most effectively <0.05 Hz) can be counteracted by the cerebral arterioles and are dampened. 4 As the brain is highly dependent on a continuous supply of (oxygenated) blood, reduced effectiveness of CA renders the brain more sensitive to both hypo- and hyperperfusion. CA is known to be impaired in a variety of medical conditions, such as diabetes, dementia, stroke, head trauma and subarachnoid haemorrhage. 5 In other patients, as those with severe hypertension, head injury or undergoing surgical procedures,6–10 CA plays an important role in safeguarding adequate cerebral perfusion. Therefore, the ability to measure and monitor CA in a patient would provide clinically useful information and would permit a more individualised physiology-based therapy aimed at reducing the risk of secondary brain injury.
Methods to assess CA
A large number of methods to assess the quality of CA have been proposed over the last 30 years. Traditional techniques to assess CA use induced changes in BP to challenge the cerebrovascular system. These acute BP changes can be induced using pharmacological means or with manoeuvres such as Valsalva, 11 squat-to-stand 12 or sit-to-stand 13 and the deflation of pressurised thigh cuffs. 14 A different method is the Transient Hyperaemic response, which uses carotid compression and measures the increase in CBF following release. However, these interventions are often unsuitable in clinical cases, such as in the severely ill or in older or severely cognitively impaired persons, because of the relatively large BP change, the requirement of patient cooperation and the uncomfortable nature of some of these interventions. Furthermore, other physiological subsystems (e.g. sympathetic activation with Valsalva’s manoeuvre 15 and cortical activation with visual or acoustic stimuli) or other variables (e.g. pCO2 with squat- and/or sit to stand manoeuvres 16 ) might be affected, potentially confounding results. Due to these limitations, different research groups have adopted methods that use spontaneous, instead of induced slow BP fluctuations to challenge CA. 17
Various methods have been developed for non-invasive assessment of CA based on spontaneous fluctuations of BP and CBF at rest, 18 i.e. correlation coefficient analysis (Mx), 19 the autoregulatory index, 20 transfer function analysis (TFA), 21 non-linear analyses using Laguerre expansions of Volterra kernels 22 or Principal dynamic modes, 23 autoregressive, 24 as well as multimodal pressure-flow analysis. 25 It should be acknowledged that for all these methods, the assumption that they measure CA is a simplification. The methods provide metrics to describe the relationship between pressure and flow, and in reality these parameters are subject to many other influences apart from CA.
Transfer Function Analysis
With the availability of this multitude of methods, the choice of which method to employ to quantify CA remains a matter of personal choice. No single method has been universally accepted as a gold standard. Nevertheless, given the concept that CA represents the dynamic relationship between BP (stimulus or input) and CBF (response or output), TFA became a popular approach adopted in studies based on spontaneous fluctuations of BP.21,26 TFA quantifies CA in the parameters gain, phase and coherence. The physiological interpretation of these parameters and an overview of how they relate to other methods to assess CA are provided by van Beek. 16
Brief methodological background of TFA
In order to harmonise terminology, a brief comment on how TFA relates to linear control systems theory is appropriate. The objective of TFA is to estimate parameters that reflect the dynamic behavior of the human cerebrovascular autoregulation system (CA) with the assumption that CA is a linear control system. In reality, CA is not a linear system, because of the changes in cerebrovascular resistance resulting from changes in BP, and because there are variables other than BP that affect CBF, such as CO2. Nevertheless, it is possible to derive meaningful insight into cerebral hemodynamics by approaching CA as a ‘simplified’ linear system, for example by using TFA, as long as these caveats are kept in mind when interpreting results. 46
In general, TFA is based on a Fourier decomposition of stationary input and output signals (i.e. variables with stable statistical moments, mainly mean and variance) into sums of sines and cosines of multiple frequencies. Under the assumption of linearity, the sinusoids at the input will be transformed into sinusoids of the same frequency at the output, but with a (frequency dependent) different amplitude (or gain) and usually shifted in time (the phase shift of the response), see Figure 1. Numerical calculation of the gain and phase at each frequency is computationally straightforward, but the statistical reliability (e.g. coefficient of variation) of these estimates is fraught with difficulties, for example due to the presence of unrelated noise in real life measurements. The use of the coherence function can help to identify conditions where estimates of gain and phase may not be reliable.27,28 At each frequency, coherence can vary between zero and one. It is analogous to the squared correlation coefficient. As such, it expresses the fraction of output variance that can be explained by the corresponding input power at each frequency. For linear systems with high signal-to-noise ratios (SNR), and a univariate input–output relationship, coherence will approach one. On the other hand, coherence will approach zero if SNR is low, systems are highly non-linear or if there are other variables influencing the output.
Main stages of transfer function analysis (TFA). In the time–domain, mean values of blood pressure (BP) and cerebral blood flow-velocity (CBFV) are obtained for each cardiac cycle and the spectral analysis algorithm (FFT: Fast Fourier Transform) is used to obtain spectral estimates in the frequency domain. The auto- and cross-spectrum are then used to obtain estimates of the coherence function, amplitude (gain) and phase frequency responses. Courtesy of JD Smirl ‘The relationship between arterial blood pressure and cerebral blood flow: insights into aging, altitude and exercise’, PhD Thesis, The University of British Columbia (Okanagan), June 2015.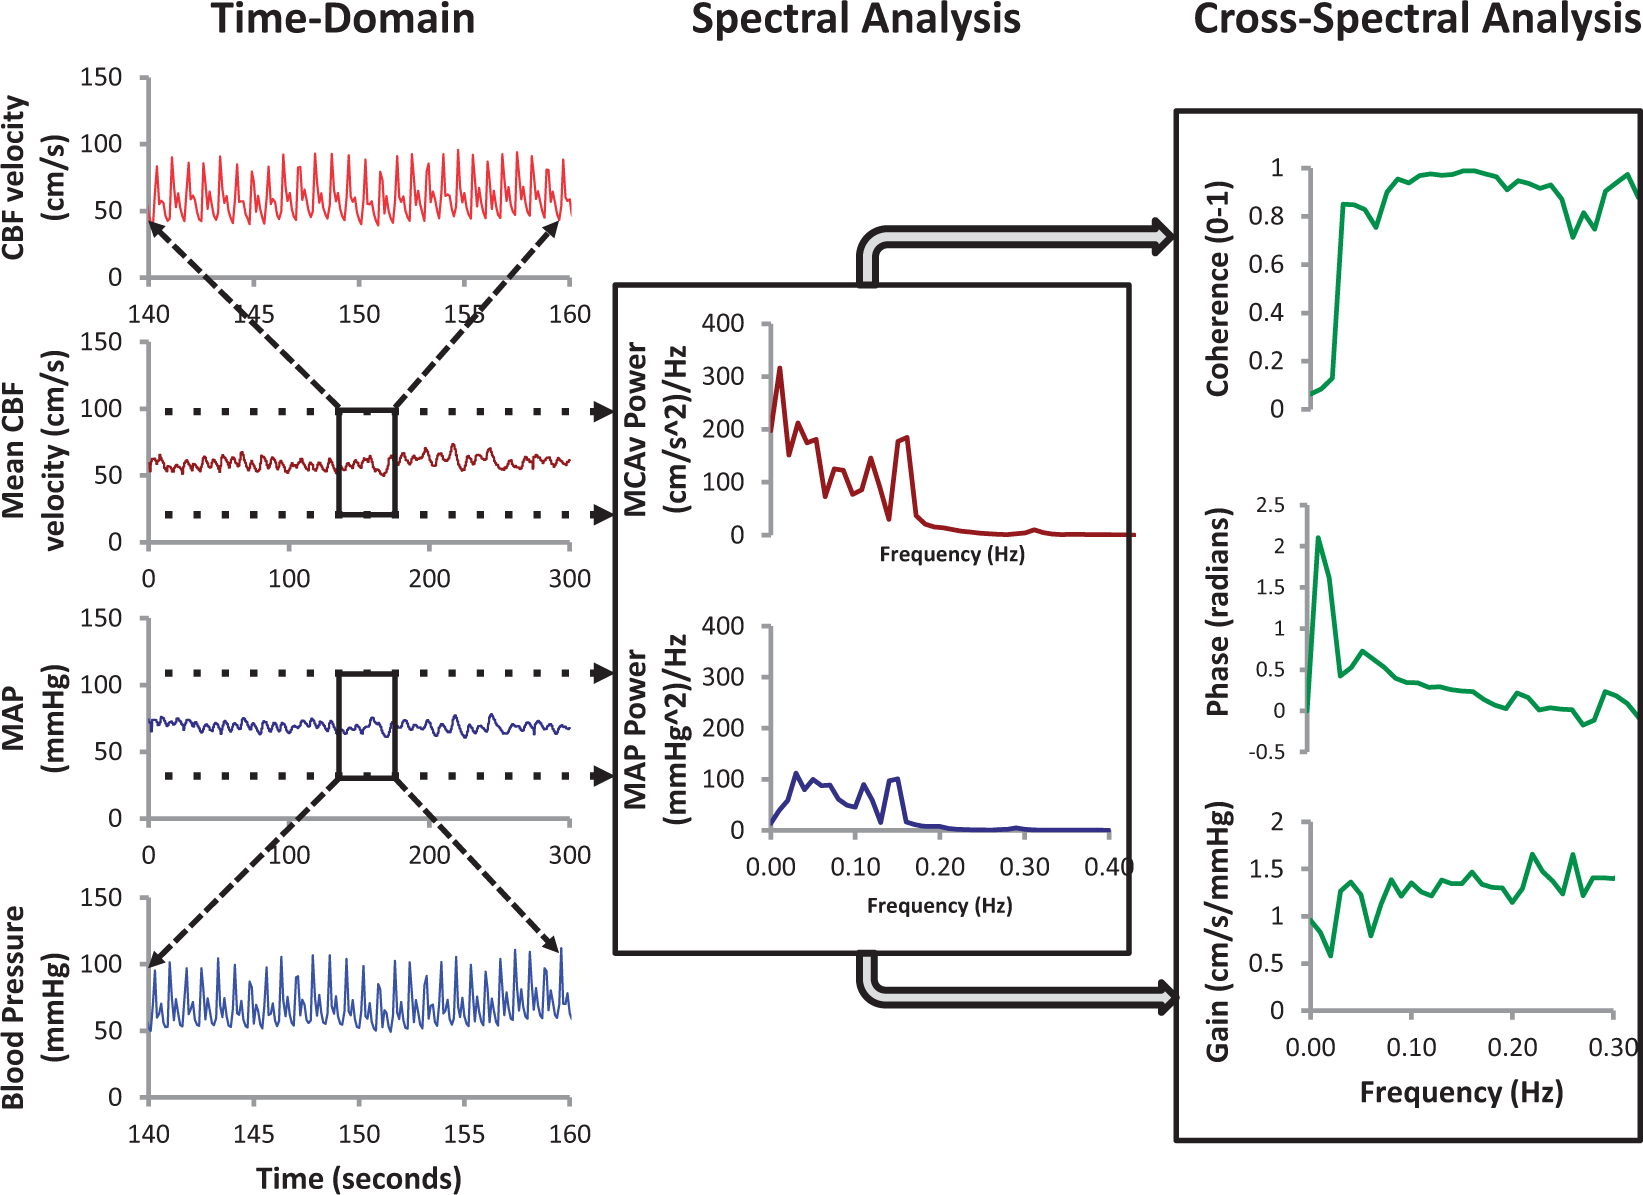
Rationale for this white paper
In summary, TFA uses either resting recordings with spontaneous oscillations in BP and CBF or manoeuvres to induce oscillations in BP and CBF – with CBF often recorded as CBF velocity (CBFV) with transcranial Doppler ultrasound (TCD) 29 – to obtain frequency-dependent estimates of gain and phase, with the statistical reliability of these estimates assessed by the coherence function. Despite its sound theoretical background, 27 practical implementation of TFA involves the choice of a relatively large number of parameters and settings. The literature on TFA applications to dynamic CA shows considerable variations in practice, which have limited comparisons between studies and hindered progress towards clinical application of these methods.30,31 One of the main consequences of this lack of standardisation for example, has been the difficulty to establish well-defined limits for what could be considered normal or impaired autoregulation.
Therefore, the purpose of the present white paper is to improve standardisation of parameters and settings adopted for TFA applications in studies of dynamic CA. The development of these recommendations was initiated by (but not confined to) the Cerebral Autoregulation Research Network (CARNet – www.car-net.org). The contributors represent several distinct research groups that have independently worked to advance the evidence base for improvement of the technical approaches to TFA measurement and analysis. The outcome reported herein is a series of recommendations on the basis of review and critical appraisal of recent physiological and modelling studies, pertaining to the most appropriate methods to assess TFA in humans. This document is only the first step of an on-going process and should not be regarded as a ‘straight-jacket’ to stop investigators exploring alternative settings or methodological choices. Nevertheless, it is hoped that these recommendations will lead to more robust results, improved reliability of the literature and faster translation of research findings into clinical practice.
Finally, it is important to note also that the choice for TFA in this document should not be seen as a statement that TFA is considered the best available method to quantify CA.
Methods
Related to the topic of this report, a systematic review of the TFA literature has been performed. 31 That paper (which includes details on search strategy and study inclusion) has identified a large diversity in signal processing methods, experimental conditions and research protocols that have been used for TFA in previous publications. 30 Relevant to this initiative is a recent report comprising data from a multicentre study wherein a single, uniform database with healthy patients with BP and TCD recordings was analysed by different research centres, each using their own TFA settings (filters, frequencies, data windows, segmentation, etc.), which was initiated and carried out by CARNet. 30 That study has provided important insight into the impact of different TFA settings on the final results.
For each of the recommendations below, we attempted to express the available evidence from the literature. TFA relies on a well-established mathematical framework as part of linear system analysis and in many aspects that is the main justification for the choice of parameters and settings recommended below. 27 However, there are still several methodological aspects that are not straightforward and more evidence is needed as highlighted in this white paper.
The various topics related to the use of TFA for CA were divided into five different areas: experimental procedures, data preparation and preprocessing, TFA methodology, parameter extraction from TFA and documentation of TFA results. 30
White paper recommendations
Experimental procedures
Although the main purpose of this white paper is to support standardisation of TFA procedures, consistent and reliable results cannot be obtained unless due care is given to data acquisition and measurement protocols. These include environmental conditions, body position, measurement technique and control of physiological covariates that can influence CA.
Recommendation 1
Measurements should be performed in a temperature-controlled environment; ideally 22–24℃. Subjects should refrain from caffeinated drinks, chocolate and the ingestion of a heavy meal for at least 4 h before examination. Exercise and alcohol ingestion should also be avoided for a minimum of 12 h. Supplements and various medications may also affect TFA and should be accounted for depending on the experimental question. If CA is studied at rest (‘baseline’), visual or acoustic stimulation should be kept to a minimum (no disturbances by people entering or leaving the room). Sensory stimuli may, however, be applied in a controlled way if CA analysis is part of an analysis which includes neurovascular coupling. Adequate explanation of the procedure to the subject will help to reduce fear and anxiety, especially in anxious individuals. End-tidal CO2 should be recorded to confirm the required stability of respiration during the experiment (absence of hyperventilation or hypoventilation), because even small changes in CO2 can affect CBF. 30 Because of known diurnal variation in CA, 32 it is recommended that tests be conducted at a similar time of the day for repeat assessments. For between-group studies, assessment times should be standardised. In patients with increased intracranial pressure (ICP), mean ICP should be noted at the time of examination. Cerebral perfusion pressure (CPP: BP-ICP) has been used with other methods, but its use as input to TFA requires further investigation.
For a resting state or baseline level of CA, BP and CBFV should be measured with the individual in a supine or seated position with uncrossed legs after a 15 min period of rest.33,34 All body positions should be clearly reported (e.g. supine with head 30° elevation).
For measurements performed under less-controlled conditions, such as patients in intensive care, it is important to treat departures from the recommendations above as limitations to be raised in the discussion and taken into consideration in the interpretation of results.
Recommendation 2
The large majority of TFA studies of dynamic CA have used arterial volume clamping of the digital artery to obtain continuous non-invasive measurements of BP and TCD to record CBFV as a surrogate of CBF. 30 A number of alternatives are available for recording these two variables, detailed discussion of their particular characteristics is beyond the scope of this report. Nevertheless, it is essential to appreciate that estimates of gain, phase and coherence can vary considerably when different types of measurements are adopted, for example by using either TCD or near-infrared spectroscopy (NIRS) to estimate CBF. 36 Also, equipment can have delays in signal output (for example, Finapres (Finapres Medical Systems, Amsterdam) has a fixed output delay of 1 s for its reconstituted brachial artery BP signal, capnography devices have delays that depend on the length of tubing used, etc.). Therefore, it is essential to know (and measure) this delay and take that delay into account when synchronizing BP and CBFV (and other) signals.
Given the strong effects of carbon dioxide pressure (PaCO2) on dynamic CA and BP,37–40 it is important to incorporate its measurement simultaneously with BP and CBFV. This is often accomplished by recording end-tidal CO2 with infrared capnography or mass spectroscopy. Any significant fluctuations in PaCO2 (>1 mmHg) should be reported and taken into consideration when interpreting results from TFA.38–40 If ICP monitoring is available (this is of relevance for studies in ICU settings), ICP levels at which dynamic CA analysis is performed need to be reported as well, given that intracranial hypertension may impair CA. 19
Recommendation 3
Recordings of spontaneous fluctuations of BP and CBFV for TFA should last a minimum of 5 min, assuming stationary physiological conditions and uninterrupted good quality data, to ensure that recordings can yield robust estimates of transfer function parameters, and to improve frequency resolution as detailed in the following statements. Certain physiological experiments such as hypercapnia will require longer recordings to allow stationary physiological conditions lasting a minimum of 5 min.
Data preparation and preprocessing
Sampling frequency
The literature also shows a wide range of sampling frequencies, i.e. the number of instants per second the continuous input data are sampled and stored as a number. 30 This should not be confused with the re-sampling frequency often adopted following interpolation of beat-to-beat data as described below.
Recommendation 4
For analog-to-digital conversion of the continuous BP and CBFV signals, a minimum sampling frequency of 50 Hz is recommended, following appropriate anti-aliasing filtering, typically with a low-pass frequency cut-off at 20 Hz.
Waveform vs. beat-to-beat data
In the TFA literature, two different signal formats for the BP and CBFV time signal are in use: (1) the raw waveform of recorded BP and CBFV signals or (2) beat-to-beat data (e.g. the mean BP and mean CBFV for each beat). Deegan et al. have compared TFA outcomes between the use of full waveform time signals versus beat-to-beat data. 42 For artefact-free data, there was a good correlation between the two methods; however, analysis of full waveforms was much more sensitive to artefacts, for example the ‘physiocals’ of the Finapres BP device, which lead to short segments without BP data.
Recommendation 5
Since most studies report using beat-to-beat data to analyse TFA, 31 for the purpose of standardisation, the use of beat-to-beat data is recommended for future research. Also, an important advantage of using beat-to-beat data is that this method is less sensitive to short segments of missing BP or TCD data than full waveform analysis. 42 The most common approach, which is recommended, is to use the time of the BP diastolic value as the start and end points of each cardiac cycle, using waveform integration (area-under-the curve) to derive mean BP and CBFV for that cycle. Visual inspection of the raw signal is advised to verify that this approach correctly captures both BP and CBFV waveforms for that cardiac cycle.
Recommendation 6
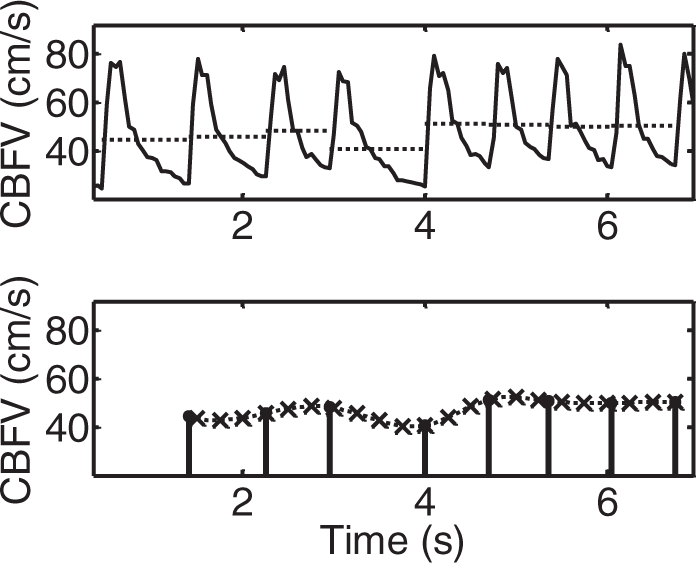
Signals should always be visually inspected prior to analysis (preferably considering both raw and beat-averaged signals), to ensure that they are free from excessive noise and artefacts (Figure 2). Short periods of strong artefact (up to three beats) should be removed and replaced by linear interpolation. When excessive artefact persists for longer periods, the data segment should be excluded from analysis. Sporadic ectopic beats can be included in the analysis.
Representative recordings of blood pressure (BP) and cerebral blood flow-velocity (CBFV) in a healthy adult subject. (a) Good quality recording showing reduced presence of noise and absence of artefacts with clear visualisation of each waveform. (b) Inadequate data quality with considerable amount of noise and frequent occurrence of artefacts that distort the BP and CBFV tracings.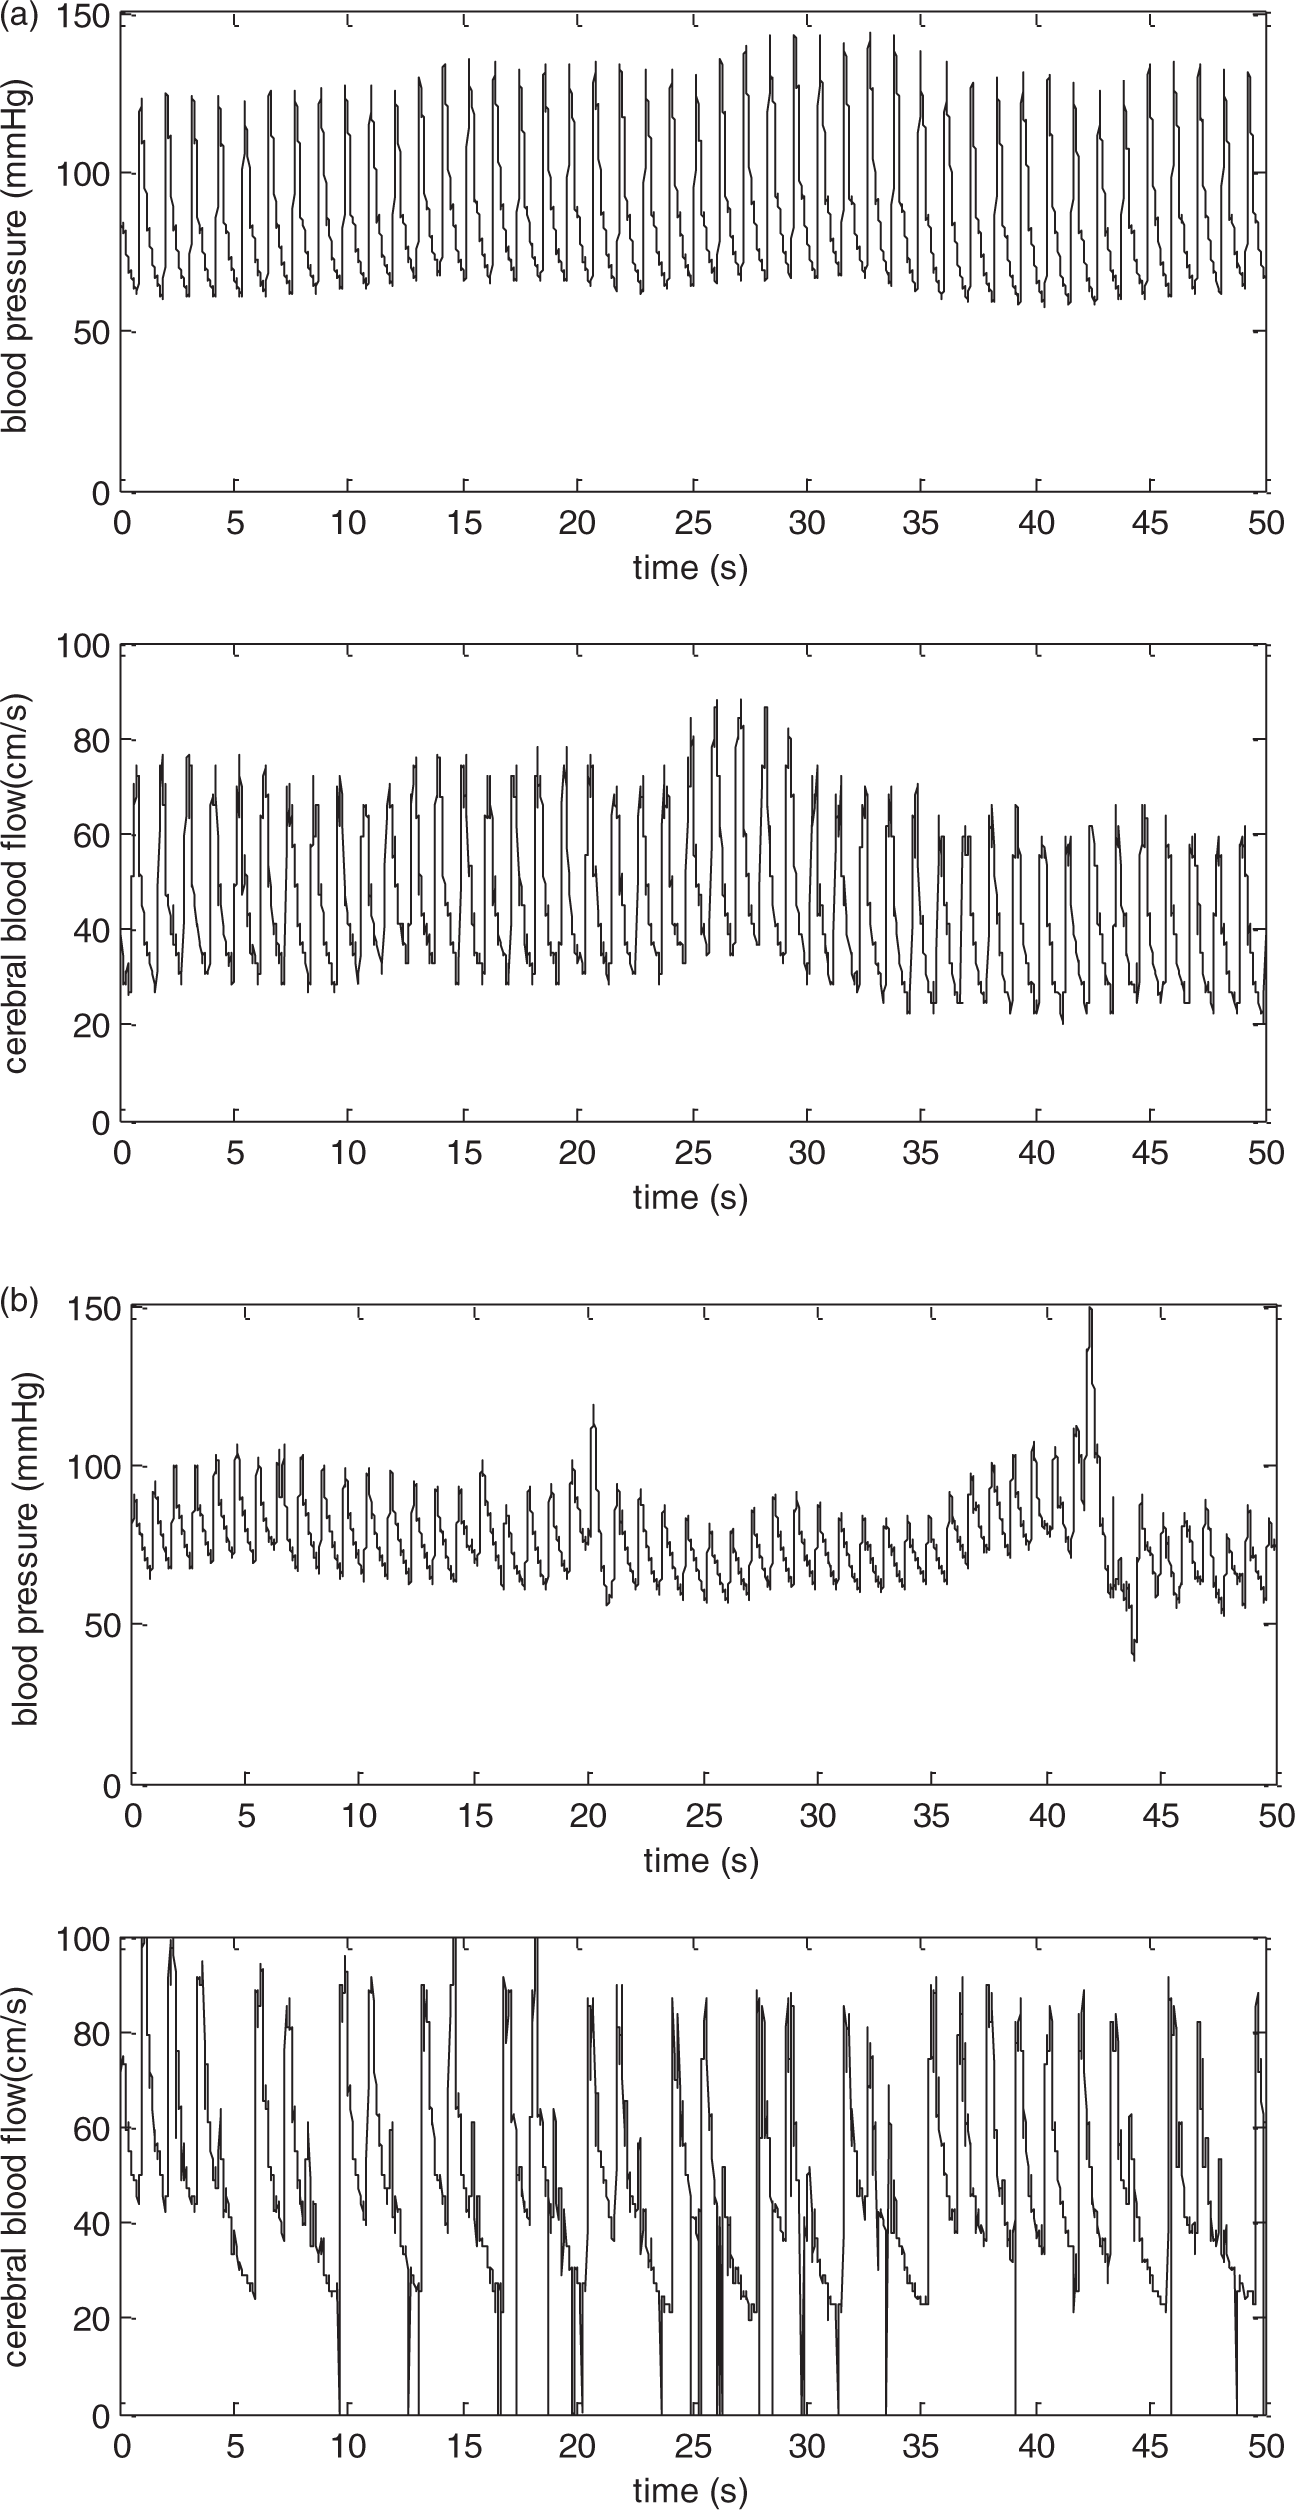
Interpolation
TFA supposes equidistant data points. Interpolation can be used to create equidistant time intervals (in case of beat-to-beat data), by constructing new data points within the range of a discrete set of known data points. Different types of interpolation, such as linear- and spline interpolation are available, but it has been shown that this choice does not affect TFA estimates greatly. 30
Recommendation 7
To standardise intercentre procedures it is recommended that spline (third-order polynomials) are used to interpolate the time series of mean BP and mean CBFV calculated for each cardiac cycle. For mean values of BP and CBFV obtained from each cardiac cycle (beat-to-beat data), the minimum re-sampling frequency should be 4 Hz after interpolation (to obtain a uniform time axis). This process is illustrated in Figure 5.
Detrending
Detrending reduces the amount of low-frequency power by removing any linear or non-linear trends from the data. Meel-van den Abeelen et al. showed that the type of detrending used (including no detrending, linear trend removal and third-order polynomial detrending) does not affect TFA outcomes. 30 However, this was tested in computer-generated (synthetic) data in which the input–output relationship was purely linear, and no noise was present. This may explain why neither benefits nor disadvantages of detrending were observed, as may be seen for signals recorded in human subjects. Further studies using synthesised data with added noise, including signal drifts, should be performed to confirm these observations. Nevertheless, detrending will remove very low frequencies (VLFs) (trends) that will lie in a range below 0.01 Hz. As it is recommended to exclude frequencies below that range for TFA analysis (see recommendation 13), this could explain why detrending has no clear effects on outcome.
Recommendation 8
To standardise intercentre procedures, it is recommended to provide analyses obtained without detrending, nor high-pass filtering. However, mean values should be removed prior to TFA and stored for further use such as normalisation (see Recommendation 15).
Filtering
Filtering can be used to delete frequencies that are of no interest, such as very high frequencies or extremely low frequencies. In the literature, only a minority of studies reported the use of any kind of filtering (11%). 31 The effect of filtering on TFA outcomes has not yet been investigated.
Recommendation 9
Low- or high-pass filtering of signals before TFA is not recommended.
Note to recommendation 9
During the process of TFA, the step where beat-to-beat mean data are obtained has the effect of a low pass ‘filter’. This step is allowed and recommended (see Recommendation 5).
TFA methodology
TFA is usually computed by way of the fast Fourier transform (FFT) to obtain estimates of auto- and cross-spectra. 27 Spectral estimates derived from a single data window show considerable scatter with coefficients of variation (CoV = standard deviation/mean) approximately equal to one. 27 To improve precision of spectral estimations, averaging or smoothing is required, often using Welch’s method 43 which breaks the total data length into separate segments or windows to obtain averaged auto- and cross-spectra. In addition to signal segmentation, spectra may also be smoothed using moving-average filters in the frequency domain. Due to the phenomenon of spectral leakage, 27 a tapered window (Recommendation 10) must be applied to each segment of data in the time domain, before calculation of the FFT.
Selecting optimal parameter settings
Calculated cut-off values for coherence with the recommended settings for TFA estimation.
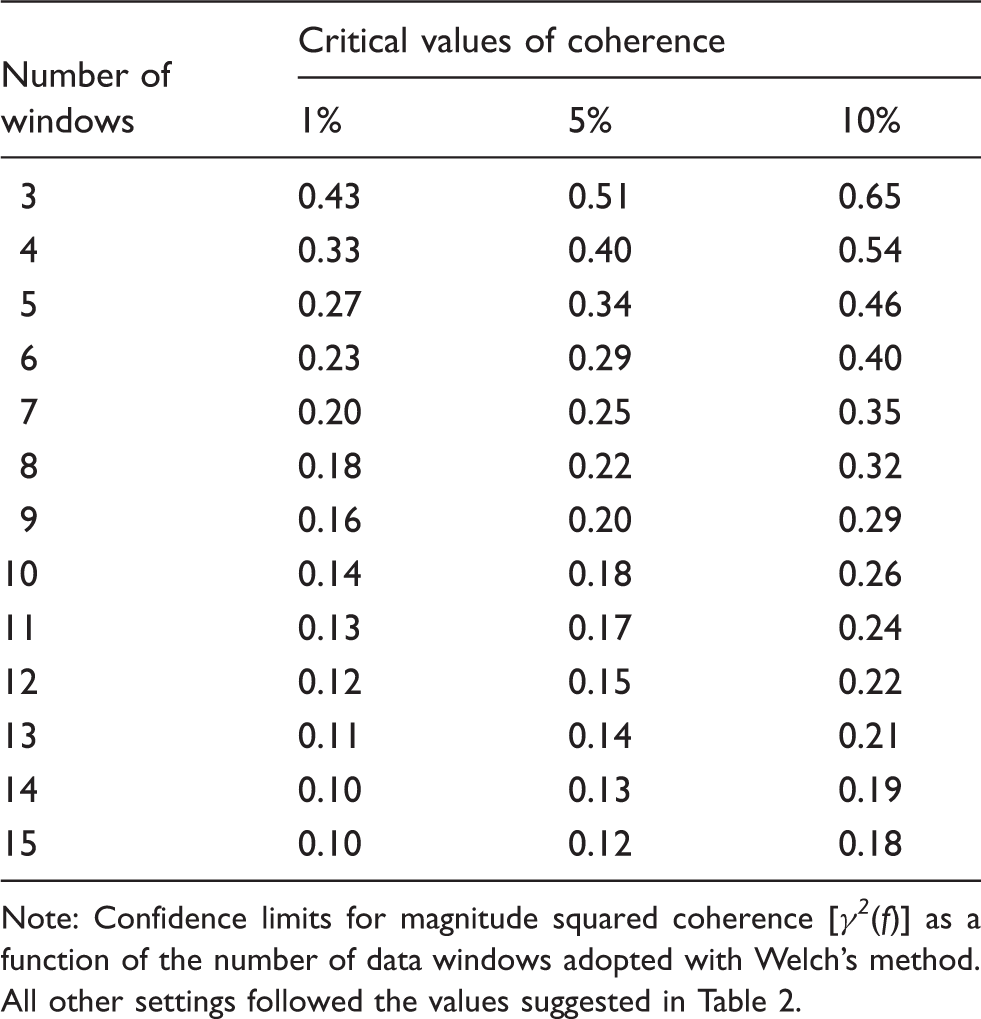
Note: Confidence limits for magnitude squared coherence [γ2(f)] as a function of the number of data windows adopted with Welch’s method. All other settings followed the values suggested in Table 2.
Proposed standardised TFA parameter settings.
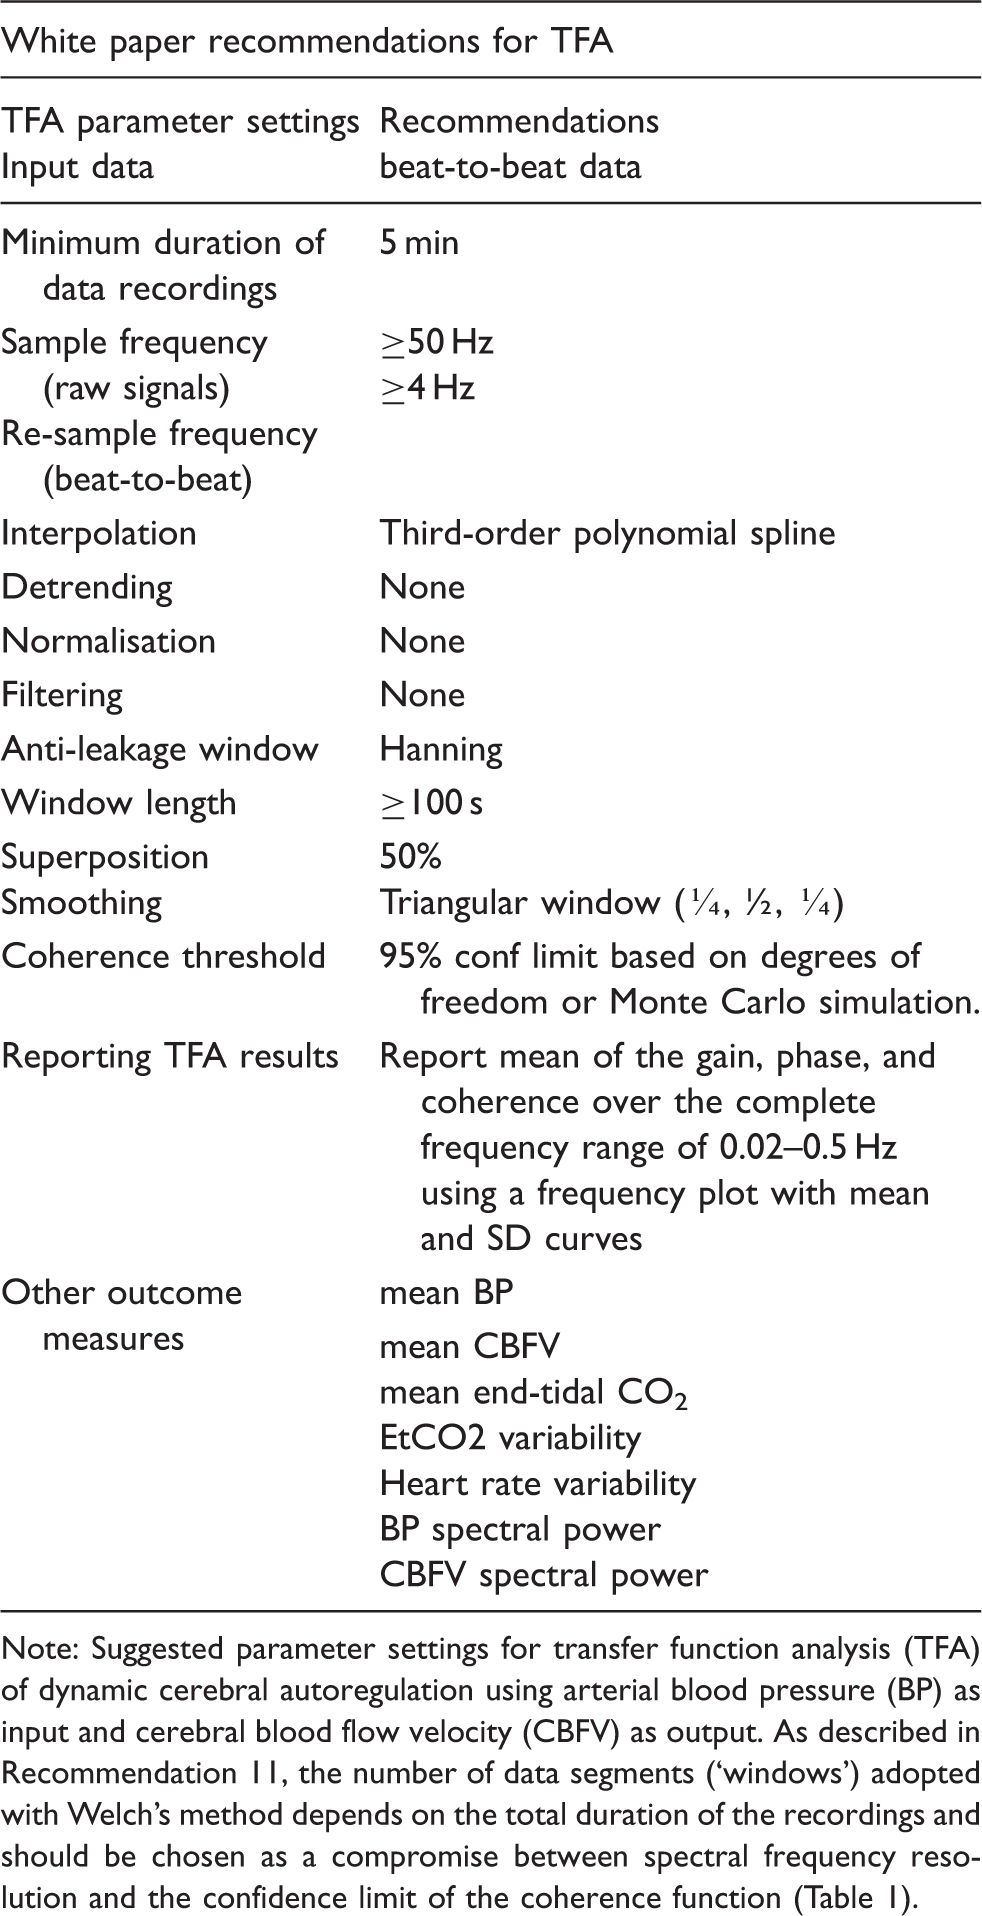
Note: Suggested parameter settings for transfer function analysis (TFA) of dynamic cerebral autoregulation using arterial blood pressure (BP) as input and cerebral blood flow velocity (CBFV) as output. As described in Recommendation 11, the number of data segments (‘windows’) adopted with Welch’s method depends on the total duration of the recordings and should be chosen as a compromise between spectral frequency resolution and the confidence limit of the coherence function (Table 1).
Anti-leakage window
Data segments need to be windowed to minimise a particular kind of distortion called spectral leakage. 27 A number of different shapes for anti-leakage windows, such as Hanning, Hamming and Tukey window 44 have been used. A recent multicentre study, comparing the results of different centre methodologies for TFA, showed that there were no major differences in outcomes between using the Hamming or the Hanning anti-leakage window. In contrast, the Tukey window distorted the gain and the phase in the VLF) band (0.01–0.07 Hz). 30 However, this was based on simulated noise-free signals and the impact on recorded signals has not been evaluated in the context of CA.
Recommendation 10
The Hanning window is recommended to minimise the occurrence of spectral leakage.
Window length
The number of data points included in a window in combination with the sample frequency determines the window length in seconds, which will then define the frequency resolution of the transfer function estimates (
Recommendation 11
To allow sufficient frequency resolution, it is recommended to use window segments with a minimum length of 100 s. When recordings longer than 5 min are available, it is preferable to increase the number of windows, rather than the length of individual windows when using the Welch algorithm.
Number and superposition of data segments
As described previously, the dominant technique in the literature for calculation of the auto- and cross-spectra is the use of the (fast) Fourier transform, combined with Welch’s method 42 to improve its statistical reliability. This involves averaging spectral estimates from separate segments of data, which can be overlapped by variable degrees of superposition to maximise the degree of smoothing. Varying the percentage of superposition, using percentages of 25%, 50% and 75%, has been shown not to affect the outcomes of TFA, 30 with 50% being the most common degree of superposition reported in the literature.
Recommendation 12
A superposition of approximately 50% is recommended for overlapping data segments in conjunction with Welch’s method. Combining this recommendation with the minimum duration of the entire recording (minimum 5 min) and the window length (>100 s) means that a minimum of five separate segments of data should be used with Welch’s method. When recordings longer than 5 min are available, the window length should not be increased, but rather the number of windows should increase. In order to ensure that the full length of available data is exploited, it is recommended that the overlap of windows is adjusted around 50%.
Spectral smoothing
Following estimation of the auto- and cross-spectra using the FFT, smoothing these spectra by means of a moving average filter in the frequency domain improves the reliability of estimates, particularly the coherence function, as will be discussed below.
Recommendation 13
Both auto- and cross-spectra should be smoothed using a triangular moving average window with coefficients [¼, ½, ¼].
Coherence function
As mentioned in the Introduction, assessment of the coherence function is essential for accepting the validity of estimates of gain and phase at each frequency, assuming that the BP-CBFV relationship is linear. The simplest way to do this is to check whether the values of coherence are above a certain threshold, usually the 95% confidence limit (i.e. 5% critical value) of the null hypothesis that input and output are not related, theoretically corresponding to zero coherence. Note that some papers refer to coherence as ‘magnitude-squared coherence’. One factor that needs to be taken into consideration when identifying the minimum value of coherence significantly different from zero is the number of independent observations that were used in the calculation, usually defined as the degrees of freedom (DF). The analogy with the correlation coefficient (r) can be useful to illustrate how DF operates in this context. For example, if r = 0.3 has been calculated from only 10 observations, this will not be significantly different from zero (p > 0.05). On the other hand, the same value of correlation derived from 30 observations will be significant (p < 0.05). The same principle applies to coherence, but in this case determination of DF needs to take into account the TFA parameter setting (Tables 1 and 2). Since calculation of the spectrum involves the summation of two squared terms (coefficients of sines and cosines), it will have a chi-square distribution with DF = 2. One important property of the Fourier decomposition is that sine and cosine coefficients at different frequencies are statistically independent. This means that if spectral estimates for two neighbouring harmonics are averaged, the number of DF will go up to four and so on. Although equations have been proposed to estimate critical values of coherence,
45
more realistic values are obtained using a Monte Carlo simulation adopting a particular set of parameters, as recommended in Table 2. Using these parameters, and a variable number of data segments (‘windows’) with Welch’s method, the critical values of coherence are given in Table 1. The relationship between the number of windows and the critical value for coherence is also illustrated in Figure 3. As shown in the table, if only three windows are adopted, the 5% critical value will be 0.51 which is close to the usual value of γ2min(f) = 0.5 often adopted by many investigators. However, by increasing the number of windows, the critical value can be reduced considerably, for example reaching 0.20 for nine windows. This example illustrates how DF can influence the threshold for statistical significance of coherence and also why it is not possible to use a single, one-size-fits-all threshold such as γ2min(f) = 0.5 that has been widely adopted. Since low values of coherence are often used to reject estimates of gain and phase, it is important that the threshold adopted is calculated rigorously to avoid rejection of useful data or inclusion of unreliable estimates. Moreover, it is also important to appreciate that for VLFs (<0.05 Hz), the relationship between BP and CBFV is not linear, given the relatively large changes in cerebral vascular resistance, and for this reason the same critical values of coherence do not apply in this frequency region.29,46 For example, this was shown in an experiment that compared TFA estimates based on spontaneous oscillations with those using enhanced oscillations, induced by repeated squat-stand manoeuvres.
12
With enhanced oscillations, and, as expected, higher spectral power, coherence in the VLF increased compared with spontaneous oscillations. Of note, the gain and phase estimates that were obtained with low coherence in spontaneous oscillations were comparable to those obtained with higher coherence.
Critical values for coherence estimates at the α = 0.01, 0.05 and 0.1 significance level for 3–15 windows. Solid lines: Monte Carlo simulation from 1000 pairs of independent white Gaussian noise using Hanning windows with 50% overlap and spectral smoothing. The dotted lines give the critical values without spectral smoothing and with non-overlapping windows, calculated from theory.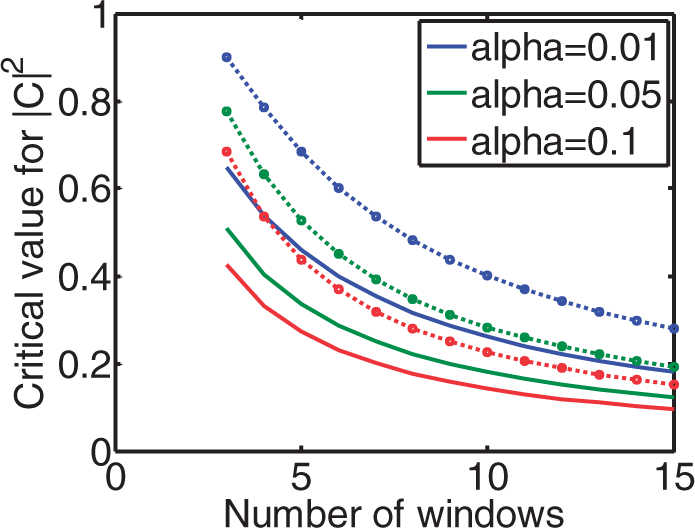
Recommendation 14
Defining a threshold (or cut-off) value for coherence to decide on rejection of data must be guided by the statistical significance of the coherence function. The statistical calculation must take into account the number of degrees of freedom of the particular implementation, which depends on the number of windows, overlap, spectral smoothing and other window settings (Figure 3). It is recommended that if coherence is persistently low (not significant) across all frequency bands, the recording is excluded from analysis, as poor data quality and thus unreliable results are expected. In calculating average phase and gain in different frequency bands (see Recommendation 17), those individual frequency points within the selected frequency band in which coherence does not exceed the critical values should be excluded from averaging. Table 1 provides the confidence limits for coherence as a function of the number of windows. These values apply to single harmonics (individual frequency points within a frequency band). Averaging harmonics over an entire frequency band will reduce the numerical values given in the table.
Parameter extraction from TFA
Units of measurement
The coherence function is dimensionless. The literature shows an almost equal divide between the use of radians or degrees for phase estimates.
31
Changing from one to the other is straightforward (
Recommendation 15
Estimates of gain obtained by TFA should be expressed in both absolute units (cm.s−1.mmHg−1) as well as percentage changes (%.mmHg−1).
Phase wrap-around
Estimates of phase require the calculation of the tg−1 of the ratio of the imaginary and real parts of the complex transfer function.
27
Unfortunately, the inverse tangent (tg−1) calculation cannot differentiate values of phase between π and 2 π radians from corresponding negative angles. This indetermination of phase estimates, usually referred to as ‘wrap-around’ can obviously lead to major distortions if negative values are mixed with positive ones when averaging phase for a group of subjects or across frequencies.
47
Phase wrap-around is illustrated in Figure 4.
Occurrence of phase ‘wrap-around’ as indicated by the relatively large negative values of phase (continuous line), compared to the consistently positive values more often observed (dashed line) for frequencies below 0.1 Hz. Schematic representation of the process of interpolation and resampling following calculation of beat-to-beat values of mean blood pressure (BP) or cerebral blood flow-velocity (CBFV) for each cardiac cycle. This procedure leads to signals with a uniform time base, thus removing the influence of heart rate variability.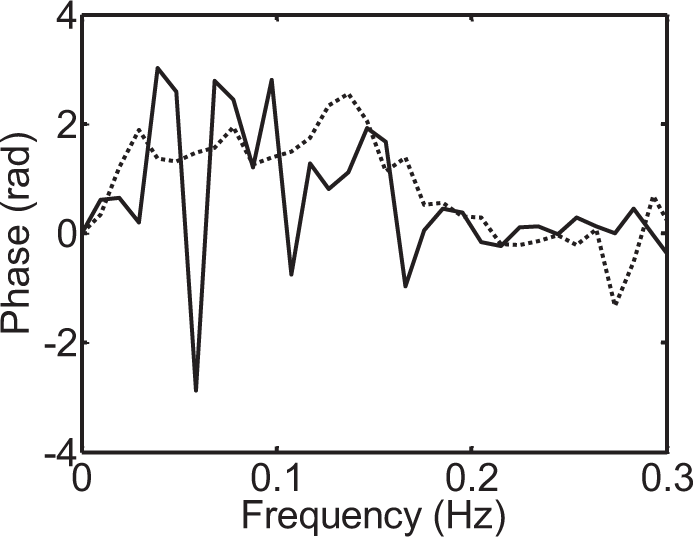
Recommendation 16
The complete phase frequency response for each subject needs to be visually inspected to check for the occurrence of ‘wrap-around’ (Figure 4). When negative values of phase are detected for frequencies <0.1 Hz, these should be removed from any averages over the VLF or LF frequency bands. Smaller negative values of phase are to be expected for frequencies above 0.1 Hz and do not need to be removed when producing averages for the HF band.
Reporting TFA results
Next to accurate documentation of the settings used for TFA, it is important to report TFA outcomes in a standardised manner.
In the earlier systematic review 31 it has been shown that TFA outcomes are presented in many different ways. Overall, studies report the mean of the gain, phase and coherence over predefined frequency bands. Historically, the most often used frequency bands for this purpose are 0.02–0.07 Hz for the VLF, 0.07–0.2 Hz for the LF and 0.2–0.5 Hz for the HF. However, evidence about their sensitivity and specificity in detecting impairment of CA in different patient groups and/or physiological conditions is lacking. Also, some centres use different methods to provide average values across bands, e.g. by weighting values (e.g. using a cut-off for coherence), but this is not always clarified in papers.
Recommendation 17
When reporting results of TFA, it is important to present the complete frequency dependence of coherence, gain and phase in the range 0.02–0.5 Hz, as mean and SD values at each frequency. Ideally, the spectral power density distributions of CBFV and BP should also be given at each frequency. Until further evidence is available, statistical analyses should be based on averaged values for the VLF (0.02–0.07 Hz), LF (0.07–0.2 Hz) and HF (0.2–0.5 Hz) bands. In addition, mean values of BP and CBFV and their intra-recording variability should also be reported. Specific averaging methods such as weighting of individual values within bands should be presented separately, and the method(s) used must be reported clearly.
Implementation
Translating guidelines into daily clinical practice and research remains a challenge. The principal goal of the present white paper is to improve reproducibility and implementation of study results. Table 2 shows an overview of the above mentioned recommendations for TFA to quantify CA.
As a first step towards implementation, we encourage researchers to compare their practice to the settings as they are recommended in this white paper. While some researchers may have strong arguments for not adopting the proposed settings, we strongly encourage all colleagues to present results with these settings (even if only as additional results), in order to facilitate comparison between studies and centres. Arguments against the use of the ‘standard’ setting should be provided, in order to help shape future revisions of this white paper. The proposed settings are not intended to necessarily indicate what is ‘best’ (by whatever criterion), and we emphasise that currently the evidence in support of some of the proposed settings is still weak, but standardisation is considered preferable to continued large variations between centres.
Calibration database
Reference outcome parameters for the CARNet database.
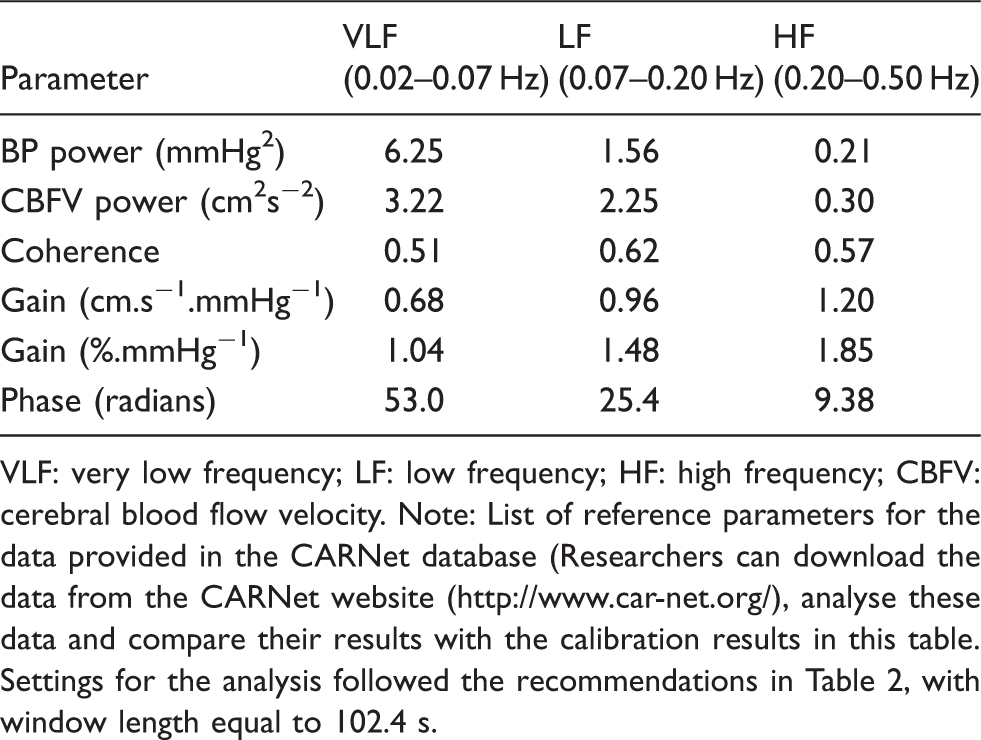
VLF: very low frequency; LF: low frequency; HF: high frequency; CBFV: cerebral blood flow velocity.
Note: List of reference parameters for the data provided in the CARNet database (Researchers can download the data from the CARNet website (www.//digimap.edina.ac.uk), analyse these data and compare their results with the calibration results in this table. Settings for the analysis followed the recommendations in Table 2, with window length equal to 102.4 s.
Discussion
This white paper provides recommendations for the use of TFA for the quantification of dynamic CA using the signals BP and CBFV.
The urgent need for these white paper recommendations was demonstrated by the evidence that a strong diversity exists within the international community in the signal processing methods used for TFA. Apart from the CARNet-initiated multicentre study which investigated the effect of several parameter settings on TFA outcomes, only a few studies have been published on the effect of different TFA settings.30,31 Therefore, many areas of uncertainty exist in which more studies are still needed. Further optimisation of these recommendations will be made possible by future research, taking advantage of the work that has already been done.
When outlining the directions in which future research could be most useful, the following topics come to mind:
More studies to investigate the effect of different TFA settings, such as the choice of data, optimal duration of data recordings, normalisation, window length and filtering. Application of an international standard protocol for the validation of the CBFV signal should be encouraged. Ensuring good signal quality will possibly also reduce the variability in TFA outcomes, making it easier to compare different studies. Studies to determine the reference values and diagnostic usefulness in specific populations, such as children, elderly and patients with specific clinical conditions. Determination of TFA standard decision criteria based on TFA outcomes. More attention should be paid to the experimental or clinical protocol. Investigating the question whether ‘rest’ is the best reference condition, and if so in which body posture (supine/seated) is relevant and the usefulness of physiological manoeuvres to enhance hemodynamic oscillations must be evaluated. Similar studies must be applied for other analytical techniques, such as the time-domain correlation coefficient analysis,
19
non-linear multimodal flow analysis
48
and dynamic non-linear analysis using Laguerre expansions of Volterra kernels or Principal Dynamic Modes22,23 and a comparison between methods with regard to their ability to identify impaired CA. The non-stationary nature of CA
50
needs further investigation, benefitting from the ability of different analytical techniques (see 6 above) to provide estimates of CA parameters with higher temporal resolution than is possible with TFA. The dynamic effects of PaCO2 on the characteristics of the CA process should be explored and eventually incorporated into the study of CA. The influence of ICP on TFA parameters, including coherence, deserves more attention, taking into account both mean values of ICP (e.g. intracranial hypertension), as well as the amplitude of its fluctuations. Accepting and understanding that CA is but one mechanism involved in the control of cerebral perfusion. We need to know how it interacts with and is related to other mechanisms for CBF regulation, such as neurovascular coupling, reactivity to carbon dioxide, and to mechanisms that control BP (such as the arterial baroreflex), heart rate and respiration.
Finally, we emphasise that these recommendations are not intended to endorse TFA as the ‘best’ method for the quantification of CA. One of the key limitations of TFA is that it assumes a causal linear relationship between BP and CBFV. In general, however, CA is considered to be a non-linear phenomenon.46,49 Other methods, i.e. non-linear approaches, may provide more reliable or sensitive estimates of CA, but in the continued absence of a gold standard for dynamic CA assessment, clear criteria and multicentre trials on a wide range of patients would be required to allow robust conclusions. In the meantime, this white paper aims to provide standards for more meaningful comparisons between studies, including those seeking to establish better CA analysis methods.
Footnotes
Funding
This research was supported by Internationale Stichting Alzheimer Onderzoek (ISAO) grant # 05516 to JC; Netherlands Heart Foundation grant # 2008B113 to JC; Marina ten Damme grant to AM; EPSRC (UK) – projects EP/K036157/1, EP/G010420/1, EP/K036181/1 to RP and DS.
Declaration of conflicting interests
The authors declared no potential conflicts of interest with respect to the research, authorship, and/or publication of this article.
Authors’ contributions
JC contributed to writing the first drafts, revisions, and final version, coordinated writing of the paper and collecting input and discussions from the field, and coordinated studies that formed the background for this paper.
AMA wrote the first draft and revised the final version, collected input from the field on previous versions, and performed studies that formed the background for this paper
DS wrote and revised parts of the paper, provided analyses and data for the online calibration dataset and coherence table, and performed studies that formed the background for this paper.
RP wrote parts of the paper, extensively edited revisions of the paper, together with JC studied all comments and suggestions from the field that had been received in response to an earlier draft, and was actively involved in studies that formed the background of this paper.