
Abstract
The aim of this study was to assess the relation between location and type of intracranial atherosclerosis (ICAS) and cortical microinfarcts (CMIs) and macroinfarcts in 18 patients presenting with ischemic stroke (n = 12) or transient ischemic attack (TIA) (n = 6) using 7 tesla MR imaging. The protocol included: 3D T2-weighted FLAIR and 3D T1-weighted Magnetization-Preparation Inversion Recovery Turbo Spin Echo sequence. ICAS lesions and infarcts were scored by two raters. The relation between ICAS lesions, calculated ratios of ICAS lesion characteristics, location, and infarcts were examined using linear regression analyses. A total number of 75 ICAS lesions (all patients), 101 CMIs (78% of patients), and 31 macroinfarcts (67% of patients) were found. Seventy-six and sixty-five percent of the CMIs and macroinfarcts, respectively, were found in the same vascular territory as the ICAS lesions (p = 0.977, p = 0.167, respectively). A positive correlation existed between the number of macroinfarcts and CMIs (p < 0.05). In patients with macroinfarcts, we found more concentric (p < 0.01) and diffuse (p < 0.05) type of ICAS lesions. A high prevalence of brain tissue lesions, both macroinfarcts and CMIs, were found in patients with ICAS. Macroinfarcts were found to be related to specific ICAS lesion types. The type of ICAS lesion seems to be promising as a marker for ICAS patients at higher risk of future infarcts.
Keywords
Introduction
Intracranial atherosclerosis (ICAS) is one of the most prevalent causes of stroke worldwide.
1
However, in current clinical practice, it can be difficult to establish the cause of stroke, and a method commonly used to assess the cause is the Trial of Org 10172 in Acute Stroke Treatment (TOAST)
2
classification system. In this system, ICAS is normally included in the large-artery atherosclerotic group. ICAS can cause different types of parenchymal injury, ranging from large cortical–subcortical infarcts to small lacunar infarcts.2,3 Whether the spectrum of parenchymal damage caused by ICAS is broader and includes even smaller (<3 mm) cortical microinfarcts (CMIs) is not well known. A previous post-mortem autopsy study
4
has suggested that ICAS is indeed associated with these smaller infarcts, but so far this has not been assessed in vivo. Besides this association, several neuropathologic studies have shown CMIs to be linked to the occurrence of macroinfarcts.5,6 It has therefore been proposed that they may share ICAS as common etiology.
5
In addition to the presence or absence of ICAS, the location and type of ICAS may influence the presence of parenchymal damage like the CMIs and macroinfarcts. Furthermore, autopsy studies point to the relevance of CMIs in cognitive dysfunction
6
and when CMIs are present in ICAS, they might open a window to anticipate in the disease process early on as well as provide information on cognitive decline, even when large damage has not happened yet. So, assessment of both macroinfarcts, CMIs, and ICAS in patients with a history of cerebrovascular disease may provide additional information on the spectrum of parenchymal brain injury associated with ICAS (Figure 1).
Illustration of the study purpose based on ICAS and four different ischemic infarct types. ICAS is known to cause large cortical-subcortical (a), small (b), and lacunar infarcts (c). Whether it is also causative for CMIs (d and zoom box) is not known. The relationship between ICAS location and type and CMIs and macroinfarcts also needs to be elucidated. Also, the relationship between CMIs and the macroinfarcts in ischemic stroke and TIA patients is not known.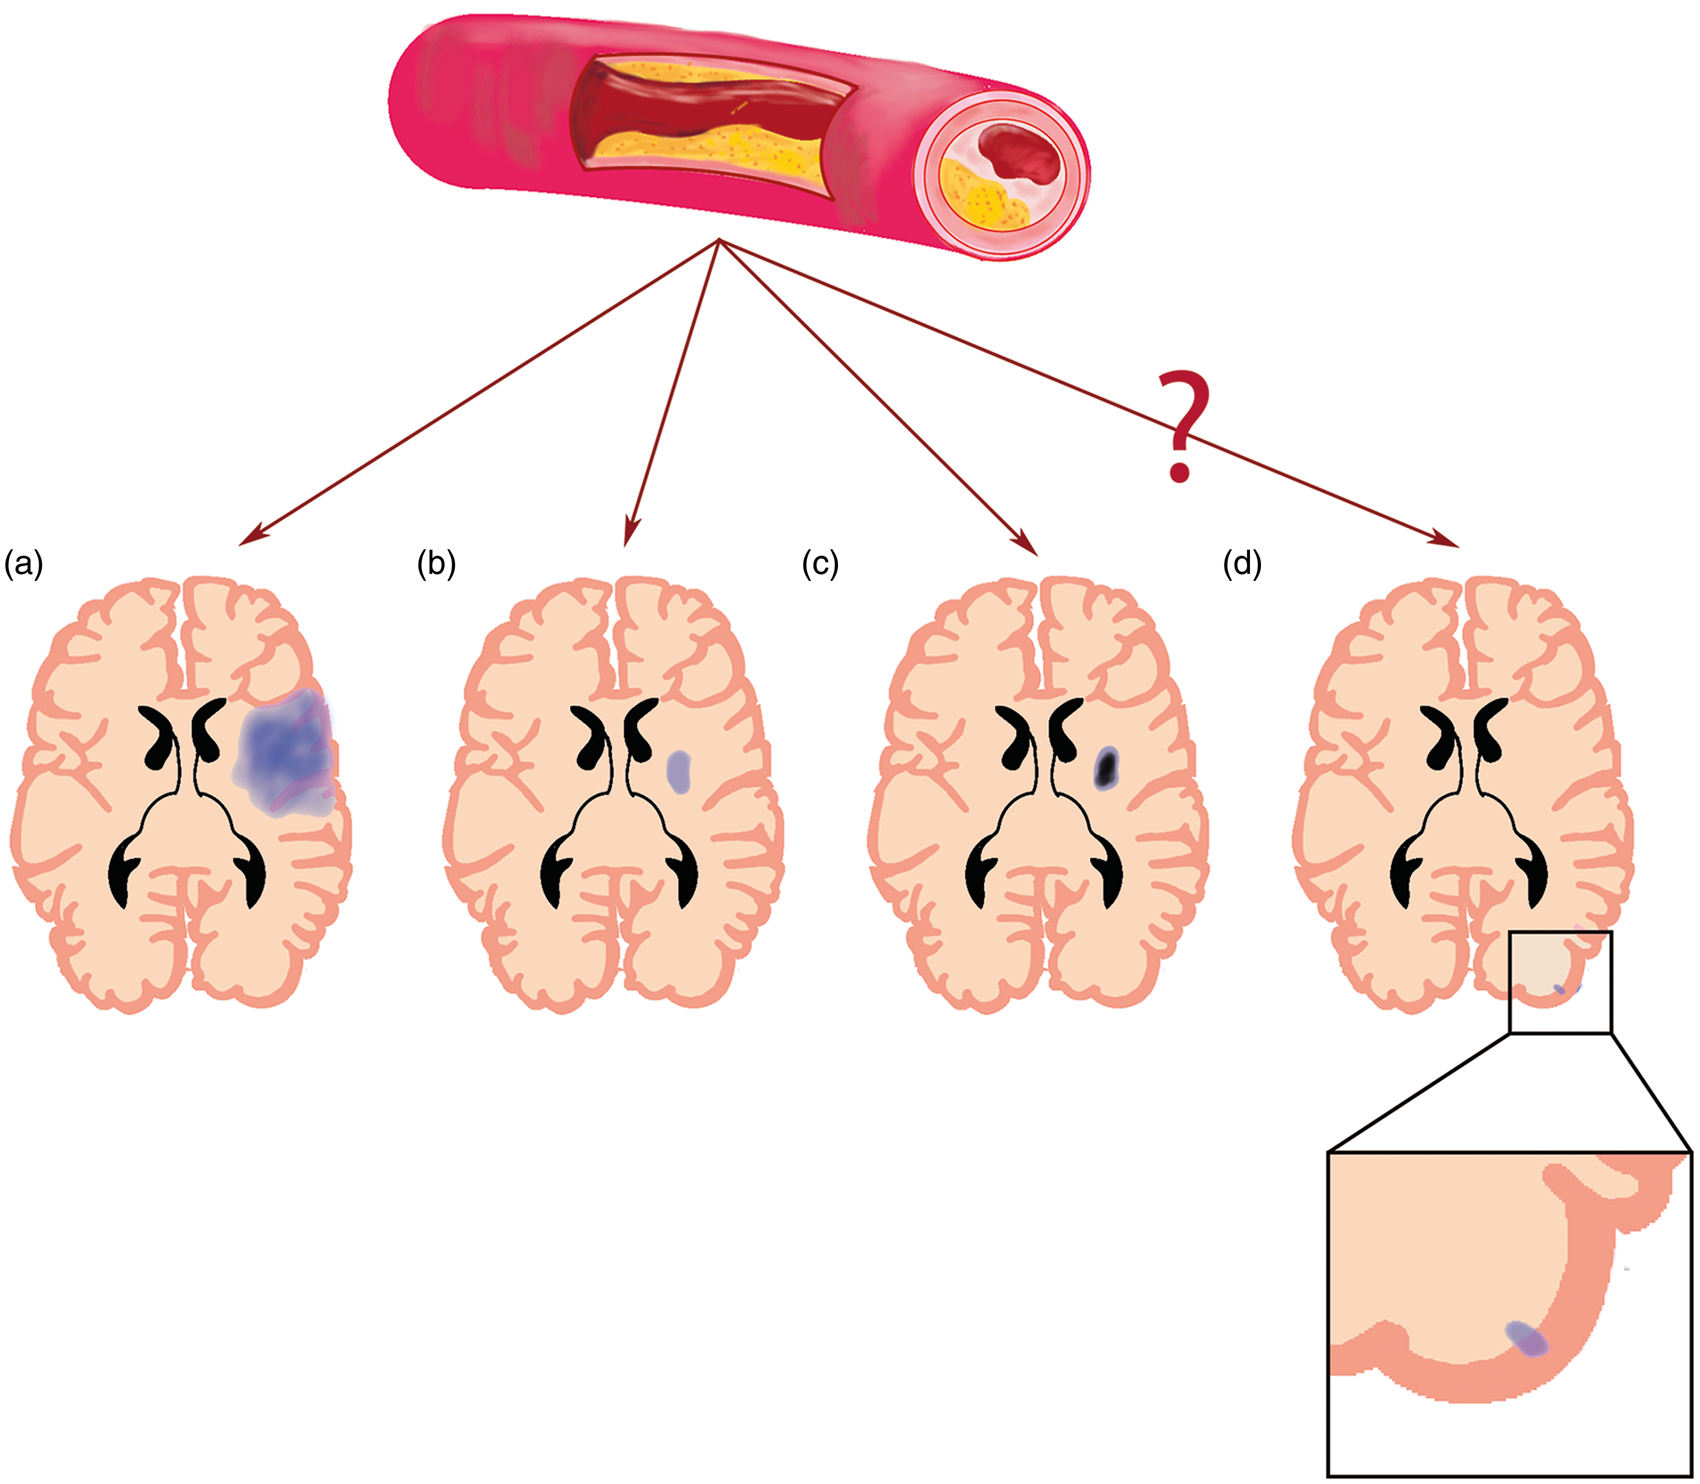
Intracranial vessel wall imaging with high-resolution magnetic resonance imaging (MRI) is often used to assess ICAS, because of its superior soft tissue contrast. 7 Recent advantages at 7 tesla (7T) MRI have made it possible to image the intracranial vessel wall and its pathology of all major brain vessels, which may provide a detailed assessment of the intracranial atherosclerotic burden. Besides ICAS, 7T MRI has also shown to be able to visualize smaller CMIs than was possible at 3T MRI. 8 Therefore, 7T MRI would be the field strength of choice to image ICAS and CMIs, as well as small lacunar infarcts and larger infarcts in greater detail. In this prospective study, the relation between location and type of ICAS and CMIs and macroinfarcts was assessed.
Materials and methods
Subjects
Patient baseline characteristics.
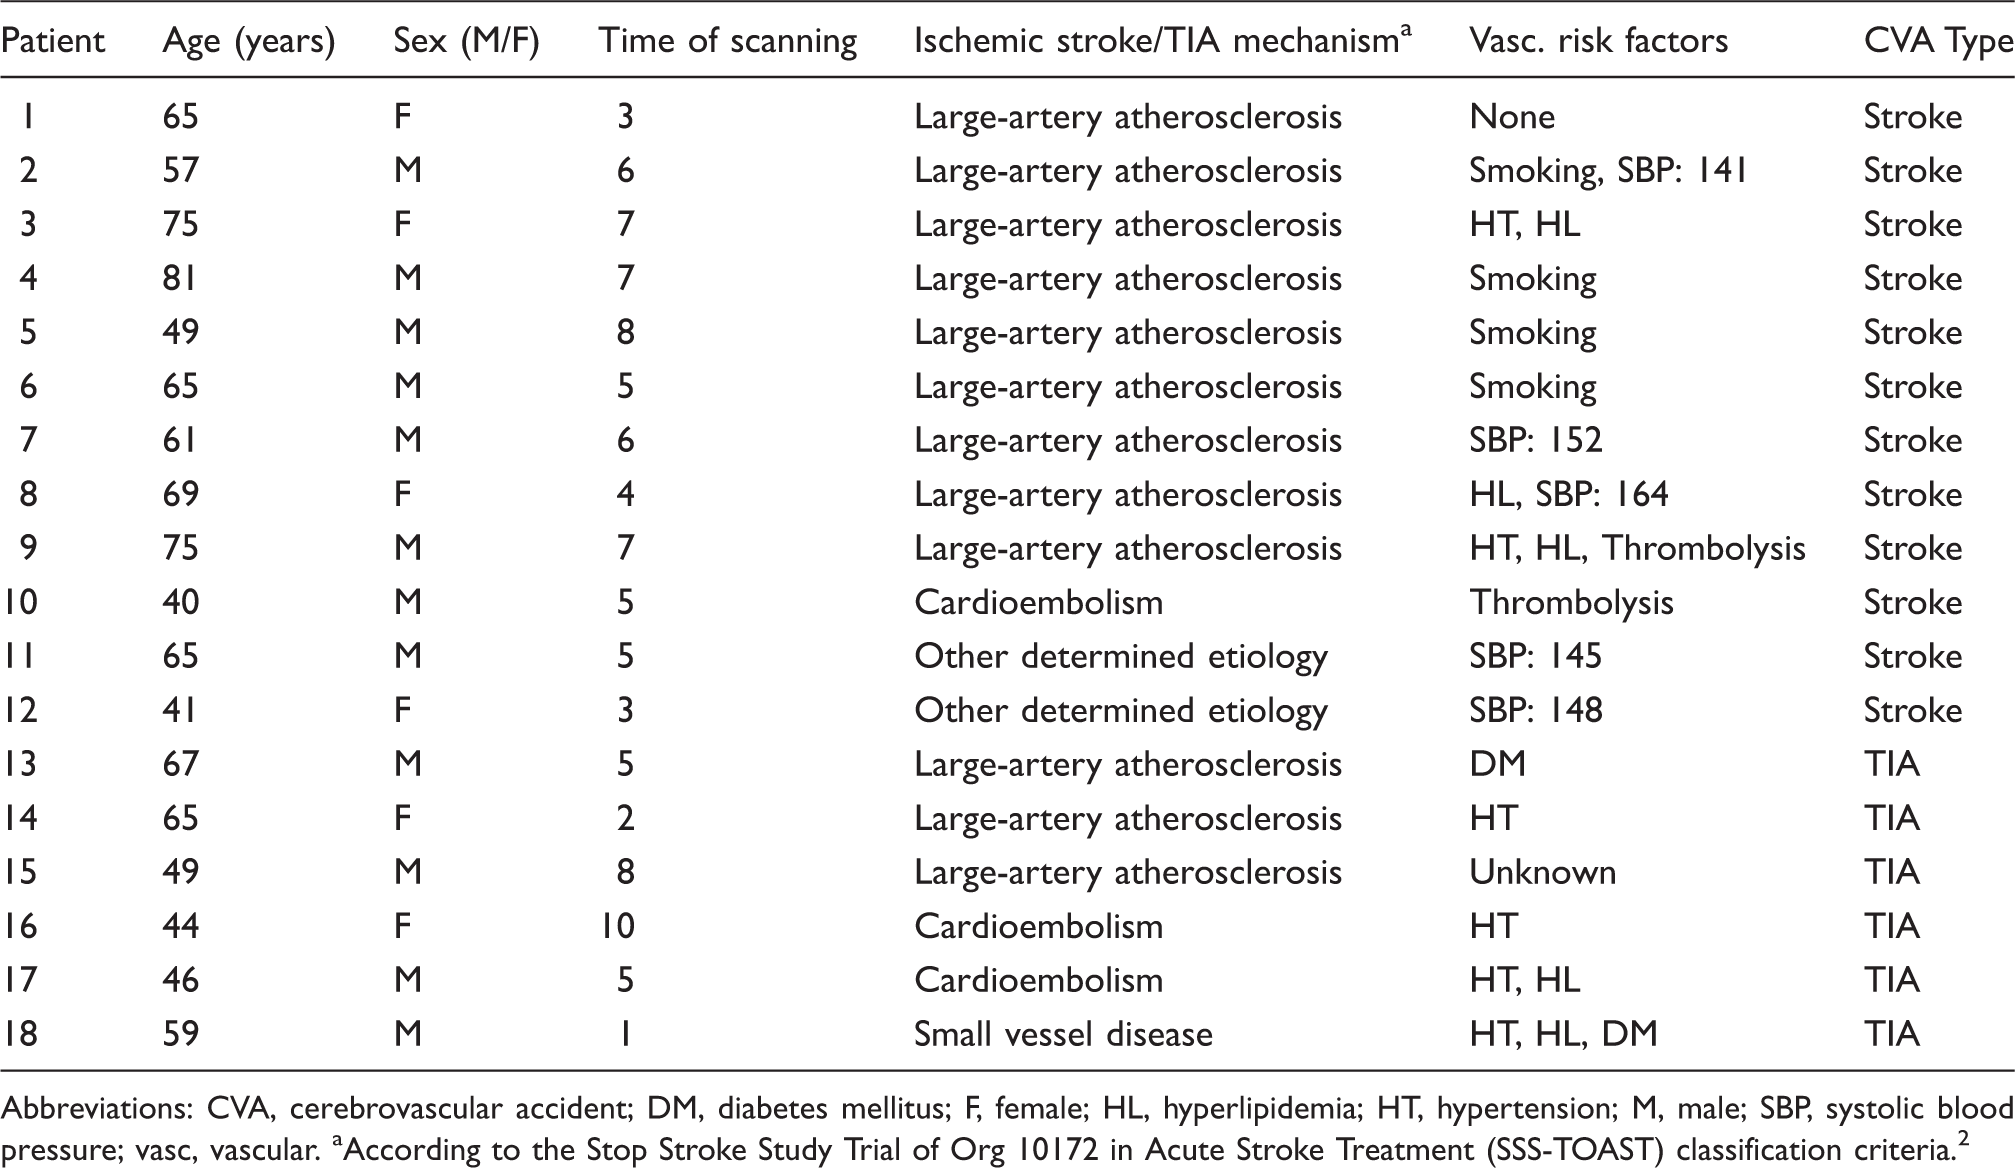
Abbreviations: CVA, cerebrovascular accident; DM, diabetes mellitus; F, female; HL, hyperlipidemia; HT, hypertension; M, male; SBP, systolic blood pressure; vasc, vascular.
According to the Stop Stroke Study Trial of Org 10172 in Acute Stroke Treatment (SSS-TOAST) classification criteria. 2
Imaging
MRI was performed on a whole-body 7T MR system (Philips Healthcare, Cleveland, OH, USA) with a 32-channel receive head coil and a two-channel volume transmit/receive head coil for transmission (Nova Medical, Wilmington, MA, USA). The protocol included a T1-weighted Magnetization-Preparation Inversion Recovery Turbo Spin Echo (MPIR-TSE) intracranial vessel wall sequence 10 before, and in 15 cases also after, contrast administration; a T2 -weighted Fluid-Attenuated Inversion Recovery (FLAIR) sequence 11 and a Time-Of-Flight Magnetic Resonance Angiography (TOF-MRA) sequence, both after contrast administration when applicable. The following scan parameters were used: MPIR-TSE sequence as described in detail in Ref 10 ; in brief, the parameters were: field of view (FOV) 250 × 250 × 190 mm3, acquired resolution 0.8 × 0.8 × 0.8 mm3, reconstructed resolution 0.4 × 0.4 × 0.4 mm3 using zero filling, echo train length (TSE factor) 158, repetition time (TR) 3952 ms, inversion time (TI) 1375 ms, echo time (TE) 37 ms, sensitivity encoding factor 6, number of signal averages 2, variable flip angle scheme with low refocusing angles between 12° and 40° to minimize blurring, flip angle 150° with overtipping to compensate for low B1 values especially at the edges, start-up echoes of 10, scan duration 10:40 min; FLAIR sequence, FOV 250 × 250 × 190 mm3, reconstructed resolution 0.4 × 0.4 × 0.4 mm3 using zero filling, acquired resolution 0.8 × 0.8 × 0.8 mm3, TR/TI/TE = 8000/2250/300 ms, scan duration 12:48 min; and TOF-MRA sequence, FOV 190 × 190 × 102 mm3, acquired resolution 0.4 × 0.5 × 0.6 mm3, reconstructed resolution 0.4 × 0.4 × 0.3 mm3, TR/TE = 22/2.4 ms, scan duration 9:30 min.
Before acquisition of the postcontrast MPIR-TSE sequence, 0.1 ml/kg of a gadolinium-containing contrast agent (Gadobutrol, Gadovist 1.0 mmol/ml, Bayer Schering Pharma, Newbury, UK) was administered intravenously, with a 5-min delay between contrast administration and the start of the postcontrast MPIR-TSE scan.
Image analysis
Image analysis was performed with MeVisLab v2.5 (MeVis Medical Solutions AG, Bremen, Germany). ICAS lesions and their characteristics (concentric or eccentric configuration, focal or diffuse thickening, and enhancing or nonenhancing) 12 were scored per vessel segment on the MPIR-TSE images according to the method described by van der Kolk et al. 9 and Swartz et al. 13 An ICAS lesion was defined as either a clear focal or more diffuse thickening of the vessel wall, as compared to the healthy contralateral vessel wall. In case of bilateral lesions, the vessel wall was compared to the vessel wall more proximal or distal to the thickened wall. The presence of both acute and subacute/chronic CMIs and macroinfarcts was assessed on the FLAIR images. The CMIs were also assessed on the T1-weighted MPIR-TSE images to distinguish them from noise or artifacts. Macroinfarcts included lacunar infarcts with a size between 3 and 15 mm, small noncavitated infarcts with a size between 3 and 15 mm, and large infarcts >15 mm. 14 CMIs were defined as hyperintense lesions—with or without a hypointense cavity—on FLAIR images and hypointense lesions on MPIR-TSE images. Each lesion had to be detectable in at least two of the three brain orientations (sagittal, coronal, and transversal), ≤3 mm in size and restricted to the cortex. CMIs were scored according to the method described by van Veluw et al. 8 , with the slight adaptation of using contrast-enhanced FLAIR images. The brain was divided in seven regions: frontal, parietal, occipital, temporal, caudate nucleus, lentiform nucleus, and thalamus. For each of these regions, the presence or absence and, if present, the number macroinfarcts was assessed for both hemispheres. The number of CMIs was only assessed in the cortical regions of the frontal, parietal, occipital, and temporal lobes. Although only patient with a stroke or TIA of the anterior circulation were included in this study, ICAS lesions, macroinfarcts, and CMIs were scored throughout the whole brain to also assess subacute/chronic lesions. Two independent observers (ND and AK), both blinded for clinical data and ICAS lesion location, performed the image analysis (Supplementary Table S1); the dice similarity coefficient (DSC) and the intraclass correlation coefficient (ICC) with 95% confidence intervals (95% CI) were calculated separately for ICAS, CMIs, and macroinfarcts to evaluate interrater reproducibility. 15 In case of disagreement, consensus was reached for every location and these values were used for statistical analyses.
Statistical analysis
IBM SPSS version 20.0 for Windows was used for statistical analysis. First, linear regression analyses were used to assess the relationship between ICAS lesions and infarcts (CMIs and macroinfarcts), for an exploratory approach. Second, logistic regression analyses were performed to evaluate relationships between CMIs/macroinfarcts and upstream ICAS lesions that may have caused the ischemic event. To do so, we first selected the most upstream ICAS lesions (M1 left/right, M1–M2 bifurcation left/right, P1 left/right, P2 left/right, and P1–P2 bifurcation left/right) in an ordinal fashion (absent or present). If two lesions in the same vessel were found in one patient, e.g. M1 left and M1–M2 bifurcation left, those lesions were scored as one (present). Then, we scored possible CMIs or macroinfarcts in the corresponding vascular territory. In that way 72 entries were created [P1/P2/bif (L/R) = 2 options; M1/bif (L/R) = 2 options × 18 patients]. Third, linear regression analyses were used to examine relationships between CMIs, macroinfarcts, ICAS lesions, and calculated ratios of ICAS lesion characteristics. Ratios were calculated for the ICAS lesion characteristics, to enable linear regression analysis. The ratios were defined as follows: number of concentric lesions/total number of lesions; number of diffuse lesions/total number of lesions; and number of enhancing lesions/total number of lesions. Fourth, logistic regression analyses were used to assess the relationship between ICAS lesions, infarcts (CMIs and macroinfarcts) and type of cerebrovascular accident (history of stroke/TIA: event that led to the inclusion), again for an exploratory approach. Statistical significance was set at p < 0.05 and standardized Beta coefficients (β) are given where appropriate.
Results
Subjects
Between August 2011 and March 2014, 25 patients were included in the IVI study. Seven patients were excluded from analysis: in one patient, motion artifacts made the data unsuitable for image analysis; of five patients no precontrast MPIR-TSE- or FLAIR sequence was obtained; and one patient was ultimately diagnosed with migraine. The remaining 18 patients, (6 females; mean age 59 years, range 40–81 years) with a TIA (n = 6) or ischemic stroke (n = 12) of the anterior cerebral circulation, underwent 7T imaging at a median time of 5 days after symptom onset (range 1–10 days). Of these patients, 67% had ischemic stroke or TIA based on (TOAST classification) large-artery atherosclerosis, 17% had a cardioembolic cause, 1 patient had small artery disease, and two patients had another determined cause (bortezomib (V), thalidomide (T) and dexamethasone (D) VTD therapy; and dissection of the internal carotid artery). Baseline characteristics are presented in Table 1.
ICAS lesion location, CMIs, and macroinfarcts
Magnetic resonance imaging findings in the studied population.
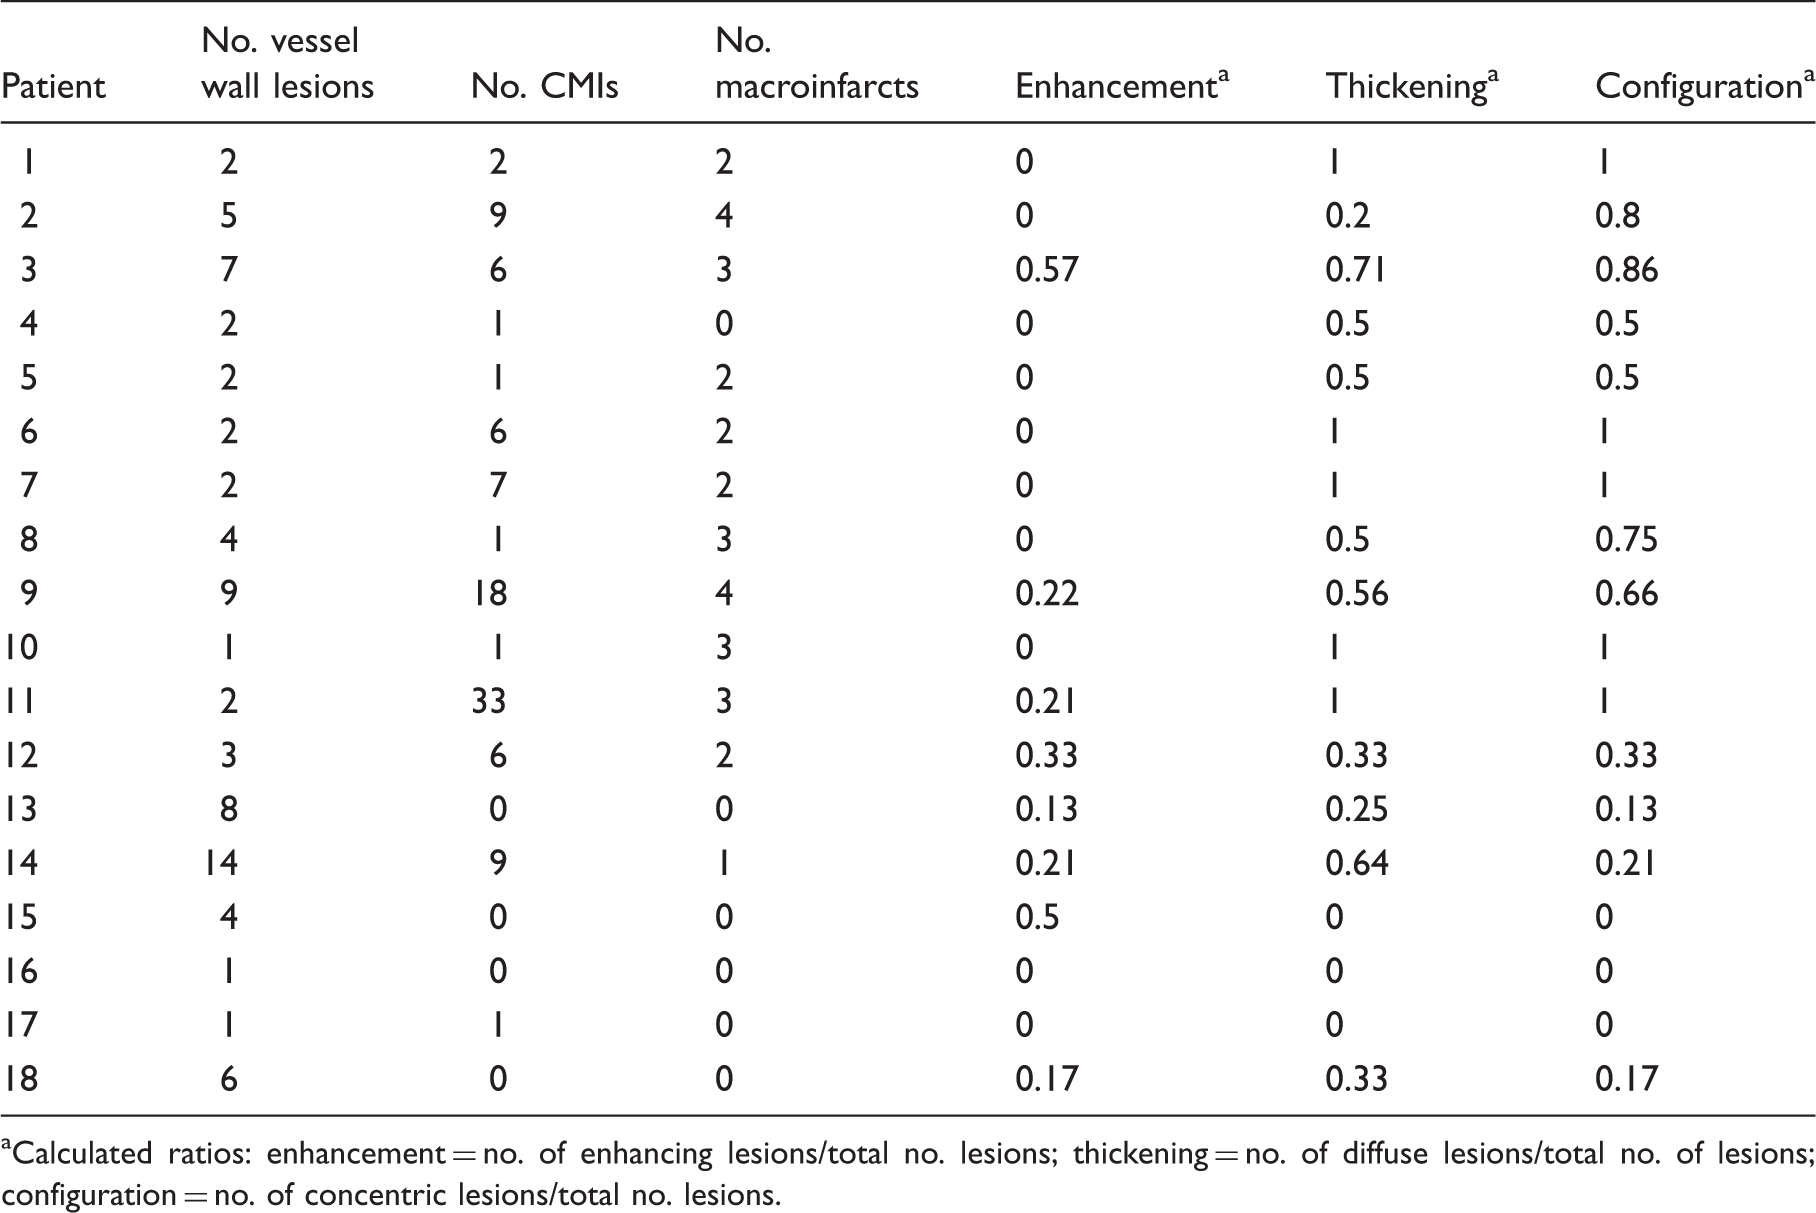
Calculated ratios: enhancement = no. of enhancing lesions/total no. lesions; thickening = no. of diffuse lesions/total no. of lesions; configuration = no. of concentric lesions/total no. lesions.
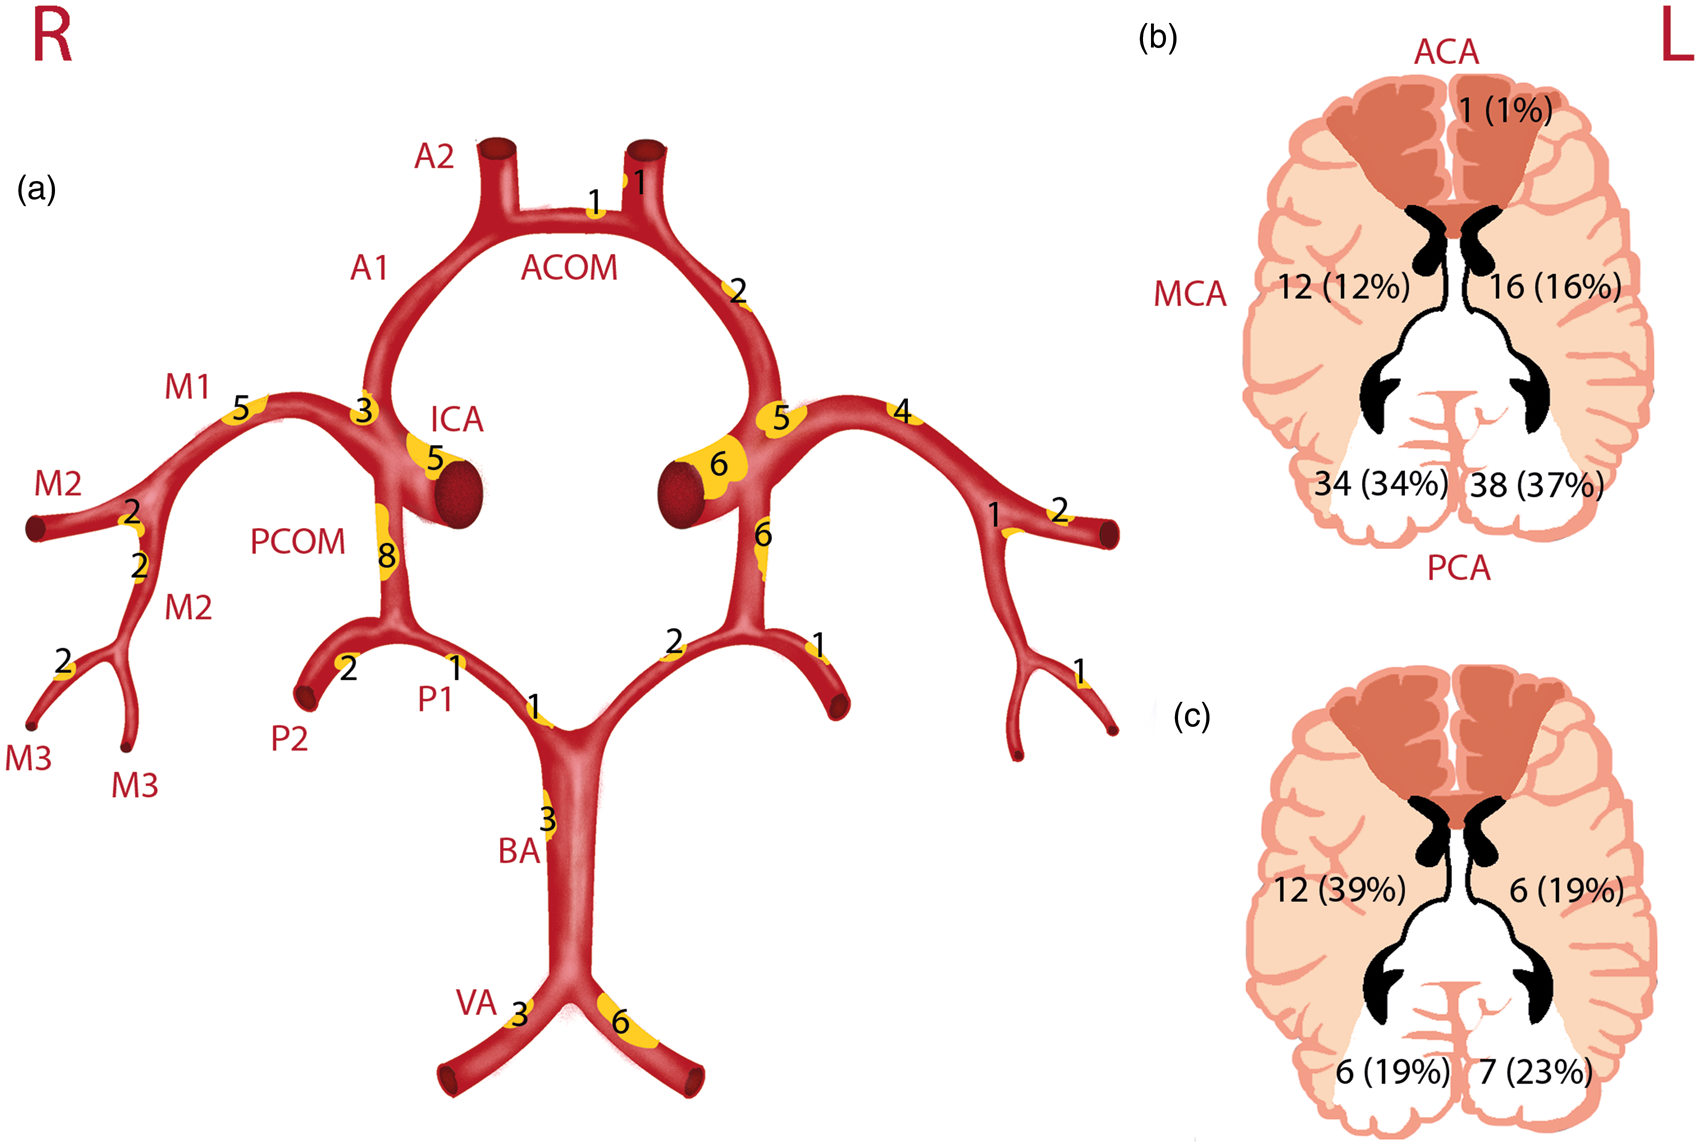
Schematic drawing of the Circle of Willis and its branches, with ICAS lesion load and locations illustrated by means of yellow plaques (a); the CMI burden (b); and the macroinfarct burden (c) as found in the studied population. In (a) a larger plaque indicates a larger lesion load within the specific artery segment as compared to the other segments, with corresponding numbers of lesions. PCOM lesions are mainly collapsed vessels; in (b and c) numbers indicate the amount and percentages of CMIs and macroinfarcts, respectively, found in that specific vascular territory. Abbreviations in (a) A1 and A2: first and second segment of the ACA; ACOM: anterior communicating artery; BA: basilar artery; ICA: internal carotid artery; M1, M2, and M3: first, second and third segment of the MCA; PCOM: posterior communicating artery; P1 and P2: first and second segment of the PCA; VA: vertebral artery. In (b) ACA: anterior cerebral artery territory; MCA: middle cerebral artery territory; PCA: posterior cerebral artery territory.
ICAS lesion type in relation to CMIs and macroinfarcts
In patients with macroinfarcts, we found more concentric (β = 0.7740, p < 0.001) and diffuse (β = 0.510, p < 0.05) ICAS lesions compared with patients without macroinfarcts. In patients with CMIs, slightly more concentric (β = 0.419, p = 0.08) and diffuse lesions (β = 0.407, p = 0.09) were found in these patients as compared to patients without CMIs. ICAS lesion enhancement did not show any relationship with the CMIs/macroinfarcts. Examples are given in Figures 3 and 4. Macroinfarcts were positively correlated (p < 0.05) to history of stroke, but CMIs and ICAS lesions were not. ICAS lesions and CMIs/macroinfarcts were not related to history of TIA.
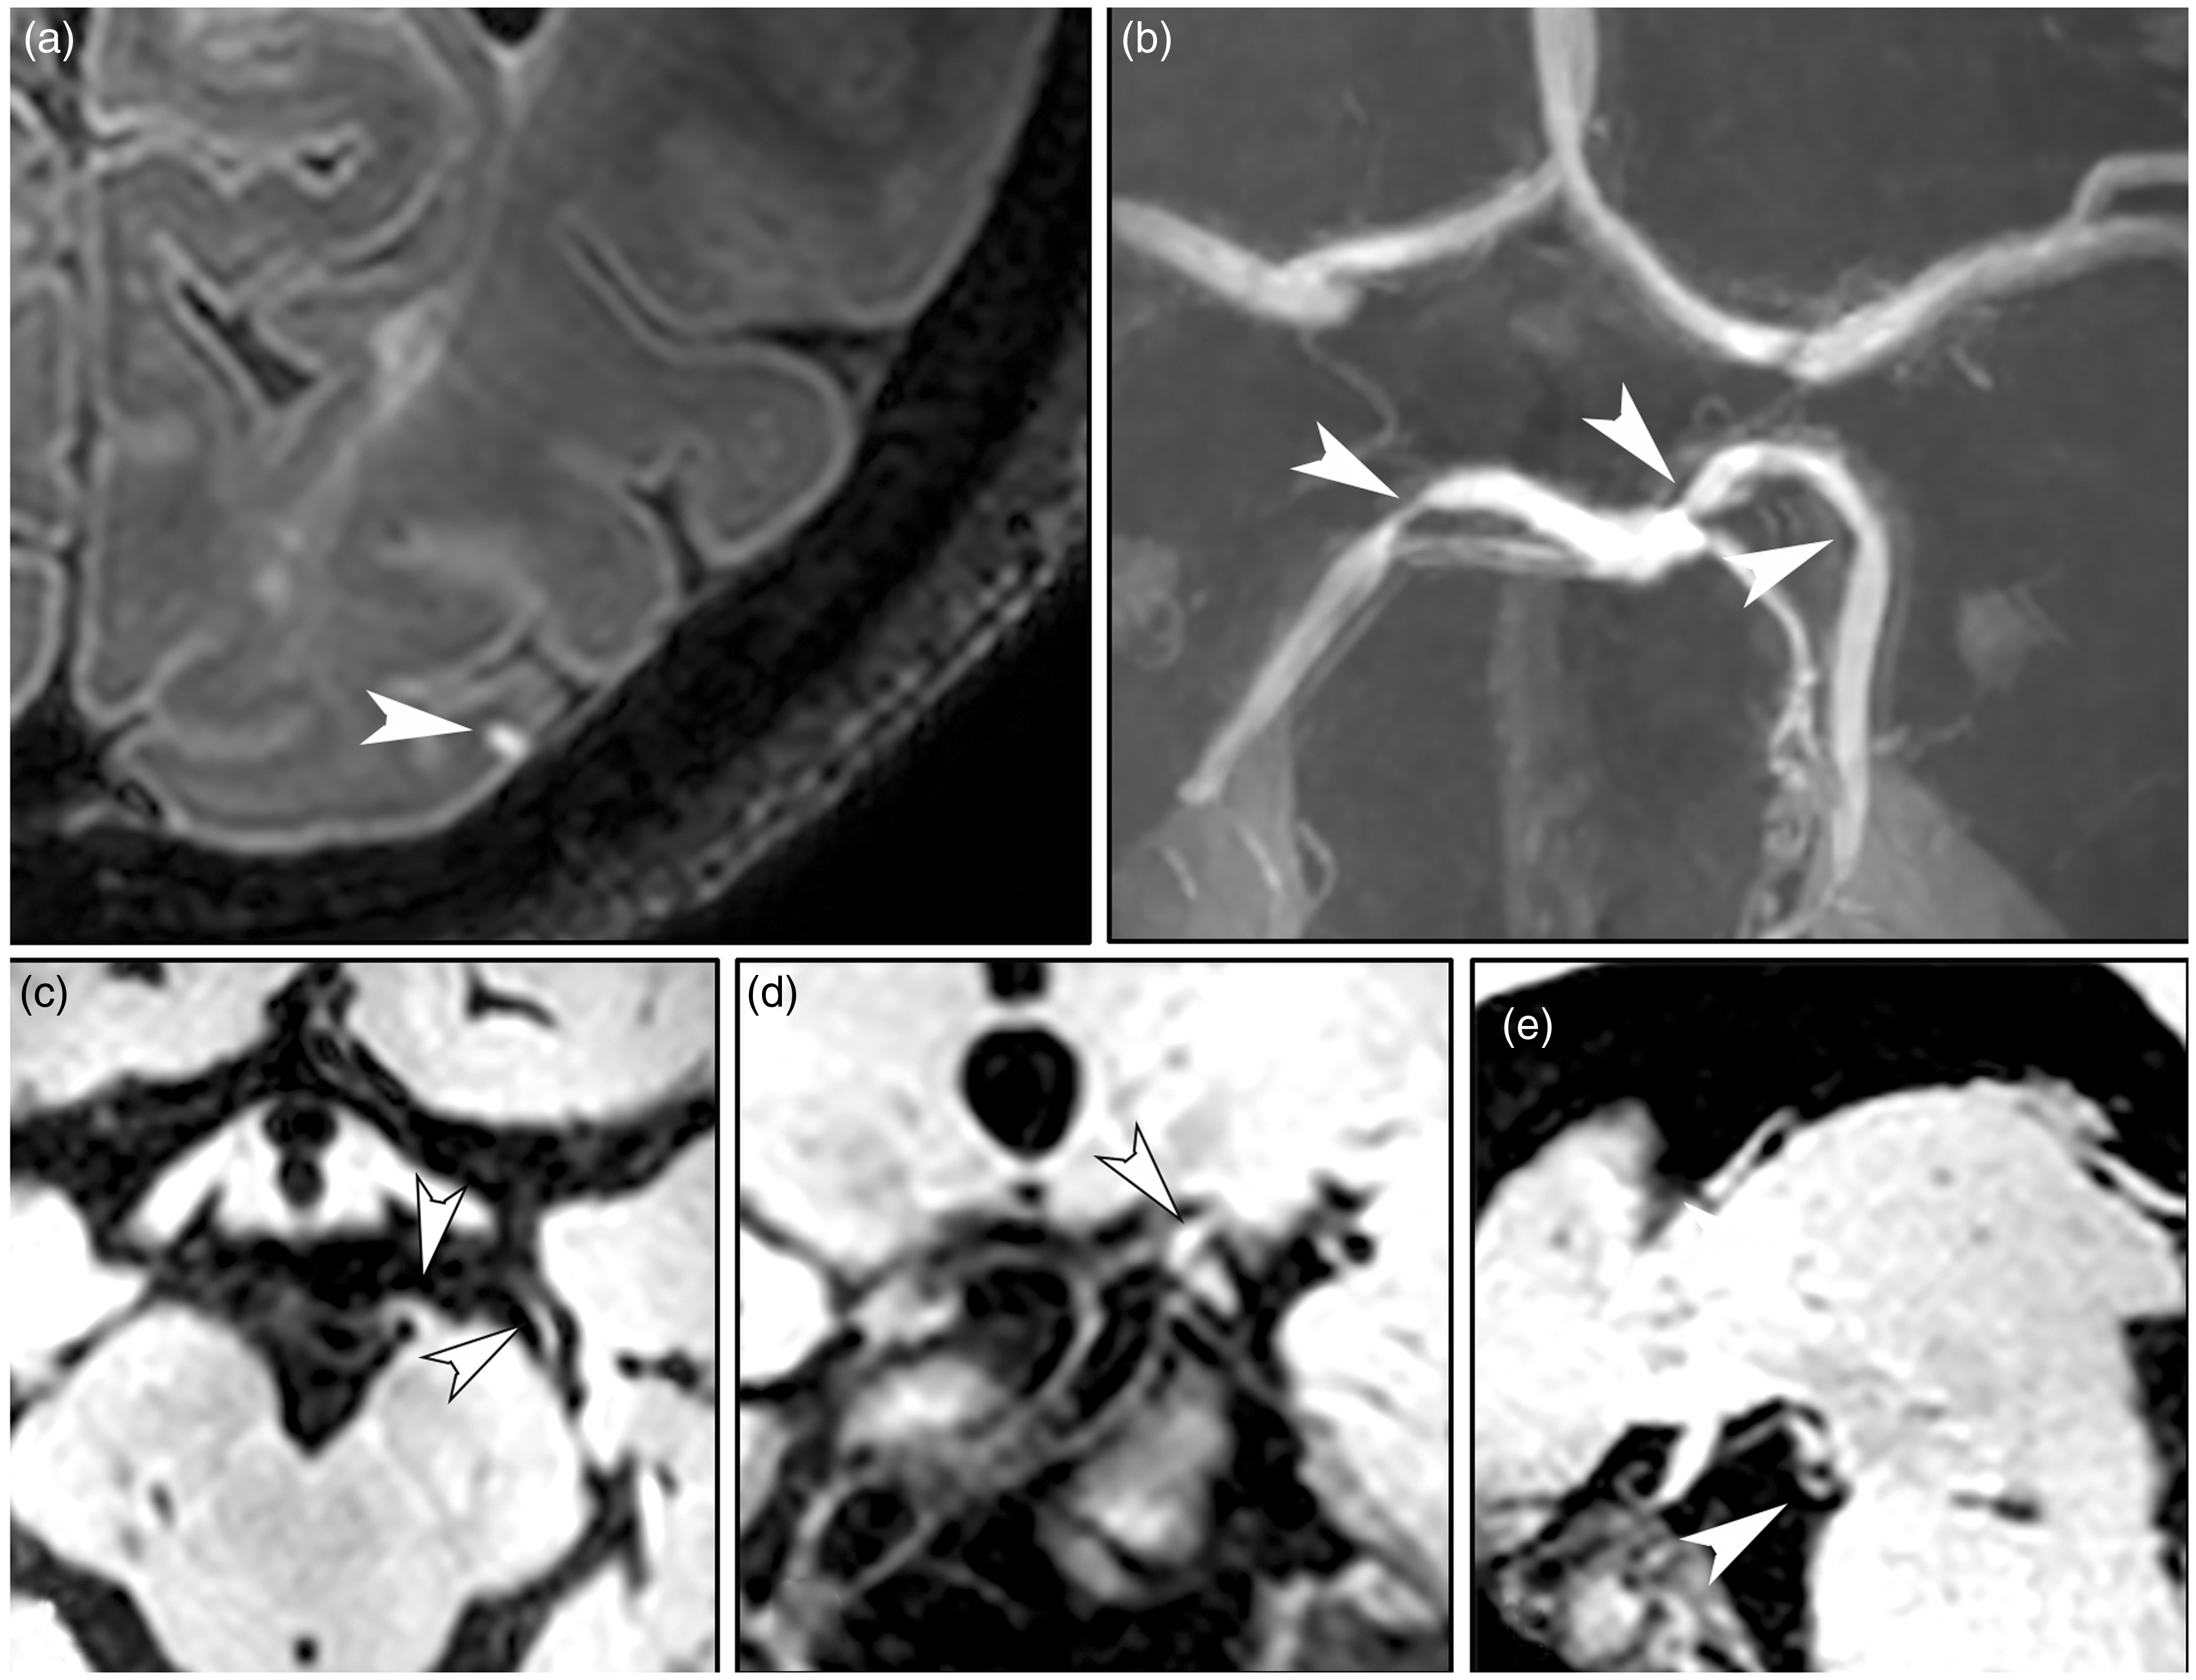
A 75-year-old female patient (no. 3 in Tables) presented with ischemic stroke of the right middle cerebral artery (MCA) territory. (a) Transverse 7T T2-weighted Fluid-Attenuated Inversion Recovery image shows an infarct of the right MCA territory and three cortical microinfarcts (white arrowheads); (b) shows a zoomed view of the box drawn in (a). (c–e) Transverse 7T T1-weighted magnetization-preparation inversion recovery turbo spin echo images before (c and d) and after contrast administration (e) show thickening of the right M1 (c) and M2 (d) segments of the MCA, and enhancement of the M2 vessel wall segment after contrast administration (e) (black arrowheads). A 65-year-old female (no. 14 in Tables) presented with a transient ischemic attack of the left hemisphere. (a) Transverse 7T T2-weighted Fluid-Attenuated Inversion Recovery image shows a cortical microinfarct of the left posterior cerebral artery (PCA) (white arrowhead); (b) Time-of-Flight magnetic resonance angiography demonstrates three stenoses of the left and right PCA (white arrowheads), corresponding to atherosclerotic lesions at these locations as is shown on the magnetization-preparation inversion recovery turbo spin echo images in three different anatomical planes: (c) transverse, (d) coronal, and (e) sagittal.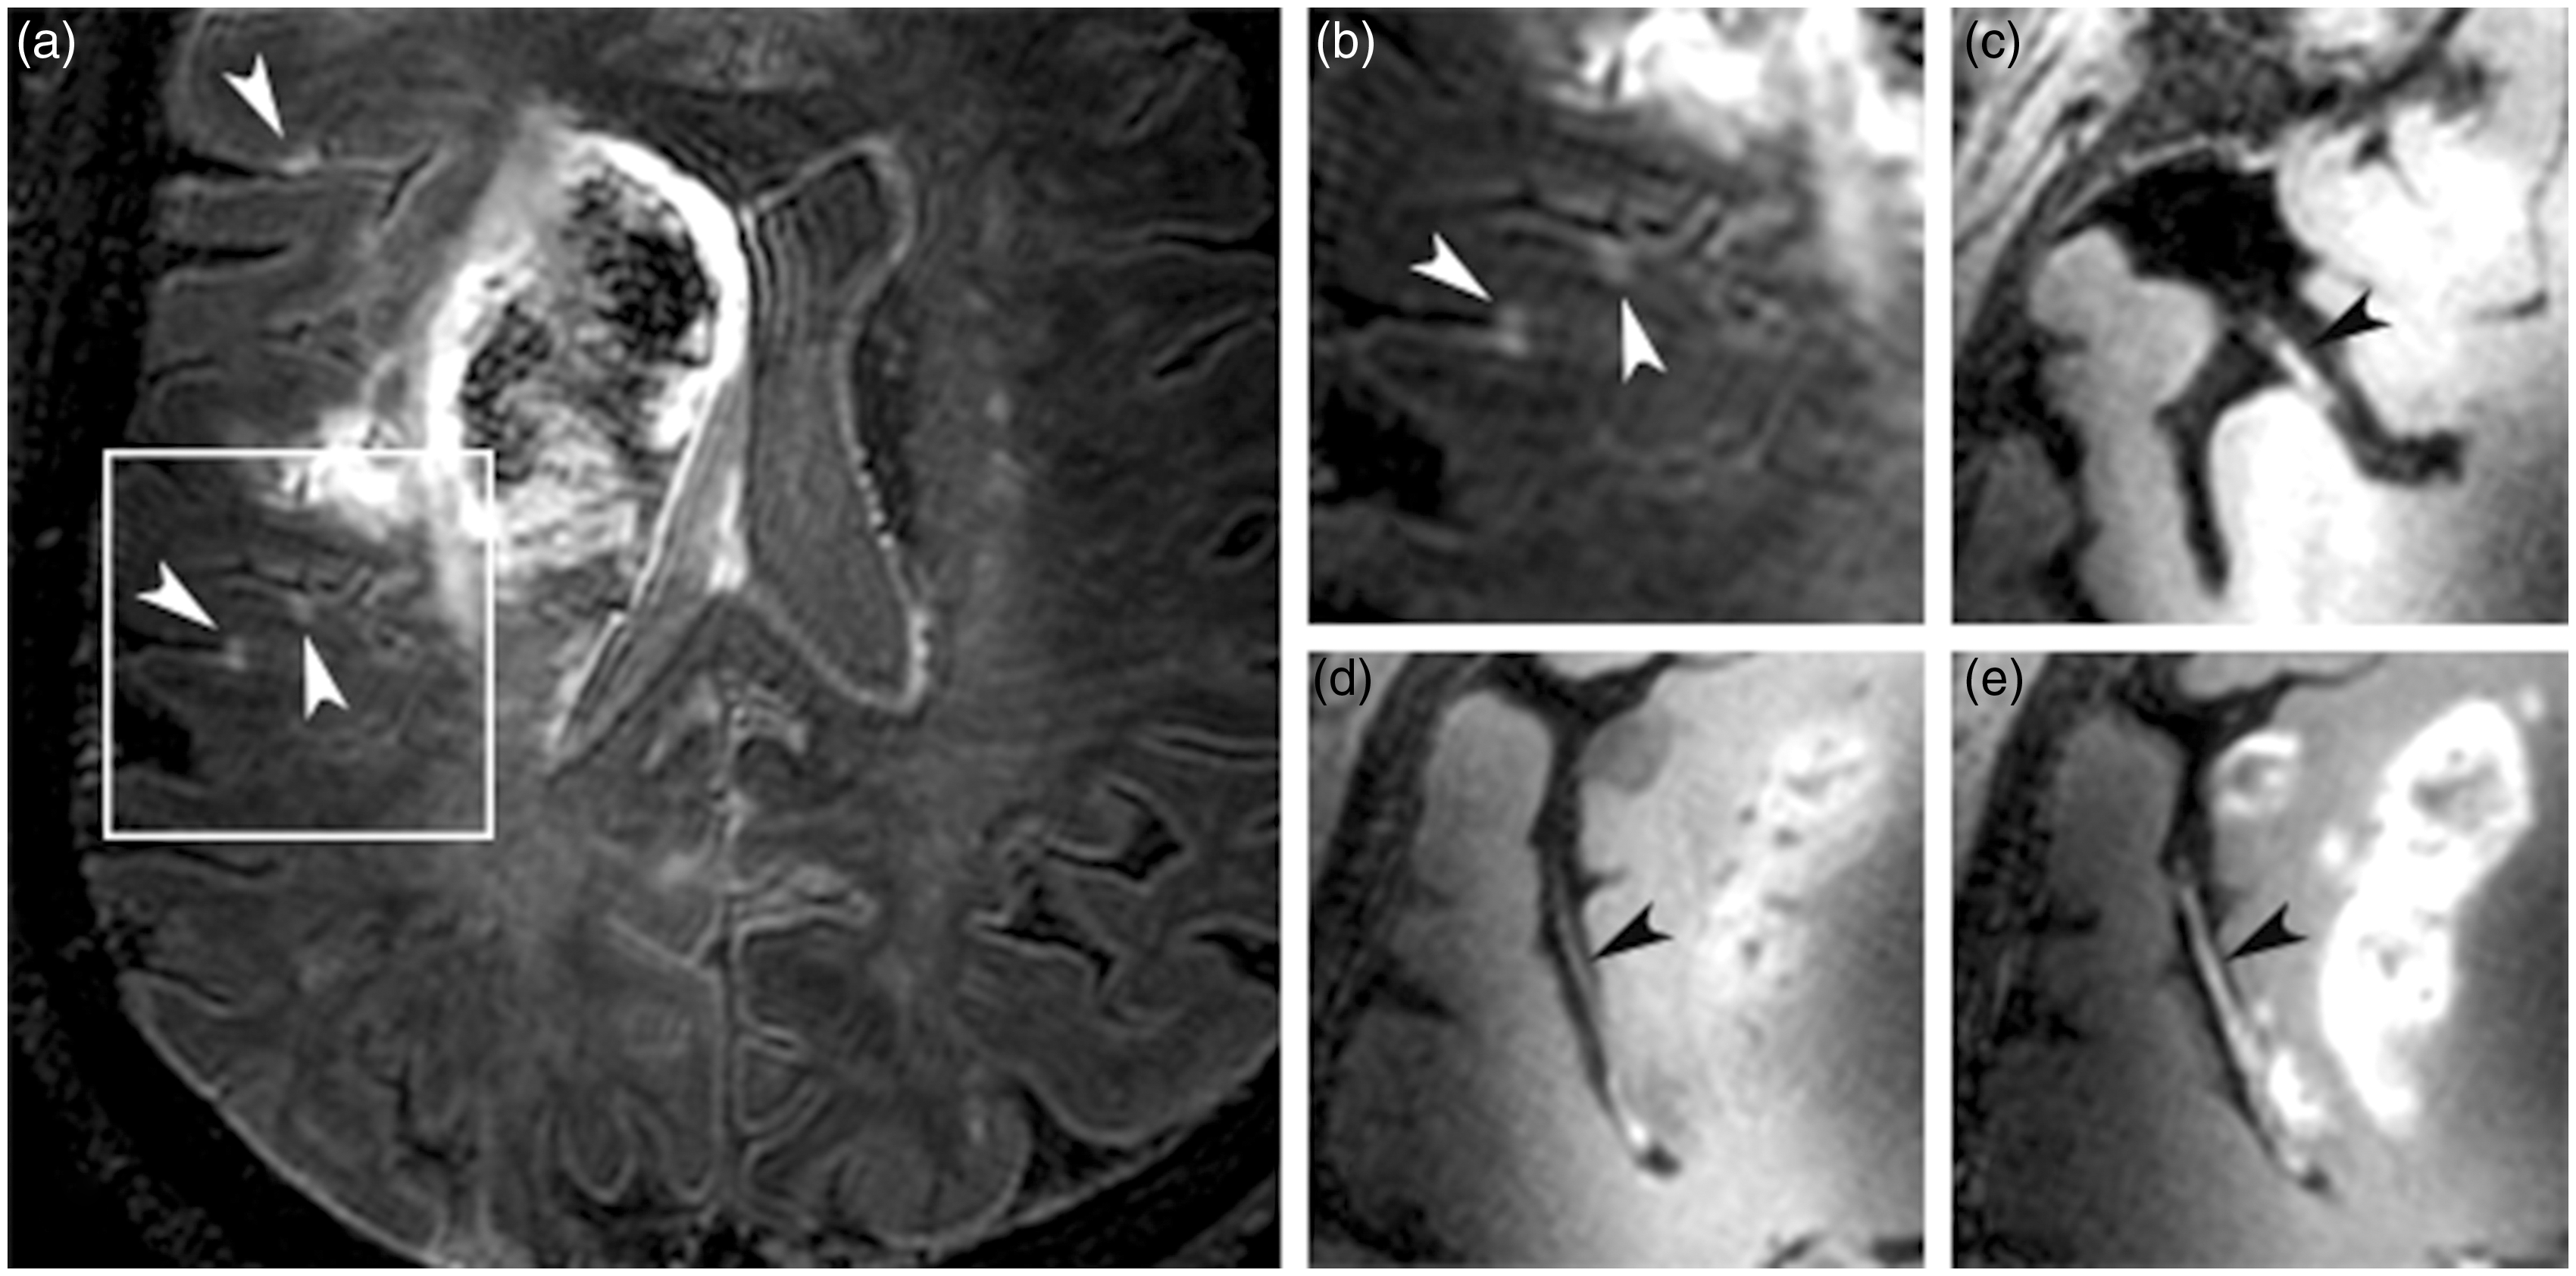
Discussion
The current study is the first to combine the assessment of ICAS lesion presence, location, and type with the occurrence of CMIs and macroinfarcts. Our results demonstrate a relationship between specific ICAS types (concentric/diffuse) and macroinfarcts but not CMIs. Furthermore, a high prevalence of brain tissue lesions, both macroinfarcts and CMIs, were found in patients with ICAS.
Previous studies have reported that microembolism, originating from unstable atherosclerotic plaques, is the main cause of distally located infarcts.16,17 Proof for this comes from research in macaques where microbeads were injected in the internal carotid artery and followed over time. After injection, these microbeads preferably migrated to the downstream vessels feeding the cortex and border zone areas causing multiple microinfarcts. 18 Moreover, Caplan et al. 19 demonstrated that when cerebrovascular reserve is impaired, it affects the ability to clear (micro) emboli, thereby reducing the available blood flow and subsequently increasing infarct formation in regions that are blocked by the microembolus, with again, the cortex and border zone regions as preferred locations. This might suggest that ICAS, both by causing microemboli and by impairment of vascular reserve, may be a cause for microinfarcts. In contrast, in the current study all patients presented with ICAS lesions and no relation was found between ICAS and CMIs. The absence of a relation with CMIs may suggest that in these patients more peripheral atherosclerotic lesions are present that are still under the detection limit of our current vessel wall sequence. The microemboli may then lodge at the site of the atherosclerotic lesion, causing a CMI. Furthermore, as Figure 2 nicely illustrates, assessing the causal relation between CMIs/macroinfarcts and upstream ICAS lesions is very hard because multiple lesions may be found in the same vessel. Another explanation may be the relatively small sample size, which may limit available power for testing.
Blood flow impairment, or altered cerebrovascular reserve, is also estimated by stenosis severity, and decreases rapidly when a stenosis grade greater than 50% is reached. 20 These measurements do, however, not take into account the length of the lesion or geometry, both influencing the physiological effect of the stenosis. 21 Taking these anatomical characteristics into account even better predict flow reserve, where a longer lesion length corresponds to a greater reduction in relative perfusion reserve. 22 These lesions block blood supply to a larger amount of branches and distal vessels compared to lesions with a shorter length 23 These results are in line with our finding that diffuse thickening of ICAS lesions is related to macroinfarcts and to a lesser extent to CMIs. Diffuse lesions are here classified as lesions that cover a larger area of the vessel (segment) (Figure 3) compared to focal lesions (Figure 4). Although not quantitatively measured, these results suggest that lesion length is not only important for extracranial arteries 24 but also for the intracranial arteries. On the other hand, some focal lesions represent more advanced atherosclerotic lesions, 25 corresponding to a higher stenosis grade, and can in that case also cause significant blood flow disturbances. Whether higher stenosis grade or lesion length is the main factor responsible for infarcts remains to be elucidated.
For the extracranial arteries, enhancement is thought to be related to plaque vulnerability. Moreover, enhancement of an intracranial plaque is suggested to be related to the presence of vasa vasorum or inflammation of the plaque. However, in the present study we have shown that other specific lesion characteristics (concentric/diffuse) are related to the presence of macroinfarcts where enhancement is not. Therefore, potentially intracranial lesion enhancement itself is not a major risk factor for parenchymal damage. Furthermore, plaque characteristics, such as intraplaque hemorrhage, have been found strong predictors of recurrent stroke risk for the extracranial arteries. In the current study, no methods were used to detect intraplaque hemorrhage. At lower MRI field strengths, the possibility to detect intraplaque hemorrhage has been shown in case examples, however, the prevalence of intraplaque hemorrhage for intracranial plaques may be much lower compared to extracranial carotid plaques. 26
Strengths of our study include the combined depiction of ICAS presence, location and type, and CMIs, and macroinfarcts. Ultra-high field MRI was used to image both small subtle changes of the intracranial vessel wall and CMIs with high signal-to-noise (SNR) (2–3-fold increase as compared to 3T) and contrast-to-noise ratios. Seven tesla yields higher SNR as compared to 3T, this higher SNR can be traded for a higher spatial resolution, shorter scan time or a combination of both, but scanning at 7T also inherits some limitations like increased specific absorption rate (SAR) and inhomogeneous B1 field.27,28 As described in previous work (Refs9–11), the sequences that were used in the current study have been designed to yield high image quality, despite the limitations in SAR and B1 homogeneity. Because of the higher SNR we were able to image up to an isotropic spatial resolution of 0.8 mm, enabling the detection of CMIs ≥0.8 mm,8,29 compared with a general resolution of 1.1 × 1.1 × 1.2 mm3 used in most 3T MRI studies. 30 This also leads to the first limitation of this study, since we are still only able to image the “larger” CMIs. Therefore, the CMIs found in the current study are only a reflection of the total ischemic burden caused by CMIs. This may also be a possible explanation for the absence of relationships with CMIs. Yet another explanation may be the limited coverage of the vessel wall sequence (brain only). We do not know whether other lesions outside the brain may have contributed to the observed infarcts and whether the ICAS we observe are innocent bystanders seen in older subjects with vascular risk factors. 31 Furthermore, the number of CMIs ranged from 0 to 33 in our patient group, which is in accordance with the results from histopathological studies. 32 It is noteworthy to mention that histopathological studies sample only a very small portion of the brain. Observing 1 or 2 microinfarcts in nine routine neuropathological specimens implies the presence of ∼500 or 1000 microinfarcts throughout the brain. 33 Whereas histopathology assesses the entire size range of CMIs in a small fraction of the brain, the in vivo assessment with 7T MRI assesses the small fraction of large CMIs, in the entire brain. Given the similar numbers found by both approaches, it is tempting to suggest that the in vivo assessment might provide similar sensitivity as histopathology, while it has the clear advantage of early assessment, prior to death. Moreover, we demonstrate a higher load of CMIs in patients with a cerebrovascular history compared to previous published reports on elderly people and people with dementia, suggesting that, even though we cannot image the total burden, these CMIs are clinically meaningful. This higher load of CMIs in patients with ICAS is striking. However, we do not know whether in patients without ICAS lesions lower lesion load is found, since all patients were presented with ICAS lesions. Second, we do not have a healthy control group to compare with. In the future, a direct comparison with a healthy control group would be beneficial to broaden knowledge on the spectrum of parenchymal damage caused by ICAS. Third, this study does not provide direct information about the mechanisms underlying CMIs. The question arises whether CMIs are indeed the consequence of microemboli and altered cerebrovascular reserve as caused by ICAS. To answer this question, cerebral blood flow responses can be measured, before and after a vasodilatory challenge to investigate the role of cerebrovascular reserve capacity on the presence of CMIs in patients with ICAS. 34
We have demonstrated correlations between specific intracranial atherosclerotic lesion types and macroinfarcts. Our results were not significant for the relation between ICAS and CMIs. However, we do demonstrate a high burden of CMIs in patients with TIA and ischemic stroke who also present with intracranial atherosclerotic lesions. Since autopsy studies have pointed to the relevance of CMIs in cognitive dysfunction, CMIs in combination with ICAS may open a window to anticipate in the disease process early on as well as provide information on cognitive decline, even when large damage has not happened yet.
Footnotes
Funding
The study was supported by the Netherlands Organization for Scientific Research (NWO) under grant 91712322. J.J.M.Z. has received funding from the European Research Council under the European Union's Seventh Framework Programme (FP7/2007-2013)/ERC grant agreement n°337333.
Acknowledgements
We greatly acknowledge the use of MeVisLab (MeVis Medical Solutions AG, Bremen, Germany). The developed software will be made freely available to research partners. Dr. Hugo Kuijf developed in-house MeVisLab scripts used in this study.
Declaration of conflicting interests
Fredy Visser is an employee of Philips Healthcare, Best, the Netherlands.
Authors’ contributions
N.D.: Literature search, figures, study design, data collection, data analysis, data interpretation, and writing. A.G.K.: data collection, study design, data analysis, data interpretation, and critically reviewed the manuscript. J.J.M.Z.: data interpretation, MRI sequence development, and critically reviewed the manuscript. M.B. and A.A.H.: data collection and critically reviewed the manuscript. G.J.B.: data analysis, data interpretation, study design, and critically reviewed the manuscript. F.V.: MRI sequence development and critically reviewed the manuscript. P.R.L.: critically reviewed the manuscript. J.H.: study design, data interpretation, data analysis, and critically reviewed the manuscript.
References
Supplementary Material
Please find the following supplemental material available below.
For Open Access articles published under a Creative Commons License, all supplemental material carries the same license as the article it is associated with.
For non-Open Access articles published, all supplemental material carries a non-exclusive license, and permission requests for re-use of supplemental material or any part of supplemental material shall be sent directly to the copyright owner as specified in the copyright notice associated with the article.